Latitude Margaritaville Real Estate Market Report
Local Market Update – November 2021 2021 Local Market Update – November A Research Tool Provided by the Multiple Listing Service of A Research Tool by Area the Multiple Listing Service of Hilton Head Island and theProvided Hilton Head Association of REALTORS®
Local Market Update – November 2021 Real Estate Market Report Latitude Margaritaville | November 2021 Latitude Margaritaville Local Market Update – November 2021 Latitude Margaritaville Local Market Update – November 2021 Hilton Head Island and the Hilton Head Area Association of REALTORS®
A Research Tool Provided by the Multiple Listing Service of Hilton Head Island and the Hilton Head Area Association of REALTORS®
A Research Tool Provided by the Multiple Listing Service of Hilton Head
Latitude Margaritaville
A Research Provided theArea Multiple ListingofService of Island Tool and the Hilton by Head Association REALTORS® A Research the Multiple Listing ServiceofofREALTORS® Hilton Head Island andTool theProvided Hilton by Head Area Association
Hilton Head Island and the Hilton Head Area Association of REALTORS® Local Market Update – November 2021
November
Year to Date
A Research Tool Provided by the Multiple Listing Service of Hilton Head Island and the Hilton Head Area Association of REALTORS®
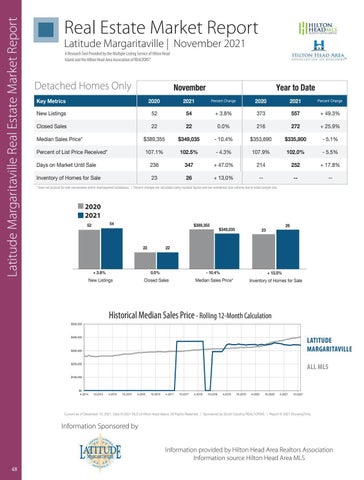
Detached Homes Margaritaville Only2020 2021 November Latitude
Latitude Margaritaville Latitude Margaritaville
Key Metrics
2020
2021
373 Percent Change
557 2020
Percent Change
New Listings Key Metrics
52
2020 54
22
22
Key Metrics
Closed Sales New Listings
52
New Listings
+ 3.8% 2021
2020
540.0%
Percent Change
November November
2021
216 + 3.8%
54
52
+ 2021 49.3%
2020
Percent Change
272 373
Year to Date Percent Change
+ 25.9% 557
2021
$389,355 Closed Sales
Key Metrics Key Metrics
2020 2020
373+ 49.3% 557
+ 3.8%
Year to DateYear to Date
- 10.4% 22
$353,690 220.0%
2021 2021 Percent Change 2020 Percent Change
* Does not account for sale concessions and/or downpayment assistance. calculated using rounded figures can sometimes + look extreme Inventory of Homes Sale Until 23 + are 13.0% --and252 -26 | Percent+changes -- due to small sample size. Daysfor on Market Sale 236 47.0% 214 17.8% 347
107.1%
102.5%
- 4.3%
107.9%
102.0%
Days on Market Until Sale
236
347
+ 47.0%
214
252
54Inventory of Homes for Sale
23
Percent of List Price Received*
Days on Market Until Sale 236 + 47.0% 214 347 November * Does not account for sale concessions and/or downpayment assistance. | Percent changes are calculated using rounded figures and can sometimes look extreme due to small sample size. Inventory of Homes for Sale 23 + 13.0% -26 --
November Inventory* Does of notHomes Sale 13.0% 26 account for salefor concessions and/or downpayment assistance. | Percent changes 23 are calculated using rounded figures and can sometimes look + extreme due to small sample size.
52
--
- 5.5%
2020 252 2021 -+ 17.8% --
+ 13.0% -26 -$389,355 * Does not account for sale concessions and/or downpayment assistance. | Percent changes are calculated using rounded figures and can sometimes look extreme due to small sample size. $349,035 23 2020 54 * Does not account for sale concessions and/or downpayment assistance. | Percent changes are calculated using rounded figures and can sometimes look extreme due to small sample size. 52 $389,355
November
November
2021 November 54 November
52
54
52
52
52
22
$389,355 $389,355
22
54 54
23
$349,035 $349,035
23
22
+ 3.8%
0.0%
New Listings
Closed Sales
22
22
22
22 + 3.8%
22
- 10.4%
Closed SalesSales Closed
$500,000
Median Sales Price* - 10.4%
- 10.4%
Inventory of Homes for Sale + 13.0%
+ 13.0%
10.4% + 13.0% Median Sales-Price* for Sale Rolling 12-Month CalculationInventory of Homes All MLS —
Median Sales Price* Median Sales Price*
Inventory Sale Inventoryof ofHomes Homes for for Sale
All MLS — All MLS — Latitude Margaritaville —
$400,000
Latitude Margaritaville —
$400,000
LATITUDE MARGARITAVILLE
$300,000
$300,000 $300,000
A Latitude Margari
Latitude Margaritaville — All MLS — Latitude Margaritaville — All MLS — Latitude Margaritaville —
$500,000
$400,000
Inventory of Home
+ 13.0%
Historical Median Rolling 12-Month Calculation Historical Median Sales Price - Rolling 12-Month Calculation Historical Median SalesSales PricePrice Rolling 12-Month Calculation
$200,000$400,000
+ 13.0%
Median Sales Price*
- 10.4%
$400,000
$300,000$500,000
26
23
Inventory of Homes for Sale
0.0%
Closed Sales
$500,000
$400,000
2021
26
Median Sales Price*
Historical Median Sales Price Rolling 12-Month Calculation Historical Median Sales Price Rolling 12-Month Calculation $500,000
$500,000
2020
26
2021
+ 13.0%
Closed 0.0%Sales
New Listings New Listings
2021 23
23
- 10.4%
22
0.0%
New Listings + 3.8%
2020 2020$349,035 2021
26
20
--
22
New Listings
+ 3.8%
+ 17.8%
26 --
2020
$349,035 $349,035
22 22 $389,355 $389,355
+ 3.8% + 3.8% 0.0%0.0% Historical Median Sales Rolling 12-Month Calculation NewPrice Listings Closed Sales Historical Median Sales Price
$200,000
$200,000
$300,000
$200,000
$100,000
$100,000
$300,000 $200,000
ALL MLS
$100,000
$100,000
$0
$0
4-2014 4-2015 10-201510-2017 4-2016 4-2014 10-2014 4-2015 10-201510-2014 4-2016 10-2016 4-2017 4-2018 10-2016 10-2018 $0 $0 $200,000 10-2014 4-2014 10-2015 4-2017 10-2016 10-20174-20174-2018 4-2019 10-2014 4-2016 4-2015 10-2016 10-2015 4-2016 10-2017 10-2018 4-2018 10-2018 $100,000 4-2015 4-2014
$100,000
$0 4-2014
4-2017 4-2019
10-20174-20204-2018 10-2019 10-2020 10-2018 4-2021
10-201910-2019 4-2020 4-2019 4-2020 10-2020 10-2020
4-2021 4-2021
4-2019 10-2021
10-2019
4-2020
10-2020
4-20
10-2021 10-2021
Current as of December 10, 2021. Data © 2021 of Hilton Head10, Island. All Rights | Sponsored by South | Report © 2021 ShowingTime. Current asMLS of December 2021. Data Reserved. © 2021 MLS of Hilton HeadCarolina Island.REALTORS®. All Rights Reserved. | Sponsored by South Carolina REALTORS®. | Report © 2 $0 Current as of December 10, 2021. Data © 2021 MLS of Hilton Head Island. All Rights Reserved. | Sponsored by South Carolina REALTORS®. | Report © 2021 ShowingTime. 4-2014 as of10-2014 4-2015 10-2015 4-2016 10-2016 4-2017 10-2017 | Sponsored 4-2018 by10-2018 4-2019 10-2019 4-2020 10-2020 4-2021 10-2021 Current December 10, 2021. Data © 2021 MLS of Hilton Head Island. All Rights Reserved. South Carolina REALTORS®. | Report © 2021 ShowingTime.
Information Sponsored by 10-2014
4-2015 Current 10-2015 4-2016 10-2016 4-2017 10-2017 4-2018 10-2019 4-2020 10-2020 4-2021 10-2021 as of December 10, 2021. Data © 2021 MLS of Hilton Head Island. All Rights10-2018 Reserved. | 4-2019 Sponsored by South Carolina REALTORS®. | Report © 2021 ShowingTime.
Information provided by Hilton Head Area Realtors Association Information source Hilton Head Area MLS
Current as of December 10, 2021. Data © 2021 MLS of Hilton Head Island. All Rights Reserved. | Sponsored by South Carolina REALTORS®. | Report © 2021 ShowingTime.
48
P
5.1% 0.0% - 272 216+ 25.9% 272 22 $335,800 216 Percent Change 2021 Percent Change 2020 2021 November Year to Date Percent of List Price Received* 107.1% - 4.3% $389,355 107.9%$349,035 102.5% 102.0% - 10.4%- 5.5% $353,690 Median Sales Price* New Listings 5252 + 3.8% + 49.3% 54 557 Median Sales Price* $389,355 - 10.4% 373 $353,690 5.1% $335,800 $349,035 $335,800 New Listings 373 +- 49.3% Percent557 Change Key Metrics 2020 2021 54 Percent Change+ 3.8%2020 2021 Days on Market Until Sale 214 216 17.8% 107.9% 347 Percent of 236 List Price Received* 102.5% 252 102.0% Closed Sales 22 0.0% ++25.9% 22+ 47.0% 107.1% 272 - 4.3% New Listings 5222 + 3.8% + 49.3% 54 22 557 Sales 0.0% 373 107.9% 216 +- 25.9% 272 Percent Closed of List Price Received* 107.1% - 4.3% 5.5% 102.5% 102.0% Days on Market 236 214 347 $335,800 252 Median Sales Price* $389,355 - 5.1% $349,035 Inventory of Homes forClosed Sale 23 Until Sale + 13.0% - 10.4% --$353,690 -26 --272 + 47.0% Sales 22 +$335,800 25.9% 22$349,035 0.0% - 10.4%216 Median Sales Price* $389,355 $353,690 - 17.8% 5.1% Days on Market Until Sale 236 + 47.0% 214 + 347 252 * Does not account for sale concessions and/or downpayment | Percent changes are calculated using rounded figures and102.5% can sometimes look extreme size. Percent of Listassistance. Price Received* 107.1% - 4.3% 107.9% - 5.5% 102.0%+ 13.0% Sale 23due to small sample -26 -Median Sales Price*Inventory of Homes for $389,355 - 10.4% $353,690 - 5.1% $349,035 $335,800 Percent of List Price Received* 107.1% - 4.3% 107.9% - 5.5% 102.5% 102.0% Median Sales Sales Price* Closed
22$349,035
Year to Date
November