A Research Tool Provided by the Multiple Listing Service of Hilton Head Island and the Hilton Head Area Association of REALTORS®
Local Market Update – November 2021
Local Market Update – November 2021 Colleton River Real Estate Market Report A Research Tool Provided by the Multiple Listing Service of Hilton Head Island and the Hilton Head Area Association of REALTORS®
Colleton River | November 2021
Colleton River Local Market Update – November 2021 November Local Market Update – November 2021
Local Market Update – November 2021 A Research Tool Provided by the Multiple Listing Service of Hilton
Colleton River
A Research Tool Provided by the Multiple Listing Service of and the Hilton Area of REALTORS® AIsland Research Tool by the Head Multiple Listing Association ServiceofofREALTORS® Hilton Head Head Island and theProvided Hilton Head Area Association HeadTool Island and thebyHilton Head Area Association of REALTORS® A Hilton Research Provided the Multiple Listing Service of 2021 Hilton Head Island and the Hilton Head Area2020 Association of REALTORS®
Key Metrics
Detached Homes River Only 6 Colleton
New Listings
Key Metrics
Colleton River River Colleton
Median Sales Price*
$1,200,000
Closed Sales
7
Key Metrics
New Listings
Percent of List Price Received*
3
6
Closed Sales
Key Metrics Key Metrics Days on Market Until Sale Key Metrics
Closed Sales
7
2021
Percent Change
- 50.0%
66
40
Year to Date
- 57.1%
99.2%
97.1%
2020
2021
$1,350,000
New Listings
Percent Change
November
3
2020
Year to Date
+ 12.5%
3
- 39.4%
54 November 37
Percent Change
2020
$1,182,834
- 31.5%
2020
2021
2021 Percent Change
$885,000
-650.0%
3
+ 2.2% 95.1% November November November -757.1% 3
3
2020
- 50.0% 40
66
Year to Date Percent Change
- 25.2%
2021
66 - 39.4%
Percent Chan
40
+ 3.2% 98.1% Year to DateYear to Date Year - 57.1% 37 54 - 31.5% 54 to Date
- 39.4%
37
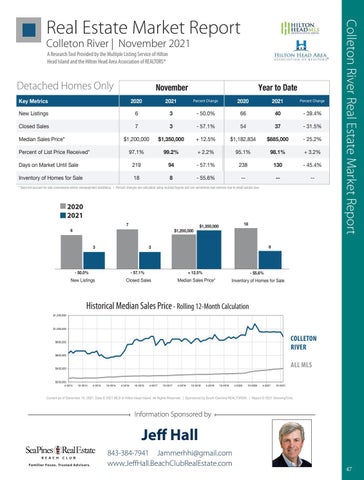
Percent Change 2020 2021 2021 Percent Change Percent Change 2020 2021 Percent Change 2020 2021 - 57.1% 238 2020 - 45.4% 94 130 Percent Change Percent Change 2020 2021 2020 2021 Median Sales Price* $1,200,000 + 12.5% $1,182,834 $1,350,000 $885,000 New Listings 66 - 50.0% 66 $1,182,834 - 39.4% 3 40 Median Sales Price* $1,200,000 + 12.5% -- 25.2% $1,350,000 $885,000 New Listings - 50.0% 66 39.4% 3 68 - 39.4% 3- 55.6% - 50.0% 40 Inventory of Homes forNew SaleListings 18 -- 66 --40 -Percent of List Price Received* 97.1% 95.1% 98.1% Closed Sales 7 - 57.1% 5499.2% - 31.5% 3 37 + 2.2% * Does notPercent account for saleClosed concessions and/or downpayment using rounded can3sometimes small sample54 size. Sales -to 57.1% 5437 -+31.5% 3 look -extreme 37 of List Price Received* 97.1% +due2.2% 95.1% 3.2% Closed Sales assistance. | Percent changes are calculated 7 7 figures and99.2% 57.1% -98.1% 31.5% Days on Market Until $1,200,000 Sale 219 238 94 130 Median Sales Price* + 12.5% $1,182,834 - 25.2% $1,350,000 $885,000- 57.1% Sales Price* $1,200,000 + 12.5%+ 12.5% -$885,000 25.2% $885,000 Sales $1,200,000 $1,350,000 25.2% $1,350,000 Days on Median MarketMedian Until Price* Sale 219 - 57.1%$1,182,834 $1,182,834 238 -- 45.4% 94 130 Percent of List Price Received* of Homes for 97.1% + 2.2% 95.1% 8 + 3.2%2021 99.2% 98.1%- 55.6% Inventory Sale 18 --2020 List Price Received* 97.1% + 98.1% 3.2% 99.2% 98.1% Percent Percent of List of Price Received* 97.1% 95.1% + 3.2% 99.2% + 2.2% + 2.2%95.1%
219
November
* Does not account for sale concessions and/or downpayment assistance. are calculated using rounded figures can sometimes look extreme Inventory of Homes Sale Until 18 - 55.6% --and130 -8 | Percent -changes -- due to small sample size. Daysfor on Market Sale 219 57.1% 238 - 45.4% 94
Days on Market Until Sale
219
Inventory of Homes for Sale Inventory of Homes for Sale
18 18
Days on Market Until Sale7
219
94
94
- 57.1%
130 18238
238
- 57.1%
- 45.4%
* Does not account for sale concessions and/or downpayment assistance. | Percent changes are calculated using rounded figures $1,350,000 and can sometimes look extreme due to small sample size.
6
8 $1,200,000 8
- 55.6% - 55.6%
---
---
November Inventory* Does of notHomes Sale - 55.6% account for salefor concessions and/or downpayment assistance. | Percent changes 18 are calculated using rounded figures8and can sometimes look extreme due to small sample size.
November
--
* Does not account for sale concessions and/or downpayment assistance. | Percent changes are calculated using rounded figures and can sometimes look extreme due to small sample size.
2020
130
- 45.4%
--
--
---
* Does not account for sale concessions and/or downpayment assistance. | Percent changes are calculated using rounded figures and can sometimes look extreme due to small sample size.
3
November November 2021
November 6
7
7
6
3
3 3Closed
3 3
3
33
Historical Median Sales Price Closed SalesSales Closed
Historical HistoricalMedian MedianSales SalesPrice Price Rolling Rolling 12-Month 12-Month Calculation Calculation
Median Sales Price* + 12.5% + 12.5%
Rolling 12-Month Calculation Median Sales Price* Median Sales Price*
All MLS — All MLS — Colleton River —
Colleton River —
COLLETON RIVER
$800,000
$800,000 $800,000
$1,000,000 $600,000
$600,000 $600,000
ALL MLS
$800,000
$600,000
All MLS — Colleton River —
AllMLS MLS — — All ColletonRiver River — — Colleton
$1,200,000
$400,000
$400,000 $400,000
4-2015
20
- 55.6%
Inventory Sale Inventoryof ofHomes Homes for for Sale
$1,000,000
$600,000
--
Inventory of Homes for Sa
--55.6% 55.6% All MLS —
$1,000,000 $1,000,000
$200,000 $800,000 10-2014 4-2014
- 45.4%
Inventory Homes for Inventory of ofColleton HomesRiver forSale Sale -— -55.6% 55.6%
$1,200,000
$400,000 $1,000,000
+ 3.2%
8 8
$1,200,000 $1,200,000
$1,200,000 $600,000
- 25.2%
8
8
Historical Median 12-Month Calculation Historical Median SalesSales PricePrice RollingRolling 12-Month Calculation
$800,000
2021
Median Sales Price*
Historical Median Sales Price - Rolling 12-Month Calculation
$1,000,000
2020
+ 12.5%
+ 12.5%
Closed Sales Sales Closed - 57.1% - 57.1%
202118
18
- 55.6%
- 31.5%
2020
2020
Inventory of Homes 8for Sale
Closed Sales
57.1% Rolling 12-Month Calculation --57.1%
$1,350,000
18
- 57.1%
New Listings
NewListings Listings New - 50.0%- 50.0%
$1,350,000
Median Sales Price* 3
- 50.0%
50.0% Historical Median Sales- -50.0% Price
New Listings New Listings
+ 12.5%$1,200,000
Sales
20208 2021 2020 2021
18 18
$1,350,000
$1,350,000 $1,350,000 $1,200,000 $1,200,000 $1,200,000 3
- 57.1%
New Listings
$1,200,000
$1,200,000 77
66
- 50.0%
7
3
6
Colleton River Real Estate Market Report
A Research Tool Provided by the Multiple Listing Service of Hilton Head Island and the Hilton Head Area Association of REALTORS®
10-2015
$200,000 $200,000 4-2014 4-2014
4-2016
10-2014 10-2014
10-2016
4-2017
$200,000 4-2015 10-2015 4-2016 4-2014 4-2015 10-2015 10-2014 4-2016
10-2017 10-2016 4-2015 10-2016
4-2018
10-2018
4-2019
4-2017 10-2017 4-2018 10-2018 10-201510-2017 4-2016 4-2017 4-2018 10-2016 10-2018
10-2019
4-2020
10-2020
4-2021
4-2019 10-2019 4-2020 10-2020 4-2021 4-2017 10-2019 10-20174-20204-2018 4-2019 10-2020 10-2018 4-2021
10-2021 10-2021 4-2019 10-2021
10-2019
4-2020
10-2020
4-2021
10-20
$400,000
Current as of December 10, 2021. Data © 2021 MLS of Hilton Head Island. All Rights Reserved. | Sponsored by South Carolina REALTORS®. | Report © 2021 ShowingTime.
$400,000
Current as of December 10, 2021. Data © 2021 MLS of Hilton Head Island. All Rights Reserved. | Sponsored by South Carolina REALTORS®. | Report © 2021 ShowingTime. Current as of December 10, 2021. Data © 2021 of Hilton Head10, Island. All Rights | Sponsored by South | Report © 2021 ShowingTime. Current asMLS of December 2021. Data Reserved. © 2021 MLS of Hilton HeadCarolina Island.REALTORS®. All Rights Reserved. | Sponsored by South Carolina REALTORS®. | Report © 2021 Showing
$200,000 4-2014
$200,000 4-2014
10-2014
10-2014
4-2015
10-2015
4-2016
10-2016 4-2017 10-2017 4-2018 10-2018 Information Sponsored by
4-2019
10-2019
4-2020
10-2020
4-2021
10-2021
Jeff Hall
4-2015 10-2015 4-2016 10-2016 10-2017 4-2018 4-2019 by10-2019 4-2020 10-2020 10-2021 Current as of December 10, 2021. Data © 20214-2017 MLS of Hilton Head Island. All Rights 10-2018 Reserved. | Sponsored South Carolina REALTORS®. | Report4-2021 © 2021 ShowingTime.
843-384-7941 Jammerhhi@gmail.com www.JeffHall.BeachClubRealEstate.com
Current as of December 10, 2021. Data © 2021 MLS of Hilton Head Island. All Rights Reserved. | Sponsored by South Carolina REALTORS®. | Report © 2021 ShowingTime. Familiar Faces. Trusted Advisors.
47