Local Market Update – November 2021Local Market Update – November 2021
Key Metrics New Listings
2021
Percent Change
2020
2021
Percent Change
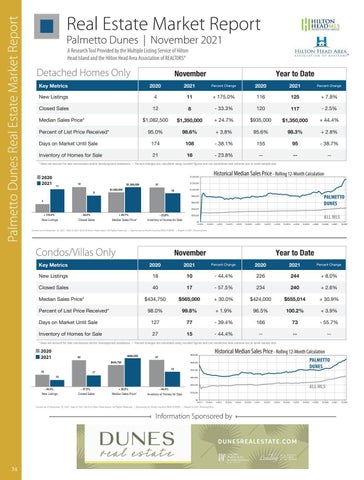
4
11
+ 175.0%
116
125
+ 7.8%
A Research Tool Provided by the Multiple Listing Service of Hilton Head Island and the 12 Hilton Head8Area Association - 33.3% of REALTORS® 120
Closed Sales
Palmetto Dunes Real Estate Market Report
2020
A Research Tool Provided by the Multiple Listing Service of Hilton Head Island and the Hilton Head Area Association of REALTORS®
Real Estate Market Report
Median Sales Price* Percent of List Price Received*
117
- 2.5%
Local Market Update – November 2021 A Research Tool Provided by the Multiple Listing Service of Palmetto Dunes Hilton Head Island and the Hilton Head Area Association of REALTORS®
$1,082,500
$1,350,000
+ 24.7%
$935,000
$1,350,000
95.0%
98.6%
+ 3.8%
95.6%
98.3%
174
108
- 38.1%
155
95
16
- 23.8%
+ 44.4%
+ 2.8% Detached Homes Only - 38.7%
Palmetto Update Dunes– |November November 2021 Palmetto Local MarketDunes 2021
Days on Market Until Sale
-A Research Tool Provided by the Multiple Listing Service of Hilton
Inventory of Homes for Sale
21
--
Detached Homes Only
Local Market Update – November 2021Detached Homes Only
2020
2021
Percent Change
2020
2021
Percent Change
New Listings
4
11
+ 175.0%
116
125
+ 7.8%
Sales 2020Closed 2021
12
8
- 33.3%
120
117
- 2.5%
$1,082,500
$1,350,000
$1,350,000
+ 44.4%
11
95.0%
98.6%
Key Metrics
98.3%
+ 2.8%
21
$1,350,000
Percent of List Price Received*
2020
$1,082,500
8
November
Median Sales Price*
Palmetto Dunes
A Research Tool Provided by the Multiple Listing Service of Hilton Head Island and the Hilton Head12 Area Association of REALTORS®
Percent 2021 Days on Market Until Sale Change 16
New Listings Palmetto DunesHomes OnlyKey Metrics Detached
4
11
Sales Local MarketClosed Update – November 2021New Listings
12
8 November
4
Detached Homes Only
November
A Research Tool Provided by the Multiple Listing Service of + Island 175.0% Hilton Head and the Head Area Association REALTORS®2020 Median Sales- of33.3% Price* KeyHilton Metrics
Inventory of Homes for Sale
+ 3.8%
95.6%
- 38.1%
155
16
- 23.8%
--
21
+ 175.0%
$935,000
2020 108
November 174
Year to Date + 24.7%
116
2021 125
Percent - 38.7% 95 Change
2020
2021
- 33.3%
11
4
November
117
+ 175.0%
2021
2020 - 2.5%
2021
125
116
Year to Date
12
--
2020
Percent Change
120
Year to Date
--
+ 7.8%
* Does not account for sale concessions and/or downpayment assistance. | Percent changes are calculated using rounded figures and can sometimes look extreme due to small sample size.
Year to Date
+ 24.7%
Year to Date
Key Metrics
Hilton Head Island and the Hilton Head Area Association of REALTORS®
November
November
--
Palmetto Dunes
A Research ToolOnly Provided by the Multiple Listing Service of Detached Homes Head Island and the Hilton Head Area Association of REALTORS®
* Does not account for sale concessions and/or downpayment assistance. | Percent changes are calculated using rounded figures and can sometimes look extreme due to small sample size.
$1,350,000
21
- 23.8% +1112 24.7% $935,000 + 44.4% $1,350,000 $1,350,000 120 2021 2021 $1,082,500 Closed Sales 2020$1,082,500 - 33.3% 8 117 16 New Listings Sales 4 Median Sales Price* Inventory of Homes for Sale 8 Percent Change Percent Change New Listings + 175.0% 116 11 125 2020+ 7.8% KeyClosed Metrics 2021 2020 2021 Percent of List Price Received* 95.0% + 3.8% $1,350,000 95.6% + 24.7% + 2.8% $1,350,000 98.3% $935,000 Closed Sales 12 - 33.3% 120 - 2.5% 98.6% 4 8 Median 117 Sales Price* $1,082,500 Percent Change
Percent Change
Palmetto Dunes
4 + 175.0% 116 + 7.8% 11 125 + 24.7% $935,000 + 44.4% $1,350,000 All MLS — 174 - 38.1% 155 - 38.7% 98.3% 108 95 Percent of List Price Received* 95.0% + 3.8% 95.6% 98.6% Percent of List Price Received* + 3.8% 95.6% 98.6% 98.3% Palmetto Dunes — + 24.7% --23.8% Closed Sales 95.0% 12 + 2.8% - 33.3% - 33.3% 120 2.5% 8 + 175.0% 117 Condos / Villas Only New Listings Sales Median Sales Price* Inventory of Homes for Sale Days on Market Until Sale 174 - 38.1% 155 108 95 $1,400,000 Inventory of Homes for Sale Days on Market Until21 -174 23.8% Closed108 -Sale - 38.7% 16 - 38.1% -155 -95 Sales Price* $1,082,500 + 24.7% $935,000 + 44.4% $1,350,000 $1,350,000 Inventory of Homes forMedian Sale 21 - 23.8% --16 -$1,200,000 * Does not account for sale concessions and/or downpayment assistance. | Percent changes are calculated figures and can sometimes look extreme due to small sample size. November Yearusing to rounded DateHistorical Median Inventory of Homes for Sale 21Sales Price Rolling 12-Month -16 Calculation - 23.8% -All MLS — Percent of List + 3.8% 95.6% +Palmetto 2.8% $1,000,000 98.6% 98.3% Dunes — Percent Change Percent Change Key Metrics 2020 Price Received* 2021 2020 95.0% 2021 Historical Median Sales Price Rolling 12-Month Calculation * Does not account for sale concessions and/or downpayment assistance. | Percent changes are calculated using rounded figures and can sometimes look extreme due to small sample size. November 2020 2021 $1,400,000 2020 $800,000 New Listings 18 Until Sale - 44.4% 226 174 244 + 8.0% 10 - 38.1% 155 108 95 2020 - 38.7% 2021 $1,200,000 2021 11Days on Market 12 Local Market Update – November 2021 21 $1,350,000 New Listings
MedianSales Sales Price* $1,082,500 $1,350,000 Historical Median Price Rolling 12-Month Calculation Days on Market Until Sale
* Does not account for sale concessions and/or downpayment assistance. | Percent changes are calculated using rounded figures and can sometimes look extreme due to small sample size.
Local Market Update – November 2021 November A Research Tool Provided by Listing Service of 40the Multiple17 - 57.5% 234 $1,082,500 8 of Hilton Homes Sale Hilton Head Inventory Island and the Headfor Area Association of REALTORS®
November
$600,000
Closed Sales
$400,000
Median Sales Price*
Percent of List Price Received* $0 Days on 4-2014
$565,000
12 + 30.0%
$424,000
98.0%
99.8%
+ 1.9%
96.5%
240
16
A Research Tool Provided by the Multiple Listing Service of + 2.6% Hilton Head Island and the Hilton Head Area Association of REALTORS®
$1,000,000
$555,014
16
- 23.8%
November Palmetto Dunes
Market Sale 10-2014 Until 4-2015 10-2015 + 175.0%
10-2016 - 127 4-2017 33.3%
4-2016
New Listings
Inventory of Homes for Sale
10-2017
Closed Sales
15
27
4
774-2018
- 39.4% 10-2018 4-2019 + 24.7%
4-2020 - 23.8%
10-2019
Median Sales Price*
- 44.4%
100.2%
11 8 166
73 10-2020
+ 3.9%
Inventory of Homes for Sale
--
--
8
--
$0 4-2014
10-2014
4-2015
10-2015
4-2016
Historical Median Sales Price
Rolling 12-Month Calculation Condos / Villas Only 11
Local Market Update – November 2021
Condos/Villas Only + 175.0%
A Research Tool Provided by the Multiple Listing 40 Service of Hilton Head Island and the Hilton Head Area Association of REALTORS® $1,000,000
$434,750
New Listings 4
$800,000
Key Metrics
Palmetto Dunes New Listings $600,000
17
4-2015
10-2015
4-2016
10-2016
4-2017
10-2019
4-2020
Percent Days on Market Until Sale Change 2021 Closed Sales 15
- 57.5%
234
240
+ 2.6%
$434,750
$565,000
$555,014
+ 30.9%
- 57.5%
4-2021
240
234
Median Sales Price*
$434,750
Days on $1,000,000
$565,000
+ 30.0%
99.8%
+ 1.9%
Market Until 98.0% Sale
Percent of List Price Received*
+ 24.7% + 1.9% + 3.9% Inventory of 96.5% Homes100.2% for Sale
99.8%
226
15
10-2021
$600,000
Days on Market Until Sale
$1,000,000 - 39.4%
77
127
$1,400,000
Inventory of Homes for27 Sale
Inventory of Homes for Sale $800,000
15
100.2% 127
- 44.4%
* Does not account for sale concessions and/or downpayment assistance. | Percent changes are calculated using rounded figures and can sometimes look extreme due to small sample size.
$400,000
November
- 44.4%
--
+ 8.0%
- 44.4%
15
--
- 23.8%
100.2%
- 39.4%
166
73
- 57.5%
Closed Sales
- 44.4%
+ 30.0%
+ 3.9%
All MLS — Palmetto-Dunes — 55.7% - 44.4%
Inventory of Homes for Sale
--
--
$1,200,000 * Does not account for sale concessions and/or downpayment assistance. | Percent changes are calculated using roundedHistorical figures andMedian can sometimes extreme due12-Month to smallCalculation sample size. Saleslook Price Rolling $600,000 $600,000
2020 $400,000 2021
November $800,000
$300,000
2020
$1,000,000 40
$400,000
18
10
$100,000
- 44.4%
4-2015
10-2015
4-2016
New Listings $200,000
4-2015
- 57.5%
10-2016
4-2017
$565,000
$400,000
27
$300,000
$0 $434,750 4-2016 10-2016 4-2017 4-2019 10-201710-2019 4-2018 4-2020 10-2018 10-2020 4-2019 10-2015 4-2014 4-2016 10-2014 10-2016 4-2015 4-201710-2015 10-2017 10-2018 $200,000 4-2018 10-2017
Closed Sales
15
40
+ 30.0%
4-2018
10-2018
Median Sales Price*
4-2019
18
- 44.4%
10-2019
4-2020
10-2020
Inventory of Homes for Sale
4-2021 $100,000
17 Current as of December 10, 2021. Data © 2021 MLS of Hilton Head Island. All Rights Reserved. 10-2014
4-2015
10-2015
$0Data © 2021 Current as of December 10, 2021. Data © 2021 MLS of Hilton Head Island. All Rights Reserved. Historical Rolling 12-Month Current as ofMedian December Sales 10, 2021.Price MLS of HiltonCalculation Head Island. All Rights Reserved. | Sponsored by South Carolina REALTORS®. | Report © 2021 ShowingTime. All MLS — 4-2014
10 10-2014
4-2015
10-2015
4-2016
10-2016
4-2017
Palmetto Dunes —
10-2019 4-2021
ALL MLS
10-2021
$0 4-2014
10-2017
4-2018
4-2016
10-2016
All MLS — Palmetto Dunes —
PALMETTO 2020 2021 DUNES
$500,000
$200,000
17
$600,000
$0 $400,000 4-2014 10-2014 10-2014
$600,000
27
$434,750
$200,000
$200,000
$565,000
Historical Median Sales Price - Rolling 12-Month Calculation
2021
4-2017
10-2017
4-2018
4-2020 10-2021
10-2020
4-2019
10-2019
4-2019
10-2019
4-2020
10-2020 4-2021 10-2021 | Sponsored by South Carolina REALTORS®. | Report ©
4-2020
10-2020
4-2021
10-2021
Information Sponsored by
$600,000
Current as of December 10, 2021. Data © 2021 MLS of Hilton Head Island. All Rights Reserved. | Sponsored by South Carolina REALTORS®. | Report © 2021 ShowingTime.
$500,000
- 44.4%
$400,000
Current as of December 10,-2021. Data © 2021 MLS of Hilton Head Island. All Rights Reserved. | Sponsored by South Carolina REALTORS®. | Report © 2021 ShowingTime. 57.5% + 30.0% - 44.4%
New Listings
$300,000
Closed Sales
Median Sales Price* Inventory DU N E SRE ALE STAT E .COMof Homes for Sale
$200,000
$100,000
Historical Median Sales Price
34
$0 4-2014
10-2014
4-2015
10-2015
4-2016
10-2016
4-2017
10-2017
4-2018
10-2018
Rolling 12-Month Calculation
4-2019
10-2019
4-2020
10-2020
4-2021
10-2021
Current as of December 10, 2021. Data © 2021 MLS of Hilton Head Island. All Rights Reserved. | Sponsored by South Carolina REALTORS®. | Report © 2021 ShowingTime.
$600,000
4-2
15
10-2018
| Sponsored by South Carolina REALTORS®. | Report © 2021 ShowingTime.
10-2018
Palmetto
15
Median Sales Price*
--
--
All MLS — 2020 2021 + 2.6% 240 Dunes Inventory of Homes for— Sale $565,000Palmetto 27 $434,750$555,014 + 30.9%
17 96.5%
New Listings
- 23.8%
Inventory of Hom
Percent - 55.7% 73 Change
--
244
+ 1.9% 10
All MLS — 77 Dunes — Palmetto
- 55.7%
27--
--
$800,000
+ 3.9%
73
166
$500,000
$0 4-2014
+ 2.6%
18 98.0%12-Month 99.8% $424,000Rolling + 30.9% Calculation $555,014 96.5%
$424,000 to- 23.8% Date
+ 30.0%
- 39.4% 166 77 2020 2021 Median Sales Price*
27
- 44.4%
Year
+ 8.0%
16
* Does not account for sale concessions and/or downpayment assistance. | Percent changes are calculated using rounded figures and can sometimes look extreme due to small sample size.
10-2020
Percent Change
17
Percent Change
$1,400,000
17
40
2021
40
127
Inventory of Homes for Sale
10
Percent Change
of List Price Received* Historical Median$1,200,000 Sales Price Historical Median Sales Price Rolling 12-Month Calculation Percent $1,200,000
2020
10-2021
244
Current as of December 10, 2021. Data © 2021 MLS of Hilton Head Island. All Rights Reserved. | Sponsored by South Carolina REALTORS®. | Report © 2021 ShowingTime.
Closed Sales
21
Percent Change
Year 10-2020 to Date4-2021
4-2020
226
Sales - 44.4% Median Sales Price* + 30.0% 2020 Closed 40 2021 $434,750 + 30.0% $424,000 $565,000 Median - 44.4% Sales Price* 226 + 8.0% of Homes for Sale 244 Inventory 4-2019
10-2019
- 44.4%
Median Sales Price*98.0%
Rolling 12-Month Calculation
10-2018
4-2019
10
- 33.3% + 24.7% Historical Median Sales Price Rolling 12-Month 40to Date - 57.5% Calculation 234 17November Year
November 10-2017 4-2018
- 44.4% - New 57.5% Listings Key Metrics 2020 2021 Median Sales Price* New Listings Closed Sales New$1,400,000 Listings 18 10 10-2014
+ 24.7%
Median Sales Price*
18
Historical Median Sales Price + 175.0%
2021
ALL MLS 2020 2021 10-2018
18
Percent of List Price Received*
2020 New Listings
$200,000
Closed Sales
November - 33.3%
Closed Sales
$400,000
$1,082,500 2021
Closed Sales
27
+ 175.0%
10 / Villas Only Condos $0 4-2014
8
$565,000 - 33.3%
10-2017 4-2018 November
Current as of December 10, 2021. Data © 2021 MLS of Hilton Head Island. All Rights Reserved. | Sponsored by South Carolina REALTORS®. | Report © 2021 ShowingTime.
New Listings
2020
4-2017
2020 $1,350,000
Key Metrics
All MLS — Palmetto Dunes —
$1,400,000 $1,200,000
18
12
4
10-2016
21
16
$1,082,500
Only
2
--
PALMETTO DUNES
$1,350,000
$400,000
- 55.7% 4-2021 $200,000 10-2021 Condos / Villas
--
21
12 $1,082,500 Dunes Palmetto
* Does not account for sale concessions downpayment Percent calculated rounded figures Reserved. and can sometimes look extreme due to Carolina small sample size. Current asand/or of December 10, assistance. 2021. Data| © 2021changes MLS ofare Hilton Headusing Island. All Rights | Sponsored by South REALTORS®. | Report © 2021 ShowingTime.
November
--
$1,350,000
+ 30.9%
$800,000
* Does not account for sale rounded figures and can sometimes look extreme due to small sample size. 11concessions and/or downpayment assistance. | Percent changes are calculated using$600,000
4
$200,000
$434,750
21
All MLS — Palmetto Dunes —