Local Market Update – March 2022
Local Market Update – March 2022
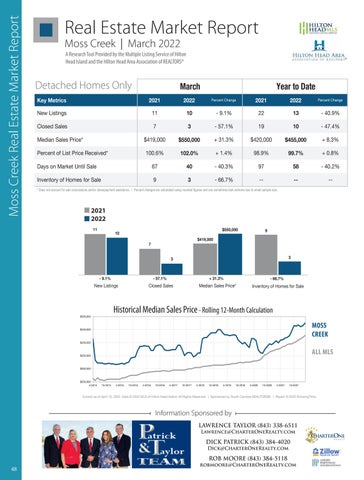
Moss Creek Real Estate Market Report
A Research Tool Provided by the Multiple Listing Service of Hilton Head Island and the Hilton Head Area Association of REALTORS®
A Research Tool Provided by the Multiple Listing Service of Hilton Head Island and the Hilton Head Area Association of REALTORS®
Local Market Update – March 2022 Real Estate Market Report MossMoss Creek Creek | March 2022 Local Creek Market Update – March 2022 Moss A Research Tool Provided by the Multiple Listing Service of Hilton Head Island and the Hilton Head Area Association of REALTORS®
A Research Tool Provided by the Multiple Listing Service of Hilton
Moss Creek
A Research Tool Provided by the Multiple Listing Service of Islandandand Hilton Area Association of REALTORS® Hilton Head Head Island thethe Hilton HeadHead Area Association of REALTORS®
Local 2022 March Local Market Market Update Update––March March 2022 A Research Tool Provided by the Multiple Listing Service of A Research Tool Provided by the Multiple Listing Service of Hilton Head Island and the Hilton Head Area Association of REALTORS®2022 Hilton Head Island and the Hilton Head Area 2021 Association of REALTORS®
Key Metrics
Detached Homes Only New Listings Moss Creek
Moss Creek Creek
Closed Sales Key Metrics
Key Metrics
Median Sales Price* New Listings
10
11
2021
7
Closed Sales100.6%
Key Metrics
7
2022
22
13
2022 - 57.1%Percent Change19
2021 10
March- 9.1%
March
2021
2022
102.0% 2021
March + 1.4%
3 March March 2022
Percent Change
Year -to40.9% Date - 47.4% 2022
$455,000 22
2021
+ 8.3% 13
- 9.1%
Year to Date Percent Change
Percent Change
$420,000 $550,000 10 + 31.3% - 9.1% 11 10
New Listings
Closed Sales
2021
Percent Change
3
$419,000 11
Percent of List Price Received*
Year to Date
22
- 40.9%
13
19
- 47.4%
10
Year +to0.8% Date
99.7% - 57.1% 10 -757.1%98.9% 3 Year 19 totoDate Year Date 2022 Percent Change 2021
2022
Percent Change
67 - 40.3% 97$550,000 - Change 40.2% 40 58 + 31.3% $419,000 Percent Percent Percent Change Percent Change$420,000 2021 2022 2021 2022 KeyMetrics Metrics Median Sales Price* 2021 $550,000 2022 2021$420,000 2022 Median Sales Price*Key $419,000 +Change 31.3% 8.3%$455,000 $455,000 New Listings 11 - 9.1% 22 -+40.9% 10 13
Days on Market Until Sale
Inventory of Homes forNew Sale 9 Listings 1111 3 New Listings Percent of List Price Received*
- 9.1% 1010- 66.7% - 9.1% 100.6%
-- 98.9% --13+ 1.4%- 40.9% 13 - 40.9%
-- 102.0% 2222
Sales Received* - 57.1% 19 Percent Closed of List Price 100.6% 7 + 1.4% 98.9% 102.0%3 * Does not account for sale concessions and/or downpayment assistance. | Percent changes are calculated using rounded figures and can sometimes look extreme due to small sample size. 33
$419,000 Inventory of Homes for Sale Percent of List Price Received* 100.6% Percent of List Price Received* 100.6%
67 $419,000 $419,000
Inventory of Homes for Sale
9
Until Sale 11 Days on Market Dayson onMarket Market UntilSale Sale Days Until * Does not account for sale concessions 10 and/or downpayment assistance.
March Inventory Homes forSale Sale Inventory ofInventory Homesofof for Sale Homes for 7
$550,000
$550,000 40 $550,000
3
- 57.1% -67 57.1%
March
2021 March 2022 March March
11
10
11
1919 40
+ 31.3%
- 66.7%
404040
- 40.3% 9797 - 40.3% -$550,000 40.3%
33 3 $419,000
- 66.7% - 66.7% -- -- 66.7%
67 6767
--
--
999
11
11 11
58 - 40.2% - 40.2%
- 40.2%
-- -- --
-----
--
+ 31.3% $419,000
New Listings
3
3
Historical Median Sales- 9.1% Price
Rolling 12-Month -Calculation 57.1%
New Listings - 9.1%New Listings
Closed Sales Closed Sales
$500,000
New Listings
$500,000
$450,000
$450,000
$500,000
- 66.7%
Inventory of Home
Inventory of Homes for Sale - 66.7%
- 66.7%
Inventory of Homes for Sale
Inventory All MLSof—Homes for Sale All MLS — Moss Creek —
MOSS All MLS CREEK Moss Creek
Rolling 12-Month Calculation
$450,000
— —
$400,000
$450,000
$400,000
$400,000
$250,000 4-2014
$350,000
$300,000
$300,000
10-2014
$350,000
$400,000 $300,000
ALL MLS
$350,000
$350,000
$300,000
$300,000 4-2015 10-2015 $250,000 4-2014 $250,000 4-2014
4-2016
10-2016
4-2017
10-2017
4-2018
$250,000 4-2015 10-2015 4-2016 10-2016 4-2017 4-2014 10-2014 4-2015 10-2015
10-2014
10-2014
4-2015
10-2015
4-2016
10-2016
4-2017
10-2018
10-2017
4-2016
10-2017
4-2018
4-2019
10-2019
10-2018
4-2019
10-2016
4-2018
10-2018
4-2017 4-2019
4-2020 10-2019
10-2017 10-2019
10-2020
4-2020
4-2018
4-2020
4-2021
10-2020
10-2018
10-2020
10-2021
4-2021
4-2021
10-2021
4-2019
10-2019
4-2020
10-2020
4-2021
1
10-2021
Current as of April 10, 2022. Data © 2022 MLS of Hilton Head Island. All Rights Reserved. | Sponsored by South Carolina REALTORS®. | Report © 2022 ShowingTime.
$350,000
Current as of April 10, 2022. Data © 2022 MLS of Hilton Head Island. All Rights Reserved. | Sponsored by South Carolina REALTORS®. | Report © 2022 ShowingTime.
$250,000 4-2014
Current as of April 10, 2022. Data © 2022 MLS of Hilton Head Island. All Rights Reserved. | Sponsored by South Carolina REALTORS®. | Report © 2
Current as of April 10, 2022. Data © 2022 MLS of Hilton Head Island. All Rights Reserved. | Sponsored by South Carolina REALTORS®. | Report © 2022 ShowingTime.
10-2014
4-2015
10-2015
4-2016
4-2017 10-2017 4-2018 10-2018 Information Sponsored by
10-2016
$300,000
4-2019
10-2019
4-2020
10-2020
4-2021
10-2021
LAWRENCE TAYLOR (843) 338-6511
Lawrence@CharterOneRealty.com Current as of April 10, 2022. Data © 2022 MLS of Hilton Head Island. All Rights Reserved. | Sponsored by South Carolina REALTORS®. | Report © 2022 ShowingTime. $250,000 4-2014
10-2014
4-2015
10-2015
4-2016
10-2016
4-2017
10-2017
4-2018
DICK (843) 4-2020 384-4020 10-2018 PATRICK 4-2019 10-2019 10-2020 Dick@CharterOneRealty.com
4-2021
10-2021
ROB MOORE (843) 384-5118
48
A Moss
All MLS —— Moss Creek Moss Creek —
Rolling 12-Month Calculation
$400,000
$350,000
$450,000
Median Sales Price* Median Sales Price* + 31.3%
Historical Median Sales Price - Rolling 12-Month Calculation
Historical Median Sales Price
$400,000
33
- 66.7% - 66.7% All MLS — Inventory of Homes for Sale Moss Creek —
$500,000
$500,000
2022
Median Sales Price*
Historical Median Sales Price Sales Rolling 12-Month Calculation Median Sales Price* New Listings Closed Historical Median Sales Price Rolling 12-Month Calculation
Historical Median Sales Price
2021
9
9
Rolling 12-Month + 31.3%Calculation Median Sales Price*
Closed Sales
2022
3
+ 31.3% + 31.3%
- 57.1% Historical Median - 57.1% Sales Price
2021
+ 31.3%
Closed Sales
- 57.1%
9
20
Inventory of Homes3for Sale
- 57.1%
3
--
- 66.7%
Median Sales Price*
3
202132022 2022 2021
9 9
$550,000
$419,000 $419,000 $419,000 3
- 9.1%
- 9.1%
$550,000 $550,000
$550,000
- 57.1% 7 7 Closed Sales
- 9.1%
$419,000
7
7 7
- 9.1%
$550,000
10
10 10
10
58
--
97 9 5858
| Percent changes are calculated using rounded figures and can sometimes look extreme due to small sample size.
3
New Listings
$500,000
99.7%
-31.3% 40.3% $420,000 $420,000 + +31.3%
Doesnot notaccount accountforforsale saleconcessions concessionsand/or and/ordownpayment downpaymentassistance. assistance.| Percent | Percent changes calculated using rounded figures and sometimes look extreme due to small sample changes areare calculated using rounded figures and cancan sometimes extreme due to small sample size.size. * Does not account for**Does sale concessions and/or downpayment assistance. | Percent changes are calculated using rounded figures and canlook sometimes look extreme due to small sample size.
$450,000
-+47.4% 0.8%
- 47.4% - 47.4% 1010 - 40.3% 97 $420,000 + 8.3% $455,000 97$455,000 - 40.2% + 8.3% $455,000 58 + 8.3% 9 - 66.7% -3 2021 2022 + 1.4% 98.9% 98.9% + 0.8% 102.0% 99.7% 1.4% + 0.8% 102.0% 99.7% Percent of List Price Received* 100.6% + +1.4% 98.9% + extreme 0.8% 102.0% 99.7% * Does not account for sale concessions and/or downpayment assistance. | Percent changes are calculated using rounded figures and can sometimes look due to small sample size. Closed ClosedSales Sales Days on Market Until Sale 7 7
Median Sales Price*
Days on Market Until SaleSales Median SalesPrice* Price* Median
March
10 99.7%
robmoore@CharterOneRealty.com
Current as of April 10, 2022. Data © 2022 MLS of Hilton Head Island. All Rights Reserved. | Sponsored by South Carolina REALTORS®. | Report © 2022 ShowingTime.
