A Research Tool Provided by the Multiple Listing Service of Hilton Head Island and the Hilton Head Area Association of REALTORS®
Local Market Update – March 2022
Local Market Update – March 2022 Callawassie Island Real Estate Market Report A Research Tool Provided by the Multiple Listing Service of Hilton Head Island and the Hilton Head Area Association of REALTORS®
Callawasse Island | March 2022
Callawassie Island Local Market Update – March 2022 March Local Market Update – March 2022
Local Market Update – March 2022 A Research Tool Provided by the Multiple Listing Service of Hilton
Callawassie Island
A Research Tool Provided by the Multiple Listing Service of and the Hilton Area of REALTORS® AIsland Research Tool by the Head Multiple Listing Association ServiceofofREALTORS® Hilton Head Head Island and theProvided Hilton Head Area Association HeadTool Island and thebyHilton Head Area Association of REALTORS® A Hilton Research Provided the Multiple Listing Service of 2022 Hilton Head Island and the Hilton Head Area2021 Association of REALTORS®
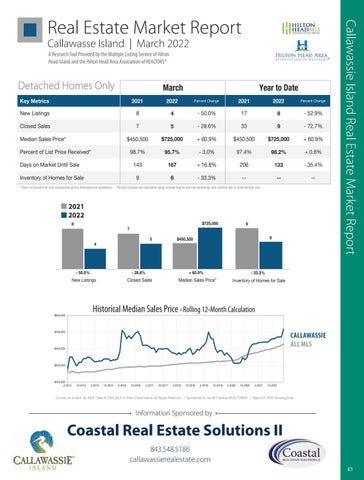
Key Metrics
4 Detached Homes Only 8Island Callawassie
New Listings
Callawassie Island Island Callawassie
Closed Sales
7
Key Metrics
Key Metrics
Median Sales Price*
New Listings
New Listings
8
Closed Sales
7
95.7%
98.7%
Closed Sales
Key Metrics Key Metrics Days on Market Until Sale Key Metrics
Percent Change
2021
2022
Percent Change
- 50.0%
17
8
Year to Date
9
- 72.7%
March
- 28.6%
March
33
2022
$725,000
$450,500
Percent of List Price Received*
5
2021
Year to Date
Percent Change
2021
+ 60.9%
2022
2021
2022 Percent Change
$725,000
$450,500
4
- 52.9%
-850.0%
4
- 3.0% 97.4% March March March 728.6% 5 Percent Change 2022 2021
5
2021
- 50.0% 8
17
Year to Date Percent Change
+ 60.9%
2022
17 - 52.9%
+ 0.8% 98.2% Year to DateYear to Date Year - 28.6% 9 33 - 72.7% 33 to Date
8 9
March
* Does not account for sale concessions9and/or downpayment assistance. are calculated using rounded figures can sometimes look extreme Inventory of Homes Sale Until - 33.3% --and133 -6 | Percent+changes -- due to small sample size. Daysfor on Market Sale 143 16.8% 206 - 35.4% 167
Days on Market Until Sale
8
167
143
Days on Market Until Sale
143
133 9 206
+ 16.8% 206 + 16.8% 167 $725,000
- 35.4%
* Does not account for sale concessions and/or downpayment assistance. | Percent changes are calculated using rounded figures and can sometimes look extreme due to small sample size.
Inventory of Homes for 7 Sale Inventory of Homes for Sale
6 6
9 9
- 33.3% - 33.3%
---
---
March Inventory* Does of notHomes Sale 9calculated using rounded figures6and can sometimes look extreme - 33.3% account for salefor concessions and/or downpayment assistance. | Percent changes are due to small sample size.
* Does not account for sale concessions and/or downpayment assistance. | Percent changes are calculated using rounded figures and can sometimes look extreme due to small sample size.
--
$450,500 5 * Does not account for sale concessions and/or downpayment assistance. | Percent changes are calculated using rounded figures and can sometimes look extreme due to small sample size. 2021 4 8
March
March March 2022
8March
7
88
7
77
- 28.6%
7
8
- 50.0%
44
4
New Listings
Closed Sales
4
50.0% Historical Median Sales- -50.0% Price
$600,000
New Listings New Listings
Price* 5 Median Sales$450,500
- 50.0%
- 28.6%
New Listings
Closed Sales
28.6% Rolling 12-Month Calculation --28.6%
NewListings Listings New
- 50.0%- 50.0%
$450,500 $450,500 + 60.9% $450,500
55
Closed Sales Sales Closed
Historical Median Sales Price Closed SalesSales Closed
- 33.3%
Historical HistoricalMedian MedianSales SalesPrice Price Rolling Rolling 12-Month 12-Month Calculation Calculation
66
6
$500,000 $200,000 4-2014
Rolling 12-Month Calculation Median Sales Price* Median Sales Price*
$300,000
20
6
AllMLS MLS — — All CallawassieIsland Island — — Callawassie
All MLS — Callawassie Island —
All MLS — All MLS — Callawassie Island —
Callawassie Island —
CALLAWASSIE ALL MLS
com·mu·ni·ty
$300,000
$300,000 $300,000
$400,000
--
Inventory of Homes for Sa
Inventory Sale Inventoryof ofHomes Homes for for Sale
$400,000
$400,000 $400,000
4-2015
- 35.4%
Inventory of for Inventory ofHomes Homes forSale Sale Callawassie Island -— -33.3% 33.3%
$500,000 $500,000
$400,000
10-2014
+ 0.8%
- 33.3%
$600,000 $500,000
6
--33.3% 33.3% All MLS —
$500,000
$300,000
2022
+ 60.9%
Median Sales Price* + 60.9% + 60.9%
+ 60.9%
Historical Median Sales Price - Rolling 12-Month Calculation
$600,000 $600,000
$600,000
2021
9
Historical Median 12-Month Calculation Historical Median SalesSales PricePrice RollingRolling 12-Month Calculation
$400,000
2022 9
9
- 72.7%
2021
2021
2022 2022
Median Sales Price*
$600,000
$500,000
--
Inventory of Homes for Sale
+ 60.9%
- 28.6% - 28.6%
--
$725,000 2021 2021
$725,000
5
- 35.4%
6
$725,000 $450,500 $725,000 99 5 $725,000
4
133
---
Percent Cha
- 52.9%
Percent Change 2021 2022 Percent Change Percent Change 2021 2022 2021 2022 + 16.8% 206 2021 - 35.4% 167 133 Percent Change Percent Change 2021 2022 2022 Median Sales Price* $450,500 + 60.9% $450,500 $725,000 New Listings 88 - 50.0% 17 - 52.9% 4 Median Sales Price* $450,500 + 60.9% $450,500 +- 52.9% 60.9%$725,000 $725,000 $725,000 New Listings - 50.0% 1788 4 86 - 52.9% 4- 33.3% - 50.0% Inventory of Homes forNew SaleListings 9 -- 17 --8 -Percent of List Price Received* 98.7% 97.4% 98.2% Closed Sales 7 - 28.6% 3395.7% - 72.7% 5 9 - 3.0% * Does notPercent account for saleClosed concessions and/or downpayment using rounded can5sometimes small sample33 size. Sales -to 28.6% 339 -+72.7% 5 look -extreme 9 of List Price Received* 98.7% -due3.0% 97.4% 0.8% Closed Sales assistance. | Percent changes are calculated 7 7 figures and95.7% 28.6% -98.2% 72.7% Days on Market Until Sale 143 + 16.8% 206 167 $725,000 133 Median Sales Price* $450,500 + 60.9% $450,500 + 60.9% $725,000 Sales Price* $450,500 $450,500 $450,500 +$725,000 60.9% $725,000 Sales $450,500 $725,000 + 60.9% + 60.9% $725,000+ 60.9% Days on Median MarketMedian Until Price* Sale 143 + 16.8% 206 - 35.4% 167 133 Percent of List Price Received* of Homes for 98.7% - 3.0% 97.4% 6 + 0.8%2022 95.7% 98.2%- 33.3% Inventory Sale 9 --2021 List Price Received* 98.7% + 98.2% 0.8% 95.7% 98.2% Percent Percent of List of Price Received* 98.7% 97.4% + 0.8% 95.7% - 3.0% - 3.0%97.4%
143
Callawassie Island Real Estate Market Report
A Research Tool Provided by the Multiple Listing Service of Hilton Head Island and the Hilton Head Area Association of REALTORS®
10-2015
4-2016
10-2016
4-2017
$200,000 $200,000 $200,000 4-2014 10-2014 4-2015 10-2015 4-2016 4-2014 10-2014 4-20154-2014 10-2015 10-2014 4-2016
{ noun, often10-2018 attributive }10-2019pronounced [ kah-luh-wa-see ] 4-2018 4-2019 4-2020 10-2020 4-2021 10-2021
10-2017
Definition of community
10-2016 4-2017 10-2017 4-2018 10-2018 4-2015 4-2017 10-2015 10-2016 10-20174-2016 4-2018 10-2016 10-2018
10-2021 Warmth, Balance & Connection. 4-2019 10-2019 4-2020 10-2020
4-2019 10-2019 4-2020 10-2020 4-2021 4-2017 10-2019 10-2017 4-2019 4-20204-2018 10-2020 10-2018 4-2021
10-2021
4-2021
10-2021
1) a group of people living in the same place or having This is the essence of Callawassie Island, brought to life a particular characteristic common.by"the Callawassie by people who are the very definition of a community. Current as of April 10, 2022. Data © 2022 MLS of Hilton Head Island. All Rights Reserved.in| Sponsored South Carolina REALTORS®. | Report © 2022 ShowingTime. Island you are already local or visiting, come discover Current as of April 10, 2022. Data © 2022 MLS community" of Hilton Head Island. All Rights Reserved. | Sponsored by South Carolina REALTORS®. Whether | Report © 2022 ShowingTime. Current as of April 10, 2022. Data © 2022 MLS as of Hilton Head10, Island. All Rights | Sponsored by South | Report © 2022 ShowingTime. $300,000 Current of April 2022. Data Reserved. © 2022 MLS of Hilton HeadCarolina Island.REALTORS®. All Rights Reserved. | Sponsored by South Carolina the community island we call home. REALTORS®. | Report © 2022 Showin $200,000 2) a feeling of fellowship others,10-2018 as a result4-2019 of 4-2014 10-2014 4-2015 10-2015 4-2016 10-2016 4-2017 10-2017 with 4-2018 10-2019 4-2020 10-2020 4-2021 10-2021 sharing common attitudes, interests, and goals. "the sense Connect with our real estate partners at Coastal Real of community that Callawassie Island can provide." Estate Solutions II to learn about the Callawassie $200,000 a similarity or identity. "people who shared a community Island community. 4-2014 10-2014 4-2015 10-2015 4-2017 10-2017 10-2018 4-2019 10-2019 4-2020 10-2020 4-2021 Current as4-2016 of April 10, 10-2016 2022. Data ©of 2022 MLS of Hilton Head Island. All Rights Reserved. | Sponsored by South Carolina REALTORS®. | Report © 10-2021 2022 ShowingTime. interests across the 4-2018 causeway"
Information Sponsored by
Coastal Real Estate Solutions II 843.548.5186 Scan this code callawassierealestate.com
Current as of April 10, 2022. Data © 2022 MLS of Hilton Head Island. All Rights Reserved. | Sponsored by South Carolina REALTORS®. | Report © 2022 ShowingTime.
to learn more
843-548-5186
45 |
callawassierealestate.com
