Local Market Update – March 2022 A Research Tool Provided by the Multiple Listing Service of Hilton Head Island and the Hilton Head Area Association of REALTORS®
Local Market Update – March 2022 Real Estate Market Report Hampton Lake Hampton Lake |– March 2022 Local Market Update March 2022 Hampton Lake A Research Tool Provided by the Multiple Listing Service of Hilton Head Island and the Hilton Head Area Association of REALTORS®
A Research Tool Provided by the Multiple Listing Service of Hilton
Hampton Lake
A Research Tool Provided by the Multiple Listing Service of Islandandand Hilton Area Association of REALTORS® Hilton Head Head Island thethe Hilton HeadHead Area Association of REALTORS®
Local 2022 March Local Market Market Update Update––March March 2022 A Research Tool Provided by the Multiple Listing Service of A Research Tool Provided by the Multiple Listing Service of Hilton Head Island and the Hilton Head Area Association of REALTORS®2022 Hilton Head Island and the Hilton Head Area 2021 Association of REALTORS®
Key Metrics
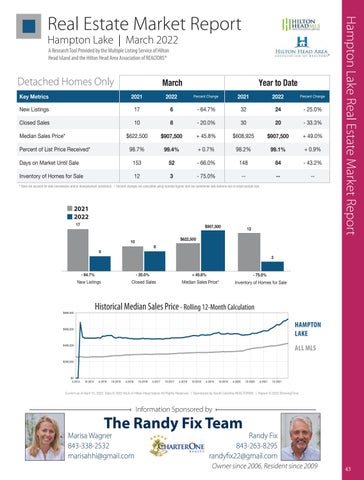
Detached Homes Only New Listings Hampton Lake17
6
Hampton Hampton Lake Lake
Closed Sales Key Metrics
Key Metrics
Median Sales Price* New Listings
10 2021
Closed Sales98.7%
Closed Sales
Key Metrics
10
2022
32
24
2022 - 20.0%Percent Change 30
2021 20
March- 64.7%
March
2021
$907,500 6
$622,50017
Percent of List Price Received*
2021
Percent Change
8
New Listings
Year to Date
+ 45.8% - 64.7% $608,925
March + 0.7%
99.4%
8March March 2022
2021
2022
17
Percent Change
Year to Date - 25.0% - 33.3% 2022
Percent Change
Year to Date Percent Change
2021
2022
+ 49.0% $907,500 32 - 64.7% 24 32 - 25.0%
6
30 20 Year totoDate Year Date 2022 2021
Percent Change
Percent Cha
24
Year to Date
99.1% - 20.0% + 0.9%
-1020.0%98.2% 8
30 - 33.3%
- 25.0%
20
Percent Change
- 33.3%
153 - 66.0% 148 - Change 43.2% 52 84 + 45.8% $622,500 $907,500 $907,500 Percent Percent Percent Change Percent Change$608,925 2022 2021 2022 KeyMetrics Metrics Median Sales Price* 2021 $907,500 2022 2021$608,925 2022 Median Sales Price*Key $622,5002021 + Change 45.8% +- 49.0% $907,500 New Listings 17 - 64.7% 32 25.0% 6 24
Days on Market Until Sale
Inventory of Homes forNew Sale Listings 1717 3 New Listings Percent of List 12 Price Received* Closed SalesReceived* Percent of List Price
- 64.7% 6 6 - 75.0% - 64.7% 98.7%
99.4% 8
98.7% 10
-- 98.2% --24+ 0.7%- 25.0% 24 - 25.0%
-- 32 32 99.4%
- 20.0% + 0.7%
20 99.1%
30 98.2%
* Does not account for sale concessions and/or downpayment assistance. | Percent changes are calculated using rounded figures and can sometimes look extreme due to small sample size.
88
Closed ClosedSales Sales Days on Market Until Sale 1010
Median Sales Price*
$622,500 Days on Market Until SaleSales 153 $622,500 Median SalesPrice* Price* $622,500 Median Inventory of Homes for Sale Percent of List Price Received* 98.7% Percent of List Price Received* 98.7%
March
12
17 Days on Market SaleUntil Sale Days Until on Market
3
153 153 153
Days on Market Until Sale
- 20.0% - 20.0% 153
3030 52
+ 45.8%
- 75.0%
525252
- 66.0% 148 - 66.0% 148 -$907,500 66.0%
33 3
- 75.0% - 75.0% -- -- 75.0%
--
--
March Inventory Homes forSale Sale Inventory ofInventory Homesofof for Sale Homes for
84 - 43.2% - 43.2%
- 43.2%
12 1212
$622,500
-- -- --
-----
--
Doesnot notaccount accountforforsale saleconcessions concessionsand/or and/ordownpayment downpaymentassistance. assistance.| Percent | Percent changes calculated using rounded figures and sometimes look extreme due to small sample changes areare calculated using rounded figures and cancan sometimes extreme due to small sample size.size. * Does not account for**Does sale concessions and/or downpayment | Percent changes are calculated using rounded figures and canlook sometimes look extreme due to small sample size. 10 17 assistance.
March
- 20.0%
New Listings
8
6
6
8
--
8
- 64.7%
6
Rolling 12-Month -Calculation 20.0%
New Listings - 64.7%New Listings
Closed Sales Sales -Closed 20.0%
- 64.7%
- 64.7%
$800,000
New Listings
Median Sales Price*
Inventory of Homes for Sale
Closed Sales
Median Sales Price*
Inventory of—Homes for Sale All MLS
Historical Median Sales Price - Rolling 12-Month Calculation Historical Median Sales Price Rolling 12-Month Calculation
$800,000
$800,000
$400,000
$400,000
$400,000
$600,000 $0
$400,000
$200,000
$200,000
4-2015
ALL MLS
$200,000
$200,000
10-2014
HAMPTON All MLS — Hampton Lake — LAKE
$600,000
$600,000
4-2014
All MLS — Hampton Lake —
Rolling 12-Month Calculation
$600,000
$200,000
All MLS — Hampton Lake —
All MLS —— Hampton Lake Hampton Lake —
$800,000
$600,000
20
- 75.0%
- 75.0%
$800,000
Historical Median Sales Price
--
33 Inventory of Homes for Sa
Inventory of Homes for Sale
Historical Median Sales PriceSales Rolling 12-Month Calculation Median Sales Price* New Listings Closed Historical Median Sales Price Rolling 12-Month Calculation $800,000
- 43.2%
- 75.0% - 75.0% All MLS — Inventory ofHampton HomesLake for Sale — Inventory of Homes for Sale - 75.0%
Rolling 12-Month + 45.8%Calculation Median Sales Price*
Closed Sales
2022
3
+ 45.8%3
Median Sales Price* Median Sales Price* + 45.8%
Historical -Median 20.0% Sales Price
+ 0.9%
3
- 20.0% + 45.8% + 45.8%
- 20.0%
2022 12
12
- 75.0%
New Listings
Historical Median Sales- 64.7% Price
2021
3
+ 49.0%
2021
12
$622,500 +$622,500 45.8%
$622,500
8
2021
2021 2022 2022 2021
1212
$622,500
10 10
10 10 6 Closed Sales
8 $907,500 $907,500
$907,500
6
- 64.7%
$622,500
$907,500
10
17 17
17
$907,500
8
2021 6March March March 2022 17
$400,000
84
--
1488484
12 size. * Does not account for sale concessions and/or downpayment assistance. | Percent changes are calculated using rounded figures and can sometimes look extreme due to small sample
$400,000
99.1%
Percent of List Price Received* + 0.7% 98.2% + extreme 0.9% due to small sample size. 99.4%| Percent changes 99.1% * Does not account for sale concessions and/or98.7% downpayment assistance. are calculated using rounded figures and can sometimes look
Inventory of Homes for Sale
$600,000
-+33.3% 0.9%
- 33.3% - 33.3% 2020 - 66.0% 148 $608,925 + 49.0% $907,500 -45.8% 66.0% $608,925 - 43.2% $608,925 148 +84 49.0% $907,500 $907,500 + 49.0% 52 + +45.8% $907,500 $907,500 12 - 75.0% -3 2021 2022 + 0.7% 98.2% 98.2% + 0.9% 99.4% 99.1% + 0.7% + 0.9% 99.4% 99.1%
$907,500
Hampton Lake Real Estate Market Report
A Research Tool Provided by the Multiple Listing Service of Hilton Head Island and the Hilton Head Area Association of REALTORS®
10-2015
$0 4-2014 $0 4-2014
4-2016
10-2014
10-2014
10-2016
4-2017
10-2017
4-2018
$0 4-2015 10-2015 4-2016 10-2016 4-2017 4-2014 10-2014 4-2015 10-2015 4-2015
10-2015
4-2016
10-2016
4-2017
10-2018
10-2017
4-2016
10-2017
4-2018
4-2019 10-2018
10-2016
4-2018
10-2019
10-2018
4-2019
4-2017 4-2019
4-2020 10-2019
10-2017 10-2019
10-2020
4-2020
4-2018
4-2020
4-2021
10-2020
4-2021
10-2018
10-2020
10-2021
4-2021
10-2021
4-2019
10-2019
4-2020
10-2020
4-2021
10-2021
10-2021
Current as of April 10, 2022. Data © 2022 MLS of Hilton Head Island. All Rights Reserved. | Sponsored by South Carolina REALTORS®. | Report © 2022 ShowingTime. Current as of April 10, 2022. Data © 2022 MLS of Hilton Head Island. All Rights Reserved. | Sponsored by South Carolina REALTORS®. | Report © 2022 ShowingTime.
$200,000
$0 4-2014
Current as of April 10, 2022. Data © 2022 MLS of Hilton Head Island. All Rights Reserved. | Sponsored by South Carolina REALTORS®. | Report © 2022 Showin
Current as of April 10, 2022. Data © 2022 MLS of Hilton Head Island. All Rights Reserved. | Sponsored by South Carolina REALTORS®. | Report © 2022 ShowingTime.
10-2014
4-2015
10-2015
4-2016
4-2017 10-2017 4-2018 10-2018 Information Sponsored by
10-2016
4-2019
10-2019
4-2020
10-2020
4-2021
10-2021
The Randy Fix Team
Current as of April 10, 2022. Data © 2022 MLS of Hilton Head Island. All Rights Reserved. | Sponsored by South Carolina REALTORS®. | Report © 2022 ShowingTime.
$0 4-2014
10-2014
Marisa Wagner 10-2015 4-2016 10-2016 843-338-2532 marisahhi@gmail.com
4-2015
4-2017
10-2017
4-2018
10-2018
Randy Fix 10-2020 843-263-8295 randyfix22@gmail.com 4-2019
10-2019
4-2020
4-2021
10-2021
Current as of April 10, 2022. Data © 2022 MLS of Hilton Head Island. All Rights Reserved. | Sponsored by South Carolina REALTORS®. | Report © 2022 ShowingTime.
Owner since 2006, Resident since 2009
43
