Local Market Update – March 2022
Local Market Update – March 2022
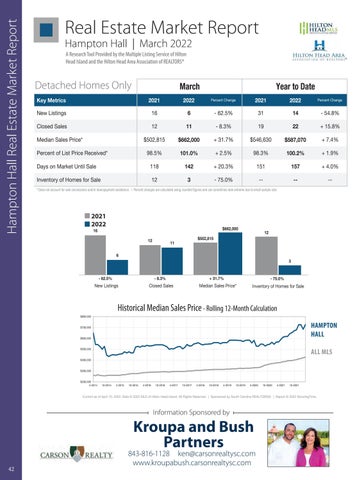
Hampton Hall Real Estate Market Report
A Research Tool Provided by the Multiple Listing Service of Hilton Head Island and the Hilton Head Area Association of REALTORS®
A Research Tool Provided by the Multiple Listing Service of Hilton Head Island and the Hilton Head Area Association of REALTORS®
Local Market Update – March 2022 Real Estate Market Report Hampton Hall HamptonUpdate Hall | –March 2022 Local MarketHall March 2022 Hampton A Research Tool Provided by the Multiple Listing Service of Hilton Head Island and the Hilton Head Area Association of REALTORS®
A Research Tool Provided by the Multiple Listing Service of Hilton
Hampton Hall
A Research Tool Provided by the Multiple Listing Service of Islandandand Hilton Area Association of REALTORS® Hilton Head Head Island thethe Hilton HeadHead Area Association of REALTORS®
Local 2022 March Local Market Market Update Update––March March 2022 A Research Tool Provided by the Multiple Listing Service of A Research Tool Provided by the Multiple Listing Service of Hilton Head Island and the Hilton Head Area Association of REALTORS®2022 Hilton Head Island and the Hilton Head Area 2021 Association of REALTORS®
Key Metrics
Detached Homes Only New Listings Hampton Hall16
6
Hampton Hampton Hall Hall
Closed Sales Key Metrics
12 2021
Key Metrics
Median Sales Price* New Listings
Closed Sales98.5%
Key Metrics
12
2022
31
14
2022 - 8.3%Percent Change 19
2021 22
March- 62.5%
March
2021
$662,000 6
New Listings
Closed Sales
2021
Percent Change
11
$502,81516
Percent of List Price Received*
Year to Date
March + 2.5%
101.0%
11 March March 2022
2021
2022
+ 31.7% - 62.5% $546,630 16
Percent Change
Year to Date - 54.8% + 15.8% 2022
Percent Change
$587,070 31
6
- 62.5%
2021
+ 7.4% 14
Percent Change
2022
31 - 54.8%
14
19 + 15.8%
22
Year +to1.9% Date
100.2% - 8.3% 22 19 Year totoDate Year Date 2022 2021
12 - 8.3% 98.3% 11
Year to Date Percent Change
Percent Change
118 + 20.3% 151 +Change 4.0% 142 157+ 31.7% $502,815 $662,000 Percent Percent Percent Change Percent Change$546,630 2022 2021 2022 KeyMetrics Metrics Median Sales Price* 2021 $662,000 2022 2021$546,630 2022 Median Sales Price*Key $502,8152021 + Change 31.7% 7.4% $587,070 $587,070 New Listings 16 - 62.5% 31 -+54.8% 6 14
Days on Market Until Sale
Inventory of Homes forNew Sale Listings 1616 3 New Listings Percent of List 12 Price Received*
- 62.5% 6 6 - 75.0% - 62.5% 98.5%
-- 98.3% --14+ 2.5%- 54.8% 14 - 54.8%
-- 101.0% 3131
Closed SalesReceived* - 8.3% 19 Percent of List Price 98.5% 12 + 2.5% 98.3% 101.0%11 * Does not account for sale concessions and/or downpayment assistance. | Percent changes are calculated using rounded figures and can sometimes look extreme due to small sample size. 1111
$502,815 Inventory of Homes for Sale Percent of List Price Received* 98.5% Percent of List Price Received* 98.5%
118 $502,815 $502,815
Inventory of Homes for Sale
12
Until Sale Dayson onMarket Market UntilSale Sale Days Until 16 Days on Market
$662,000
142 $662,000 $662,000 3
142 142 142
118 118 118
- 118 8.3% - 8.3%
March Inventory Homes forSale Sale Inventory ofInventory Homesofof for Sale Homes for 12
19142 19
+ 31.7%
- 75.0%
--
--
$662,000 + 20.3% 151 20.3% 151 + +20.3%
$502,815 33 3
12 1212
11
March
+157 4.0% + 4.0%
+ 4.0%
-- -- --
-----
--
- 75.0% - 75.0% -- -- 75.0%
March March
12
2022
16
6
12
- 62.5%
- 8.3% 12
New Listings
6 Closed 6
6
12 12
11
Sales
Median Sales Price*
3
Closed Sales
Median Sales Price*
+ 31.7% + 31.7%
- 8.3%
Rolling 12-Month + 31.7%Calculation Median Sales Price*
Closed Sales
- 75.0%
33 Inventory of Home
- 75.0% - 75.0% All MLS — Inventory of Hampton Homes for HallSale — Inventory of Homes for Sale - 75.0%
Median Sales Price* Median Sales Price* + 31.7%
Historical Median - 8.3% Sales Price
$700,000
Historical Median Sales PriceSales Rolling 12-Month Calculation Median Sales Price* New Listings Closed Historical Median Sales Price Rolling 12-Month Calculation
$600,000
Historical Median Sales Price
- 75.0%
Inventory of Homes for Sale
Inventory of—Homes for Sale All MLS
A Hampt
Historical Median Sales Price - Rolling 12-Month Calculation
All MLSHall —— Hampton Hampton Hall —
$800,000
Rolling 12-Month Calculation
$800,000
Historical Median Sales Price $700,000
$800,000
$700,000
$800,000
$700,000
All MLS — Hampton Hall —
HAMPTON All MLS — HALLHall — Hampton
Rolling 12-Month Calculation
$600,000
$600,000
$600,000
$400,000
$800,000
$700,000
$300,000
$600,000
$500,000
$500,000
ALL MLS
$500,000
$400,000
$400,000
$400,000
$500,000 $200,000 4-2014 10-2014
$600,000
$400,000
$500,000
2022
Inventory of Homes for Sale
New Listings
Closed Sales Closed - 8.3%Sales
2022 12
12
+ 31.7%3
Rolling 12-Month Calculation - 8.3%
- 62.5%
20
- 75.0%
- 8.3%
New Listings - 62.5%New Listings
2021
3
$502,815 + 31.7%
--
12
1212
$662,000
$502,815 $502,815 $502,815
11 11
11
Historical Median Sales- 62.5% Price New Listings
$662,000
2021
2021 2022 2022 2021
- 62.5%
6
- 62.5%
11
$502,815
$662,000 $662,000
16 16
16
$800,000
$662,000
16
6March 2021
157
--
151 157 157
Doesnot notaccount accountforforsale saleconcessions concessionsand/or and/ordownpayment downpaymentassistance. assistance.| Percent | Percent changes calculated using rounded figures and sometimes look extreme due to small sample changes areare calculated using rounded figures and cancan sometimes extreme due to small sample size.size. * Does not account for**Does sale concessions and/or downpayment assistance. | Percent changes are calculated using rounded figures and canlook sometimes look extreme due to small sample size.
$700,000
100.2%
+31.7% 20.3% $546,630 $546,630 151 $587,070 + +31.7% $587,070
12 size. * Does not account for sale concessions and/or downpayment assistance. | Percent changes are calculated using rounded figures and can sometimes look extreme due to small sample
$500,000
++ 15.8% 1.9%
+ 15.8% + 15.8% 2222 + 20.3% 151 $546,630 + 7.4% $587,070 + 4.0% + 7.4% 157 + 7.4% 12 - 75.0% -3 2021 2022 + 2.5% 98.3% 98.3% + 1.9% 101.0% 100.2% 2.5% + 1.9% 101.0% 100.2% Percent of List Price Received* + +2.5% 98.3% + extreme 1.9% 101.0% 100.2% * Does not account for sale concessions and/or98.5% downpayment assistance. | Percent changes are calculated using rounded figures and can sometimes look due to small sample size. Closed ClosedSales Sales Days on Market Until Sale 1212
Median Sales Price*
Days on Market Until SaleSales Median SalesPrice* Price* Median
March
22 100.2%
$300,000
$300,000
$300,000
4-2015 $300,000 10-2015 $200,000 4-2014 $200,000 4-2014
4-2016
10-2016
4-2017
10-2017
4-2018
$200,000 4-2015 10-2015 4-2016 10-2016 4-2017 4-2014 10-2014 4-2015 10-2015
10-2014
10-2014
4-2015
10-2015
4-2016
10-2016
4-2017
10-2018
10-2017
4-2016
10-2017
4-2018
4-2019
10-2019
10-2018
4-2019
10-2016
4-2018
10-2018
4-2017 4-2019
4-2020 10-2019
10-2017 10-2019
10-2020
4-2020
4-2018
4-2020
4-2021
10-2020
10-2018
10-2020
10-2021
4-2021
4-2021
10-2021
4-2019
10-2019
4-2020
10-2020
4-2021
10-2021
Current as of April 10, 2022. Data © 2022 MLS of Hilton Head Island. All Rights Reserved. | Sponsored by South Carolina REALTORS®. | Report © 2022 ShowingTime. Current as of April 10, 2022. Data © 2022 MLS of Hilton Head Island. All Rights Reserved. | Sponsored by South Carolina REALTORS®. | Report © 2022 ShowingTime.
$400,000
$200,000 4-2014
Current as of April 10, 2022. Data © 2022 MLS of Hilton Head Island. All Rights Reserved. | Sponsored by South Carolina REALTORS®. | Report ©
Current as of April 10, 2022. Data © 2022 MLS of Hilton Head Island. All Rights Reserved. | Sponsored by South Carolina REALTORS®. | Report © 2022 ShowingTime.
10-2014
4-2015
10-2015
$300,000
4-2016
4-2017 10-2017 4-2018 10-2018 Information Sponsored by
10-2016
4-2019
10-2019
Kroupa and Bush Partners
4-2020
10-2020
4-2021
10-2021
Current as of April 10, 2022. Data © 2022 MLS of Hilton Head Island. All Rights Reserved. | Sponsored by South Carolina REALTORS®. | Report © 2022 ShowingTime.
$200,000 4-2014
42
10-2014
4-2015
10-2015
4-2016
10-2016
4-2017
10-2017
4-2018
10-2018
4-2019
10-2019
4-2020
10-2020
4-2021
10-2021
843-816-1128 ken@carsonrealtysc.com www.kroupabush.carsonrealtysc.com Current as of April 10, 2022. Data © 2022 MLS of Hilton Head Island. All Rights Reserved. | Sponsored by South Carolina REALTORS®. | Report © 2022 ShowingTime.
