A Research Tool Provided by the Multiple Listing Service of Hilton Head Island and the Hilton Head Area Association of REALTORS®
Windmill Harbour Real Estate Market Report
Local Market Update – March 2022 A Research Tool Provided by the Multiple Listing Service of Hilton Head Island and the Hilton Head Area Association of REALTORS®
Local Market Update – March 2022 Windmill Harbour Real Estate Market Report A Research Tool Provided by the Multiple Listing Service of Hilton Head Island and the Hilton Head Area Association of REALTORS®
Windmill Harbour | March 2022
Windmill Harbour Local Market Update – March 2022 March Local Market Update – March 2022
Local Market Update – March 2022 A Research Tool Provided by the Multiple Listing Service of Hilton
Windmill Harbour
A Research Tool Provided by the Multiple Listing Service of and the Hilton Area of REALTORS® AIsland Research Tool by the Head Multiple Listing Association ServiceofofREALTORS® Hilton Head Head Island and theProvided Hilton Head Area Association HeadTool Island and thebyHilton Head Area Association of REALTORS® A Hilton Research Provided the Multiple Listing Service of 2022 Hilton Head Island and the Hilton Head Area2021 Association of REALTORS®
Key Metrics
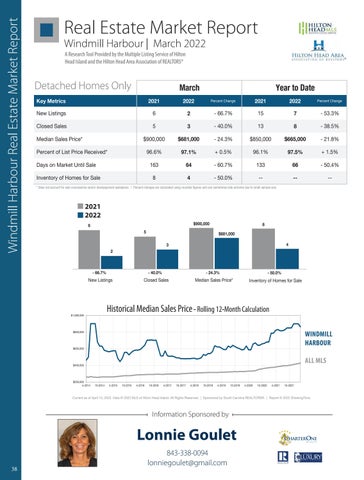
6 2 Detached Homes Only Windmill Harbour
New Listings
Windmill Harbour Harbour Windmill
Closed Sales
5
Key Metrics
2021
Key Metrics
Median Sales Price*
$900,000
New Listings
Percent of List Price Received*
6
Closed Sales
Key Metrics Key Metrics Days on Market Until Sale Key Metrics
3
Closed Sales
5
2021
2022
Percent Change
- 66.7%
15
7
Year to Date
8
- 38.5%
- 40.0%
2022
- 24.3%
March
13
Percent Change
2021
2022
2
- 53.3%
2021
2022 Percent Change
$665,000
$850,000
-666.7%
+ 0.5% 96.1% March March March 540.0% 3 Percent Change 2022 2021
97.1%
96.6%
Percent Change
March
$681,000
New Listings
Year to Date
2021
- 21.8%
- 66.7% 7
15
2
Year to Date Percent Change
2022
15 - 53.3%
+ 1.5% 97.5% Year to DateYear to Date Year - 40.0% 8 13 - 38.5% 13 to Date
3
P
7 8
Percent Change 2021 2022 Percent Change Percent Change 2021 2022 2021 2022 - 60.7% 133 2021 - 50.4% 64 66 Percent Change Percent Change 2021 2022 2022 Median Sales Price* $900,000 24.3% $850,000 $681,000 $665,000 New Listings 66 - 66.7% 15 - 53.3% 2 Median Sales Price* $900,000 - 24.3% $850,000 -- 21.8% $681,000 $665,000 New Listings - 66.7% 1577 53.3% 2 64 - 53.3% 2- 50.0% - 66.7% Inventory of Homes forNew SaleListings 8 -- 15 --7 -Percent of List Price Received* 96.6% 96.1% 97.5% Closed Sales 5 - 40.0% 1397.1% - 38.5% 3 8 + 0.5% * Does notPercent account for saleClosed concessions and/or downpayment using rounded can3sometimes small sample13 size. Sales -to 40.0% 138 -+38.5% 3 look -extreme 8 of List Price Received* 96.6% +due0.5% 96.1% 1.5% Closed Sales assistance. | Percent changes are calculated 5 5 figures and97.1% 40.0% -97.5% 38.5% Days on Market Until Sale 163 133 64 66 Median Sales Price* $900,000 - 24.3% $850,000 - 21.8% $681,000 $665,000- 60.7% Sales Price* $900,000 $850,000 $850,000 -$665,000 21.8% $665,000 Sales $900,000 $681,000 - 24.3% 21.8% $681,000- 24.3% Days on Median MarketMedian Until Price* Sale 163 - 60.7% 133 -- 50.4% 64 66 Percent of List Price Received* of Homes for 96.6% + 0.5% 96.1% 4 + 1.5%2022 97.1% 97.5%- 50.0% Inventory Sale 8 --2021 List Price Received* 96.6% + 97.5% 1.5% 97.1% 97.5% Percent Percent of List of Price Received* 96.6% 96.1% + 1.5% 97.1% + 0.5% + 0.5%96.1%
163
March
* Does not account for sale concessions8and/or downpayment assistance. calculated using rounded figures extreme Inventory of Homes Sale Until - are 50.0% --and66can sometimes look -4 | Percent -changes -- due to small sample size. Daysfor on Market Sale 163 60.7% 133 - 50.4% 64
64 163 $900,000 64
Days on Market Until Sale
163
Days on Market Until Sale
- 60.7%
66 8 133
133
- 60.7%
- 50.4%
6 not account for sale concessions and/or downpayment assistance. | Percent changes are calculated using rounded figures and can sometimes look extreme due to small sample size. * Does Inventory of Homes for Sale Inventory of Homes for5Sale
4 4
8 8
- 50.0% - 50.0%
---
---
March Inventory* Does of notHomes Sale 8calculated using rounded figures4and can$681,000 - 50.0% account for salefor concessions and/or downpayment assistance. | Percent changes are sometimes look extreme due to small sample size.
--
* Does not account for sale concessions and/or downpayment assistance. | Percent changes are calculated using rounded figures and can sometimes look extreme due to small sample size.
March
2021
* Does not account for sale concessions and/or downpayment assistance. | Percent changes are calculated using rounded figures and can sometimes look extreme due to small sample size.
March
6
5
New Listings
5
55
- 40.0%
5
Closed 22
2 66.7% Historical Median Sales- -66.7% Price
New Listings New Listings
3
Closed Sales Sales Closed
Historical Median Sales Price Closed SalesSales Closed
Historical HistoricalMedian MedianSales SalesPrice Price Rolling Rolling 12-Month 12-Month Calculation Calculation
Median Sales Price* - 24.3% - 24.3%
--50.0% 50.0% All MLS —
Rolling 12-Month Calculation Median Sales Price* Median Sales Price*
$800,000 $200,000 4-2014
- 50.0%
Inventory of Home
Inventory Sale Inventoryof ofHomes Homes for for Sale AllMLS MLS — — All WindmillHarbour Harbour — — Windmill
A Windmill Ha
All MLS — All MLS — Windmill Harbour —
Windmill Harbour —
WINDMILL HARBOUR
$800,000 $800,000
$1,000,000 $800,000
4
Inventory of for InventoryWindmill ofHomes Homes forSale Sale Harbour -— -50.0% 50.0%
$800,000
$400,000
4
Historical Median Sales Price - Rolling 12-Month Calculation
$1,000,000 $1,000,000
$1,000,000
2022
44
Historical Median 12-Month Calculation Historical Median SalesSales PricePrice RollingRolling 12-Month Calculation
$600,000
2021
Median Sales Price*
$1,000,000
$800,000
2022 8
- 24.3%
- 24.3%
20
2021 2022 2022
Inventory of Homes for Sale
Closed Sales
- 40.0% - 40.0%
--
8
- 40.0%
40.0% Rolling 12-Month Calculation --40.0%
--
8
- 50.0%
$681,000
Median Sales Price*
New Listings
NewListings Listings New
$1,000,000
- 24.3%
33
- 66.7%
2
- 66.7%- 66.7%
3
Sales
- 50.4%
$681,000
88
3 $900,000 $681,000 $681,000 $681,000
2
4
2021 2021
$900,000 $900,000 $900,000
66
6
- 66.7%
$900,000
3
6
March 2022 2 March
66
---
$600,000
$600,000 $600,000
ALL MLS
$400,000
$400,000 $400,000
$600,000
10-2014
4-2015
$600,000 $400,000
10-2015
4-2016
10-2016
4-2017
$200,000 $200,000 $200,000 4-2014 10-2014 4-2015 10-2015 4-2016 4-2014 10-2014 4-20154-2014 10-2015 10-2014 4-2016
10-2017
4-2018
10-2018
4-2019
10-2016 4-2017 10-2017 4-2018 10-2018 4-2015 4-2017 10-2015 10-2016 10-20174-2016 4-2018 10-2016 10-2018
10-2019
4-2020
10-2020
4-2021
4-2019 10-2019 4-2020 10-2020 4-2021 4-2017 10-2019 10-2017 4-2019 4-2020 4-2018 10-2020 10-2018 4-2021
10-2021 10-2021 4-2019 10-2021
10-2019
4-2020
10-2020
4-2021
1
Current as of April 10, 2022. Data © 2022 MLS of Hilton Head Island. All Rights Reserved. | Sponsored by South Carolina REALTORS®. | Report © 2022 ShowingTime.
$400,000
$200,000 4-2014
$200,000 4-2014
10-2014
Current as of April 10, 2022. Data © 2022 MLS of Hilton Head Island. All Rights Reserved. | Sponsored by South Carolina REALTORS®. | Report © 2022 ShowingTime. Current as of April 10, 2022. Data © 2022 MLS as of Hilton Head10, Island. All Rights | Sponsored by South | Report © 2022 ShowingTime. Current of April 2022. Data Reserved. © 2022 MLS of Hilton HeadCarolina Island.REALTORS®. All Rights Reserved. | Sponsored by South Carolina REALTORS®. | Report © 2
10-2014
4-2015
4-2015
10-2015
4-2016
4-2017 10-2017 4-2018 10-2018 Information Sponsored by
10-2016
4-2019
10-2019
4-2020
10-2020
4-2021
10-2021
Lonnie Goulet
10-2015 10-2016 4-2017 10-2018 4-2019 10-2019 10-2020 4-2021 10-2021 Current as of4-2016 April 10, 2022. Data © 2022 MLS of10-2017 Hilton Head 4-2018 Island. All Rights Reserved. | Sponsored by South4-2020 Carolina REALTORS®. | Report © 2022 ShowingTime.
843-338-0094 lonniegoulet@gmail.com
Current as of April 10, 2022. Data © 2022 MLS of Hilton Head Island. All Rights Reserved. | Sponsored by South Carolina REALTORS®. | Report © 2022 ShowingTime.
38
