Local Market Update – March 2022
Indigo Run Real Estate Market Report
A Research Tool Provided by the Multiple Listing Service of Hilton Head Island and the Hilton Head Area Association of REALTORS®
A Research Tool Provided by the Multiple Listing Service of Hilton Head Island and the Hilton Head Area Association of REALTORS®
Local Market Update – March 2022 Real Estate Market Report Indigo Run Indigo Run | March 2022 Local Market Update – March 2022 Indigo Run Local Market Update – March 2022 A Research Tool Provided by the Multiple Listing Service of Hilton Head Island and the Hilton Head Area Association of REALTORS®
A Research Tool Provided by the Multiple Listing Service of Hilton
Indigo Run
A Research Tool Provided by the Multiple Listing Service of Islandandand Hilton Area Association of REALTORS® Hilton Head Head Island thethe Hilton HeadHead Area Association of REALTORS®
Local Market Update – MarchMarch 2022 A Research Tool Provided by the Multiple Listing Service of
Year to Date
A Research Tool Provided by the Multiple Listing Service of Hilton Head Island and the Hilton Head Area Association of REALTORS® Hilton Head Island and the Hilton Head Area Association 2021 of REALTORS® 2022
Key Metrics
Detached Homes Only New Listings Indigo Run
Indigo Run Run Indigo
Closed Sales Key Metrics
Key Metrics
Median Sales Price*
5
3
6 2021
1
$768,500
New Listings
New Listings
Percent of List Price Received*
100.2%
Closed Sales
2022
15
7
2022 - 83.3%Percent Change 21
2021 6
March- 40.0%
$1,400,000
5
112.0%
March
2021
+ 82.2%
3
March + 11.8%
March March 1
2022
$756,000
-540.0%
99.3%
Days on Market UntilKey Sale KeyMetrics Metrics
2021
2022
2021 49 2021
101
2022 2022
-683.3%
Percent Change
- 53.3% Year to Date - 71.4% 2022
Percent Change
$842,500
15
3
- 40.0%
101.2%
Year to Date Percent Change
+ 11.4%
2021
7
2022
15 - 53.3%
7
Year +to1.9% Date
Year - 83.3% 6 21 to Date
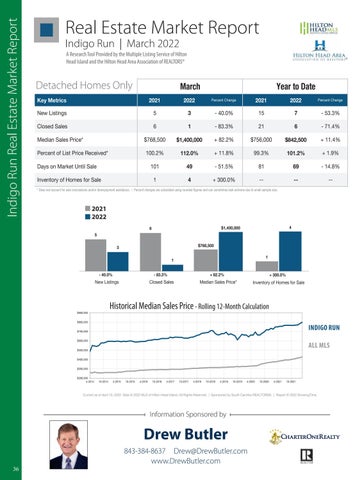
21 - 71.4% 6 Percent Change 2021 2022 - Change 14.8% Percent 69 Percent Change 2022 Median Sales Price* $768,500 + 82.2% $756,000 $1,400,000 $842,500 Median Sales Price* $768,5005 $1,400,000 + 82.2% $756,000 +- 11.4% $842,500 New Listings - 40.0% 15 53.3% 3 7 New Listings 5 40.0% 53.3% 3 7 New Listings 5 40.0% 15 53.3% 3 Inventory of Homes for Sale 1 + 300.0% --4 -Percent of List Price Received* 100.2% + 11.8% 99.3% 112.0% 101.2% Closed Sales - due 83.3% 21 6 -+71.4% 1 6 *Percent Does not accountof for List sale concessions and/or downpayment calculated using and1can look to small sample Price Received* +extreme 11.8% 1.9% 112.0% 101.2% Closed Sales assistance. | Percent changes are100.2% 83.3% -- 71.4% Closed Sales 666rounded figures -- 83.3% 21 size.99.3% 71.4% 1 sometimes Days on Market Until Sale 101 - 51.5% 81 49 69 Median Sales $768,500 $756,000 $756,000 + 11.4% 11.4% Median Sales Price* $768,500 + 82.2% + 11.4% $1,400,000 $1,400,000++ 82.2% Median SalesPrice* Price* $768,500 82.2% +$842,500 $1,400,000 $842,500 Days on Market Until Sale 101 - 51.5% 81 - 14.8% 49 69 Inventory of Homes for Sale 1 + 300.0% -4 -2021 ofofList Price 100.2% 1.9% 2022 112.0% Percent List PriceReceived* Received* 100.2% 11.8% ++101.2% 1.9% 112.0% 101.2% Percent ofPercent List Price Received* 100.2% + 11.8%99.3% 99.3% + 1.9% 112.0% ++ 11.8% Closed Sales
Key Metrics
6
2021
Percent Change
Percent Change
51.5% Percent Change Change Percent
1
812021
March
downpayment assistance. | Percent changes are calculated using rounded figures and can sometimes look extreme due to small sample size. Inventory of Homes for Sale * Does not account for sale concessions1and/or101 + 300.0% 81 -- 69 -449 -Days on Market Until Sale - 51.5% - 14.8%
Days on Market Until Sale Days on Market Until Sale 6
49 49
101 101
- 51.5%
- 51.5% $1,400,000
8169
81
- 14.8% 69
5 Inventory of Homes for Sale March 1 + 300.0% 4 * Does not account for sale concessions and/or downpayment assistance. | Percent changes are calculated using rounded figures and can sometimes look extreme due to small sample size. Inventory InventoryofofHomes Homesfor forSale Sale
44
11
++ 300.0% 300.0%
---
--
- 14.8%
4
* Does not account for sale concessions and/or downpayment assistance. | Percent changes are calculated using rounded figures and can sometimes look extreme due to small sample size.
---
---
--
20
--
* Does not account for sale concessions and/or downpayment assistance. | Percent changes are calculated using rounded figures and can sometimes look extreme due to small sample size.
* Does not account for sale concessions and/or downpayment assistance. | Percent changes are calculated using rounded figures and can sometimes look extreme due to small sample size.
March
March
$768,500
3 2021 March March 2022 5
5
6
5
5
- 40.0%5
New Listings
3
3
6
- 83.3% 3
$1,400,000 $1,400,000 $768,500 $1,400,000
3 $768,500
- 83.3%
4
1 1
+ 82.2%
Rolling 12-Month + 82.2%Calculation Median Sales Price*
+ 300.0%
Historical Median Sales Price - Rolling 12-Month Calculation
Historical Median$800,000 Sales Price
Historical Median Sales Price
$600,000 $500,000
$400,000 $900,000 $300,000
$800,000
$900,000
$700,000
$700,000 $600,000
$600,000
$800,000
$600,000 $500,000
$700,000
$500,000 $400,000
$600,000
$400,000 $300,000
$800,000
$200,000 $700,000 4-2014
10-2014
$500,000
$600,000
$700,000
$400,000
$500,000
$300,000
$400,000
$200,000 4-2014
A Indi
— Inventory of Homes for Sale — All MLS All MLS Indigo Run Indigo Run
— —
Rolling 12-Month Calculation
$900,000
$800,000
Inventory of Home
Inventory of Homes for Sale
$900,000 $900,000
+ 300.0%
+ 300.0% All MLS — Inventory of Homes for Sale Indigo Inventory of Homes forRun Sale— + 300.0%
Median Sales Price* Median Sales Price* + 82.2%
New Listings Closed Historical Median Sales Price Sales Rolling 12-Month Calculation Median Sales Price*
$700,000
1
1 Median Sales1Price* + 300.0%
+ 82.2%
Closed Sales Closed Sales - 83.3%
New Listings Sales Calculation Historical Median Sales PriceClosed Rolling 12-Month
$800,000
2022
4
Inventory of Homes for Sale
Closed+ 82.2% Sales
Historical -Median 83.3% Sales Price
- 40.0%
1
$768,500 - 83.3%
1 1
New 12-Month Listings 1 1 - 83.3% Rolling Calculation
New Listings New Listings - 40.0%
2021
44
+ 300.0%
Median Sales Price* $768,500
- 40.0%
2022
2022 2022
$1,400,000
+$768,500 82.2%
Closed Sales
3
- 40.0% Historical Median Sales Price - 40.0%
$900,000
1
1
6 6
6
$1,400,000 2021
2021 2021
All MLS —
Rolling 12-Month Calculation
Indigo Run — INDIGO All MLSRUN —
Indigo Run —
ALL MLS
$500,000 $400,000 $300,000
4-2015 4-2016 10-2016 4-2017 10-2017 4-2018 10-2018 4-2019 10-2019 4-2020 10-2020 4-2021 10-2021 $300,000 10-2015 $200,000 4-2014 10-2014 4-2015 10-2015 4-2016 10-2016 4-2017 10-2017 4-2018 10-2018 4-2019 10-2019 4-2020 10-2020 4-2021 10-2021 $200,000 $200,000 4-2014 10-2015 10-2014 4-20164-201810-2016 10-2017 4-2020 4-2018 4-2019 10-2019 4-2014 10-2014 4-2015 4-2016 4-2015 10-2016 10-2015 4-2017 10-2017 10-2018 4-2017 4-2019 10-2019 10-202010-2018 4-2021 10-2021
4-2020
10-2020
4-2021
Current as of April 10, 2022. Data © 2022 MLS of Hilton Head Island. All Rights Reserved. | Sponsored by South Carolina REALTORS®. | Report © 2022 ShowingTime. Current as of April 10, 2022. Data © 2022 MLS of Hilton Head Island. All Rights Reserved. | Sponsored by South Carolina REALTORS®. | Report © 2022 ShowingTime.
Current as of April 10, 2022. DataCurrent © 2022 MLS Island. All Rights | Sponsored SouthIsland. Carolina All REALTORS®. | Report © 2022 ShowingTime. as of ofHilton AprilHead 10, 2022. Data © Reserved. 2022 MLS of HiltonbyHead Rights Reserved. | Sponsored by South Carolina REALTORS®. | Report ©
10-2014
4-2015
10-2015
$300,000
4-2016
4-2017 10-2017 4-2018 10-2018 Information Sponsored by
10-2016
Drew Butler
4-2019
10-2019
4-2020
10-2020
4-2021
10-2021
Current as of April 10, 2022. Data © 2022 MLS of Hilton Head Island. All Rights Reserved. | Sponsored by South Carolina REALTORS®. | Report © 2022 ShowingTime.
$200,000 4-2014
36
10-2014
4-2015
10-2015
4-2016
10-2016
4-2017
10-2017
4-2018
10-2018
4-2019
10-2019
843-384-8637 Drew@DrewButler.com www.DrewButler.com
4-2020
10-2020
4-2021
10-2021
Current as of April 10, 2022. Data © 2022 MLS of Hilton Head Island. All Rights Reserved. | Sponsored by South Carolina REALTORS®. | Report © 2022 ShowingTime.
35
