Hilton Head Island and the Hilton Head Area Association of REALTORS®
Local Market Update – March 2022
A Research Tool Provided by the Multiple Listing Service of Hilton Head Island and the Hilton Head Area Association of REALTORS®
Hilton Head Plantation | March 2022
March Year to Date HiltonLocal Head Plantation Market 2022 Local MarketUpdate Update– March – March 2022 Hilton Head Plantation
Local Market Update – March 2022 A Research Tool Provided by the Multiple Listing Service of Hilton A Research Tool Provided by the Multiple Listing Service of Head Island and thebyHilton Head Area Association of REALTORS® Hilton Head and Hilton Head Area Association of REALTORS® AIsland Research Toolthe Provided the Multiple Listing Service of A Research Tool Provided by the Multiple Listing Service of 2021of REALTORS® 2022 Hilton HeadHead Island and and the Hilton HeadHead AreaArea Association Hilton Island the Hilton Association of REALTORS®
Key Metrics
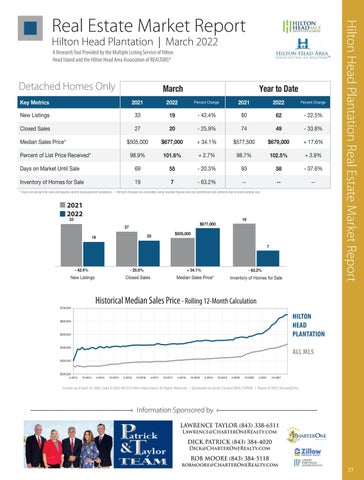
New Listings
Percent Change
2021
2022
Percent Change
- 42.4%
80
62
- 22.5%
19
33
Detached Homes OnlyPlantation 27 - 25.9% 20 March Hilton Head Hilton Head Plantation
Hilton Head Plantation
Closed Sales
74
March
Year -to33.8% Date
49
Year to Date
$505,0002021 $677,000 2022+ 34.1%Percent $577,5002022 2021 + 17.6% 2021 $679,000 Percent Change 2022 Percent Change 2022 Key Metrics 2021 Change
Median Sales Price* Key Metrics
Percent of List Price Received*
New Listings98.9%
Days on Market Until Sale
Closed Sales 69
Inventory of Homes New forNew Sale Listings Listings
Median Sales 19 Price*
New Listings
KeyKey Metrics Metrics Key Metrics Closed Sales
New Listings
Median Sales Price*
101.6%
33
55
2021 2021 272021
+ 2.7% 98.7% 19 3.9% 80 102.5% - 42.4% + 80 19March -3342.4% Year62to Date - 22.5% March YearYear to Date March to Date - 20.3% 27
93
58 - 25.9% - 37.6%
20
Change Change Percent Change 2022 20212021 2022 2022PercentPercent - 25.9% 20
74
2022 49
2022 2022 2021 74
PercentPercent ChangeChange
62
Percent of List Price Received* 27 27 27 Percent of List Price Received* 98.9% Median Sales Price* $505,000 Days on Market Until Sale Median Sales Price* $505,000 Median Sales Price* $505,000 Percent of List Price Received* 98.9% of List Price Received* Inventory of Homes for Sale Days on Market Percent Until Sale 6998.9% 98.9% 33 Percent of List Price Received* Closed Sales Closed Sales
Closed Sales
March
* Does not account for sale concessions and/or assistance. Days Market Until 69 Days on on Market Until SaleSale 69 downpayment 55 55 |
InventoryDays of Homes for Sale on Market Until Sale 27
19
Inventory of Homes Inventory of Homes for for SaleSale
+ 34.1%
$577,500
Percent changes are calculated using look -extreme due to small sample size. - 20.3% 93 figures and 37.6% - 20.3% 93 rounded - 37.6% 58 can58sometimes
7 55 7
69
19 19
$677,000
- 63.2% - 20.3%
- 63.2%
--93
--
--
- 63.2% -7 -$505,000 * Does not account for sale concessions assistance. | Percent changes arechanges calculated using rounded figures cansometimes sometimes look extreme to small 20 * Does notand/or account downpayment for sale concessions and/or downpayment assistance. | Percent are calculated using rounded figures and can look extreme due to smalldue sample size. sample size. March Inventory of for Sale - 63.2% -7canandsometimes * 19 Does notHomes account for sale concessions and/or downpayment assistance. | Percent changes are19 calculated using rounded figures and look extreme due to small sample size.
--
* Does not account for sale concessions and/or downpayment 33 assistance. | Percent changes are calculated using rounded figures and can sometimes look extreme due to small sample size.
2021 March March
March
33
- 42.4%
33
33 19
New Listings
19
20
20 20
19 - 42.4%
- 42.4%
- 25.9% Historical Median Sales Price
Historical Rolling 12-Month - 42.4% - 25.9% New ListingsMedian Sales Price Closed Sales Calculation
19
2021
2022
2021
2022
19
77
- 63.2% All MLS — Median Sales Price* - 63.2%
- 37.6% --
20
- 63.2%
Inventory of Homes for S
Hilton of Head Plantation — Inventory Homes for Sale Inventory of Homes for Sale
+ 34.1%
+ 3.9%
7
+ 34.1%
Median Sales Price* Median Sales Price*
+ 17.6
2021
7
+Sales 34.1% Closed + 34.1%
Closed Sales Closed Sales
--
Inventory of Homes7for Sale
- 25.9%
New Listings - 25.9%
New Listings New Listings
--
19
- 63.2%
$677,000
Median$505,000 Sales Price* $505,000
Rolling 12-Month -Calculation 25.9%
- 42.4%
$677,000
$505,000 + 34.1% $505,000
20
-- 37.6%
--
2021 2022 $677,000 2022
19 $505,000 19
$677,000 20 $677,000
2719
27 27 Closed Sales
19
Historical Median Sales- 42.4% Price $700,000
- 25.9%
27
--58
7
2021
27
2022 33
March
- 33.8%
+ 34.1% $679,000 -- $577,500 - 22.5% - 22.5% - 22.5% 62 + 17.6% $679,000 98.9% 102.5% - 25.9% 74 - 33.8% 98.7% - 25.9% 74 101.6% - 33.8% 20 20 49 49+ 2.7% - 25.9% 74 - 33.8% 20 49 + 2.7%$577,500 101.6% 102.5% + 34.1% $577,500 + 17.6% $677,000 + 34.1% $679,000 69 - 20.3% 93 + 3.9% 55 98.7% 58 + 17.6% $677,000 $679,000 + 34.1% $577,500 + 17.6% $677,000 $679,000 2021 2022 + 2.7% 98.7% + 3.9% 101.6% 102.5% + 2.7% + 3.9% 101.6% - 63.2% -- - 37.6% --1920.3% 98.7% 7 102.5% 93 55 58 + 2.7% 98.7% + 3.9% 101.6% 102.5% 19 $505,000
$677,000
* Does not account for sale concessions and/or downpayment assistance. | Percent changes are calculated using rounded figures and can sometimes look extreme due to small sample size.
Percent Cha
- 22.5%
49
- 33.8%
Percent Change
63.2% --80$677,000 -- 42.4% 80 - 42.4% 19 19-19 62 - 42.4% 80 62
33 7 33 33
$505,000
Hilton Head Plantation Real Estate Market Report
Local Market Update – March 2022 Hilton Real Head Estate Plantation Market Report A Research Tool Provided by the Multiple Listing Service of Hilton Head Island and the Hilton Head Area Association of REALTORS®
- 63.2%
Rolling 12-Month Calculation + 34.1% Median Sales Price*
All MLS — —
63.2% Inventory All MLS- of — Homes for Sale
$600,000
Historical Median Sales Price Rolling 12-Month Calculation Hilton Head Plantation All MLS — — Hilton Head Plantation Historical Median Rolling Sales 12-Month Calculation New Listings Closed Sales Sales Price -Median Price* Inventory Hilton Head Plantation — of Homes for Sale $700,000
$500,000
Historical Median Sales Price
$700,000
$700,000
$600,000
Historical Median Sales Price $600,000
$400,000
$700,000
Rolling 12-Month Calculation
HILTON HEAD All MLS — PLANTATION
All MLS — Hilton Head Plantation —
$600,000
$500,000
Rolling 12-Month Calculation
$500,000
Hilton Head Plantation —
$500,000
$300,000
$700,000
$200,000 4-2014 $600,000
$600,000
$400,000
$300,000
$500,000
10-2014 $400,000
$500,000
$300,000 4-2015
10-2015
$300,000 4-2016
10-2016
4-2017
10-2017
4-2018
10-2018
4-2019
10-2019
4-2020
10-2020
4-2021
10-2021
$200,000 4-2014 10-2014 4-2015 10-2015 4-2016 10-2016 4-2017 10-2017 4-2018 10-2018 4-2019 10-2019 4-2020 10-2020 4-2021 10-2021 $200,000 $200,000 4-2014 10-2014 4-2015 4-2014 10-2015 10-2014 4-2016 10-2016 4-2017 10-2017 4-2018 10-2018 4-2019 10-2019 4-2020 10-2020 4-2021 10-2021 4-2015 10-2015 4-2016 10-2016 4-2017 10-2017 4-2018 10-2018 4-2019
10-2019
Current as of April 10, 2022. Data © 2022 MLS of Hilton Head Island. All Rights Reserved. | Sponsored by South Carolina REALTORS®. | Report © 2022 ShowingTime.
$300,000
$400,000
ALL MLS
$400,000
$400,000
4-2020
10-2020
4-2021
10-2021
Current as of April 10, 2022. Data © 2022 MLS of Hilton Head Island. All Rights Reserved. | Sponsored by South Carolina REALTORS®. | Report © 2022 ShowingTime.
Current as of April 10, 2022. Data © 2022 MLS of Hilton Head Island. All Rights Reserved. | Sponsored by South Carolina REALTORS®. | Report © 2022 ShowingTime.
$200,000 4-2014
Current as of April 10, 2022. Data © 2022 MLS of Hilton Head Island. All Rights Reserved. | Sponsored by South Carolina REALTORS®. | Report © 2022 Showi
10-2014
4-2015
10-2015
4-2016
Information Sponsored by 4-2017 10-2017 4-2018 10-2018
10-2016
$300,000
4-2019
10-2019
4-2020
10-2020
4-2021
10-2021
LAWRENCE TAYLOR (843) 338-6511
Current as of April 10, 2022. Data © 2022 MLS of Hilton Head Island. All Rights Reserved. | Sponsored by South Carolina REALTORS®. | Report © 2022 ShowingTime. Lawrence@CharterOneRealty.com
$200,000 4-2014
10-2014
4-2015
10-2015
4-2016
10-2016
4-2017
10-2017
4-2018
DICK PATRICK (843) 384-4020 10-2018
4-2019
10-2019
4-2020
10-2020
Dick@CharterOneRealty.com
4-2021
10-2021
ROB MOORE (843) 384-5118
robmoore@CharterOneRealty.com
Current as of April 10, 2022. Data © 2022 MLS of Hilton Head Island. All Rights Reserved. | Sponsored by South Carolina REALTORS®. | Report © 2022 ShowingTime.
33
