Local Market Update – March 2022
y Metrics
w Listings
2021
2022
Percent Change
2021
2022
14
5
- 64.3%
39
16
osed Sales
-Local 59.0% Market
Update – March 2022
A Research Tool Provided by the Multiple Listing Service of Hilton Head Island and the Hilton Head Area Association of REALTORS®
Real Estate Market Report
dian Sales Price*
rcent of List Price Received*
25
- 24.2%
$1,750,000
$2,197,500
+ 25.6%
$1,350,000
$1,880,000
+ 39.3%
95.7%
99.4%
+ 3.9%
97.1%
98.3%
111
103
- 7.3%
107
113
5
- 61.5%
Local Market Update – March 2022 A Research Tool Provided by the Multiple Listing Service of Palmetto Dunes Hilton Head Island and the Hilton Head Area Association of REALTORS® + 1.2% Detached Homes Only + 5.8%
PalmettoUpdate Dunes– March | March 2022 Palmetto Local MarketDunes 2022
ys on Market Until Sale
-A Research Tool Provided by the Multiple Listing Service of Hilton
entory of Homes for Sale
13
--
Palmetto Dunes
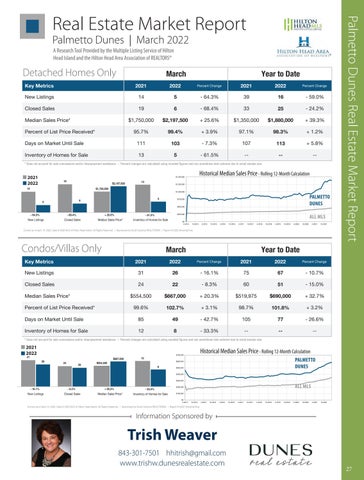
Detached Homes Only
Local Market Update – March 2022 Detached Homes Only 19
2021
2022
Percent Change
2021
2022
New Listings
14
5
- 64.3%
39
16
- 59.0%
Sales 2021Closed 2022
19
6
- 68.4%
33
25
- 24.2%
$1,750,000
$2,197,500
95.7%
99.4%
$2,197,500
Key Metrics
14
New Listings Palmetto Dunes Detached Homes OnlyKey Metrics 6
Sales Local MarketClosed Update – March 2022
New Listings
March
Research Tool Provided by the Multiple Listing Service of 64.3% Hilton Head-Island and the Head Area Association REALTORS®2021 Median Sales- of68.4% Price* KeyHilton Metrics
Median Sales Price* Percent of List Price Received*
2021
$1,750,000
5 Detached Homes Only
March
13
Palmetto Dunes
A Research Tool Provided by the Multiple Listing Service of Hilton Head Island and the Hilton Head Area Association of REALTORS®
2022 5
- 64.3%
Percent 2022 Days on Market Until Sale Change
55
March
19
6 March
13
- 64.3%
Year to Date
2021 103
111
Inventory of Homes for Sale
14
$1,350,000
$1,880,000
+ 39.3%
+ 3.9%
97.1%
98.3%
+ 1.2%
2022
- 7.3%
5
39
$1,750,000 2021 2022
2021
2022
- 68.4%
14
March - 61.5%
- 61.5%
$2,197,500 14
Percent Change
33
5
19
Percent + 5.8% 113 Change
107
- 59.0%
--
2021
25
- 64.3%
Year to Date
--
--
16
39
Year to Date $2,197,500
$1,880,000 - 68.4% 6$1,350,000$1,750,000
+ 25.6% 19
Percent Change
+ 25.6%
* Does not account for sale concessions and/or downpayment assistance. | Percent changes are calculated using rounded figures and can sometimes look extreme due to small sample size.
Year to Date
+ 25.6%
Percent Change
Year to Date
Key Metrics
Hilton Head Island and the Hilton Head Area Association of REALTORS®
arch
March
--
A Research Tool Provided by the Multiple Listing Service of Detached Homes Only Head Island and the Hilton Head Area Association of REALTORS®
s not account for sale concessions and/or downpayment assistance. | Percent changes are calculated using rounded figures and can sometimes look extreme due to small sample size.
Palmetto Dunes Real Estate Market Report
A Research Tool Provided by the Multiple Listing Service of Hilton Head Island and the 19 Hilton Head6Area Association - 68.4% of REALTORS® 33
Percent Change
- 24.2% 2021
2022 2022
16
13
33 + 39.3%
Percent Ch
- 59.0
25 Percent Change 2021 2022 5 Percent of List Price Received* 95.7% + 3.9% $2,197,500 97.1% + 1.2%$1,880,000 6 Closed Sales 19 - 68.4% 33 - 24.2% 99.4% 6 25 Median Sales Price* $1,750,000 + 25.6%98.3% $1,350,000 5 New Listings 14 - 64.3% 39 - 59.0% 5 16 Median Sales Price* $1,750,000 + 25.6% $1,350,000 + 39.3% $2,197,500 $1,880,000 storical MedianDays Saleson Price Rolling 12-Month Calculation All MLS — Market Until Sale 111 - 7.3% 103 Percent of List Price Received* 95.7% + 3.9% 113 97.1%+ 5.8% 98.3% 99.4% 107 Percent of List Price Received* + 3.9% 97.1% 99.4% 98.3% Palmetto Dunes6— - 64.3% + 25.6% 25 - 61.5% Closed Sales 95.7% 19 + 1.2% - 68.4% - 68.4% 33 - 24.2% Condos / Villas Only New Listings Sales Median Sales Price* Inventory of Homes for Sale Days on Market Until Sale 111 - 7.3% + 5.8% 0,000 Inventory of Homes for Sale 103 13113 - 61.5% Closed -5 Days on Market 107 Until Sale 111 - 7.3% -107 103 -113 Sales Price* $1,750,000 + 25.6% $1,350,000 + 39.3% $2,197,500 $1,880,000 Inventory of HomesMedian for Sale 13 - 61.5% --5 -* Does not account for sale concessions and/or downpayment figures and can sometimes look extreme due to small sample size. March assistance. | Percent changes are calculated Yearusing to rounded DateHistorical 0,000 Median Inventory of Homes for Sale 13 Sales Price Rolling512-Month Calculation - 61.5% -All MLS — -Percent of List Price Received* 95.7% 2022 99.4% + 3.9% 97.1% + 1.2% 98.3% Palmetto Dunes — Percent Change Percent Change Key Metrics 2021 2022 2021 0,000 Historical Median Sales Price Rolling 12-Month Calculation * Does not account for sale concessions and/or downpayment assistance. | Percent changes are calculated using rounded figures and can sometimes look extreme due to small sample size. March 2021 2022 $1,500,000 2021 New Listings - 16.1% 75 - 10.7% 26 67 19 31 Until Sale 13 111 Days on Market - 7.3%– March 2022 107 103 113 2021+ 5.8% 2022 0,000 $2,197,500 2022 $1,250,000 Local Market Update A Research Tool Provided by the Multiple Listing Service of New Listings New Listings
Sales Key Closed Metrics
Closed Sales Median Sales Price*
14
Percent Change
Inventory- 59.0% of Homes for Sale
2021
2022
16
39
Percent Change
Palmetto Dunes
* Does not account for sale concessions and/or downpayment assistance. | Percent changes are calculated using rounded figures and can sometimes look extreme due to small sample size.
Local March Market Update – March 2022
Closed Sales
March
24 60 22$1,750,000 - 8.3% Hilton Head Island andof theHomes Hilton Head of REALTORS® Inventory forArea SaleAssociation19 13 14
0,000
$554,500
$667,000
+ 20.3%
$519,975
Percent of List Price Received* 14
99.6%
102.7%
+ 3.1%
98.7%
$0 Days on 4-2014
85 - 4-2017 68.4%
49 4-2018
Median Sales Price*
51
A Research Tool Provided by the Multiple Listing Service of - 15.0%
5
- 61.5%
$690,000
$2,197,500
+ 32.7%
5
$750,000
6 * Does not account for sale concessions and/or downpayment assistance. | Percent changes are calculated using rounded 19 figures and can sometimes look extreme due to small sample size. 5
0,000
March Palmetto Dunes
Market Sale 10-2014 Until 4-2015 10-2015 - 64.3%
4-2016
10-2016
New Listings
10-2017
Closed Sales
nventory of Homes for Sale
14
- 42.7% 10-2018 4-2019 + 25.6% - 33.3%
--
Condos Villas Historical Median/Sales PriceOnly Rolling 12-Month Calculation
--
6
$1,750,000
- 26.6% Condos / Villas Only
$250,000 10-2021
--
$0 4-2014
10-2014
4-2015
10-2015
4-2016
10-2016
4-2017
4-2018 March
10-2017
31
Local Market Update – March 2022 26
New24Listings22 Key Metrics
$1,000,000
Palmetto Dunes New Listings $750,000
- 64.3%
Closed 2021 Sales
$500,000
Historical - 64.3%Sales Price Closed Sales Median
$250,000
$0 4-2014
4-2015
New Listings New$1,500,000 Listings
10-2015
4-2016
10-2016
4-2017
10-2017
10-2018
- 68.4%
Percent of List Price Received*
2022
Closed Sales + 20.3% 2021 2022 $554,500 4-2019
10-2019
4-2020
10-2020
4-2021
10-2021
Closed Sales
- 33.3%
$667,000
Percent Change
Median Sales Price*
31
$1,500,000
- 8.3%
24
60
— Palmetto Dunes —
00,000
00,000
85
Inventory of Homes for Sale
12
$1,500,000 Inventory of Homes for Sale
51
- 15.0%
$690,000
+ 32.7%
+ 25.6% + 3.1%
5
49
- 42.7%
105
8
- 33.3%
--
$1,000,000
--
2
5
101.8%
98.7%
+ 3.2%
- 61.5%
77
- 26.6%
--
--
12
98.7%
- 42.7%
105 - 8.3%
New Listings - 33.3%
Closed Sales
All MLS — Palmetto Dunes —
$554,500
22
+ 3.1%
- 16.1%
8
2022
101.8%
+ 3.2%
8
All MLS —
- 26.6% 77 Palmetto Dunes — + 20.3%
- 33.3%
Median Sales -Price*
--
Inventory of-Homes for Sale
*$750,000 Does not account for sale concessions and/or downpayment assistance. | Percent changes are calculated using rounded figures and can sometimes look extreme due to small sample size. $750,000
* Does not account for sale concessions and/or downpayment assistance. | Percent changes are calculated using rounded figures and can sometimes look extreme due to small sample size.
2021 March
Historical Median Sales Price
$1,250,000
2021
$500,000 2022
$1,000,000 March
00,000
24
10-2014
- 16.1%
4-2015
10-2015
4-2016
$250,000 New Listings
4-2015 - 8.3%
10-2016
4-2017
Closed Sales
$500,000
12
$667,000
$400,000
26
$0 $500,000 4-2014 10-2014
00,000
8
$250,000
31
$0 $300,000 $554,500 24 10-20164-2015 4-2016 10-2016 4-2017 4-2019 10-201710-2019 4-2018 4-2020 10-2018 10-2020 4-2019 10-2015 4-2014 4-2016 10-2014 4-2017 10-2017 4-2018 10-2018 22 10-2015
10-2017
4-2018
+ 20.3%
10-2018
4-2019
- 33.3%
10-2019
Median Sales Price*
4-2020
$200,000
10-2020
Inventory of Homes for Sale
4-2021
All MLS — Palmetto Dunes —
2021 2022 PALMETTO DUNES
$600,000
$554,500
22
$250,000 $750,000
00,000
$700,000
12
$667,000
26
Rolling 12-Month Calculation
Historical Median Sales Price - Rolling 12-Month Calculation
2022
$500,000
31
00,000
$0 4-2014
60
$519,975
102.7%
99.6%
Inventory of Homes for Sale
- 16.1% 75Carolina REALTORS®. - 10.7% 26 All Rights Reserved. 67 | Report © 2022 Current as of April 10, 2022. Data © 202231 MLS of Hilton Head Island. | Sponsored by South ShowingTime.
$1,000,000 Days on Market Until Sale
- 8.3%
+ 20.3%
Year to- 61.5% Date
60 15.0% 51- 61.5%All-MLS — 2021 Dunes — Median Sales Price* Inventory ofPalmetto Homes for Sale $667,000 +2620.3% $519,975 +12 32.7% $690,000
- 15.0% 102.7% 51 99.6% Historical Median Sales Price$519,975Rolling$690,000 12-Month Calculation $1,250,000 Median Sales Price* $554,500 + 20.3% + 32.7% $667,000 Historical Median Sales Price Rolling 12-Month Calculation $1,250,000 Days onReceived* Market Until 99.6% Sale 102.7% 85 49 All MLS Percent of List Price + 3.1% 98.7% + 3.2% 101.8%
00,000
22
$667,000
+ 5.8%
* Does not account for sale concessions and/or downpayment assistance. | Percent changes are calculated using rounded figures and can sometimes look extreme due to small sample size.
Rolling -12-Month Calculation 68.4% 24 22
Percent Change
24 22 Percent of List Price Received*
Closed Sales
5to 4-2021 10-2020 Year Date 10-2021
+ 25.6% - 8.3% Historical Median Price March Rolling 12-Month Calculation Year toSales Date
March 4-2018
New - 16.1% - 8.3%Listings Key Metrics Median Sales Price* 2021 10-2014
24
$554,500
+ 1.2%
Sales Inventory of Homes forChange Sale Percent ChangePrice* 2021 Percent 2022 8 Median 2022 Days on Market Until Sale 85 - 42.7% - 26.6% 49 77 Closed Sales Median Sales Price*105 Inventory of Homes for S Inventory of Homes for Sale 12 - 33.3% -8 -- 16.1% 75 - 10.7% -26 67
6
New Listings 31
Condos / Villas Only
+ 25.6%
Median Sales Price*
$667,000
$554,500
5
March 12
- 68.4%
A Research Tool Provided by the Multiple Listing Service of Hilton Head Island and the Hilton Head Area Association of REALTORS®
4-2020
$2,197,500 Percent Change Percent Change 2021 2022 2021 2022 6 Current as of April 10, 2022. Data © 2022 MLS of Hilton Head Island. All Rights Reserved. | Sponsored by South Carolina REALTORS®. | Report © 2022 ShowingTime. 31 - 16.1% 75 - 10.7% 26 67 $1,750,000 2022
Closed Sales
$1,250,000
10-2019
New Listings
2021
Condos/Villas Only - 64.3%
$1,500,000
4-2019
13
Key Metrics
All MLS — Palmetto Dunes —
5
14
MLS 2021 ALL2022 10-2018
+ 39.3
2021
--
PALMETTO DUNES 13
$2,197,500
+ 3.2%
$500,000
Inventory of Homes for Sale
19
5
77 4-2021
105 - 61.5% 4-2020 10-2020
10-2019
Median Sales Price*
8
12
$1,750,000 Palmetto Dunes
101.8%
Does not account for sale concessions and/orasdownpayment calculated rounded figures Reserved. and can sometimes look extreme due to Carolina small sample size. Current of April 10,assistance. 2022. Data| Percent © 2022changes MLS ofare Hilton Headusing Island. All Rights | Sponsored by South REALTORS®. | Report © 2022 ShowingTime.
March
13 --
--
$1,000,000 Hilton Head Island and the Hilton Head Area Association of REALTORS®
- 24.2
10-2021
10-2019 4-2021
4-2020 10-2021
ALL MLS 8
10-2020
4-2021
10-2021
$100,000 $0
4-2014 4-2015 10-2017 4-2018 10-2018 4-2019 10-2019 4-2020 10-2020 4-2021 10-2021 Current as of April 10, 2022. Data ©10-2014 2022 MLS of10-2015 Hilton4-2016 Head10-2016 Island.4-2017 All Rights Reserved. | Sponsored by South Carolina REALTORS®. | Report © 2022 Show
$0 Data © 2022 Current as of April 10, 2022. Data © 2022 MLS of Hilton Head Island. All Rights Reserved. Historical Median Rolling 12-Month Current as of April Sales 10, 2022.Price MLS of HiltonCalculation Head Island. All Rights Reserved. | Sponsored by South Carolina REALTORS®. | Report © 2022 ShowingTime. All MLS — 4-2014
10-2014
4-2015
10-2015
4-2016
4-2017
Palmetto Dunes —
10-2017
4-2018
| Sponsored by South Carolina REALTORS®. | Report © 2022 ShowingTime.
10-2018
4-2019
10-2019
4-2020
10-2020
4-2021
10-2021
Information Sponsored by
$700,000 $600,000
- 16.1%
$500,000
- 8.3%
Trish Weaver
$200,000
Historical Median Sales Price
$100,000
$700,000
4-2015
10-2015
4-2016
+ 20.3%
Closed Sales
$300,000
10-2014
Current as of April 10, 2022. Data © 2022 MLS of Hilton Head Island. All Rights Reserved. | Sponsored by South Carolina REALTORS®. | Report © 2022 ShowingTime.
- 33.3% Current as of April 10, 2022. Data © 2022 MLS of Hilton Head Island. All Rights Reserved. | Sponsored by South Carolina REALTORS®. | Report © 2022 ShowingTime.
New Listings
$400,000
$0 4-2014
10-2016
10-2016
4-2017
10-2017
4-2018
10-2018
4-2019
Median Sales Price*
843-301-7501 hhitrish@gmail.com Rolling 12-Month Calculation www.trishw.dunesrealestate.com 10-2019
4-2020
10-2020
4-2021
10-2021
Current as of April 10, 2022. Data © 2022 MLS of Hilton Head Island. All Rights Reserved. | Sponsored by South Carolina REALTORS®. | Report © 2022 ShowingTime.
Inventory of Homes for Sale
All MLS — Palmetto Dunes —
27
