Local Market Update – March 2022
Key Metrics
2021
2022
Percent Change
2021
2022
97
110
40 the Multiple51Listing Service + 27.5% A Research Tool Provided by of
New Listings
Hilton Head Island and the 42 Hilton Head Area of REALTORS® - 38.1% 98 26 Association
Sea Pines Real Estate Market Report
Closed Sales
Percent Change
Local Market Update – March 2022 + 13.4% A Research Tool Provided by the Multiple Listing Service of Hilton Head Island and the Hilton Head Area Association of REALTORS®
64
- 34.7%
Real Estate Market Report
Median Sales Price*
Local Market Update – March 2022 A Research Tool Provided by the Multiple Listing ServiceSea of Pines Hilton Head Island and the Hilton Head Area Association of REALTORS®
$1,727,500
$1,202,300
+ 43.7%
$1,328,000
$1,095,000
+ 21.3%
Sea Pines | March 2022 Sea LocalPines Market Update – March 2022
Percent of List Price Received*
97.5%
100.7%
+ 3.4%
96.6%
99.9%
84
81
- 3.7%
116
70
Days on Market Until Sale
+ 3.4% Detached Homes Only - 39.3%
42 42 A Research Tool Provided by the 0.0% Multiple Listing-- Service of --Hilton Head Island andHilton the Head HiltonArea Head Area Association of REALTORS® Hilton Head Island and the Association of REALTORS®
Inventory of Homes for Sale
March
Sea Pines
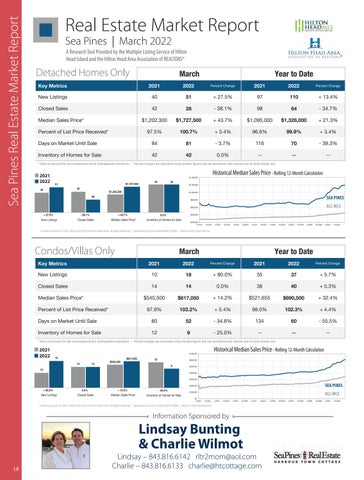
Detached Homes Only
Local Market Update – March 2022 Detached Homes Only
Sea Pines
A Research Tool Provided by the Multiple Listing Service of 51 Island and the Hilton Head Area Association of REALTORS® Hilton Head
Key Metrics42
2021
2022
Percent Change
2021
2022
Percent Change
New Listings
40
51
+ 27.5%
97
110
+ 13.4%
Closed Sales 2021 2022
42
26
- 38.1%
98
64
- 34.7%
$1,202,300
$1,727,500
+ 43.7%
$1,095,000
$1,328,000
+ 21.3%
40
Percent of List Price Received*
97.5%
100.7%
+ 3.4%
96.6%
99.9%
+ 3.4%
Percent Change 2022 Days on Market Until Sale
84
$1,202,300
NewPines Listings Sea Detached Homes Only 26
Detached Homes Only
A Research Tool Provided by the Multiple Listing Service of Hilton Head Island and the Hilton Head Area Association of REALTORS® + 27.5% - 38.1%
Median Sales Price* Key Metrics
2021
2022 51
+ 27.5%
March
2021
26March
Year to Date
+ 43.7%
2021 81
42
+ 27.5%
Year to Date 2022
42
97
- 3.7%
116
0.0%
--
110
Percent Change - 39.3% 70
$1,202,300 2021 2022
- 38.1% 51
+ 43.7%
2021
Percent Change
98
51
40
March
0.0% $1,727,500
Percent Change
2022
64
+ 27.5%
97
Year to Date $1,328,000 $1,727,500
$1,095,000
+ 13.4%
--
2022
2021 - 34.7%
42
42
Per
2022
110
+
+ 21.3%
- $1,202,300 38.1% 98 64 Percent Change 2021 2022 + 3.4% 99.9% 38.1% 98 Median- Sales Price* $1,202,300 + 43.7% $1,095,000 $1,727,500 $1,328,000 New Listings $1,202,300 $1,727,500 + 43.7% $1,095,000 $1,328,000 40 + 21.3% + 27.5% 97 + 13.4% 51 110 Median Sales Price* Historical Median Sales Price Rolling 12-Month Calculation Days on Market Until Sale Percent of List Price Received* 84 - 3.7% 100.7% 116 + 3.4% 70 81All MLS — 97.5% 96.6%- 39.3% 99.9% Percent of List Price Received* 97.5% + 3.4% 96.6% + 3.4% 100.7% 99.9% Sea26 Pines — + 27.5% + 43.7% Condos / Villas Only 0.0% Closed Sales 42 - 38.1% - 38.1% 98 - 34.7% 64 Days on Market Until Sale - 3.7% 116 - 39.3% 81 New Listings Closed Sales Median Sales Price* Inventory of Homes for Sale $1,400,000 Inventory of Homes for84 Sale Days 4270 --42 on Market Until Sale 84 0.0% - 3.7% -116 81 70 Inventory of Homes for Sale 42 0.0% --42 -Median Sales Price* $1,202,300 + 43.7% $1,095,000 + 21.3% $1,727,500 $1,328,000 March Yearusing to Date * Does not account for sale concessions and/or downpayment assistance. | Percent changes are calculated rounded figures and can sometimes look extreme due to small sample size. $1,200,000 Historical Median All MLS — InventoryPercent of Homes for Sale 42 Sales Price Rolling -4212-Month Calculation 0.0% -Change Percent Change Key Metrics 2021 2022 2021 Sea Pines — Percent of List Price Received* 97.5% 2022 100.7% + 3.4%Median Sales 96.6% + 3.4% Historical Price - Rolling 99.9% 12-Month Calculation $1,000,000 March 2021 2022 * Does not account for sale concessions and/or downpayment assistance.$1,400,000 | Percent changes are calculated using rounded figures and can sometimes look extreme due to small sample size. 2021 New Listings 10 + 80.0% 35 + 5.7% 18 37 42 2022 Days 2021 2022 Local on Market Until Sale 84 42 - 3.7% – March 2022 116 - 39.3% 81 Market Update 70 $800,000 $1,727,500 51 $1,200,000 New Listings New Listings
Percent of List Price Received* Closed Sales 42 26
Sea Pines
97
of + 13.4% 110 Inventory
2021
97.5% 64
2022
Percent Change
- 34.7% 100.7%
+ 3.4%
-
26 96.6%
+
-
Local March Market Update – March 2022
$600,000
Median Sales Price*
A Research Tool Provided by the Multiple14Listing Service 0.0%of 38 42 14 40 Hilton Head Island and Hilton Head Area$1,202,300 Association of REALTORS® 42 Inventory ofthe Homes for Sale $540,500 51
March + 14.2% $617,050
26
40
A Research Tool Provided by the Multiple Listing Service of + 5.3% Hilton Head Island and the Hilton Head Area Association of REALTORS®
42 + 32.4%
0.0%
$1,000,000
$690,500
$521,655
$800,000
Sea Pines $1,202,300
42--
--
$1,727,500
42-SEA PINES
* Does not account for sale concessions and/or downpayment assistance. | Percent changes are calculated using rounded figures and can sometimes look extreme due to small sample size.
$400,000
Percent of List Price Received* 10-2014
Sea Pines 4-2015
80
March
10-2015
10-2016- 38.1% 4-2017
4-2016
New Listings
Inventory of Homes for Sale
+ 5.4% 42
103.2%
97.9%
40
$200,000 Days on Market Until Sale+ 27.5%
52
10-2017
Closed Sales
40
4-2019
102.3%
134
60
0.0% 10-2020 4-2020
10-2019
+ 4.4%
- 55.5% Condos / Villas Only $400,000 10-2021 42
4-2021
- 25.0%
--
--
--
$200,000 4-2014
10-2014
Historical Median/Sales PriceOnly Condos Villas
51
42
40
$1,400,000
Local Market Update – March 2022 18
+ 27.5% Condos/Villas Only
A Research Tool Provided by the Multiple Listing Service of Hilton Head Island and the Hilton Head Area Association of REALTORS®
$540,500
New14Listings14
$1,000,000
Sea NewPines Listings $600,000
Historical Median Sales Price + 27.5%
Condos $400,000 / Villas Only
Closed Sales
$200,000 4-2014
10-2014
+ 80.0%
4-2015
Key Metrics
10-2015
4-2016
10-2016
4-2017
2021 SalesClosed Price* Sales
New ListingsMedian New$1,400,000 Listings
26
12
$1,202,300
+ 43.7%
2022
42
4-2020
2022 10-2020to 4-2021 Year Date 10-2021
422022
2021
14 $617,050
97.9%
103.2%
0.0%
38
Year to 0.0% Date + 14.2%
$521,655
Percent Change
40
+ 5.3%
$690,500
+ 32.4%
+ 5.4% 98.0% + 4.4% 102.3% + Inventory 43.7% of Homes for Sale 0.0%
- 34.8% 2021 52 2022 134 Median Sales Price* 12 - 25.0% -9 35 37 80
Percent - 55.5% 60 Change
* Does not account for sale concessions and/or downpayment assistance. | Percent changes are calculated using rounded figures and can sometimes look extreme due to small sample size.
10-2019
4-2020
10-2020
4-2021
Percent Change
52
80
$1,400,000 Inventory of Homes for12 Sale$1,000,000 9
Inventory of Homes for Sale
$600,000
10-2019
Percent Change
14
38.1% Sales Price* Median
Inventory of Homes --+ 5.7% 2022
All Sea P
10-2021
Percent Change
10
+ 5.3% 103.2% 40 97.9% $1,200,000 Historical Median Sales+ 14.2% Price$521,655 Rolling$690,500 12-Month Calculation Historical Median Sales Price Rolling 12-Month Median Sales Price* $540,500Calculation + 32.4% $617,050 All MLS $1,200,000 Days on Market Until Sale 80 52 Sea Pines Percent of List Price Received* 97.9% + 5.4% 98.0% + 4.4% 103.2% 102.3%
$1,000,000
4-2019
Rolling 12-Month Calculation
4-2019
+ 14.2%
$1,400,000
Days on Market Until Sale
10-2018
2021 MLS — 38 5.3% 40 0.0% All + Sea Pines — - 25.0% 18 $617,050 Closed Sales Median Sales Price* Inventory of Homes for Sale 12 2021 2022 $540,500 $540,500 $521,655 + 32.4%9 $690,500 14 Median Sales Price* Inventory $617,050 of Homes for Sale + 14.2% 14 10-2018
14 14 Percent of List Price Received*
$700,000
2022
$540,500
Percent Days on Market Until Sale Change 2022 Closed Sales Inventory of Homes for Sale + 80.0% 18
Current as of April 10, 2022. Data © 202210 MLS of Hilton Head Island. | Sponsored by South + 80.0% 35Carolina REALTORS®. + ShowingTime. 5.7% 18 All Rights Reserved. 37 | Report © 2022
Closed Sales
2021
$1,727,500
Percent of List Price Received*
9-
10-2017
Current as of April 10, 2022. Data © 2022 10 MLS of Hilton Head Island. | Sponsored by South + 80.0% 35Carolina REALTORS®. 5.7% 18 All Rights Reserved. 37| Report © 2022+ShowingTime.
2022
March
4-2018 March
4-2017
- 38.1% + 43.7% 14 0.0% 14March Historical Median YearSales to Date Price Rolling 12-Month Calculation
4-2018 March
10-2017
0.0%Listings New
10-2016
Median Sales Price*
2021 New Listings 10
$800,000
4-2016
Closed Sales
+ 27.5% Closed Sales
Key Metrics
10
2021
$617,050 - 38.1%
$1,200,000
10-2015
26
4
2021
$1,202,300
4-2015
2021
42 ALL MLS
$1,727,500
$600,000
Inventory 26 of Homes for Sale
Median Sales Price*
9
12
- 34.8%
4-2018 + 43.7% 10-2018
98.0%
51
* Does not account for sale concessions and/or downpayment assistance. | Percent changes are calculated using rounded figures and can sometimes look extreme due to small sample size. Current as of April 10, 2022. Data © 2022 MLS of Hilton Head Island. All Rights Reserved. | Sponsored by South Carolina REALTORS®. | Report © 2022 ShowingTime. Key Metrics Rolling 12-Month Calculation All MLS — New Listings Sea Pines —
March
42
40 Homes for Sale 42
* Does not account for sale concessions and/or downpayment assistance. | Percent changes are calculated using rounded figures and can sometimes look extreme due to small sample size.
Closed Sales
4-2014
Closed Sales Median Sales Price*
Closed Sales40
Key Metrics
26
Year to Date
--
* Does not account for sale concessions and/or downpayment assistance. | Percent changes are calculated using rounded figures and can sometimes look extreme due to small sample size.
42
New Listings March Percent Change
Inventory of Homes for Sale
51
40
Key Metrics
Local MarketClosed Update – March 2022 Sales
Median Sales Price*
2021
Year to Date
Key Metrics
March 42
42
$1,727,500
March
--
A Research Tool Provided Detached Homes Onlyby the Multiple Listing Service of
* Does not account for sale concessions and/or downpayment assistance. | Percent changes are calculated using rounded figures and can sometimes look extreme due to small sample size.
0.0%
+ 5.4%
38
- 34.8%
134
- 25.0%
--
60
- 55.5%
12--
+ 80.0%
102.3%
98.0%
- 34.8%
134
0.0%
New Listings
9
--
— —
Closed Sales
- 25.0%
+ 14.2%
+ 4.4% All MLS — - 55.5% Sea Pines — - 25.0%
60
Median Sales Price*
Inventory of Homes for Sale
--
--
--
*$800,000 Does not account for sale concessions and/or downpayment assistance. | Percent changes are calculated using roundedHistorical figures andMedian can sometimes extreme due12-Month to smallCalculation sample size. Saleslook Price Rolling
* Does not account for sale concessions and/or downpayment assistance. | Percent changes are calculated using rounded figures and can sometimes look extreme due to small sample size.
$800,000
$1,200,000
$500,000
2021 March
2021
$600,000
$400,000
2022$1,000,000 March
14
$400,000
$100,000 $0 4-2014
4-2015 + 80.0% 10-2015
4-2016
10 $400,000 New Listings
12
2021
$600,000
9
$617,050
12
$300,000$540,500 $200,000 14 1410-201510-2017 10-20154-2014 4-2016 10-2016 4-2018 10-2018 10-2014 4-20154-2017 4-2016 4-2017 4-2019 10-2017 10-2019 4-2018 $200,000 10-2016
10-2017
4-2018
Closed Sales
+10-2018 14.2%
4-2019
Median Sales Price*
10-2019
4-2020 - 25.0%10-2020
4-2021
4-2020 10-2018
10-2020 4-2019
4-2021 10-2019
4-2014
10-2015
4-2016
4-2015
10-2015
4-2016
10-2016
4-2017
10-2017
4-2018
10-2018
4-2019
10-2019
4-2018
10-2018
Information Sponsored by
4-2019
10-2019
4-2020
10-2020
4-2020
10-2020
Closed Sales
$300,000 $200,000
4-2021
10-2021
4-2021
10-2021
Current as of April 10, 2022. Data © 2022 MLS of Hilton Head Island. All Rights Reserved. | Sponsored by South Carolina REALTORS®. | Report © 2022 ShowingTime.
Median Sales Price*
Lindsay – 12-Month 843.816.6142 Historical Median Sales Price Rolling Calculation rltr2mom@aol.com Charlie – 843.816.6133 charlie@htcottage.com
Inventory of Homes for Sale
$100,000
18
$0 4-2014
10-2014
$700,000
4-2015
10-2015
4-2016
10-2016
4-2017
10-2017
4-2018
10-2018
4-2019
10-2019
4-2020
10-2020
4-2021
10-2021
Current as of April 10, 2022. Data © 2022 MLS of Hilton Head Island. All Rights Reserved. | Sponsored by South Carolina REALTORS®. | Report © 2022 ShowingTime.
10-
by South©Carolina REALTORS®. | Report © 202 Report 2022 ShowingTime.
14.2%| Sponsored by South Carolina REALTORS®.-| 25.0% Current as of April 10, 2022.0.0% Data © 2022 MLS of Hilton Head Island. All Rights+Reserved. Report © 2022 ShowingTime.
New Listings
$400,000
10-2017
4-2021
ALL MLS 10-2014
Lindsay Bunting & Charlie Wilmot
+ 80.0%
$500,000
All MLS — 4-2017 Sea Pines —
10-2016
$700,000 $600,000
9
Inventory of Homes for Sale
Current of April 10, 2022. Data © 2022Reserved. MLS of Hilton Head Island. Rights Reserved. | Sponsored| of April 10, 2022. | Data © 2022 MLS ofas Hilton Head Island. AllShowingTime. Rights | Sponsored byAll South Carolina REALTORS®. Current as of April 10, 2022. Data © 2022 MLS ofCurrent Hilton Headas Island. All Rights Reserved. Sponsored by South Carolina REALTORS®. | Report © 2022 Rolling 12-Month Calculation 10-2014 4-2015
10-2021 4-2020SEA 10-2020 PINES
10-2021
$100,000
$0 4-2014
$200,000 Historical Median Sales Price
2022
$500,000 $400,000
4-2015
10-2016 0.0% 4-2017
$617,050
$400,000
18
$200,000 $600,000 4-2014 10-2014 10-2014
$540,500
14
$800,000
10
$200,000
$700,000
$600,000
18
$300,000
All MLS — Sea Pines —
Historical Median Sales Price - Rolling 12-Month Calculation
2022
All MLS — Sea Pines —
