A Research Tool Provided by the Multiple Listing Service of Hilton Head Island and the Hilton Head Area Association of REALTORS®
Local Market Update – March 2022
Local Market Update – March 2022 Wexford Real Estate Market Report A Research Tool Provided by the Multiple Listing Service of Hilton Head Island and the Hilton Head Area Association of REALTORS®
Wexford | March 2022
Wexford Local Market Update – March 2022 March Local Market Update – March 2022
Local Market Update – March 2022 A Research Tool Provided by the Multiple Listing Service of Hilton
Wexford
A Research Tool Provided by the Multiple Listing Service of and the Hilton Area of REALTORS® AIsland Research Tool by the Head Multiple Listing Association ServiceofofREALTORS® Hilton Head Head Island and theProvided Hilton Head Area Association HeadTool Island and thebyHilton Head Area Association of REALTORS® A Hilton Research Provided the Multiple Listing Service of 2022 Hilton Head Island and the Hilton Head Area2021 Association of REALTORS®
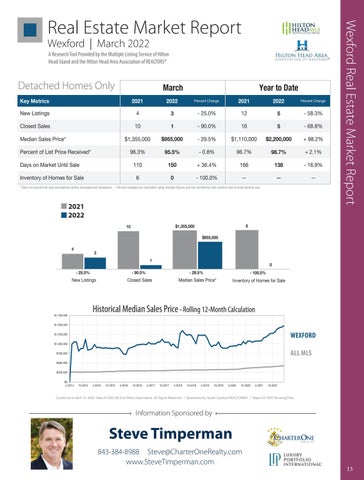
Key Metrics
Detached Homes Only 4 Wexford
New Listings
Wexford Wexford
Closed Sales
Key Metrics
3
10
Key Metrics
Median Sales Price*
$1,355,000
New Listings
Percent of List Price Received*
4
Closed Sales
Key Metrics Key Metrics Days on Market Until Sale Key Metrics
Closed Sales
10
2022
Percent Change
- 25.0%
12
5
Year to Date
5
- 68.8%
- 90.0% - 29.5%
March
16
Percent Change
2021
$1,110,000
3
-425.0%
- 58.3%
2021
2022
- 0.8% 96.7% March March March 10 90.0% 1 Percent Change 2022 2021
95.5%
96.3%
2021
2022
$955,000
New Listings
Percent Change
March
1
2021
Year to Date
2022 Percent Change
$2,200,000
2021
- 25.0% 5
12
3
Year to Date Percent Change
+ 98.2%
2022
12 - 58.3%
+ 2.1% 98.7% Year to DateYear to Date Year - 90.0% 5 16 - 68.8% 16 to Date
1
Wexford Real Estate Market Report
A Research Tool Provided by the Multiple Listing Service of Hilton Head Island and the Hilton Head Area Association of REALTORS®
5 5
Percent Cha
- 58.3%
- 68.8%
Percent Change 2021 2022 Percent Change Percent Change 2021 2022 2021 2022 + 36.4% 166 2021 - 16.9% 150 138 Percent Change Percent Change 2021 2022 2022 Median Sales Price* $1,355,000 29.5% $1,110,000 $955,000 $2,200,000 New Listings 44 - 25.0% 12 $1,110,000 - 58.3% 3 Median Sales Price* $1,355,000 - 29.5% +- 58.3% 98.2% $955,000 $2,200,000 New Listings - 25.0% 1255 3 40 - 58.3% 3- 100.0%- 25.0% Inventory of Homes forNew SaleListings 6 -- 12 --5 -Percent of List Price Received* 96.3% 96.7% 98.7% Closed Sales 10 - 90.0% 1695.5% - 68.8% 1 5 - 0.8% * Does notPercent account for saleClosed concessions and/or downpayment using rounded can1sometimes small sample16 size. Sales -to 90.0% 165 -+68.8% 1 look -extreme 5 of List Price Received* 96.3% -due0.8% 96.7% 2.1% Closed Sales assistance. | Percent changes are calculated 1010 figures and95.5% 90.0% -98.7% 68.8% Days on Market Until $1,355,000 Sale 110 + 36.4% 166 150 $2,200,000 138 Median Sales Price* - 29.5% $1,110,000 + 98.2% $955,000 Sales Price* $1,355,000 $1,110,000 $1,110,000 + 98.2% $2,200,000 Sales $1,355,000 $955,000 - 29.5% + 98.2% $955,000- 29.5% $2,200,000 Days on Median MarketMedian Until Price* Sale 110 + 36.4% 166 - 16.9% 150 138 Percent of List Price Received* of Homes for 96.3% - 0.8% 96.7% 0 + 2.1%2022 95.5% 98.7%- 100.0% Inventory Sale 6 --2021 List Price Received* 96.3% + 98.7% 2.1% 95.5% 98.7% Percent Percent of List of Price Received* 96.3% 96.7% + 2.1% 95.5% - 0.8% - 0.8%96.7%
110
March
* Does not account for sale concessions6and/or downpayment assistance. are calculated using rounded figures can sometimes look extreme Inventory of Homes Sale Until - 100.0% --and138 -0 | Percent+changes -- due to small sample size. Daysfor on Market Sale 110 36.4% 166 - 16.9% 150
Days on Market Until Sale
Days on Market Until Sale
110
150
6 6
0 0
110
150
+ 36.4%
166
- 100.0% - 100.0%
---
+ 36.4%
138
- 16.9%
---
---
166
6 sample size. $1,355,000 10 assistance. | Percent changes are calculated * Does not account for sale concessions and/or downpayment using rounded figures and can sometimes look extreme due to small Inventory of Homes for Sale Inventory of Homes for Sale
March Inventory* Does of notHomes Sale 6calculated using rounded figures0and can sometimes look-extreme 100.0% account for salefor concessions and/or downpayment assistance. | Percent changes are due to small sample size.
--
$955,000
* Does not account for sale concessions and/or downpayment assistance. | Percent changes are calculated using rounded figures and can sometimes look extreme due to small sample size.
March
2021
138
- 16.9%
--
--
* Does not account for sale concessions and/or downpayment assistance. | Percent changes are calculated using rounded figures and can sometimes look extreme due to small sample size.
4
March March 2022
3 March
- 25.0%
- 90.0%
3
- 29.5%
Median Sales Price* 1
New Listings New Listings
Historical Median Sales Price Closed SalesSales Closed
Historical HistoricalMedian MedianSales SalesPrice Price Rolling Rolling 12-Month 12-Month Calculation Calculation
$1,500,000
2022 6
2021
2022
- 100.0%
00
--100.0% 100.0% All MLS —
0
Inventory for Inventory of ofHomes Homes forSale Sale Wexford --— 100.0% 100.0%
Rolling 12-Month Calculation Median Sales Price* Median Sales Price*
Historical Median Sales Price - Rolling 12-Month Calculation
$1,750,000 $1,750,000 $1,750,000
$1,000,000
$1,500,000 $1,500,000
All MLS — All MLS — Wexford —
Wexford —
$1,250,000
$1,750,000
WEXFORD
$1,000,000
$1,500,000 $1,000,000 $1,000,000
$500,000
$1,500,000
$1,250,000
$250,000
$1,250,000 $1,000,000 $0
$500,000
$500,000 $500,000 $250,000 $250,000
4-2014 10-2014 $750,000 4-2015 $1,000,000
$750,000 $500,000
$500,000
ALL MLS
$750,000
$750,000 $750,000
All MLS — Wexford —
AllMLS MLS — — All Wexford — — Wexford
$1,750,000 $1,250,000 $1,250,000
$750,000
Inventory of Homes for Sa
0
Inventory Sale Inventoryof ofHomes Homes for for Sale
Historical Median Sales 12-Month Calculation $1,500,000 Historical Median Sales PricePrice RollingRolling 12-Month Calculation
$1,250,000
20
0
- 29.5%
Median Sales Price* - 29.5% - 29.5%
--
6
Median Sales Price*
- 29.5%
Closed Sales Sales Closed
- 16.9%
$955,000 Inventory of Homes for Sale
Closed Sales
- 90.0% - 90.0%
0
- 100.0%
- 90.0%
1 90.0% Rolling 12-Month Calculation --90.0% 1 New Listings
NewListings Listings New
- 25.0%- 25.0%
11
- 25.0%
3
$955,000 $955,000
+ 2.1%
2021
2021
$955,000 6
66
$1,355,000 $955,000
3
33
25.0% Historical Median Sales- -25.0% Price
$1,750,000
10
Closed Sales
44
4
$1,355,000 $1,355,000 $1,355,000
10 1 10 10 4
New Listings 4
$1,355,000 2021 2022 2021 2022
10
+ 98.2%
$250,000
10-2015
4-2016
$0 $0 4-2014 10-2014 4-2014 10-2014
10-2016
4-2017
$0
4-2015 10-2015 4-2016 4-20154-2014 10-2015 10-2014 4-2016
10-2017
4-2018
10-2018
4-2019
10-2016 4-2017 10-2017 4-2018 10-2018 4-2015 4-2017 10-2015 10-2016 10-20174-2016 4-2018 10-2016 10-2018
10-2019
4-2020
10-2020
4-2021
4-2019 10-2019 4-2020 10-2020 4-2021 4-2017 10-2019 10-2017 4-2019 4-2020 4-2018 10-2020 10-2018 4-2021
10-2021 10-2021 4-2019 10-2021
10-2019
4-2020
10-2020
4-2021
10-2021
$250,000 Current as of April 10, 2022. Data © 2022 MLS of Hilton Head Island. All Rights Reserved. | Sponsored by South Carolina REALTORS®. | Report © 2022 ShowingTime.
$250,000 $0 4-2014
$0 4-2014
10-2014
Current as of April 10, 2022. Data © 2022 MLS of Hilton Head Island. All Rights Reserved. | Sponsored by South Carolina REALTORS®. | Report © 2022 ShowingTime. Current as of April 10, 2022. Data © 2022 MLS as of Hilton Head10, Island. All Rights | Sponsored by South | Report © 2022 ShowingTime. Current of April 2022. Data Reserved. © 2022 MLS of Hilton HeadCarolina Island.REALTORS®. All Rights Reserved. | Sponsored by South Carolina REALTORS®. | Report © 2022 Showin
10-2014
4-2015
4-2015
10-2015
4-2016
4-2017 10-2017 4-2018 10-2018 Information Sponsored by
10-2016
4-2019
10-2019
4-2020
10-2020
4-2021
10-2021
Steve Timperman
10-2015 10-2016 4-2017 10-2018 4-2019 10-2019 10-2020 4-2021 10-2021 Current as of4-2016 April 10, 2022. Data © 2022 MLS of10-2017 Hilton Head 4-2018 Island. All Rights Reserved. | Sponsored by South4-2020 Carolina REALTORS®. | Report © 2022 ShowingTime.
843-384-8988 Steve@CharterOneRealty.com www.SteveTimperman.com
Current as of April 10, 2022. Data © 2022 MLS of Hilton Head Island. All Rights Reserved. | Sponsored by South Carolina REALTORS®. | Report © 2022 ShowingTime.
13
