Local Market Update – March 2022
Long Cove Real Estate Market Report
Hilton Head Island and the Hilton Head Area Association of REALTORS®
A Research Tool Provided by the Multiple Listing Service of Hilton Head Island and the Hilton Head Area Association of REALTORS®
Local Market Update – March 2022 LongReal Cove Estate Market Report A Research Tool Provided by the Multiple Listing Service of Hilton Head Island and the Hilton Head Area Association of REALTORS®
Long Cove | March 2022 LocalCove Market Update – March 2022 Long Local 2022 March Local Market Market Update Update––March March 2022 A Research Tool Provided by the Multiple Listing Service of Hilton
Year to Date
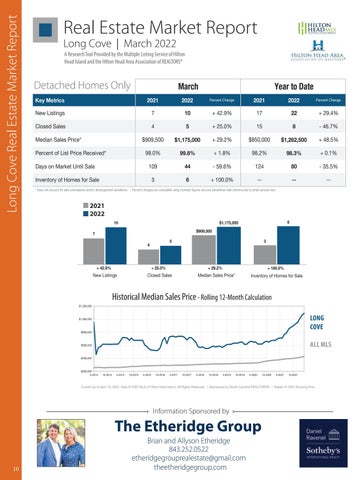
Long Cove
A Research Tool Provided by the Multiple Listing Service of Island and the Hilton Area Association A Research Provided by Head the Multiple Listing Service of of REALTORS® Hilton Head Head Island and theTool Hilton Head Association of REALTORS® A Research Tool Provided by Area the Multiple Listing Service of
Key Metrics
Hilton Head Island and the Hilton Head Area Association of REALTORS®2022 Hilton Head Island and the Hilton Head Area 2021 Association of REALTORS®
New Listings
Detached Only Closed Sales LongHomes Cove
Long Cove Cove
Key Metrics Median Sales Price*
7
10
4
5
Percent Change
2021
2022
+ 42.9%
17
22
15
8
March+ 25.0%
March
2021 $1,175,0002022 + 29.2% Key Metrics$909,500 2021
New Listings Percent of List Price Received*
Percent Change
+ 29.4%
Year to Date - 46.7%
7
New Listings 98.0%
Days on Market 109 Closed Sales Until Sale Key KeyMetrics Metrics Closed Sales
4
99.8% 44 2021 2021
Year to Date
2021 2022 $850,000 + 48.5% 2021 Percent Change 2022 $1,262,500
Percent Change
Percent Change
2022
10 + 1.8% +742.9%98.2% 10 1798.3% + 0.1% 17 + 29.4% 42.9% 22 Year to +Date
March March March
P
22
Year to Date Year to Date
-8Change 35.5% 80 + 25.0% 15 - 46.7% 15 2022 Percent Percent Change 2022
- 59.6% 1242021 5 +4Change 25.0% 52022 Percent Percent Change 2022 2021
8 Percent Change 2021 2022 Listings 7 + +42.9% 1717 + 29.4% 1010+ 100.0% 22 $909,500 + 29.2% Listings Median Sales Price* + 29.4% $1,175,000 $1,262,500 Inventory of Homes forNew Sale 3 --- $850,000 --22 Median Sales Price*New $909,5007 7 6 $1,175,000 +42.9% 29.2% $850,000 ++ 48.5% $1,262,500 New Listings + 42.9% 17 29.4% 10 22 * Does not account for sale concessionsClosed and/or downpayment | Percent changes are calculated using4rounded figures and can extreme due to small sample Sales +98.0% 15 Closed Sales assistance. 4 +25.0% 25.0% 15size. - 46.7% 98.2% 5 5sometimes look 8 8+ 1.8%- 46.7% Percent of List Price Received* 99.8% 98.3% Closed SalesReceived* + 25.0% 15 -+46.7% 5 8 Percent of List Price 98.0% 4 + 1.8% 98.2% 0.1% 99.8% 98.3% MedianSales SalesPrice* Price* $909,500 $1,175,000 29.2% $850,000 $1,262,500 + 48.5% $1,175,000 + +29.2% $1,262,500 + 48.5% Median $909,500 $850,000 Days on Market Until Sale 109 - 59.6% 124 44 80 Median Sales Price* $909,500 + 29.2% $850,000 + 48.5% $1,175,000 $1,262,500 2021 2022 Percent ListPrice PriceReceived* Received* 98.0% 1.8% 98.2% 12498.3% + 0.1% 99.8% 98.3% Percent + +-1.8% + 0.1% 99.8% Days on Market Until SaleofofList 109 98.0% 59.6% 98.2% - 35.5% 44 80 Inventory of Homes for Sale 3 + 100.0% -6 -Percent of List Received* 98.0% + 1.8% 124 98.2% + 0.1% 99.8% - 59.6% 98.3% DaysPrice onMarket Market UntilSale Sale 109 - 59.6% 124 - 35.5% Days on Until 109 - 35.5% 4444 8080 Key Metrics
2021
2022
Percent Change
March
* Does not account for sale concessions and/or downpayment assistance. | Percent changes are calculated using rounded figures and can sometimes look extreme 6 due to small sample size.
10for Sale Inventory of Homes
3
Days on Market Until Sale Inventory ofHomes Homesfor forSale Sale Inventory of
6
109 33
6 644
$1,175,000 + 100.0%
--
--
- 59.6% -- -100.0% + +100.0%
124-- --
* Does not account for sale concessions and/or downpayment assistance. | Percent changes are calculated using$909,500 rounded figures and can sometimes look extreme due to small sample size.
7
March Inventory of Homes for Sale
Doesnot notaccount accountforforsale saleconcessions concessionsand/or and/ordownpayment downpaymentassistance. assistance.| Percent | Percent changes calculated using rounded figures sometimes extreme to small sample **Does changes areare calculated using rounded figures andand cancan sometimes looklook extreme duedue to small sample size.size.
2021 March March 2022
* Does not account for sale concessions and/or downpayment assistance. |
March
March
10
+ 42.9%
6
3
4
7 7
$909,500 +$909,500 29.2%
+ 25.0%
10
Closed Sales 4
5
4
7
5
+4 42.9% 4
Historical Median Sales++42.9% Price 42.9%
4
5
5
$1,000,000
+ 42.9%
+ 29.2%
+ 100.0%
Inventory Homes for Sale All MLS —of Long Cove —
A Long
$1,200,000
Historical Median Sales Price $1,000,000
Historical Median Sales Price $1,000,000
$1,000,000
$400,000 $1,200,000 $1,000,000
+ 100.0% All MLS —
Median Sales Price*
Long Cove —
$1,200,000
$1,200,000
Inventory of Home
Inventory of Homes for Sale LongforCove Inventory of Homes Sale—
Historical Median - RollingSales 12-Month CalculationInventory of Homes for Sale Closed Sales Sales Price Median Price*
New Listings
$600,000
3
6
+ 100.0%
+ 100.0%
MLS — + 100.0% Median SalesAllPrice*
Sales+Median Price 12-MonthPrice CalculationRolling 12-Month Historical Sales + 42.9% Historical Median 25.0%Rolling + 29.2%Calculation $1,200,000
$800,000
2022
6
33
Median Sales Price*
+ 25.0%
2021
+ 29.2%
+ 29.2%
Historical Rolling Sales 12-Month Calculation New ListingsMedian Sales Price Closed
2022
3 of Homes for Sale Inventory
+ Sales 29.2% Closed Median Sales Price*
Closed Sales
6 6
20
2021
3
+ 25.0%
+ 25.0% New Listings New Listings Closed Sales
--
+ 100.0%
$1,175,000
$909,500
Rolling 12-Month +Calculation 25.0%
New Listings
5 $1,175,000
$909,500 Median Sales Price*
-2021 2022 2022 2021 $1,175,000
$909,500
$1,175,000 $1,175,000
- 35.5%
--
10
10 10 7
New 7 Listings
$1,200,000
+ 100.0%
5 3 Percent changes are calculated using rounded figures and can sometimes look extreme due to small sample size.
--
---80
Rolling 12-Month Calculation
LONG All MLS Long Cove COVE All MLS
Rolling 12-Month Calculation
— Long Cove —
$800,000
$800,000
— —
$800,000
ALL MLS
$600,000
$600,000
$600,000
$400,000
$200,000 $800,000 $1,000,000 4-2014 10-2014
$600,000
$800,000
$400,000
4-2015
10-2015
$200,000 4-2014 $200,000 4-2014
4-2016
$400,000
10-2014
10-2014
10-2016
4-2015
4-2015
$200,000
10-2015
10-2015
4-2017 4-2016
4-2016
10-2017 10-2016
10-2016
4-2018
4-2017
4-2017
10-2018
10-2017
10-2017
4-2018
4-2018
4-2019
10-2019
10-2018
4-2019
10-2018
4-2019
4-2020 10-2019
10-2019
10-2020
4-2020
4-2020
4-2021
10-2020
10-2020
10-2021
4-2021
4-2021
10-2021
10-2021
Current as of April 10, 2022. Data © 2022 MLS of Hilton Head 10-2015 Island. All Rights Reserved. | Sponsored by South Carolina REALTORS®. | Report ©4-2019 2022 ShowingTime. 4-2014 10-2014 4-2015 4-2016 10-2016 4-2017 10-2017 4-2018 10-2018 10-2019
4-2020
10-2020
1
Current as of April 10, 2022. Data © 2022 MLS of Hilton Head Island. All Rights Reserved. | Sponsored by South Carolina REALTORS®. | Report © 2022 ShowingTime.
$600,000 $200,000 4-2014
Current as of April 10, 2022. Data © 2022 MLS of Hilton Head Island. All Rights Reserved. | Sponsored by South Carolina REALTORS®. | Report © 2
10-2014
4-2015
10-2015
4-2016
Information Sponsored by 4-2017 10-2017 4-2018 10-2018
10-2016
4-2019
10-2019
4-2020
10-2020
4-2021
10-2021
The Etheridge Group
$400,000
Current as of April 10, 2022. Data © 2022 MLS of Hilton Head Island. All Rights Reserved. | Sponsored by South Carolina REALTORS®. | Report © 2022 ShowingTime.
$200,000 4-2014
10
4-2021
Current as of April 10, 2022. Data © 2022 MLS of Hilton Head Island. All Rights Reserved. | Sponsored by South Carolina REALTORS®. | Report © 2022 ShowingTime.
$400,000
10-2014
Brian and10-2017 Allyson 4-2017 4-2018Etheridge 10-2018 4-2019 10-2019 4-2020 10-2020 4-2021 10-2021 843.252.0522 etheridgegrouprealestate@gmail.com Current as of April 10, 2022. Data © 2022 MLS of Hilton Head Island. All Rights Reserved. | Sponsored by South Carolina REALTORS®. | Report © 2022 ShowingTime. theetheridgegroup.com
4-2015
10-2015
4-2016
10-2016
