ervice of of ation of REALTORS® of REALTORS®
er
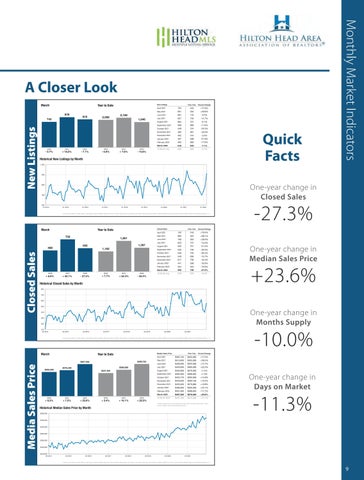
New Listings A Closer Look A count of the properties that have been newly listed on the market in a given month.
March
Year to Date 878
816
New Listings
743
3
2,159
2,006
1,846
March March 2020
- 0.7%
2021
2020
2022
+ 18.2%
- 7.1%
20212021 Historical New Listings2022 by Month 2022 4
New Listings
2021
- 0.9%
+ 7.6%
2022
Prior Year
Percent Change
April 2021
755
425
+77.6%
May 2021
691
532
+29.9%
June 2021
691
716
-3.5%
July 2021
627
735
-14.7%
August 2021
664
707
-6.1%
September 2021
608
683
-11.0%
October 2021
549
724
-24.2%
November 2021
465
567
-18.0%
December 2021
402
410
-2.0%
January 2022
467
598
-21.9%
February 2022
563
683
-17.6%
March 2022
816
878
-7.1%
12-Month Avg
608
638
-4.7%
- 14.5%
Year to Date Year to Date Quick
Percent Change Percent Change
20212021
20222022
1,000
4
800
6
6
+ 50.0% + 50.0%
11 11
17 17
2
2
- 33.3% - 33.3%
12 12
7
600
3
400
$800,000 + 84.9% $800,000 Closed $1,479,500 Sales$1,479,500 + 84.9% 200 01-2014
01-2015
01-2016
01-2017
01-2018
01-2019
01-2020
759
66 66
Closed Sales
+ 0.5% 96.2% + 0.5% 96.2% Year to Date 69 69 552
499
10 10
1,801
1,397
1,182
6
6
+ 4.5% + 4.5% - 40.0% - 40.0%
01-2021
01-2022
Closed Sales
96.0% 96.0% Prior Year
Percent Change
April 2021
742
416
+78.4%
May 2021
683
343
+99.1%
June 2021 August 2021
158 158 708
553
+28.0%
623
737
-15.5%
550
701
-21.5%
September 2021
528
736
-28.3%
October 2021
546
740
-26.2%
November 2021
549
636
December 2021
617
756
January 2022
441
538
February 2022
404
504
-19.8%
March 2022
552
759
-27.3%
July 2021
--
--
-13.7% -18.4% -18.0%
579 to 618 -6.4% ance. | Percent are calculated using rounded can sometimes look extreme due small sample size. Percent changeschanges are calculated using rounded figures figures and canand sometimes look extreme due to small sample size. + 7.7% - 27.3% + 52.4% - 22.4% + 6.9% + 52.1% 2021
2020
2022
2021
2022
12-Month Avg
Historical Closed Sales by Month
700
Closed Sales
-27.3%
96.3% 96.3%
+ 0.3% + 0.3%
113 113
- 28.5% - 28.5%
One-year change in -- --Price -- --Median Sales
+23.6%
500 400
One-year change in 10 10 Months Supply
$1,479,500 $1,479,500
100 04-2014
04-2015
04-2016
04-2017
Median Sales Price
04-2018
04-2019
04-2020
04-2021
Current as of April 10, 2022. Data is Copyright © 2022 All Rights Reserved. MLS of Hilton Head Island. Provided by the Hilton Head Area Association of REALTORS® and South Carolina REALTORS®. Report © 2022 ShowingTime. | 5
Point at which half of the sales sold for more and half sold for less, not accounting for seller concessions, in a given month.
$800,000 $800,000 Year to Date
March
2
change - 41.7%in 7One-year - 41.7%
2021202120222022
600
200
3
+ 54.5% + 54.5%
800
300
Media Sales Price
3
2020
Percent Change Percent Change
$842,500 $1,367,000 + 62.3% $1,367,000 + 62.3% $842,500
Current as of April 10, 2022. Data is Copyright © 2022 All Rights Reserved. MLS of Hilton Head Island. Provided by the Hilton Head Area Association of REALTORS® and South Carolina REALTORS®. Report © 2022 ShowingTime. | 3
A count of the actual sales that closed in a given month.
95.7% 95.7% March
Facts
Monthly Market Indicators
– March 2022 March 2022
2
$352,000
2020
$469,750
$467,500 $385,000
$378,300 $337,350
2021
2020
2022
- 33.3%Historical Median Sales Price by Month - 33.3% + 8.3%
Median Sales Price
+ 7.5%
+ 23.6%
Closed Sales Closed Sales
+ 5.4%
2021
2022
+ 84.9% + 84.9% + 14.1%
Prior Year
Percent Change
April 2021
$392,745
$335,000
+17.2%
May 2021
$410,000
$325,000
+26.2%
June 2021
$400,000
$355,000
+12.7%
July 2021
$440,000
$360,000
+22.2%
August 2021
$403,906
$376,000
September 2021
$394,000
$388,920
+1.3%
October 2021
$453,770
$395,000
+14.9%
November 2021
$430,000
$390,165
+10.2%
December 2021
$455,000
$379,860
+19.8%
January 2022
$480,000
$390,000
+23.1%
February 2022
$457,500
$388,825
+17.7%
March 2022
$467,500
$378,300
12-Month Med*
$427,760
$375,000
+ 22.0%
$450,000
6
6
+7.4%
One-year change in Days on Market
-11.3% Inventory of Homes for Sale Inventory of Homes for Sale +23.6% +14.1%
* Median Sales Price of all properties from April 2021 through March 2022. This is not the median of the individual figures above.
Median Sales Price* Median Sales Price*
$500,000
-10.0%
- 40.0% - 40.0%
$400,000
$350,000
$300,000
ce Rolling 12-Month Calculation Rolling 12-Month Calculation $250,000
$200,000 04-2014
04-2015
04-2016
04-2017
04-2018
04-2019
04-2020
04-2021
Current as of April 10, 2022. Data is Copyright © 2022 All Rights Reserved. MLS of Hilton Head Island. Provided by the Hilton Head Area Association of REALTORS® and South Carolina REALTORS®. Report © 2022 ShowingTime. | 7
All MLS All MLS — — Colleton Colleton RiverRiver — —
9
