Monthly Market Indicators A Research Tool Provided by the Multiple Listing Service of Hilton Head Island and the Hilton Head Area Association of REALTORS®
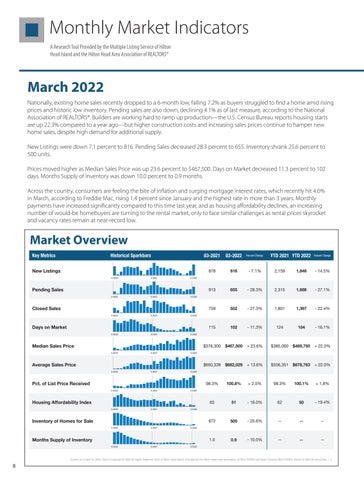
March 2022 Nationally, existing home sales recently dropped to a 6-month low, falling 7.2% as buyers struggled to find a home amid rising prices and historic low inventory. Pending sales are also down, declining 4.1% as of last measure, according to the National Association of REALTORS®. Builders are working hard to ramp up production—the U.S. Census Bureau reports housing starts are up 22.3% compared to a year ago—but higher construction costs and increasing sales prices continue to hamper new home sales, despite high demand for additional supply. New Listings were down 7.1 percent to 816. Pending Sales decreased 28.3 percent to 655. Inventory shrank 25.6 percent to 500 units. Prices moved higher as Median Sales Price was up 23.6 percent to $467,500. Days on Market decreased 11.3 percent to 102 days. Months Supply of Inventory was down 10.0 percent to 0.9 months. Across the country, consumers are feeling the bite of inflation and surging mortgage interest rates, which recently hit 4.6% in March, according to Freddie Mac, rising 1.4 percent since January and the highest rate in more than 3 years. Monthly payments have increased significantly compared to this time last year, and as housing affordability declines, an increasing number of would-be homebuyers are turning to the rental market, only to face similar challenges as rental prices skyrocket and vacancy rates remain at near-record low.
Market Overview
Market Overview
Key market metrics for the current month and year-to-date figures.
Key Metrics
Historical Sparkbars
New Listings 3-2020
3-2021
3-2022
3-2020
3-2021
3-2022
3-2020
3-2021
3-2022
3-2020
3-2021
3-2022
3-2020
3-2021
3-2022
3-2020
3-2021
3-2022
3-2020
3-2021
3-2022
3-2020
3-2021
3-2022
3-2020
3-2021
3-2022
3-2020
3-2021
3-2022
Pending Sales
Closed Sales
Days on Market
Median Sales Price
Average Sales Price
Pct. of List Price Received
Housing Affordability Index
Inventory of Homes for Sale
Months Supply of Inventory
03-2021
03-2022
Percent Change
YTD 2021 YTD 2022
878
816
- 7.1%
2,159
1,846
- 14.5%
913
655
- 28.3%
2,315
1,688
- 27.1%
759
552
- 27.3%
1,801
1,397
- 22.4%
115
102
- 11.3%
124
104
- 16.1%
$378,300
$467,500
+ 23.6%
$385,000
$469,750
+ 22.0%
$600,338
$682,029
+ 13.6%
$556,351
$678,763
+ 22.0%
98.3%
100.8%
+ 2.5%
98.3%
100.1%
+ 1.8%
63
51
- 19.0%
62
50
- 19.4%
672
500
- 25.6%
--
--
--
1.0
0.9
- 10.0%
--
--
--
Percent Change
Current as of April 10, 2022. Data is Copyright © 2022 All Rights Reserved. MLS of Hilton Head Island. Provided by the Hilton Head Area Association of REALTORS® and South Carolina REALTORS®. Report © 2022 ShowingTime. | 2
8
