Annual Comprehensive Financial Report Fiscal Year Ended June 30, 2024

Annual Comprehensive Financial Report Fiscal Year Ended June 30, 2024
for the Fiscal Year Ended June 30, 2024
BoardMember Representativeof
M.JerryVeHaun,Chairman
E.GlennKelly,Vice-Chairman
TownofWoodfin
TownofBiltmoreForest
JackieW.Bryson,Secretary/Treasurer WoodfinSanitaryWater&SewerDistrict
MattAshley.Jr.
DouglasDearth
TownofMontreat
TownofWeaverville
SheilaFranklin HendersonCounty
WilliamG.Lapsley HendersonCounty
EstherManheimer
MartinMoore
ChrisPelly
CityofAsheville
BuncombeCounty
CityofAsheville
NathanPennington BuncombeCounty
RobertC.Watts
AlWhitesides
GwenWisler
TownofBlackMountain
BuncombeCounty
CityofAsheville
PreparedBy:FinancialServicesDepartment
W.ScottPowell,CLGFO,DirectorofFinance CherylS.Rice,Accounting Manager
JodyGermaine,BudgetAnalyst


ReportofIndependentAuditor
Management’sDiscussionandAnalysis
BasicFinancialStatements
StatementofNetPosition
StatementofRevenues,Expenses,andChangesinNetPosition StatementofCashFlows
NotestoBasicFinancialStatements

RequiredSupplementalInformation
LocalGovernmentEmployees’RetirementSystem–Scheduleofthe District’sProportionateShareoftheNetPensionLiability(Asset)
LocalGovernmentEmployees’RetirementSystem–Scheduleof DistrictContributions

ScheduleofRevenuesandExpenditures–BudgettoActual(Non-GAAP)
CombiningScheduleofNetPosition,AllFunds(Non-GAAP)
CombiningScheduleofRevenues,Expenses,andChangesin NetPosition,AllFunds–(Non-GAAP)


Thispageintentionallyleftblank.
October 21, 2024
We are pleased to present the Annual Comprehensive Financial Report of the Metropolitan Sewerage District of Buncombe County, North Carolina (MSD or District) for the Fiscal Year ended June 30, 2024. State law requires local governments to publish within five months of the close of each fiscal year a complete set of financial statements presented in conformity with accounting principles generally accepted in the United States of America (GAAP) and audited in accordance with auditing standards generally accepted in the United States of America by a firm of licensed certified public accountants. MSD’s Bond Order requires release of such audited financial statements within seven months of the close of the fiscal year. This Annual Report presents MSD’s financial statements and adds this transmittal letter and statistical data to assist the reader in analyzing our financial statements.
The report consists of management’s representations concerning the finances of the District. Consequently, management assumes full responsibility for the completeness and reliability of all the information presented in this report. To provide a reasonable basis for making these representations, MSD’s management established an internal control framework designed both to protect the District’s assets from loss, theft, or misuse and to compile sufficient reliable information for the preparation of financialstatementsinconformitywithGAAP.Becausethecostofinternalcontrolsshouldnotoutweigh their benefits, MSD’s framework of internal controls has been designed to provide reasonable rather than absolute assurance that the financial statements will be free from material misstatement. As management, we assert that, to the best of our knowledge and belief, this financial report is complete and reliable in all material respects.
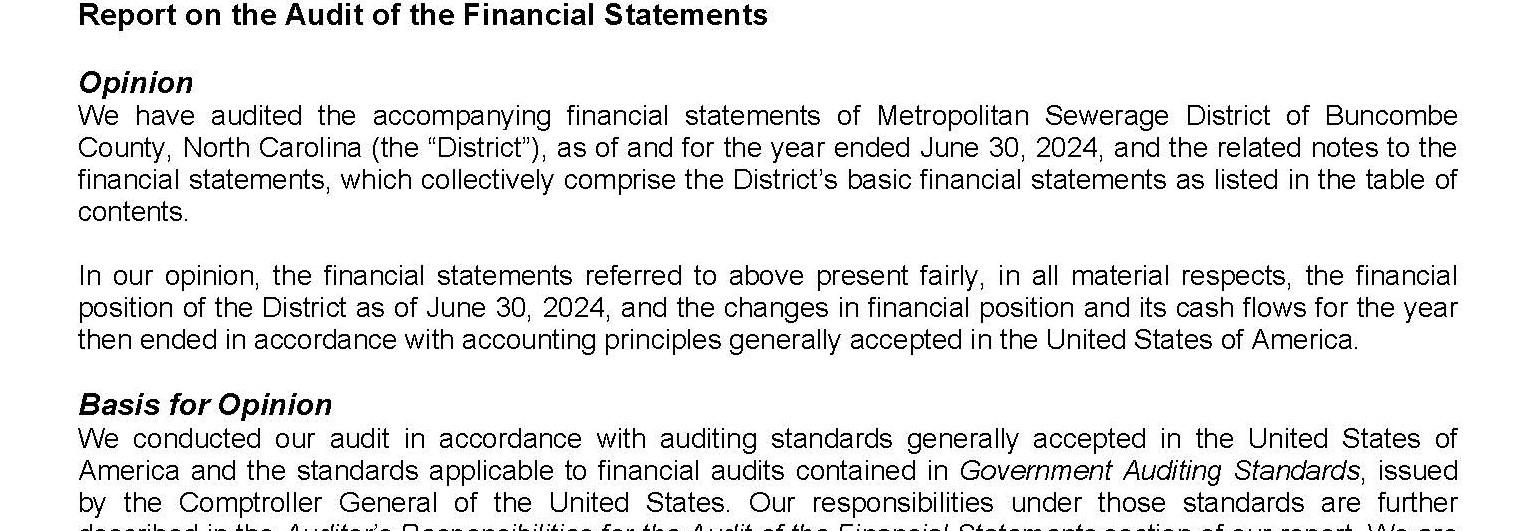
CherryBekaertLLP,afirmoflicensedcertifiedpublicaccountants,hasauditedthefinancialstatements. The goal of the independent audit was to provide reasonable but not absolute assurance that MSD’s financial statements for the Fiscal Year ended June 30, 2024, are free of material misstatement.
The independent audit involved examining, on a test basis, evidence supporting the amounts and disclosures in the financial statements; assessing the accounting principles used and significant estimates made by management; and evaluating the overall financial statement presentation.
The independent auditor concluded, based upon the audit, that there was a reasonable basis for rendering an unmodified opinion that MSD’s financial statements for the Fiscal Year ended June 30, 2024, are fairly presented in conformity with GAAP. The report of the independent auditor is presented as the first component of the financial section of this report.
Accounting standard (GASB No. 34) requires that management provide a narrative introduction, overview, and analysis to accompany the basic financial statements in the form of Management’s Discussion and Analysis (MD&A). This letter of transmittal isdesigned to complement the MD&A, which is placed immediately following the report of the independent auditors and should be read in conjunction with it.
Accounting standard (GASB No. 44) calls for revised statistical reports designed to increase assistance to the reader in assessing the financial situation and condition of the District. Readers may note some changesinreportformatsfromprioryears.Inaddition,newschedulesforwhichthereisnoinformation prior to implementation of GASB No. 34 may have less than the otherwise required ten years of comparative data.
Financial trend information is presented to assist readers in understanding and assessing how a government’s financial position has changed over time. Revenue capacity information is intended to assist users in understanding and assessing the factors affecting a government’s ability to generate revenues.
Debt capacity information is designed to assist users in understanding and assessing a government’s debtburdenanditsabilitytoissueadditionaldebt.Demographic andeconomicinformationisintended to assist users in understanding the socioeconomic environment within which a government operates and provide information that facilitates comparisons of financial statement information over time and among governments.
Operating information should provide contextual information about a government’s operations and resources to assist readers in using financial statement information to understand and assess a government’s economic condition.
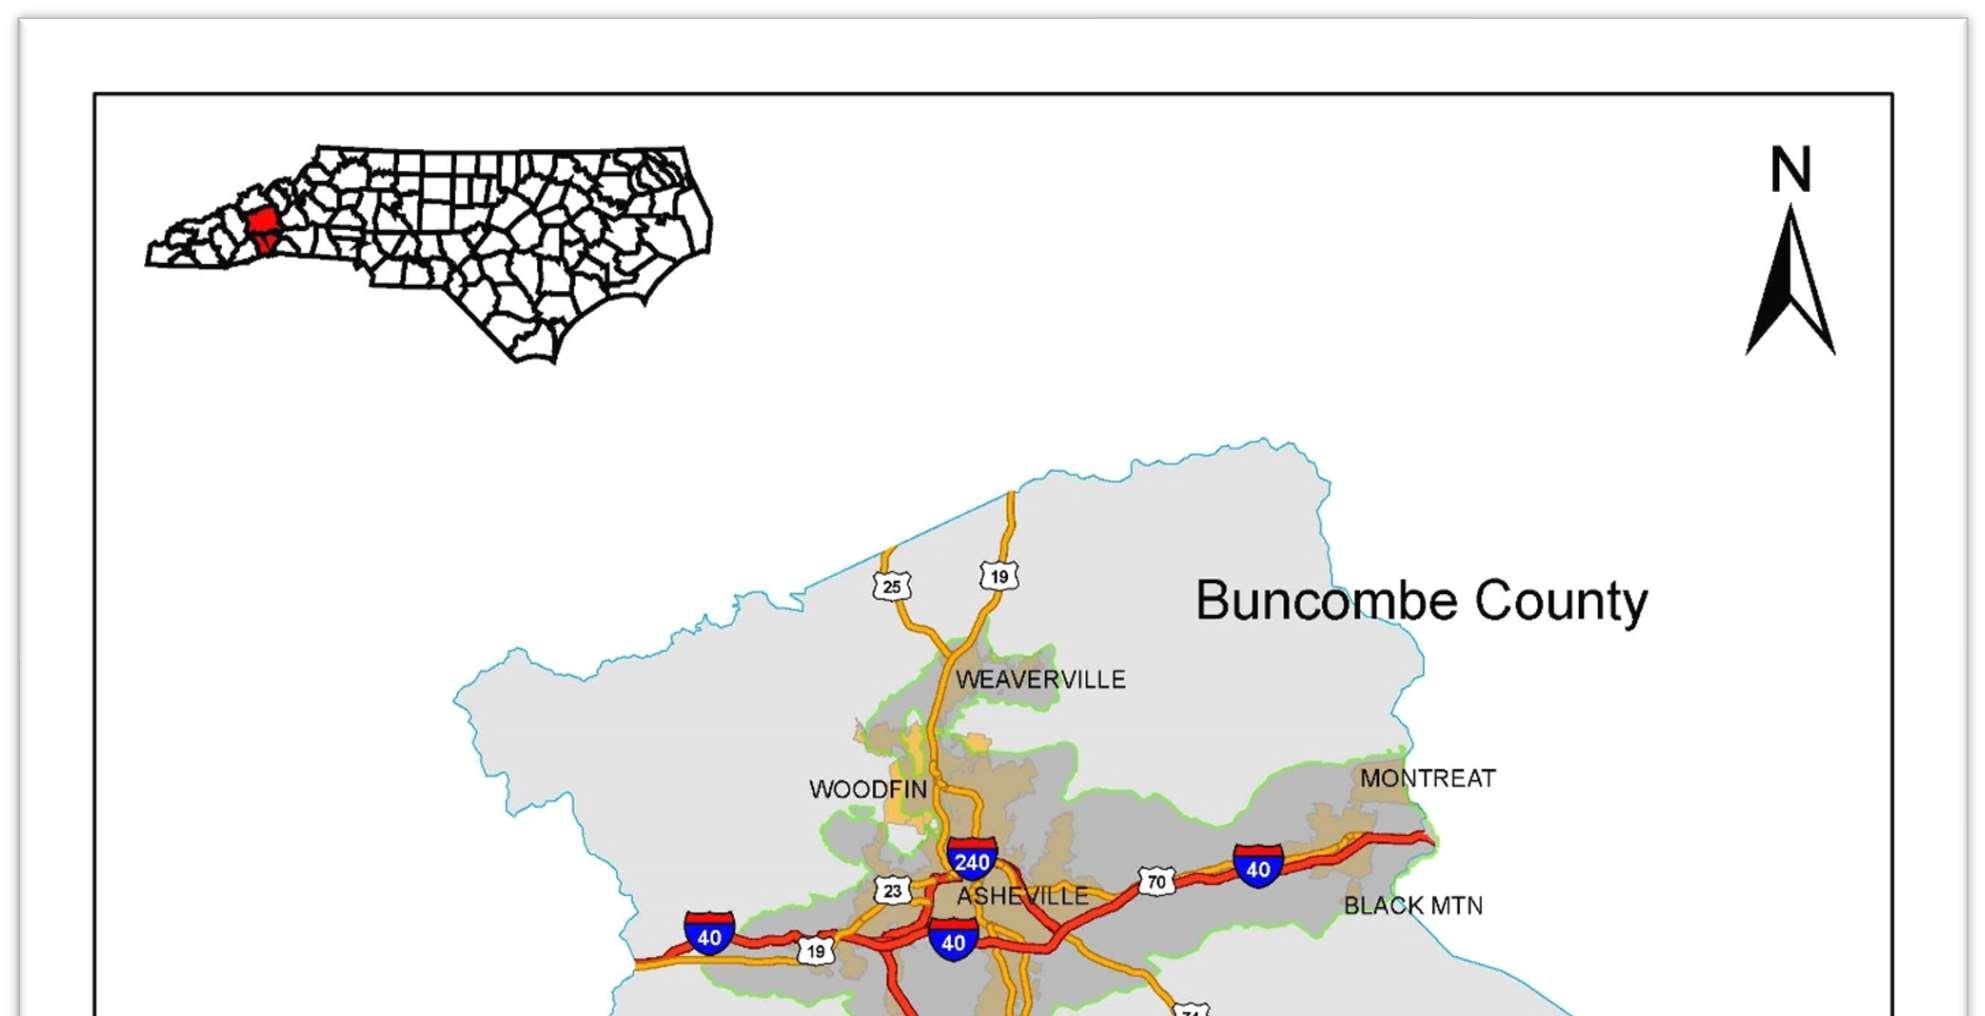
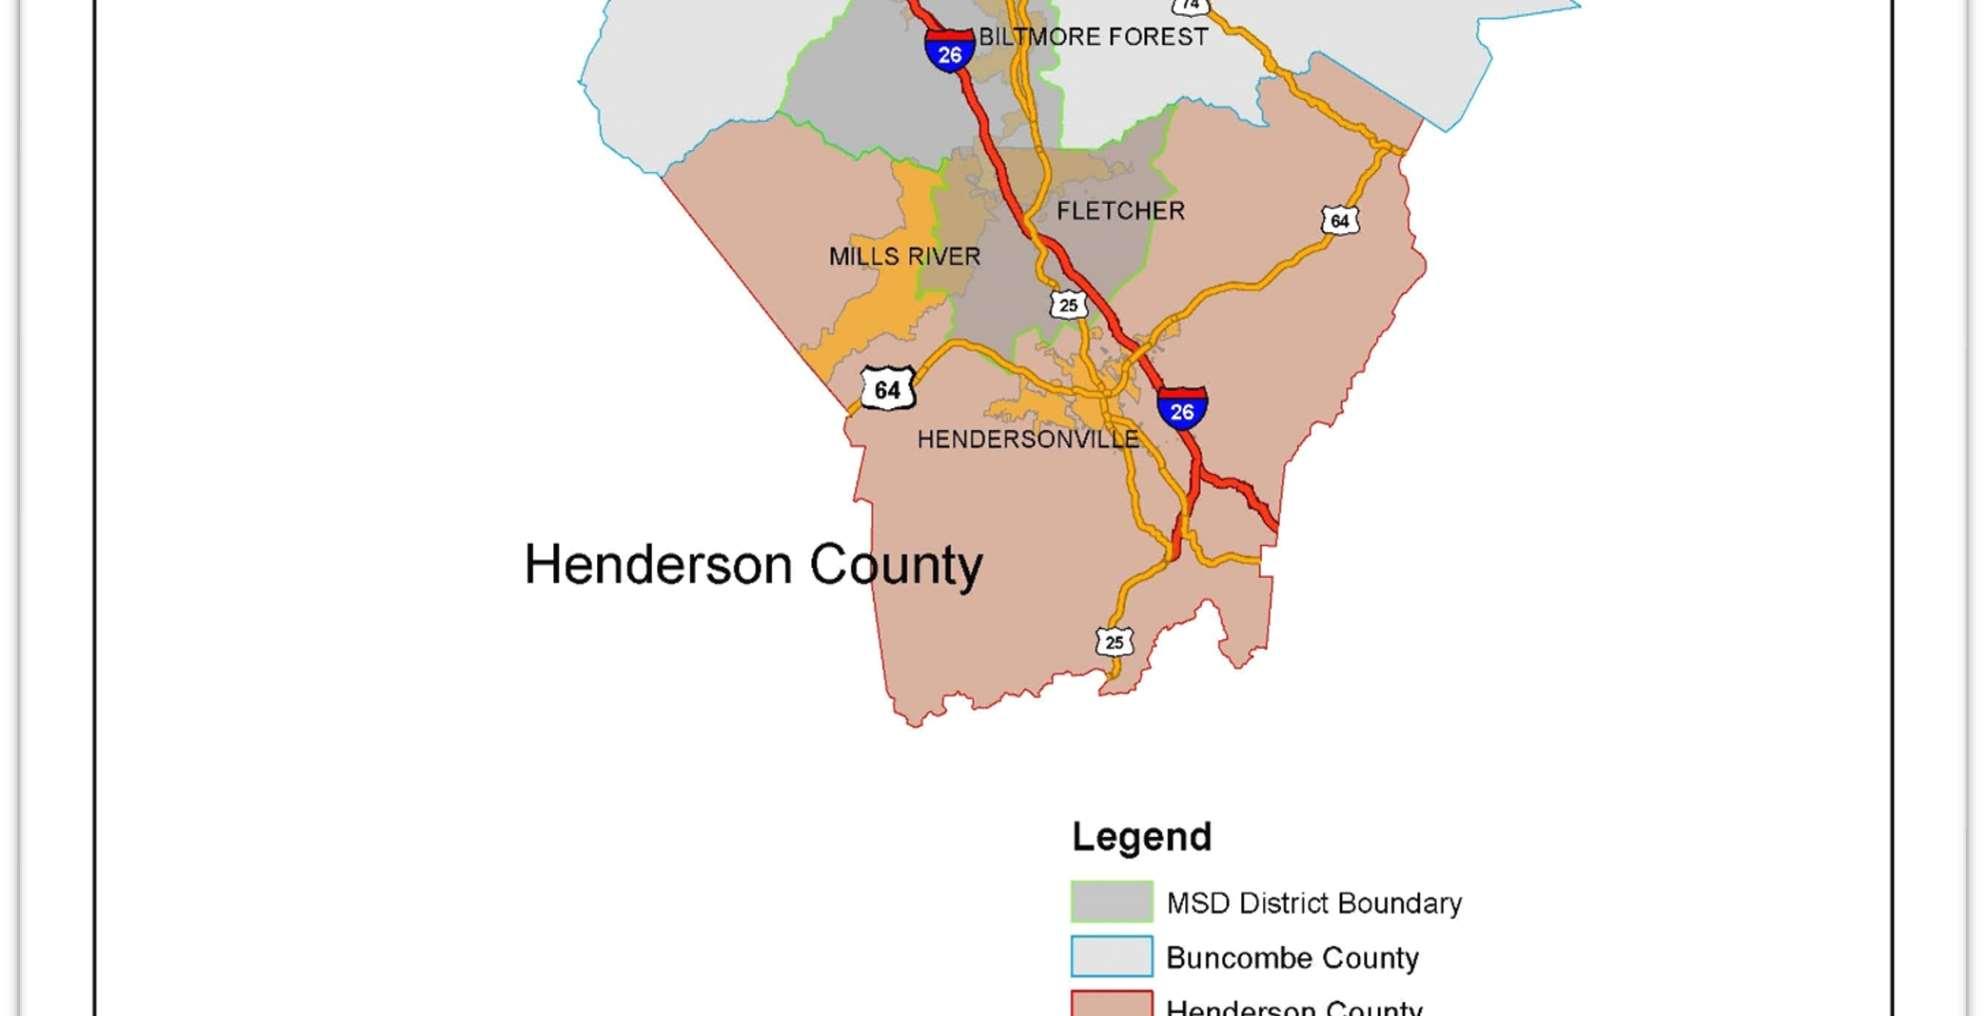
The District was createdby the state of North Carolina in 1962 to provide a wastewater treatment plant serving the City of Asheville and surrounding communities, including Biltmore Forest, Weaverville, Black Mountain, Montreat, Woodfin, the Woodfin Sanitary Water & Sewer District, and certain other unincorporated areas of Buncombe County. Through separate contractual arrangements, the District also serves customers in the Cane Creek Water and Sewer District in northern Henderson County and in the Avery Creek Sanitary Sewer District in southern Buncombe County. The collection system has been extended over the years as a result of expansion and development, andnowcollectswastewaterthroughapproximately1,157 milesofsewerlinewith 34,700 manholes and serves approximately 60,000 residential and commercial customers and over 20 significant industries.
The wastewater treated by the District is gathered in the collector sewer systems located primarily within the boundaries of the municipalities and other political subdivisions comprising the District and conveyed to the wastewater treatment plant through large sewer lines called interceptors that generally run parallel to the French Broad River, the Swannanoa River or one of their primary andsecondary tributaries. Included in the system areremotepumping stationsthat pump wastewater through force mains where gravity flow is not feasible.
With the Sewer Consolidation, which was signed in1990, the District agreedto take possession of andtooperate,maintain,andrepairorreplace,asnecessary,thevariouscollectorsewersystems, which were simultaneously deeded to MSD by these same political subdivisions. Many of the collector sewer systems were undersized, deteriorated, and inadequately maintained. Since taking over the sewer systems, the District has developed and implemented, with input from its member political subdivisions, an ongoing Capital Improvement Program (the “CIP”). Approximately1,432,000linearfeetofexistingsewerlinehavebeenreplacedsinceconsolidation, representing over 27.3% of the entire collection system.
In addition, theDistrict expects to replace approximately 200,000 feet of existingsewer lines over the next five years. The District also has an aggressive program in effect for systematic preventative maintenance of collector sewers. The lines are first cleaned using water under high pressure and then are videotaped. The cleaning reduces line blockages and overflows, and the videotapes enable the District to locate and repair problems in the lines. The District cleans and inspects by videotaping between 15% and 20% of its system each year.
The District also owns, operates, and maintains a 40 million gallon per day (MGD) wastewater treatment plant to treat raw sewage and industrial wastewater as well as a hydroelectric facility, which is used to generate power for the wastewater treatment plant, which helps defray utility costs for the operation.
Member agencies providing water service include the sewer fees on their water bills and provide customer service and collection services to the District for a negotiated fee. However, the District direct bills about 500 customers, predominantly local industries, and private residences served by wells, yet connected to the sewer system.
The annual budget serves as the foundation for the District’s financial planning and control. The Bond Order requires that the District adopt its finalbudget on or before June 15of each year after a preliminary budget hearing no more than 30 days prior to adoption. North Carolina General Statutescallforanannualbalancedbudgetordinance baseduponexpectedrevenues,alongwith abudgetmessage,to bepresentedto thegoverningboardnolaterthanJune1. Duringthespring, District departmental staff work with the Board’s Finance and Personnel Committees to develop an operational budget by function (administration, system services, plant operation, etc.), and District engineers work with the Board’s Planning and Capital Improvement Plan Committees on a capital budget.
After the Board approves the budget, it is administered by Department heads who may make transfers of appropriations within a department and by the General Manager who may make transfersbetweendepartments.Budget toactualcomparisonsoffinancialdatafortheFiscalYear ended June 30, 2024 are in the supplemental information following the notes to the financial statements.
Theinformationpresentedinthefinancialstatementsisperhapsbestunderstoodwhenitisconsidered from the broader perspective of the specific environment within which the District operates.
The Asheville-Buncombe County area in which the District is located possesses a combination of characteristics that help protect it in the current economic climate. They consist of a re-emerging more technologically advanced industrial base, a strong tourism position, concentrated healthcare employment, manufacturing diversity, and positive population in-migration. These factors are discussed in further detail in the Management’s Discussion and Analysis (MD&A).
Local economic development initiatives and various private/public programs have arisen in response to these recent developments designed to strengthen the local economy. Industrial recruitment, workforce development, urban revitalization, broadband access, and improvements to interstate highways are examples of active and pending projects. Area leaders realize the importance of cooperation and action to maintain a healthy, diverse, and sustainable economy.
While industrial usage is uniform, residential, andcommercial expansion has resulted in a higher demand for MSD services, as evidenced by growth in overall revenue, and especially by facility andtapfeesdirectlyresultingfromnewdevelopment.ThemajorityofnewresidentsbeingDistrict customers result from emphasis on in-fill development by local communities and large new subdivisions with developer-donated sewer infrastructure.
In November 2008, the District’s Collection System Master Plan was completed. This plan focuses on the orderly growth of the collection system into future service areas. As the sewer system grows over time, this plan will ensure that extensions of the system are made in an orderly fashion, in accordance with the planning policies of the District’s member agencies.
In 2015, the District updated the Facility Plan for the WRF. It focused on future regulatory requirements, the viability of existing processes, long-term costs, and needed performance. This comprehensive plan recommends various options for the future of the treatment plant and will help the District continue to protect our local environment by implementing the latest technologies in a phased, cost-efficient manner. The short-term and mid-term projects are scheduled within the 10-year CIP.
Using these plans as guides, District engineers developed a ten-year Capital Improvement Program (CIP), which is updated annually. The capital budgeting process begins with considering projects identified in these plans, as well as those recommended by various departments to deal with recurring wastewater collection and treatment problems. Engineering staff prioritize such projects, preparing cost estimates and a suggested timetable for construction.
The CIP Committee, consisting of representatives from the District’s member agencies, meets to review theprogram andtomake recommendationstotheBoard concerningtheCIP’s adoptionas part of the annual budget.
TheCIPcontinuestohavethelargestimpactontheDistrict’scurrentandfuturefinancialposition.
In connection with the long-term CIP, the District prepares a ten-year cash flow projection, which integrates revenue and expenditure projections with planned capital expenditures to anticipate rate increases and timing of debt issuance.
TheDistrictmaintainsanaggressive,proactiverehabilitationprogramforboththeregional1,157mile collection system and the treatment plant facility. MSD assumed ownership and maintenanceofthelocalpublic collectionsystemsin1991andsincethattimeover$515.6million has been re-invested back into the system.
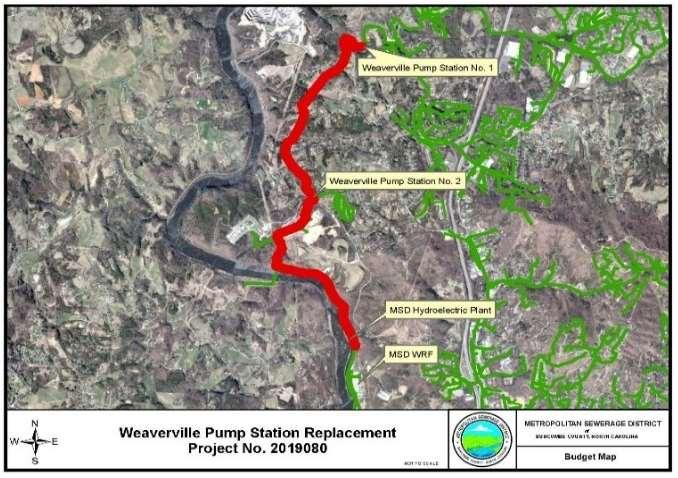
This $24.4M project is for the replacement of the Weaverville Pumping System. The new 5MGD pump station and force main will be sized to accommodate a future expanded service area and sewer flows through 2070. Weaverville PS No. 1 will convey flow directly to the plant, and PS No. 2 (which currently repumps 100% of the flow) will be converted to a smaller residential pump station. Construction is underway and is expected to be completed in Summer 2026.
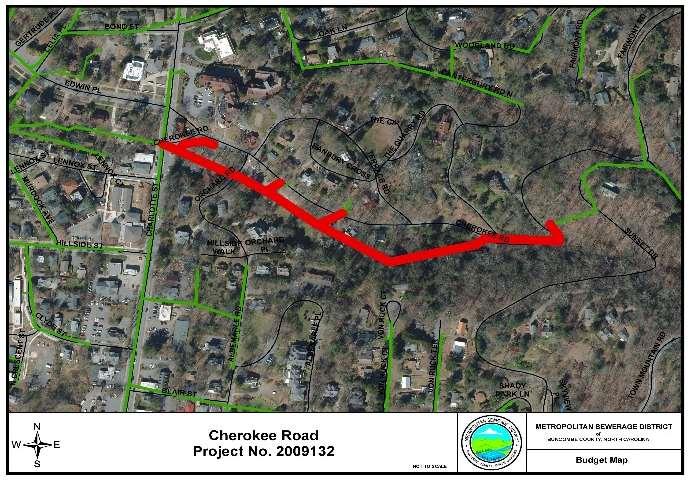
This project replaced approximately 1,960LF of existing sewer main along Cherokee Road in the Albemarle Park Historic District inNorth Asheville. The old line was vitrified clay pipe and was in very poor condition. Several segments ran underneath houses, walls, and other physical features which made repairs very difficult. Rehabilitation was completed via dig and replace, pipe bursting, and CIPP lining.
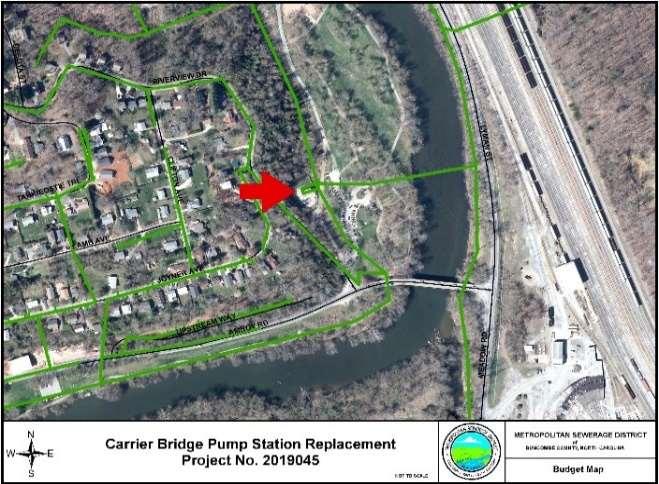
This $85.8M project is for the replacement of the Carrier Bridge Pump Station. Carrier Bridge is the District’s largest pump station and serves significant areas of Buncombe and northern Henderson Counties. Its current capacity is 22 MGD and will be expanded to 40 MGD with the ability to be further expanded in the future. Design and permitting is currently underway, with construction expected to begin by Fall 2025.
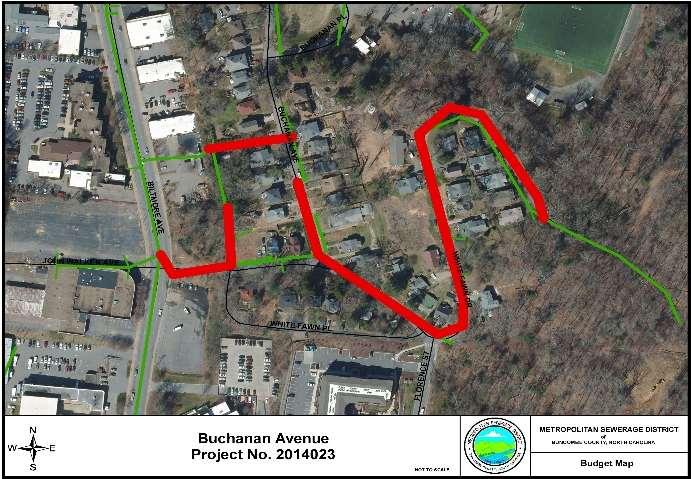
This project was located in downtown Asheville near Biltmore Ave. and just south of McCormick Field. Approximately 2,204 LF of existing6-inchclaylinewas replacedwith8-inchductile iron pipe. The old line had heavy root intrusion, numerous fractures, and one section that was exposed along a steep grade.
This project will replace the plant’s existing biological treatment process, Rotating Biological Contactors (RBC's). This is the most significant project ever proposed by the District and is being driven by regulatory requirements and by the age and condition of the RBCs. The
Evaluation is currently underway and will identify the replacement treatment technology. That report is expected to be complete in late 2025 and design of the new system willfollow. This$230Mprojectmust be complete and in compliance by 2037.
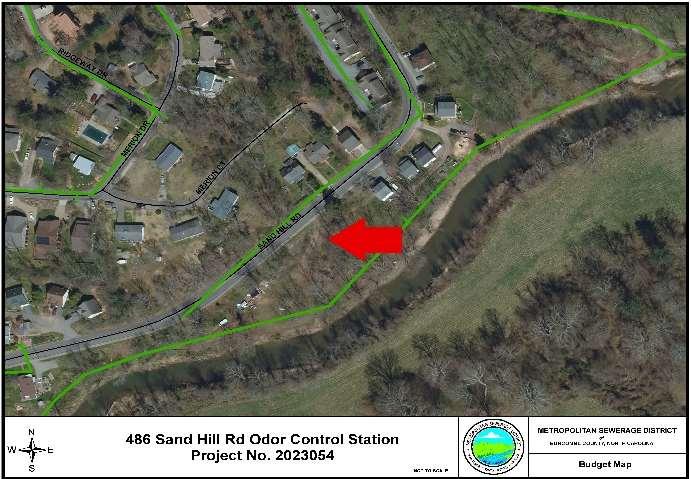
This project replaced the odor control dosingstationthatpreviouslylocatedon Hominy Creek Road and was washed away by aflood in 2021. The new station was relocated to a parcel ownedby MSD alongSandHillRoad,adjacenttoHominy Creek. The new odor control station is located outside the 100-yr floodplain. The project consisted of constructing a raised platform to support the chemical tank, newpumpandelectricalcabinetry.
This project will increase the capacity ofthe solidshandling processesat the treatment plant. Additional capacity is needed to accomodate future flow rates and increased sludge generation from the High Rate Primary Treatment process. A Prelim. Engineering Report (PER) is currently underway to select replacement technology for solids thickening, dewatering, and disposal. The PER is to be completed in early 2025 with design to follow. This project is anticipated to be in excess of $80M.
Reduction of Sanitary Sewer Overflows (SSO’s) is one of the District’s primary goals related to the collection system. This has been accomplished by aggressive rehabilitation and preventative maintenance(linecleaning)programs. Overthepast twelveyears,theDistrict hasrealizeda significant reduction of SSO’s – from 289 in FY2000 to 10 in FY2024.
In February 2017, MSD received a National Environmental Achievement Award from NACWA for its Incinerator System Emissions Upgrades Project. This award recognizes individuals and NACWA member agencies that have outstanding contributions to environmental protection and the cleanwatercommunity.This$7.4millionprojectreducedemissions from the incinerator, and utilized a new mercury removal technology, which saved MSD ratepayers $5 million over traditional technology.
The District was recognized once again for outstanding wastewater treatment efforts by the National Association of Clean Water Agencies (NACWA) and received the prestigious NACWA Gold Award signifying consistent NPDES permit compliance during the 2019 calendar year. This marks the nineteenth year the District has been honored with a “Peak Performance Award” representing continued excellence in environmental protection.
NationalAssociationofCleanWaterAgencies(NACWA)establishedtheExcellenceinManagement(EIM) Recognition Program to recognize public clean water utilities that implement progressive management initiatives and thereby advance the goals of the Clean Water Act. NACWA is committed to clean water and a healthy environment and strives to help ensure that member agencies have the tools they need to meet these objectives. In 2015, the District received gold recognition.
The Systems Services Department reclassified a management position to that of a first responder to handle emergency calls between 2:00 p.m. and 10:30 p.m. as well as holidays, which reduced average response time from 90 minutes in FY2006 to 32 minutes in FY2024.
TheDistrictreceivedfavorableregulatoryreportsfromtheNorthCarolinaDepartmentofEnvironmental Quality (NCDEQ) for wastewater discharge, pretreatment, collections system, and air quality permits. In addition, the District maintained ISO 14001 Environmental compliance certification.
Another requirement of the annual Collection Systems permit is to perform preventative maintenance on at least 600,000 linear feet of sewer line. Duringthecurrent year, theDistrict cleaned approximately 898,177 linear feet.
The District issued revenue bonds most recently in May 2018. In accordance with the requirements of the Securities Exchange Commission Rule 15C-12, as amended, and the North Carolina Local Government Commission, the District will provide continuing disclosure information to recognized municipal security information repositories. This will include the audited financial statements, historical net revenues and debt coverage, future rate increases and listing of the District’s largest commercial and industrial customers.
The Government Finance Officers Association of the United States and Canada (GFOA) awarded a Certificate of Achievement for Excellence in Financial Reporting to Metropolitan Sewerage District of Buncombe County, North Carolina for its Annual Comprehensive Financial Report (ACFR) for the Fiscal YearendedJune30,2023.Thiswasthetwenty-ninthconsecutiveyearthattheDistricthasachievedthis prestigious award. In order to receive a Certificate of Achievement award, a government must publish an easily readable and efficiently organized comprehensive annual financial report. This report must satisfy both generally accepted accounting principles and applicable legal requirements.
A Certificate of Achievement is valid for a period of one year only. We believe that our current ACFR continues to meet the Certificate of Achievement Program’s requirements and we are submitting it to the GFOA to determine its eligibility for another certificate.
Inaddition,theDistrictalsoreceivedtheGFOA’sDistinguishedBudgetPresentationAwardforitsannual FY2024 budget document. In order to qualify for the Distinguished Budget Presentation Award, the District’sbudgetdocumentwasjudgedproficientinseveralcategories,includingasapolicydocument, afinancialplan,anoperationsguide,andacommunicationsdevice.Thisisthetwenty-sixthconsecutive year that the District has achieved this prestigious award.
Thepreparationofthisreportcouldnothavebeenaccomplishedwithoutthededicatedservicesofstaff throughout the District and the District’s independent auditor, Cherry Bekaert LLP. We would like to acknowledge the hard work and dedication of Cheryl Rice, the District’s Accounting Manager. In addition,aspecialthankstoJodyGermainewhoassembledtheAnnualReportdocumentsandprepared the graphs, and to Asheville Chamber of Commerce for the current economic data and insightful identification of business trends.
We also would like to thank the members of the Finance Committee and Board for their support of maintaining high standards of fiscal accountability and responsibility for the District.
Respectfully Submitted,

Thomas E. Hartye, P.E.
W. Scott Powell, CLGFO General Manager Director of Finance


BoardMembersRepresentativeof
MattAshley,Jr.TownofMontreat
JackieW.Bryson,Secretary/TreasurerWoodfinSanitaryWater&SewerDistrict
DouglasDearthTownofWeaverville
SheilaFranklinHendersonCounty

E.GlennKelly,Vice-ChairmanTownofBiltmoreForest
WilliamG.LapsleyHendersonCounty
EstherManheimerCityofAsheville
MartinMooreBuncombeCounty
ChrisPellyCityofAsheville

NathanPenningtonBuncombeCounty
M.JerryVeHaun,ChairmanTownofWoodfin
RobertC.WattsTownofBlackMountain
AlWhitesidesBuncombeCounty
GwenWislerCityofAsheville


Number


This page intentionally left blank.
As management of the Metropolitan Sewerage District of Buncombe County (District), we offer readers of the District’s financial statements this narrative overview and analysis of the District’s financial activities for the Fiscal Year ended June 30, 2024.
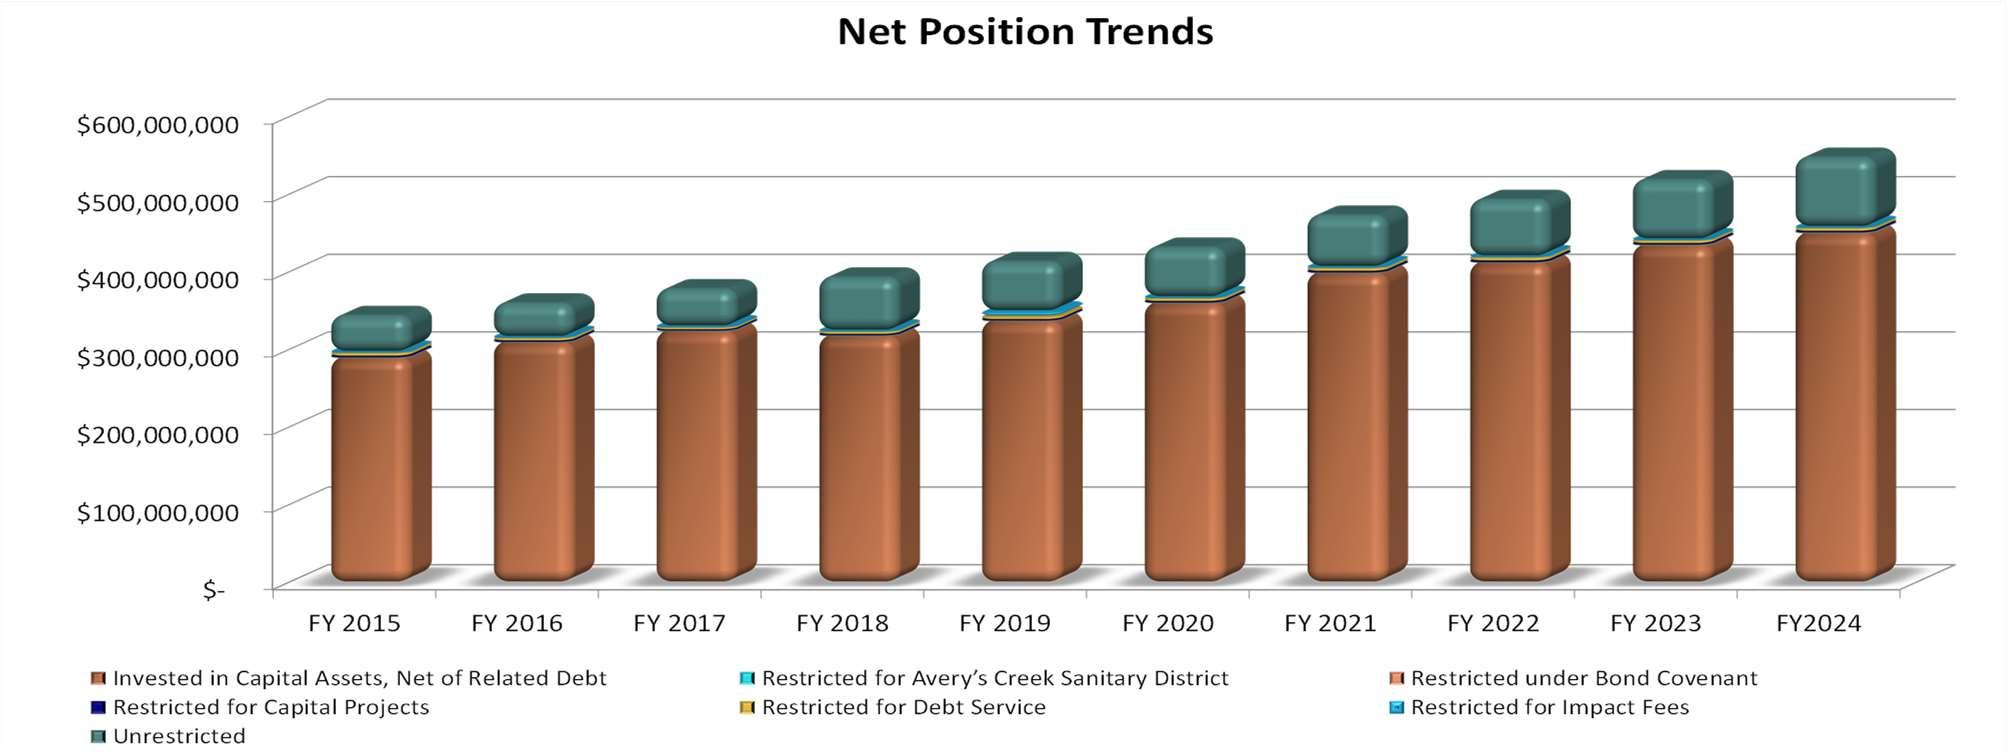
Net Position is defined as the value of all assets, plus deferred outflows of resources, less all liabilities and deferred inflows of resources. Restricted net position is restricted by law, bond covenant, or other contractual arrangement, less debt incurred. The financial well-being of a government is reflected to a large degree by the growth of net position.
The District’s net position totals $548.4 million and reflects a $28.9 million or 5.6% increase from the prior year. The income and expense items affecting this improvement will be discussed in greater detail in the section, “Financial Analysis of the District” on page 3.
The $28.9 million increase is attributable to the District’s normal operations and includes contributed capital assets from developers of $4.6 million.
Net investment in capital assets increased by $15.6 million or 3.6%, evidencing the District’s continued rehabilitation of infrastructure as well as an increase in donated capital.
After principal repayments of $5.6 million, the District has approximately $76.4 million of outstanding debt exclusive of related unamortized discounts and premiums.
This Discussion and Analysis is intended to serve as an introduction to the District’s basic financial statements. TheDistrict’sbasic financial statements are comprised of two components: the financial statements and notes to the financial statements that explain in more detail some of the information in the financial statements.
Afterthenotes,supplementalinformationisprovidedtoshow detailsabouttheDistrict’sfundstructure as set forth in the Bond Order. Budgetary information required by the North Carolina General Statutes also can be found in this part of the statements.
The financial statements of the District report information about the District using accounting methodssimilar to those used by private-sector companies. There are three requiredstatements, which provide both long-term and short-term information about the District’s overall financial status.
The Statement of Net Position presents information on all the District’s assets, plus deferred outflows of resources, less liabilities, and deferred inflows of resources with the difference reported as net position. This Statement provides information about the types and amountsofresources(assets),deferredoutflowsofresources,theobligationstotheDistrict’s employees andcreditors (liabilities),anddeferredinflowsofresources,whichmaybe used to measure the financial health of the District by providing the basis for evaluating the capital structure of the District and assessing liquidity and financial flexibility.
The Statement of Revenues, Expenses, and Changes in Net Position presents the current year’s results of operations and can be used to determine how successful the District hasbeenincollectingrevenues,controllingexpenses,andrecoveringcoststhroughuserfees and charges.
The final required financial statement is the Statement of Cash Flows. This Statement reports cash receipts, cash payments, and net changes in cash resulting from operating, investing,andcapitalandrelatedfinancingactivities,andmaybeusedtodeterminehowcash originated, what that cash was used for, and how these activities resulted in the change to cash balance during the year.
These financial statements should be evaluated with other external factors such as economic conditions, regional employment statistics, and population growth for a more complete analysis of the District’s current and future financial condition.
As previously noted, net position may serve over time as one useful indicator of an entity’s financial condition. The District’s assets plus deferred outflows of resources exceeded liabilities and deferred inflows by $548.4 million at June 30, 2024.
ThelargestproportionoftheDistrict’snetposition,approximately82.2%,reflectstheDistrict’snet investmentincapitalassets(e.g.,land,buildings,interceptor and collectorsewerlines,treatment facilities, equipment, etc.), less any related debt outstanding that was issued to acquire these items. As these assets are required to provide wastewater collection and treatment services, these resources are not available for future spending. Although the District’s investment in its capital assets is reported net of the outstanding related debt, the resources needed to repay that debt must be provided by other sources as the capital assets cannot be used to liquidate these liabilities.
An additional $7.2 million or 1.3% of the District’s net position are funds restricted by the Bond Order to be held in reserve for either debt service or for emergency capital equipment repair or replacement.Theremainingbalanceof$90.3millionis unrestrictedandmay beusedtofund payas-you-go capital projects, medical or workers’ compensation claims, replacement reserves, or any other legal purpose.
The District’s overall financial position improved during the Fiscal Year ended June 30, 2024 as overallnetpositiongrewby5.6%.TheDistrict’sfinancialstrategyistosetratesatalevelsufficient to cover operating and debt service expenses as well as to provide about half of the funding for pay-as-you-go infrastructure rehabilitation. The success of this approach is visible in the continuinggrowthoftheDistrict’snetposition.Currentassetswilldecreasegraduallyascashand investmentsareusedtorehabilitateinfrastructure,until thenextplannedrevenuebondissuance.
The Condensed Statement of Revenues, Expenses, and Changes in Net Position shown in Table 2 below provides information concerning what contributed to the net changes reported in Table 1.
ThissectiondiscussessignificantfactorscontributingtotheDistrict’s5.6%increaseinnetpositionfrom $519.5 million to $548.4 million.
Sewer revenues increased 5.9%. The District raised domestic sewer rates by 5.0% at the beginning of the Fiscal Year 2024. The additional increase was due to better than anticipated revenue as a result of increased usage over the previous year.
Salaries and Employee Benefits—The District experienced a 9.0 % increase in current year expense due to a 6.3% cost of living increase as well as a 6.1% increase in pension expense associated to the statewide Local Governmental Employees Retirement System.
Utilities Expense—An increase in internally generated hydroelectric power attributed to the 6.8% decrease in current year expenses.
Other Supplies and Expenses—The District experienced a 9.5% increase in current year expense due to an increased use of chemical supplies for a new high rate primary treatment process.
Insurance Claims and Expenses— The District experienced a 20.8% increase in current year expenses due to an increase in medical claims in the current year.
C. Investment Income—Increasing short-term interest rates resulted in a 68.9% increase in the District’s interest income.
D. Interest Expense—Interest expense decreased due to the reduction of outstanding debt.
E. Capital Contribution—The amounts reported as capital contributions represent the acquisition value of donated sewer collector lines by developers and member agencies. The District has no direct control over the amount of contributions received. These amounts are reflected as equal income and capital expenditures in the financial statement.
TheDistrictownscapitalassetswithahistoricalcostof$767,255,129.Theseassetsconsistofland (including easements), improvements including a hydroelectric dam, buildings, collector sewer lines, interceptor lines (large pipelines into which collector sewer lines feed), construction equipment and machinery, service vehicles, office machines, computer hardware and software.
The District has begun several projects expected to cost $412.9 million to complete and at June 30, 2024 was committed to contracts expected to cost $26.4 million.
Major capital asset transactions during the year include:
Rehabilitation of over 51,000 feet of sewer line including:
Cherokee Road
Buchanan Avenue
Christian Creek Interceptor
Lining Contract #9
More detailed information on the District’s capital assets is presented in Note 4 to the financial statements.
At June 30, 2024, the District had $76,380,941 in par value of outstanding debt. Unlike cities and counties, the District does not have a debt limit. However, the District’s Bond Order requires that user rates be set to achieve a minimum debt service coverage ratio of 1.2 annually. This means thatin anyyear,aftertheDistrict paysallcurrentoperating expenses,thenetrevenuesremaining must be at least 120% of that year’s principal and interest payments.
The District holds an AA+ rating from Standard & Poor’s, an Aaa rating from Moody’s Investor Service, and an AAA rating from Fitch. These high ratings allow the District to pay a lower rate of interest than other entities with less favorable ratings.
Further details on long-term debt are provided in Note 3 to the financial statements.
The District, located in Buncombe County within the Asheville metropolitan area, has been in a better economic position than many other communities in the state and the nation due to several key factors.
A. Unemployment—From 2003 through 2023, Asheville’s unemployment rate has been among the lowest compared to the other ten metropolitan areas in North Carolina. As of June 2024, Asheville’s unemployment rate was 3.4%. This is below the state and national averages of 4.1% and 4.3%, respectively. Over the past year, about 600 jobs have been subtracted from the economy, decreasing current employment to 207,500.
B. Balanced Economic Growth—TheAshevillemetropolitanareahasdevelopedaunique and balanced economy based on several key drivers. Actions of each driver can overlap and support other drivers in the local economy. History has also shown that a period of weakness for one driver can lead to the expansion of another.
Key drivers include:
Specialized health care industry
Restructured manufacturing sector
Baby-boom generation fueled population growth
Growing professional services sector
Stable tourism activity
Resilient housing market
LocalHealthcareEmployment—Atover37,700workers,healthservicesisnowthelargest industry sector in the Asheville metropolitan area. Ambulatory health services is the chief source of the new jobs. Strong gains in well-paying health services have softened the earlier losses in the traditional manufacturing sector. Historically, stable growth in local healthcare services has had an average annual rate of 2% to 4%. Healthcare has had a 1.6% increase in employment over the previous year.
Manufacturing Employment—With 21,500 workers, manufacturing continues to be transformed into a high-skilled sector restructured around an advanced group of machinery,plastics,andelectronicsmanufacturers. Manufacturingdidexperiencea3.2% decrease over the previous year.
Continued Moderate Population Growth—Population growth remains a consistent and stablecontributortothelocaleconomy.Estimatesindicatemoderategrowthpatternswill continue between 1.5% and 2.0% per year. More than 95% of local population growth is from in-migration, with the remaining from births over deaths.
Professional and Business Sector—The confluence of retiring baby-boomers, local quality of life, and economic growth has resulted in the emergence of a growing professional and business services sector. This sector includesmany highlytechnicaland well-paid services such as engineering, computer design, and temporary employment services. The professional and business sector did experience a 1.9% decrease over the previous year
Themajoreconomic challengefacingtheDistrictisthecontinuedimpactof COVID-19Pandemic on employment and tourism. However, the impacts should be temporary and tempered by the District’s more than adequate cash position.
Based on the District’s projections for residential, commercial, and industrial sewer use, sewer rates will increase by 5.0% for the Fiscal Year ended June 30, 2025. Current projections indicate adequatefunding foroperations,debtservice, andtheDistrict’slong-termCapitalImprovement Program.
This reportis designed toprovide an overview of the District’s financesfor those with an interest in this area. Questions concerning any of the information found in this report or requests for additional information should be directed to W. Scott Powell, Director of Finance, Metropolitan Sewerage District of Buncombe County, 2028 Riverside Drive, Asheville, NC 28804, (828) 225-8211, or spowell@msdbc.org
Statement of Revenues, Expenses, and Changes in Net Position For the Year Ended June 30, 2024
For the Year Ended June 30, 2024
For the Year Ended June 30, 2024 (continued)
Noncashinvesting,capital,andfinancingactivities:
1.AtvarioustimesduringtheyearendedJune30,2024theDistrictreceivedcontributionofsewerlinesconstructed bydeveloperswithareportedestimatedfairvalueof$4,566,137.
3.DuringtheyearendedJune30,2024,atotalof$120,416ofunrealizedappreciationincreasedthefairvalue ofinvestmentsnotconsideredtobecashequivalents.
30, 2024
The accounting policies of the Metropolitan Sewerage District of Buncombe County, North Carolina (District) conform to generally accepted accounting principles as applicable to enterprise-type governments. The following is a summary of the more significant accounting policies:
The District is a public body and body politic and corporate of the State of North Carolina, created pursuant to the North Carolina Metropolitan Sewerage Districts Act (Article 5, Chapter 162A of the GeneralStatutesofNorthCarolina,asamended).TheDistrict wasestablishedin1962bytheNorth Carolina State Stream Sanitation Committee for the purpose of constructing and operating facilities for sewage treatment within the political subdivisions serviced by the District as listed below.
City of Asheville
Beaverdam Water and Sewer District
Town of Biltmore Forest
Town of Black Mountain
Busbee Sanitary Sewer District
Caney Valley Sanitary Sewer District
Crescent Hill Sanitary Sewer District
Woodfin Sanitary Water and Sewer District
Town of Montreat
Enka-Candler Water and Sewer District
Fairview Sanitary Sewer District
Skyland Sanitary Sewer District
Swannanoa Water and Sewer District
Town of Weaverville
Venable Sanitary District
Cane Creek Water and Sewer District
Under the North Carolina Metropolitan Sewerage Districts Act, the District is authorized, among other things, to: (a) acquire, construct, improve, extend, maintain, and operate any sewerage system or part thereof (including facilities for the generation and transmission of electric power and energy) within orwithout theDistrict; (b) to issuerevenuebonds to pay the costs of any of the foregoing;and (c) tosetandcollect rents,rates,fees,andotherchargesforprovisionofsewerage services and the use of any District facilities.
The District Board consists of fourteen members appointed as follows: three from the County of Buncombe, three from the City ofAsheville,two fromthe County of Henderson and one each from
Woodfin Sanitary Water & Sewer District, and the Towns of Biltmore Forest, Black Mountain, Montreat, Woodfin, and Weaverville.
The District owns, operates, and maintains a Wastewater Treatment Plant as well as the related network of collector and interceptor sewers. The Treatment Plant has a capacity to treat up to 40 million gallons per day, but currently receives an average of 20.1 million gallons per day from approximately 60,000 residential and commercial customer accounts transported through approximately 1,157 miles of collector sewers.
The District’s basic financial statements include all transactions of the District for which the Districtisfinanciallyaccountable.Financialaccountabilityisdefinedasappointmentofamajority ofacomponentunit’sboardandeithertheabilitytoimposethewilloftheDistrictorthepossibility that the component unit will provide a financial benefit to or impose a financial burden on the District. Based on these criteria, the District has determined that there are no component units, which come under the criteria for inclusion. The District is not a component unit of any other governmental entity.
The accounts of the District are organized and operated on the basis of funds in accordance with the District’s Bond Order. A Fund is an independent fiscal and accounting entity with a selfbalancingsetofaccountscomprisedofassets,deferredoutflows,liabilities,deferredinflows,net position, revenues, and expenditures or expenses as appropriate. Fund accounting segregates funds according to their intended purpose and is used to aid management in demonstrating compliancewithfinance-relatedlegal and contractual provisions. The minimum number of funds is maintained consistent with legal and managerial requirements.
TheDistrictpresentsthebasicfinancialstatementsasaproprietaryfundbasis.A proprietaryfund accounts for those operations (a) that are financed and operated in a manner similar to private business enterprises where the intent of the governing body is that costs (expenses, including depreciation) of providing goods or services to the general public on a continuing basis be financed or recovered primarily through user charges; or (b) where the governing body has decided that the periodic determination of revenues earned, expenses incurred, and/or net incomeisappropriateforcapitalmaintenance,publicpolicy,managementcontrol,accountability, and other purposes.
Theproprietaryfundisaccountedforontheflowofeconomicresourcesmeasurementfocus.With this measurement focus, all assets and deferred outflows of resources, and all liabilities and deferred inflows of resources associated with the operation of these funds are included on the balance sheet. Proprietary Funds are presented in the financial statements on the accrual basis of accounting. Under this basis, revenues are recognized in the accounting period when earned and expenses are recognized in the period incurred.
Budgets are adopted as required by state statute and in compliance with the Bond Order. All annualappropriationslapseatfiscalyear-end.Thebudgetis preparedusingthe modifiedaccrual basis of accounting, which is consistent with the accounting system used to record transactions during the fiscal year. Expenditures may not legally exceed appropriations at the functional level. Managementisauthorizedtotransferappropriationswithinadepartment;however,anyrevisions thataltertotalexpendituresofanyfunctionmustbeapprovedbythegoverningboard.Therewere no budget amendments.
As required by North Carolina State law [G.S. 159-26(d)], the District maintains encumbrance accounts, which are considered to be “budgetary accounts”. Encumbrances outstanding at yearend represent the estimated amounts of the expenditures ultimately to result if unperformed contracts in progress at year-end are completed. Encumbrances outstanding at year-end do not constitute expenditures or liabilities.
All deposits of the District are made in board-designated official depositories and are secured as required by State law [G.S. 159-31]. The District may designate as an official depository any bank orsavingsandloanassociationwhoseprincipalofficeislocatedinNorthCarolina.Inaddition,the Boardmayestablishtimedeposit accounts suchasNOWandSuperNOWaccounts,moneymarket accounts, and certificates of deposit.
State law [G.S. 159-30(c)] authorizes the District to invest in obligations of the United States or obligations fully guaranteed both as to principal and interest by the United States; obligations of the State of North Carolina, (the “State”); bonds andnotes of any NorthCarolina local government or public authority; obligations of certain non-guaranteed federal agencies, and certain high
quality issues of commercial paper and bankers’ acceptances and the North Carolina Capital Management Trust (NCCMT).
The District’s Bond Order limits investments to:
a. government obligations;
b. obligations of the following agencies: Federal Financing Bank, Federal Home Loan Banks, Federal Home Loan Mortgage Corporation (except for stripped mortgage securities which are purchased at prices exceeding their principal amounts), The Federal National Mortgage Association(exceptforstrippedmortgagesecuritieswhich are purchasedat pricesexceeding theirprincipalamounts),theGovernmentNationalMortgageAssociation,theFederalHousing Administration, and the Farmers Home Administration;
c. direct general obligations of the State secured by the full faith and credit and taxing power of the State rated in one of the two highest rating categories by Moody’s and S&P;
d. bonds and notes of any North Carolina local government or public authority (other than the District), subject to such restrictions as the Secretary of the Local Government Commission may impose, provided such bonds or notes are rated in one of the two highest rating categories by Moody’s and S&P;
e. savings certificates or certificates of deposit issued by any commercial bank or savings and loan association organized under the laws of the State or in any federal bank or savings and loan association having its principal office in the State; provided, however, that any principal amount of such certificatesin excess of the amount insured bythe federal government or any agency thereof; or by a mutual deposit guaranty association authorized by the Administrator of the Savings Institutions Division of the Department of Commerce of the State, be fully collateralized by obligations reserved by financial institution;
f. primequalitycommercialpaper(havingoriginalmaturitiesofnotmorethan270days)bearing the highest rating of Moody’s and S&P and not bearing a rating below the highest by any nationally recognized rating service which rates the particular obligation;
g. participatingshares in the government portfolio of North Carolina Capital Management Trust, provided that the investments of such fund are limited to those qualifying for investment under this definition and that said fund is certified by the Local Government Commission;
h. acommingledinvestmentpoolestablishedandadministeredbytheStateTreasurerpursuant to G. S. 147-69.3;
i. repurchase agreements with respect to Government Obligations if entered into with certain restrictions;
j. anyotherinvestmentnoworhereafterpermittedforinvestmentoffundsbytheDistrictbythe GeneralStatutesofNorth Carolina,including,withoutlimitation,Section159-30oftheGeneral Statutes of North Carolina.
TheDistrict’sinvestmentswithamaturityofmorethanoneyearatacquisitionandnon-money market investments are reported at fair value as determined by quoted market prices. The NCCMT Government Portfolio invest in treasuries and government agencies, is a money market fund (2a7), and maintains an AAAm rating from S&P and AAA-mf by Moody’s Investor Service. It is reported at fair value.
Any unexpended bond proceeds from the revenue bonds issued by the District are classified as restricted assets because their use is completely restricted to the purpose for which the bonds were originally issued. Cash and investments included in the District’s bond service and debt service reserveaccountsareclassifiedasrestrictedbecausetheiruseiscompletelyrestrictedfor reserves and debt service of the outstanding bonds. The District first applies restrictedresources when an expense is incurred for purposes for which both restricted and unrestricted net position is available.
Any amounts payablefrom restrictedassetsare considered restricted liabilities. At June 30, 2024, the bond interest payable of $1,224,361 and the current portion of long-term debt of $5,826,824 represent total restricted liabilities of the District.
All receivables that historically experience uncollectible accounts are shown net of an allowance fordoubtfulaccounts.Thisamountisestimatedbasedonthepercentageofreceivablesthatwere written off in prior years. The allowance was $3,041,431 as of June 30, 2024.
Inventories consist of materials and supplies held for consumption and expensed as used. Inventories are valued at cost (first-in, first-out) which approximates market.
Capital assets, primarily property and equipment, are recorded at original cost at acquisition or construction. Donated capital assets are recorded at acquisition value. Assets costing at least $15,000 and with a useful life greater than one year are capitalized. The cost of normal maintenance and repairs that do not add to the value of the asset or materially extend asset lives are not capitalized.
Depreciation is computed on the straight-line basis. Assets are depreciated based on useful life estimated by District engineers as follows. See Note 4 for further details.
In addition to assets, the Statement of Net Position reports a separate section for deferred outflowsofresources.Thisseparatefinancialstatementelement,DeferredOutflowsofResources, represents a consumption of net assets that applies to a future period and therefore will not be recognized as an expense until that period.
In addition to liabilities, the Statement of Net Position will sometimes report a separate section for deferred inflows of resources. This separate financial statement element, Deferred Inflows of Resources, represents an acquisition of net assets that applies to a future period and so will not be recognized as revenue until then.
The vacation policy of the District provides for the accumulation of up to forty (40) days earned vacation leave with such leave being fully vested when earned. Accordingly, an expense and a liability for compensated absences and any salary-related payments such as retirement
contributions and payroll taxes are recorded. Accumulated earned vacation at June 30, 2024 is $1,097,732. See Note 3D for further details.
The District's sick leave policy provides for an unlimited accumulation of earned sick leave. Accumulated sick leave at June 30, 2024 amounts to approximately $3.54 million. Sick leave does not vest but any unused sick leave accumulated at the time of retirement may be used in the determination of length of service for retirement benefit purposes. Since the District has no obligation for the accumulated sick leave until it is actually taken, no accrual for sick leave has been made.
ForthepurposesoftheStatementofCashFlow,theDistrictconsidersallhighlyliquidinvestments (including restricted assets) with an original maturity of three months or less when purchased to be cash equivalents.
The preparation of financial statements in conformity with generally accepted accounting principles in the United States of America requires management to make estimates and assumptions that affect the reported amounts of assets, liabilities, and disclosures of contingent assetsandliabilitiesatthedateofthefinancialstatementsandthereportedamountsofrevenues and expenses during the reporting period. Actual results could differ from those estimates.
The District defines operating revenues and expenses as those directly received and incurred in the process of providing wastewater collection and treatment. Nonoperating revenues and expenses are those resulting from incidental functions such as investment income, interest expense on long-term debt, and sale of surplus equipment.
For purposes of measuring the net pension liability, deferred outflows of resources, deferred inflows of resources related to pensions, pension expense, information about the fiduciary net position of the Local Governmental Employees’ Retirement System (LGERS), and additions to/deductionsfromLGERS’fiduciarynetpositionhavebeen determinedonthesamebasisasthey are reported by LGERS. For this purpose, plan member contributions are recognized in the period
inwhichthecontributionsaredue.TheDistrict’semployercontributionsarerecognizedwhendue and the District has a legal requirement to provide the contributions. Benefits and refunds are recognized when due and payable in accordance with the terms of LGERS. Investments are reported at fair value.
The District participates in one other postemployment benefit plan (OPEB) for health insurance (Plan). The District currently finances the Plan following a pay-as-you-go approach, paying an amounteachyearequaltopremiumsrelatedtothecoverage.Forpurposesofmeasuringthetotal OPEB liability, deferred outflows and inflows of resources related to OPEB, and the OPEB expense have been determined on the same basis as they are reported by the Plan. For this purpose, the Plan recognizes benefit payments when due and payable in accordance with the benefit terms.
A reconciliation of the District’s deposits and investments for disclosure purposes and cash, cash equivalents, and investments for financial statement presentation as of June 30, 2024 is included below:
100,156,249
AlloftheDistrict’sdepositsareeitherinsuredorcollateralizedbyusingthePoolingMethod.Under the Pooling Method, which is a collateral pool, all uninsured deposits are collateralized with securities held by the State Treasurer’s agent in the name of the State Treasurer. Since the State Treasurer isacting in a fiduciary capacity for the District, these deposits areconsideredto beheld by the District’s agent in the District’s name.
The amount of the pledgedcollateral is basedon an approved averaging methodfor non-interestbearing deposits and the actual current balance for interest-bearing deposits. Depositories using the Pooling Method report to the State Treasurer the adequacy of their pooled collateral covering uninsured deposits. The State Treasurer does not confirm this information with the District or the escrow agent.
Because of the inability to measure the exact amount of collateral pledged for the District under the Pooling Method, the potential exists for under collateralization, and this risk may increase in periods of high cash flows.
However, the State Treasurer enforces strict standards of financial stability for each depository that collateralizes public deposits under the Pooling Method and the District relies on the State Treasurertomonitorthosefinancialinstitutions.TheDistrict’sformallyadoptedinvestmentpolicy attempts to mitigate custodial credit risk for deposits by pre-qualifying the financial institutions receiving funds. The District also complies with the provisions of G.S. 159-31 when designating official depositories and verifying that deposits are properly secured.
At June 30, 2024, the District’s deposits had a carrying amount of $1,329,503 and a bank balance of $1,837,543 of the bank balance, $296,706 was covered by federal depository insurance and $1,540,837 in interest-bearing deposits was covered by collateral held under the Pooling Method.
At June 30, 2024, the District had $350 cash on hand.
As of June 30, 2024, the District had the following investments and maturities.
All investments are measured using the market approach: using prices and other relevant information generated by market transactions involving identical or comparable assets or a group of assets.
Level of fair value hierarchy: Level 1: Debt securities valued using directly observable, quoted prices (unadjusted) in active markets for identical assets. Level2: Debtsecurities are valued using a matrix pricing technique. Matrix pricing is used to value securities based on the securities’ relationship to benchmark quoted prices.
Interest Rate Risk—As a means of limiting its exposure to changes in fair value arising from rising interest rates, theDistrict’s formally adopted investment policycallsfor structuring the investment portfolio so that securities mature to meet cash requirements for ongoing operations and/or scheduled debt service, thereby avoiding the need to sell securities on the open market prior to maturity. In addition, the District invests operating funds primarily in shorter-term securities.
Credit Risk—Credit risk is the risk of loss due to the failure of the security issuer or backer. TheDistrict’sformallyadoptedinvestment policymitigatescreditrisk bylimitinginvestments tothesafesttypes ofsecuritiesandrestrictsthepurchaseofsecuritiestothehighestpossible ratings whenever particular types of securities are rated. As of June 30, 2024, the District’s investments in commercial paper were at least P-1 by Standard & Poor’s, F-1 by Fitch Ratings, andA-1byMoody’sInvestorsService.TheDistrict’sinvestmentsintheNCCapitalManagement Trust Government Portfolio carried acredit rating of AAAm byStandard & Poor’s as of June 30, 2024. The District’s investments in US Agencies(Federal Home Loan Bank and Federal Home Loan Mortage Corporation) are rated AA+ by Standard & Poor’s and Aaa by Moody's Investors Service.
Custodial Credit Risk—For an investment, custodial credit risk is the risk that in the event of the failure of the counterparty, the District will not be able to recover the value of its investments or collateral securities that are in the possession of an outside party. The District’s formally adopted investment policy requires all transactions to be conducted on a delivery-versus-payment (DVP) basis and to be held by a contracted third-party custodian and evidencedbysafekeepingreceipts.At June 30,2024, theDistrict didnot haveanyinvestments exposed to custodial credit risk.
Concentration of Credit Risk—The District’s investment policy mitigates concentration of credit risk, that is, the risk from the failure of any one entity or industry, by limiting the maximumamountof theDistrict’s portfoliothatmaybeinvestedinBankers’Acceptancesand Commercial Paper to 20% each.
Inaddition,theDistrict’sformallyadoptedpolicylimitsinvestmentinanysingleissueofanongovernmental entity to the greater of $5,000,000 or 1% of the entire portfolio.
At June 30, 2024, the District had the following hedging derivative instrument:
The fair value of the interest rate swap is determined using Level 2 inputs of the fair value hierarchy. Inputs used in determining the fair value of the interest rate swap include both observable and unobservable inputs. Observable inputs include the notional amount as shown above and the variable and fixed rates within the swap agreement as disclosed in Note 3c. Unobservable inputs include quoted market prices for similar instruments, discounted cash flow methodologies, or similar techniques.
The mark-to-market valuation was established by market quotations from the counterparty representingestimatesoftheamountsthatwouldbepaidfor replacementtransactions.Because
the coupons on the District’s variable-rate bonds adjust to changing interest rates, the bonds do not have a corresponding fair value increase.
Objective—As a means to lower its borrowingcosts, when comparedagainst fixed-rate bonds at the time of issuance in January 2005, the District issued variable interest rate debt and entered into an interest rate exchange agreement (swap) in connection with its variable rate Series2005RevenueRefundingBondsintheamountof$33,915,000.Theintentionoftheswap was to effectively change the District’s variable interest rate on the bonds to a synthetic fixed rate of 3.4175%.
In April 2008, the District issued $33,635,000 in Series 2008A Revenue Refunding Bonds to currently refund the Series 2005 Revenue Refunding Bonds. The swap described above now applies to the Series 2008A Revenue Refunding Bonds. In April of 2020, the District amended the swap to eliminate the London Interbank Offered Rate (LIBOR) rate it receives as a variable payment. As a result the new synthetic fixed rate is 3.2910%.
Terms—Undertheinitialtermsoftheswap,theDistrictpaysthecounterpartyafixedpayment of 3.4175% and receives a variable payment computed as 59% of the one-month LIBOR plus 35 basis points. In April of 2020, the District amended the term of the swap, the District pays the counterparty a fixed payment of 3.2910% and receives a variable payment computed as 100% of the Securities Industry and Financial Markets Association (SIFMA).
TheswaphadaninitialnotionalamountequaltotheassociatedSeries2005variableratebond principal amount of $33,915,000. The swap was entered into at the same time the Series 2005 Bonds were issued in January of 2005.
Starting in Fiscal Year 2006, the notional value of the swap and the principal amount of the associated debt declined in equal amounts. As the swap now applies to the Series 2008A Bonds, the remaining notional value of the swap is correlated to the variable rate bond principal amount of $33,635,000. Starting in Fiscal Year 2010, the notional value of the swap and the principal amount associated debt decline in similar amounts until the debt is completely retired. The notional amount outstanding is $18,315,000 as of June 30, 2024. The bonds’ variable rate coupons are determined by the remarketing agent based on prevailing market conditions. This usually approximates SIFMA. The bonds and the related swap agreement both mature on July 1, 2031.
CreditRisk—As of June 30, 2024, the District wasnot exposedto credit risk becausethe swap hadanegativefairvalue.However,shouldinterestrateschangeandthefairvalueoftheswap becomes positive, theDistrict would beexposed to credit risk in the amount of the swap’s fair value. The swap counterparty was rated Aa1 by Moody’s and A+ by Standard & Poor’s, and AA by Fitch Ratings as of June 30, 2024. To mitigate the potential credit risk, if the counterparty’s credit quality falls below Baa3 (Moody’s) and BBB-(S&P), the value of the swap may be fully collateralized by the counterparty or by several other means specified in the International Swap Dealers Association (ISDA) Master Agreement and Counterparty Schedule.
Interest Rate/Basis Risk—As noted above, the swap exposes the District to basis risk should the relationship between SIFMA and the bonds’ variable rate coupns determined by the remarketing agent, changing the synthetic rate on the bonds.
The effect of this difference in basis is indicated by the difference between the intended synthetic rate of 3.2910% and the actual synthetic rate for the period ending June 30, 2024 of 3.2410%. As of June 30, 2024, the rate on the District’s bonds was 3.8300% whereas 100% of SIFMAwas3.88%.Ifachangeoccursthatresultsintherates movinginadirectionunfavorable to the District, the expected cost savings may not be realized.
Termination Risk—The interest rate exchange contract uses the ISDA Master Agreement, which includes standard termination events, such as failure to pay and bankruptcy. The ISDA Schedule to the Master Agreement includes an “additional termination event.” That is, the swap may be terminated by the District if the counterparty’s credit quality rating falls below Baa3 (Moody’s) and BBB-(S&P). The District or the counterparty may terminate the swap if the other party fails to perform under the terms of the contract. If the swap was terminated, the variable-rate bonds would no longer carry a synthetic interest rate. In addition, if at the time of termination the swap has a negative fair value, the District would be liable to the counterparty for a payment equal to the swap’s fair value.
Market Access Risk/Rollover Risk—The District’s interest rate exchange contract is for the term (maturity) of the bonds and, therefore, there is no market-access risk or rollover risk.
The District issues debt to help finance the cost of rehabilitation of wastewater interceptor and collection infrastructure, and treatment plant facilities. All debt is secured by a pledge of and payable from net receipts and certain other moneys. In the event of a default, the District agrees topaytothepurchaser,ondemand, interestonanyand all amountsdueandowingbytheDistrict under the related agreements. Unlike cities and counties, the District has no legal debt limit. However, the District must comply with the legal requirements contained in its Bond Order as described in Note 10.
TheDistrict’sborrowingsaresubjecttofederalarbitrageregulations;however,managementdoes not anticipate any material liability for arbitrage from any of these debt issues.
The following is a summary of changes in the Districts’ long-term debt for the Fiscal Year ended June 30, 2024:
Revenue Bonds:
Enka-CandlerWaterandSewerDistrictBondsliabilityassumedbytheMetropolitanSewerageDistrict ofBuncombeCounty,NorthCarolinaonJuly2,1990asstatedinthesewerconsolidationagreement:
5.00%serialbondsassumedJuly2, 1990withmaturitiesoneachJune1, through2024varyingfrom$19,000to $64,000,interestpayableannually
RevenueRefundingBonds,Series2008AissuedtorefundtheSeries2005RevenueRefundingBonds: Interestatvariableratesinthe weeklymode,payablemonthly,due seriallyuntil2031
RevenueRefundingBonds,Series2013issuedtorefundSeries2003andSeries2008BRevenue RefundingBond:
2.0%to5.00%serialbondsissued May1,2013,withmaturitiesoneach July1,2014through2029varying from$1,065,000to$4,255,000: interestpayablesemi-annually
RevenueBonds,Series2014issuedtoconstructcertainsewerageprojects:
2.0%to5.00%serialbondsissued May21,2014,withmaturitieson eachJuly1,2016through2039 varyingfrom$535,000to$1,430,000: interestpayablesemi-annually
5.00%termbondsissuedMay21, 2014,at112.950%,dueJuly1,2039: interestpayablesemi-annually
4,685,000
Revenue Bonds (continued):
RevenueBonds,Series2017issuedtoconstructcertainsewerageprojectsandtorefundportionsof Series2009A:
3.0%to5.00%serialbondsissued July11,2017,withmaturitiesoneach July1,2018through2039varying from$620,000to$2,260,000:interest payablesemi-annually
5.00%termbondsissuedJuly11, 2017,at97.704%,dueJuly1,2042: interestpayablesemi-annually
Direct Borrowings - State Revolving Fund: 2009NorthCarolinaWaterPollutionControlRevolvingFundusedtoconstructcertainsewerage projects: $672,980revolvingloanissued August18,2009unpaidprincipalsum isreducedbyone-halfas"Principal Forgiveness",interestaccruesat0%, 20annualinstallmentsMay1,2011
Plus,netunamortizeddiscountsand
Maturities of long-term debt are as follows:
The revenue bonds are secured by and payable solely from all sewerrevenues of the District after provisions for operating expenses and from certain reserves and other monies of the District, as described in the Bond Order. Additional remittance requirements to the trustee for a sinking fund toredeemthetermbonds,subordinatedindebtednessoutstanding,ifany,andotherpurposesare set forth in the Bond Order.
Interest Rates—Interest rates for variable debt change weekly as determined by the responsible remarketing agent based on competitive municipal bond rates in the secondary market.
LiquidityAgreement—TheDistricthasenteredintoaremarketingagreementwithWellsFargo to perform various functions in connection with the Series 2008A variable debt. The Remarketing Agent’s major responsibilities include soliciting of purchases of Bonds from qualified investors, processing and recordkeeping for such purchases, billing and receiving payment for Bonds purchased, and determining the interest rate on the Bonds as provided in the Series Resolution.
As of June 30, 2024, debt service requirements of the variable-rate debt and net swap payments, assuming current interest rates remain the same for their term, were as follows.
As rates vary, variable-rate bond interest payments and net swap payments will vary.
The computations above are based on the following interest assumptions.
Changes to the liability for compensated absences were as follows:
Balance-June30,2023 $ 964,264 Additions 863,017 Withdrawals (729,549)
Balance-June30,2024 $ 1,097,732
The District accounts for compensated absences on a LIFO basis, assuming that employees are taking leave time as it is earned. For the year ended June 30, 2024, the District estimates that $70,000 is the current portion of this liability.
Changes to the net pension liability (LGERS) were as follows:
Balance-June30,2023 $ 6,247,882
1,192,428
Balance-June30,2024 $ 7,440,310
Changes to the other post-employment benefit liability (OPEB) were as follows:
Balance-June30,2023 $ 3,435,000
A summary of changes in capital assets follows below.
Less Accumulated
Contributed Infrastructure—The District’s responsibility is to maintain existing collector and interceptor sewer lines as well as to provide wastewater treatment. The majority of sewer lines added to the District are constructed by member agencies or developers and donated to theDistrict. Occasionally, owners of private lines will petition the District to take over their sewer lines as well. This infrastructure must meet minimum District engineering standards, and when accepted by Board action, the District assumes all responsibility for future maintenance and rehabilitation. During the year ended June 30, 2024, the District accepted capital assets with an acquisition value of $4,566,137.
Easements—The District acquires right-of-way easements in the course of sewer line rehabilitation projects. These easements have an indefinite useful life and are recorded at cost.
Plan Description—The District is a participating employer in the statewide Local Governmental Employees’ Retirement System (LGERS), a cost-sharing multiple-employer defined benefit pension plan administered by the State of North Carolina. LGERS membership is comprised of general employees and local law enforcement officers (LEOs) of participating localgovernmentalentities.Article3ofG.S.Chapter128assignstheauthoritytoestablishand amend benefit provisions to theNorth CarolinaGeneral Assembly. Management of theplan is vested in the LGERS Board of Trustees, which consists of 13 members – nine appointed by the Governor, one appointed by the State Senate, one appointed by the State House of Representatives, and the State Treasurer and State Superintendent, who serve as ex-officio members. The Local Governmental Employees’ Retirement System is included in the Annual Comprehensive Financial Report for the State of North Carolina. The State’s Report includes financial statements and required supplementary information for LGERS. That report may be obtained by writing to the Office of the State Controller, 1410 Mail Service Center, Raleigh, North Carolina 27699-1410, by calling (919) 981-5454, or at www.osc.nc.gov.
Benefits Provided—LGERS providesretirement andsurvivor benefits.Retirement benefitsare determined as 1.85% of the member’s average final compensation times the member’s years of creditable service. A member’s average final compensation is calculated as the average of a member’s four highest consecutive years of compensation. Plan members are eligible to retirewithfullretirementbenefitsatage65withfiveyearsofcreditableservice,atage60with 25 years of creditable service, or at any age with 30years of creditable service. Plan members are eligible to retire with partial retirement benefits at age 50 with 20 years of creditable service or at age 60 with five years of creditable service. Survivor benefits are available to eligible beneficiaries of members who die while in active service or within 180 days of their last day of service and who haveeither completed20yearsof creditable service regardless of age or have completed five years of service and have reached age 60.
Eligible beneficiaries may elect to receive a monthly Survivor’s Alternate Benefit for life or a returnofthemember’scontributions.Theplandoesnotprovideforautomaticpost-retirement benefit increases. Increases are contingent upon actuarial gains of the plan.
Contributions—ContributionprovisionsareestablishedbyGeneralStatute128-30andmaybe amended only by the North Carolina General Assembly. District employees are required to contribute 6% of their compensation. Employer contributions are actuarially determined and set annually bytheLGERS Board of Trustees. The District’s contractually requiredcontribution rate for the year ended June 30, 2024 was 12.85% for general employees actuarially determined as an amount that, when combined with employee contributions, is expected to finance the costs of benefits earned by employees during the year. Contributions to the pension plan from the District were $1,373,222 for the year ended June 30, 2024.
RefundsofContributions—Districtemployees,whohaveterminatedserviceasacontributing member of LGERS, may file an application for a refund of their contributions. By state law, refunds to members with at least five years of service include 4% interest. State law requires a 60-day waiting period after service termination before the refund may be paid. The acceptance of a refund payment cancels the individual’s right to employer contributions, or any other benefit provided by LGERS.
Pension Liabilities, Pension Expense, Deferred Outflows of Resources, and Deferred Inflows of Resources Related to Pensions—At June 30, 2024, the District reported a liability of $7,440,310 for its proportionate share of the net pension liability. The net pension liability wasmeasuredasofJune 30,2023.Thetotalpensionliabilityusedtocalculatethenetpension liability was determined by an actuarial valuation as of December 31, 2022.
The total pension liability was then rolled forward to the measurement date of June 30, 2023 utilizing updateproceduresincorporating theactuarialassumptions.TheDistrict’sproportion ofthenetpension liability wasbasedonaprojectionof theDistrict’slong-termshareoffuture payroll covered by the pension plan, relative to the projected future payroll covered by the pension plan of all participating LGERS employers, actuarially determined. At June 30, 2024, theDistrict’sproportionwas0.11234%measured asofJune30,2023,which wasaincreaseof 0.00159% from its proportion measured as of June 30, 2022.
For the year ended June 30, 2024, the District recognized pension expense of $2,162,123. At June 30, 2024, the District reported deferred outflows of resources and deferred inflows of resources related to pensions from the following sources:
$1,373,222 reported as deferred outflows of resources related to pensions resulting from District contributions subsequent to the measurement date will be recognized as a decrease of the net pension liability in the year ending June 30, 2025.
Other amounts reported as deferred inflows and outflows of resources related to pensions will be recognized in pension expense as follows:
YearEndingJune30:
Actuarial Assumptions—The total pension liability in the December 31, 2022 actuarial valuation was determined using the following actuarial assumptions, applied to all periods included in the measurement:
inflation
Theplancurrentlyusesmortalitytablesthatvarybyage,gender,employeegroup(i.e.,general, law enforcement officer) and health status (i.e., disabled and healthy). The current mortality rates are based on published tables and based on studies that cover significant portions of the U.S. population. The healthy mortality rates also contain a provision to reflect future mortality improvements.
TheactuarialassumptionsusedintheDecember31,2022valuationwerebasedontheresults of an actuarial experience study for the period January 1, 2015 through December 31, 2019. Future ad hoc COLA amounts are not considered to be substantively automatic and are therefore not included in the measurement.
Theprojectedlong-terminvestmentreturnsandinflationassumptionsaredevelopedthrough review of current and historical capital markets data, sell-side investment research, consultant whitepapers, and historical performance of investment strategies. Fixed income return projections reflect current yields across the U.S. Treasury yield curve and market expectations of forward yields projected and interpolated for multiple tenors and over multiple year horizons. Global public equity return projections are established through analysis of the equity risk premium and the fixed income return projections. Other asset categoriesandstrategies’returnprojectionsreflecttheforegoingandhistoricaldataanalysis.
Theseprojectionsarecombinedtoproducethelong-termexpectedrateofreturnbyweighting the expected future real rates of return by the target asset allocation percentage and by adding expected inflation.
Thetargetallocation andbestestimatesof arithmeticrealratesofreturnforeachmajorasset class as of June 30, 2023 are summarized in the following table:
Theinformationaboveisbasedon30-yearexpectationsdevelopedwiththeconsultingactuary forthe asset,liability,andinvestmentpolicystudyfortheNorthCarolinaRetirementSystems, including LGERS. The long-term nominal rates of return underlying the real rates of return are arithmetic annualized figures. The real rates of return are calculated from nominal rates by multiplicatively subtracting a long-term inflation assumption of 2.5%. All rates of return and inflation are annualized.
Discount Rate—The discount rate used to measure the total pension liability was 6.50%. The projectionofcashflows usedto determinethediscount rateassumedthatcontributions from plan members will be made at the current contribution rate and that contributions from employers will be made at statutorily required rates, actuarially determined.
Based on these assumptions, the pension plan’s fiduciary net position was projected to be available to make all projected future benefit payments of the current plan members.
Therefore, the long-term expected rate of return on pension plan investments was applied to all periods of projected benefit payments to determine the total pension liability.
Sensitivity of the District’s Proportionate Share of the Net Pension Liability to Changes in the Discount Rate—The following presents the District’s proportionate share of the net pension liability calculated using the discount rate of 6.50%, as well as what the District’s proportionate share of the net pension asset or net pension liability would be if it were calculatedusingadiscount ratethatisone percentagepointlower(5.50%)oronepercentage point higher (7.50%) than the current rate:
PensionPlanFiduciaryNetPosition—Detailedinformationaboutthepensionplan’sfiduciary net position is available in the separately issued Annual Comprehensive Financial Report for the State of North Carolina.
Plan Description—The District contributes to the Supplemental Retirement Income Plan of NorthCarolina,oftenreferredtoastheState’s401(k)Plan,adefinedcontributionpensionplan administeredbytheDepartmentofState TreasurerandaBoardofTrustees.ThePlanprovides retirement benefits to employees of the District who are members of LGERS. Article 5 of G.S. Chapter 135 assigns the authority to establish and amend benefit provisions to the North Carolina General Assembly.
Funding Policy—Employee contributions are voluntary and must conform to applicable IRS limits. The District has a graduated matching contribution plan as follows: if an employee contributes 1%, 2%, or 3%, the District will contribute 2%, 4%, or 5%, respectively, of their salary to either the 401(k) Plan or the 457 Plan described below. The District Board has the authority to establish and amend contribution requirements. During the year ended June 30, 2024, a total of $445,326 and $561,065 were contributed by the District and employees, respectively.
Plan Description—The District also offers its employees a Deferred Compensation Plan, another type of defined contribution plan, established under the Internal Revenue Code Section457.ThePlanallowsemployeestodeferreceiptandtaxationofaportionoftheirsalary until future years.
Thedeferredcompensationisnotavailabletoemployeesuntiltermination,retirement,death, or unforeseeable emergency. The Plan is administered by a third-party administrator who establishesandamends benefitprovisionswithintheprovisions oftheInternalRevenueCode Section 457.
All amounts of compensation deferred under the Plan, all property and rights purchased with those amounts, and all income attributable to those amounts, property, and rights (until paid or made available to the employee or other beneficiary) are held in trust for the exclusive benefit of participants and their beneficiaries. As such, these assets and the related obligations are not reported in these financial statements.
Funding Policy—Employee contributions are voluntary and must conform to applicable IRS limits. The District has a graduated matching contribution plan as follows: if an employee contributes 1%, 2%, or 3%, the District will contribute 2%, 4%, or 5%, respectively, of their salary to either the 401(k) Plan described above or a 401(a) Plan. The District Board has the authority to establish and amend contribution requirements. During the year ended June 30, 2024,$26,117and$27,792werecontributedbytheDistrictandemployees,respectively,tothe deferred compensation plan.
Plan Description—The District has elected to provide death benefits to employees through theDeathBenefitPlanforMembersoftheLocalGovernmentalEmployees'RetirementSystem (Death Benefit Plan), a multiple-employer State-administered cost-sharing plan funded on a one-year term cost basis. The beneficiaries of those employees who die in active service after one year of contributing membership in the System, or who die within 180 days after retirement or termination of service and have at least one year of contributing membership service in the System at the time of death are eligible for death benefits. Lump sum death benefit payments to beneficiaries are equal to the employee's 12 highest months’ salary in a
row during the 24 months prior to his/her death, but the benefit may not be below $25,000 or exceed$50,000.All death benefitpaymentsare madefromtheDeathBenefit Plan.TheDistrict has no liability beyond the payment of monthly contributions. Contributions are determined as a percentage of monthly payroll, based upon rates established annually by the State. Because the benefit payments are made by the Death Benefit Plan and not by the District, the District doesnotdeterminethenumberofeligibleparticipants.ThecontributionstotheDeath BenefitPlancannotbeseparatedbetweenthepost-employmentbenefitamountandtheother benefit amount. Contributionsare determinedasa percentageofmonthlypayrollbasedupon rates established annually by the State. The District considers these contributions to be immaterial.
A. Healthcare Benefits
Plan Description—Under terms of a District resolution, the District administers a singleemployer defined benefit group health and dental insurance plan (the GHD Plan). The District Boardhastheauthoritytoestablishandamendthebenefit termsandfinancingrequirements. No assets are accumulated in a trust. However as of June 30, 2024, the District set aside $2,934,402. These funds are to be used to meet the District’s future post-employment obligation.
Benefits Provided—As of May 14, 2008, the plan allows retirees to continue coverage under the Districts' self-insured group health and dental insurance plan until the earlier of reaching age 65; or becoming covered under another group medical plan; or failing to timely pay any required premium for such coverage.
The District will pay the premium cost for the eligible retired employee as follows:
In addition, theDistrict’sretireescanpurchasecoveragefortheirspouse atfullactuarialcost. The District’s Board may amend the benefit provisions. A separate report was not issued for the plan.
Membership in the District’s GHD Plan consisted of the following at July 1, 2023, the date of the latest actuarial valuation:
The District’s total OPEB liability of $3,693,000 was measured as of July 1, 2023 and was determined by an actuarial valuation as of July 1, 2022.
ActuarialAssumptionsandOtherInputs—The total OPEB liabilityin the July 1, 2021 actuarial valuationwasdeterminedusingthefollowingactuarialassumptionsandotherinputs,applied to all periods included in the measurement unless otherwise specified: SalaryIncreases 3.00percent
3.86percent Healthcarecosttrendrates 6.50percentforfiscalyearend2024,decreasing0.25 percentperyeartoanultimaterateof5.00percent
The discount rate is based on the yield of the Fidelity Municipal Bond 20-Year Municipal GO AA Index as of the measurement date.
Changes inthe Total OPEB Liability—
Changesfortheyear
Total $ 3,693,000
Mortality rates were based on the RP-2014 Fully Generation Mortality Table, with base year 2006, using two-dimensional improvement scale MP-2021.
The actuarial assumptions used in the July 1, 2023 valuation were based on the results of an actuarial experience study for the period July 2015 through December 2019.
Sensitivity of the Total OPEB Liability to Changes in the Discount Rate—The following presentsthetotalOPEBliabilityoftheDistrict, aswellaswhattheDistrict’stotalOPEBliability would be if it were calculated using a discount rate that is 1-percentage-point lower (2.86 percent) or 1-percentage-point higher (4.86 percent) than the current discount rate:
Sensitivity of the Total OPEB Liability to Changes in the Healthcare Cost Trend Rates—The following presents the total OPEB liability of the District, as well as what the District’s total OPEB liability would be if it were calculated using healthcare cost trend rates that are 1percentage-point lower (5.50 percent) or 1-percentage-point higher (7.50 percent) than the current healthcare cost trend rates:
OPEB Expense, Deferred Outflows of Resources, and Deferred Inflows of Resources
Related to OPEB—For the year ended June 30, 2024, the District recognized OPEB expense of $339,000. At June 30, 2024, the District reported deferred outflows of resources and deferred inflows of resources related to OPEB from the following sources:
$115,000 reported as deferred outflows of resources related to OPEB resulting from benefit payments made and administrative expenses incurred subsequent to the measurement date will be recognized as a decrease of the total OPEB liability in the year ended June 30, 2025.
Otheramountsreportedasdeferredinflowsandoutflowsofresources relatedto OPEBwillbe recognized in OPEB expense as follows:
The District has established a self-insured group health and dental insurance program, which provides medical coverage up to a maximum of $70,000 per employee, and approximately $2,500,000 in the aggregate. The District purchases commercial insurance for claims in excess of coverage.
All employeesparticipatein theprogramand areresponsibleforpremiumandco-payment amounts as determined by the District. Charges to the Enterprise Fund are adjusted annually so that the program revenues and expenses are approximately equal and there is an adequate amount in reserves in the eventtheDistrictdecidestodiscontinuetheplan.Theaccruedself-insuranceclaimsliabilityof$587,557 reported at June 30, 2024 represents estimated claims liabilities, including incurred but not reported losses, at the estimated ultimate cost of settling the claims using historical experience as determined by the Third-Party Administrator (TPA).
Changes since inception in the claim’s liability amount are as follows:
The District is exposed to various risks of loss related to torts; theft of, damage to, and destruction of assets; errors and omissions; injuries to employees; and natural disasters. The District participates in two self-funded risk-financing pools administeredby the North Carolina League of Municipalities.
Throughthese pools,the Districtobtains generalliabilityandauto liabilitycoverage, propertycoverage up to the total insurance values of the property policy, and workers’ compensation coverage up to statutory limits. The pools are reinsured through commercial companies for single occurrence claims against general liability, auto liability, and property in excess of $500,000 and $300,000 up to statutory limitsforworkers’compensation.Thepropertyliabilitypoolhasanaggregatelimitforthetotalproperty lossesinasingleyear,withthereinsurancelimitbaseduponapercentageofthetotalinsurancevalues.
The District carries commercial coverage for all other risks of loss. There have been no significant reductionsininsurancecoverageintheprioryearandsettledclaimshavenotexceededcoveragein any of the past three fiscal years.
The District carries flood insurance through the National Flood Insurance Plan (NFIP). Because the District’s structures, situated adjacent to the French Broad River, are in an “A” area designated by the Federal Emergency Management Agency (FEMA), the District has purchased coverage in the maximum amount of $500,000 through the NFIP for each eligible structure. Management believes this will be adequate to remediate flood damage to exposed buildings and their contents.
In accordancewithG.S.159-29, theDistricthasadoptedasystemofblanketfaithfulperformancebonds for all employees and has purchased coverage of $100,000 from a commercial insurance carrier. The Finance Officer is individually bonded for $1,000,000.
During the year ended June 30, 2002, consulting engineers finalized a comprehensive twenty-year Wastewater System Master Plan to guide the District in reducing sanitary sewer overflows (SSOs) as wellaskeepingupwiththemaintenanceandmanagementofitsinfrastructure.Theplanestimatedthat the District would need to spend approximately $257 million over a twenty-year period. Portions of this Master Plan are periodically updated as required to meet the needs identified by engineering staff for the Water Reclamation Facility and the collector and interceptor sewer lines. The District uses these plans, along with other resources including representatives from the member agencies, to develop a ten-year Capital Improvement Plan projectedto spend an averageof $61.1 million annually. The District expects to fund these costs out of user charges along with the issuance of additional bonds.
As of June 30, 2024, the District had begun sewer projects expected to incur future costs of approximately $412.9 million, and the District is committed under various contracts encumbered for sewer construction and rehabilitation estimated to cost $26.4 million to complete. The majority of encumbered contracts are expected to be completed within the next fiscal year, and the projects currently under construction are scheduled to be completed within the next two to five years.
The District is subject to the 1999 Amended Bond Order, which contains several operational directives including internal accounting fund structure, disclosure of financial records, and setting rates. A copy of the Bond Order may be obtained by contacting the Director of Finance.
The District is required by the 1999 Amended Bond Order to set rates as summarized by the following:
TheDistrictcovenantstosetratesandchargessothattheIncomeAvailableforDebtService(defined astheexcessof“Revenues”over“CurrentExpenses”)willnotbelessthanthegreaterof(i)onehundred twentypercent(120%)oftheLong-TermDebtServiceRequirementforParityIndebtednessonlyforsuch FiscalYearand(ii)onehundredpercent(100%)oftheLong-TermDebtServiceRequirementforParity IndebtednessandSubordinatedIndebtednessforsuchFiscalYear.
The definition of revenues for this purpose does not include grants, contributions, investment income credited to non-operating funds, or tap and connection fees. However, tap and connection fees may be considered revenues upon a resolution duly passed by the Board. Current expenses include operating expensesotherthanadditionstoreservefunds,depreciationoramortization,ordebtservicepayments.
Long-Term Debt Service Requirement means the aggregate of the required deposits to be made in respect of principal and interest.
The various Bond Series Resolutions require either monthly or semi-annual deposits of the upcoming principalandinterestpaymentstobereceivedbytheTrusteeatleastonedaypriortothepaymentdate. In other words, during the Fiscal Year ended June 30, 2024, the Long-Term Debt Service Requirement equaled principal and interest due on January 1, 2024 and July 1, 2024.
The District does not currently have any subordinated indebtedness, so the computation of the current fiscal year’s compliance with this covenant is based solely on 120% of the debt service requirement as follows:
Therefore, the District believes it is in compliance with the rate covenant as income available for debt service is in excess of 120% of the annual required debt service. The actual coverage ratio is 355%.
OPEB-benefitpaymentsandadministrativecostmadesubsequentto
The District may be a party to lawsuits arising from the ordinary conduct of business. In the opinion of management, settlement of actual or possible litigation, if any, will not have a material effect on the financial position of the District.
On September 27, 2024, tropical storm Helene hit the greater western North Carolina area. During the storm, the District was able to operate and treat with no down time. While the effects have been substantial in the greater metropolitan Asheville area, it is hard to determine the magnitude of the financial impacts currently. The District’s staff believes any losses incurred will be covered by insurance and state/federal assistance.
This page intentionally left blank.
Planfiduciarynetpositionasa
2024202320222021202020192018 TotalOPEBLiability
Changesofbenefitterms------Differencesbetweenexpectedand actualexperience153,000(231,000)181,000(75,000)124,000(441,000)Changesofassumptions35,000(414,000)134,000159,000433,000188,000-
* The amounts presented for each fiscal year were determined as of the prior Fiscal Year ending June 30.
Notes to Schedule:
Changes of assumptions: Changes of assumptions and other inputs reflect the effects of changes in the discount rate each period. The following are the discount rates used in each period:
In 2019, amounts reflect a 1 percentage point increase in healthcare cost trend rates decreasing .50 percent pointfrom the prior year and adjustments in mortality rates to better reflect actual plan experience.
In 2020, amounts reflect a 1 percentage point decrease in healthcare cost trend rates decreasing .25 percent pointfrom the prior year and adjustments in mortality rates to better reflect actual plan experience. Finally, the District also adjusted retirement rates based on actual experience from July 2015 through December 2019. This is to better reflect actual retirement plan experience.
In 2021, 2022, 2023,and 2024,amounts reflecta.25 percentage pointdecrease inhealthcare cost trend rates decreasing .25 percent point from the prior year and adjustments in mortality rates to better reflect actual plan experience.
No assets have been accumulated in a qualifying trust to pay benefits of the District’s OPEB plan.
This page intentionally left blank.
June 30, 2024 and 2023
For the Fiscal Years Ended June 30, 2024 and 2023
For the Year Ended June 30, 2024
Budget to Actual
For the Year Ended June 30, 2024 (continued)
Reconciliationfrombudgetarybasis (modifiedaccrual)tofullaccrual:
Revenuesandotherfinancingsourcesover (under)expendituresandotherfinancing
Reconcilingitems:
As of June 30, 2024
Combining Schedule of Net Position,All Funds (Non-GAAP) As of June 30, 2024 (continued)
$ -2,467,143 $
$ 301,57679,760,754 $ 409,131
57,14111,994,689 7,096,231 - - 7,096,231
8,896,339
465,304
12,738
106,738
448,461
6,025 7,096,2313,033,387
367,001108,787,279 - -
- 1,304,575 - - - 2,808,890 2,808,890 - - -12,276,09512,276,095 - - -741,821,703741,821,703 - - -10,348,44110,348,441 - - -(238,730,443)(238,730,443) - - -528,524,686528,524,686 - - -528,524,686529,829,261 7,096,2313,033,387 -528,891,687638,616,540 -1,140,595 - 978,421 6,251,417
As of June 30, 2024 (continued)
Liabilities
Currentliabilities:
Paymentsfromcurrentassets:
Combining Schedule of Net Position,All Funds (Non-GAAP) As of June 30, 2024 (continued)
3,891,961
70,000
1,224,361
5,826,824 5,826,824 1,224,3612,176,274
5,826,82411,013,146
1,027,732
3,693,000
7,440,310
-72,642,14972,642,149 -1,872,141 -72,729,75984,890,801 1,224,3614,048,415 -78,556,58395,903,947
571,480 $5,871,870$99,552
$ $451,313,525548,392,530 $
Combining Schedule of Revenues, Expenses, and Changes in Net Position,All Funds (Non-GAAP) For the Year Ended June 30, 2024
Combining Schedule of Revenues, Expenses, and Changes in Net Position,All Funds (Non-GAAP) For the Year Ended June 30, 2024 (continued)
$45,847,633
9,541,237
649,346
56,038,216
12,984,129
32,881,444
(130,341)9,623,434(13,029,551)23,156,772
4,621,789 (2,601,012)
(1,013,695) (854,386) (2,589,171)
(995,724) 1,166,391 (2,589,171) (109,768)9,676,184(14,025,275)24,323,163 - - 4,566,137 - 4,566,137 8,473,78418,387,679(9,676,184) 600,881-(18,490,137)(4,566,137)23,453,834(5,631,825) - - 5,631,825252,788 (212,226) - 15,661,265 28,889,300 5,619,082 311,778 -435,652,260519,503,230 $5,871,870$99,552 - $ $451,313,525548,392,530 $
This page intentionally left blank.
This part of the District’s Annual Comprehensive Financial Report presents detailed information as a context for understanding what the information in the financial statements, note disclosures, and required supplementary information says about the District’s overall financial health.
These schedules contain trend information to help the reader understand how the District’s financial performance and well-being have changed over time.
Net Position by Component
Changes in Net Position
General Revenue by Source
Expenses by Function
Theseschedulescontain informationto helpthereader assesstheDistrict’smostsignificantrevenue sources.
Sewer Charge Revenue by Customer Type
Residential Sewer Rates
Principal Commercial Users
Customer Accounts by Member Agency
These schedules present information to help the reader assess the affordability of the District’s current levels of outstanding debt and the District’s ability to issue additional debt in the future.
Ratio of Outstanding Debt
Revenue Bond Coverage
Introduction (continued)
These schedules offer demographic and economic indicators to help the reader understand the environment within which the District’s financial activities take place.
Demographic & Economic Statistics
Personal Income by Industry
Principal Employers
These schedules contain service and infrastructure data to help the reader understand how the information in the District’s financial report relates to the services the District provides and the activities it performs.
Employees by Division
Operating Indicators by Division
Source: Unlessotherwisenoted,theinformationintheseschedulesisderivedfromtheAnnualComprehensive FinancialReportfortherelevantyear.
FiscalYear Ended June30
2015290,329,7006,930,28647,164,270344,424,256
2016310,277,9656,087,64944,227,370360,592,984
2017324,826,1915,169,66748,827,214378,823,072 2018318,591,1326,045,51669,374,003394,010,651 2019337,729,29011,860,48164,530,210414,119,981 2020360,881,0716,747,58264,850,064432,478,717 2021399,621,9017,016,96467,107,474473,746,339 2022412,955,3637,288,27273,822,362494,065,997 2023435,348,0216,857,21477,297,995519,503,230 2024450,946,5247,176,44590,269,561548,392,530
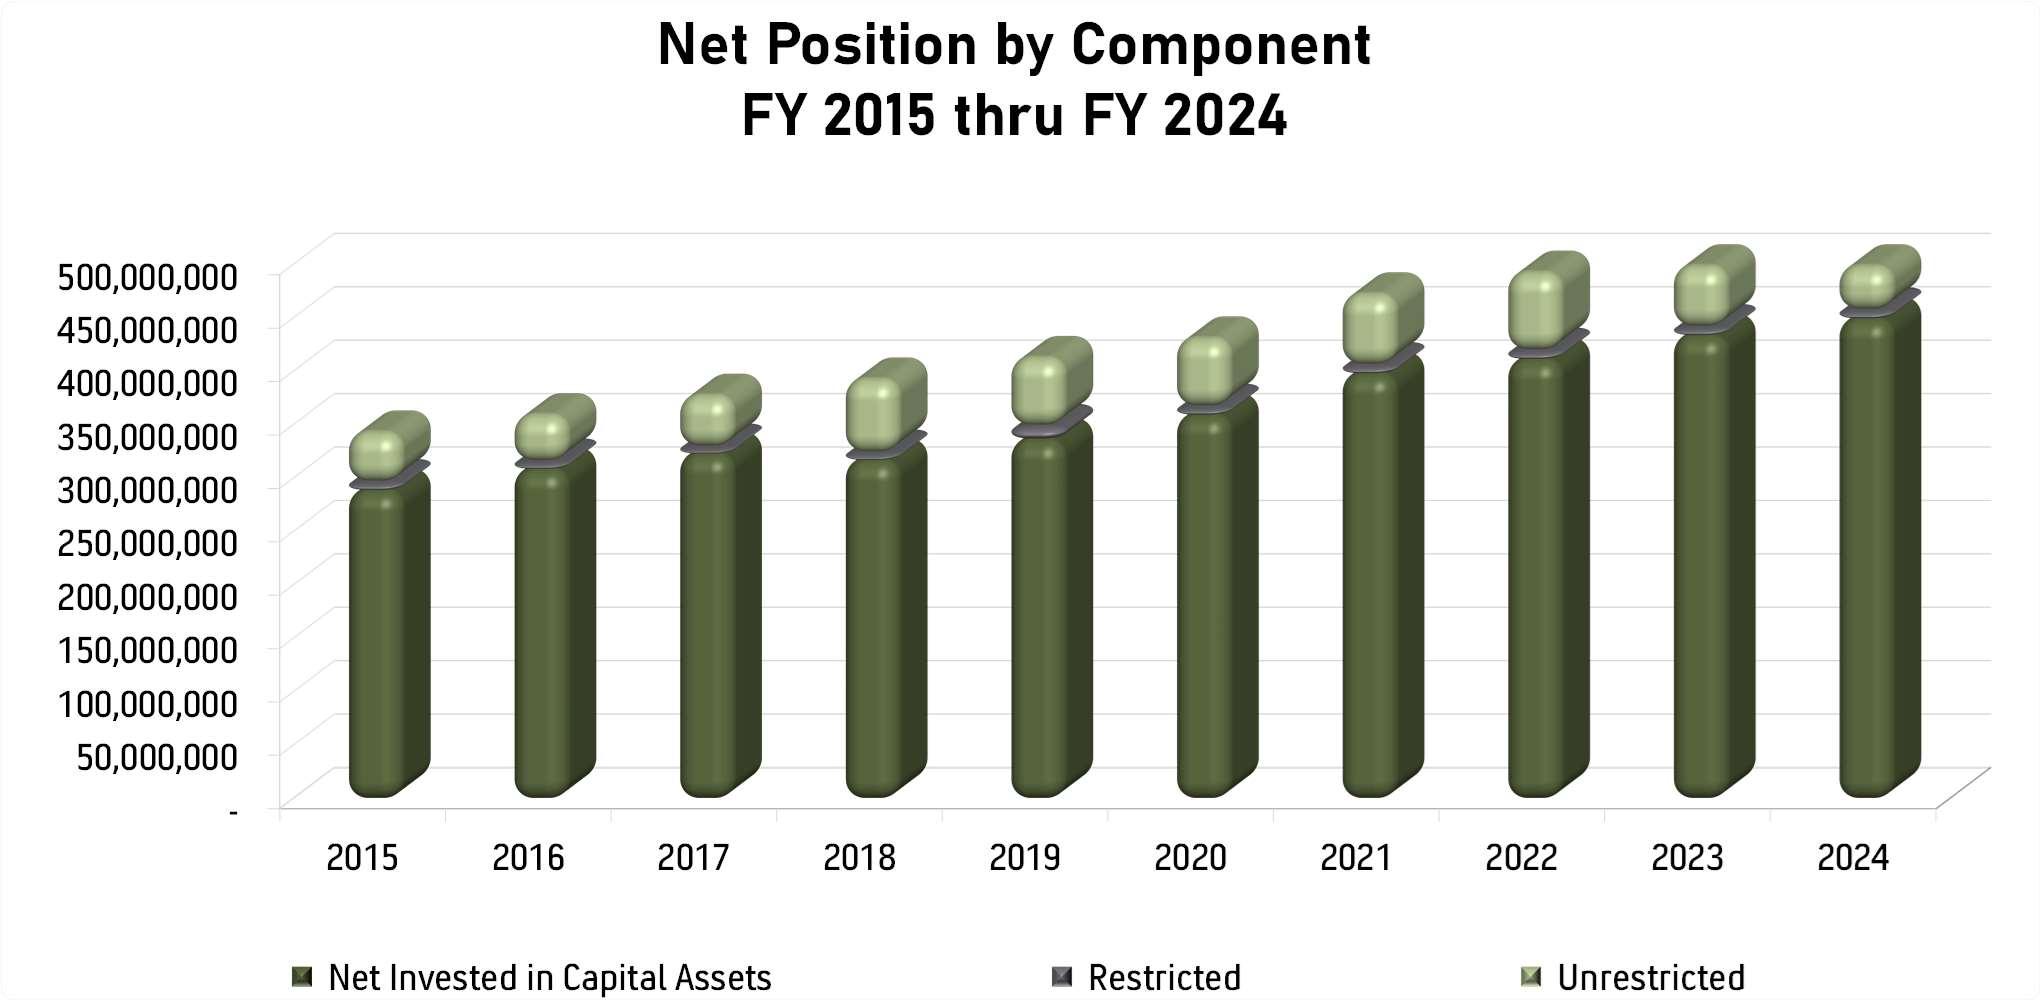
(Accrual Basis of Accounting)
Operatingrevenues:
Sewercharges32,617,886
Facilityandtapfees4,311,2596,324,5966,977,0975,357,0086,343,8425,737,6115,092,0605,966,0125,343,2619,541,237 Miscellaneous757,619764,928681,243745,022716,441731,9651,770,022660,7541,045,841649,346 Totaloperatingrevenues37,686,76440,769,08443,179,56042,993,03044,453,89243,841,13845,453,98348,111,50649,811,22656,038,216
Operatingexpenses:
Salaries&employeebenefits6,758,2517,183,0437,656,8587,846,0388,043,7288,762,0738,640,9368,427,0339,664,07110,534,254 Contractualservices1,398,2881,472,7951,653,9181,598,3811,657,7891,619,0781,810,4811,798,7941,958,0081,980,153 Utilities1,144,7111,058,2991,234,0291,295,6361,170,9371,205,8991,105,1101,446,4931,625,7931,516,015 Repairsandmaintenance938,977998,7581,019,150985,838919,882975,618998,1831,026,0181,094,8391,112,775 Othersuppliesandexpenses1,545,5311,500,2491,736,3021,886,8371,728,3851,559,4801,623,2221,325,8371,881,5082,059,229
Insuranceclaimsandexpenses2,682,4262,990,9732,467,5672,765,1512,528,1222,106,9892,351,4852,332,9262,231,0162,694,889 Depreciation8,543,4029,332,9579,929,55910,393,12610,659,34611,337,08712,394,87512,339,04412,395,59112,984,129 Totaloperatingexpenses23,011,58624,537,07425,697,38326,771,00726,708,18927,566,22428,924,29228,696,14530,850,82632,881,444
Operatingincome14,675,17816,232,01017,482,17716,222,02317,745,70316,274,91416,529,69119,415,36118,960,40023,156,772
Nonoperatingrevenues(expenses):
InvestmentIncome209,220237,604343,988960,2221,844,2801,215,56530,58287,0012,737,2734,621,789
InterestExpense(2,771,525)(2,586,670)(2,794,077)(3,515,801)(3,399,735)(3,292,282)(3,110,487)(2,949,509)(2,765,372)(2,601,012) Amortizationofbondissuancecosts---------Bondissuancecosts---(355,583)-----Gain(loss)onsaleofsurplusproperty17,258(106,997)(280,337)10,187(434,989)(121,183)322,770418,696105,027(854,386) Totalnonoperatingrevenues(expenses)(2,545,047)(2,456,063)(2,730,426)(2,900,975)(1,990,444)(2,197,900)(2,757,135)(2,443,812)76,9281,166,391
Incomebeforecontributions&specialitems12,130,13113,775,94714,751,75113,321,04815,755,25914,077,01413,772,55616,971,54919,037,32824,323,163
Capitalcontribution3,078,5202,392,7813,478,3373,222,0314,354,0714,281,7227,558,6473,348,1096,399,9054,566,137
SpecialItem-CaneCreekWaterandSewer DistrictassetcontributionfromHenderson County ------19,936,419---
ChangeinNetPosition15,208,651
FiscalYear Ended June30
20153,725,58428,892,3024,311,259984,09737,913,242 20163,344,07430,335,4866,324,596895,53540,899,691 20173,909,92531,611,2956,977,097744,89443,243,211 20184,159,76732,731,2335,357,0081,715,43143,963,439 20193,687,70333,705,9066,343,8422,125,73245,863,183 20203,426,10333,945,4595,737,6111,826,34744,935,520 20213,497,07035,094,8315,092,0602,123,37445,807,335 20223,816,10337,668,6375,966,0121,166,45148,617,203 20233,805,06439,617,0605,343,2613,888,14152,653,526 20243,987,53741,860,0969,541,2374,416,74959,805,619
Note:DoesnotincludeCapitalContributions.
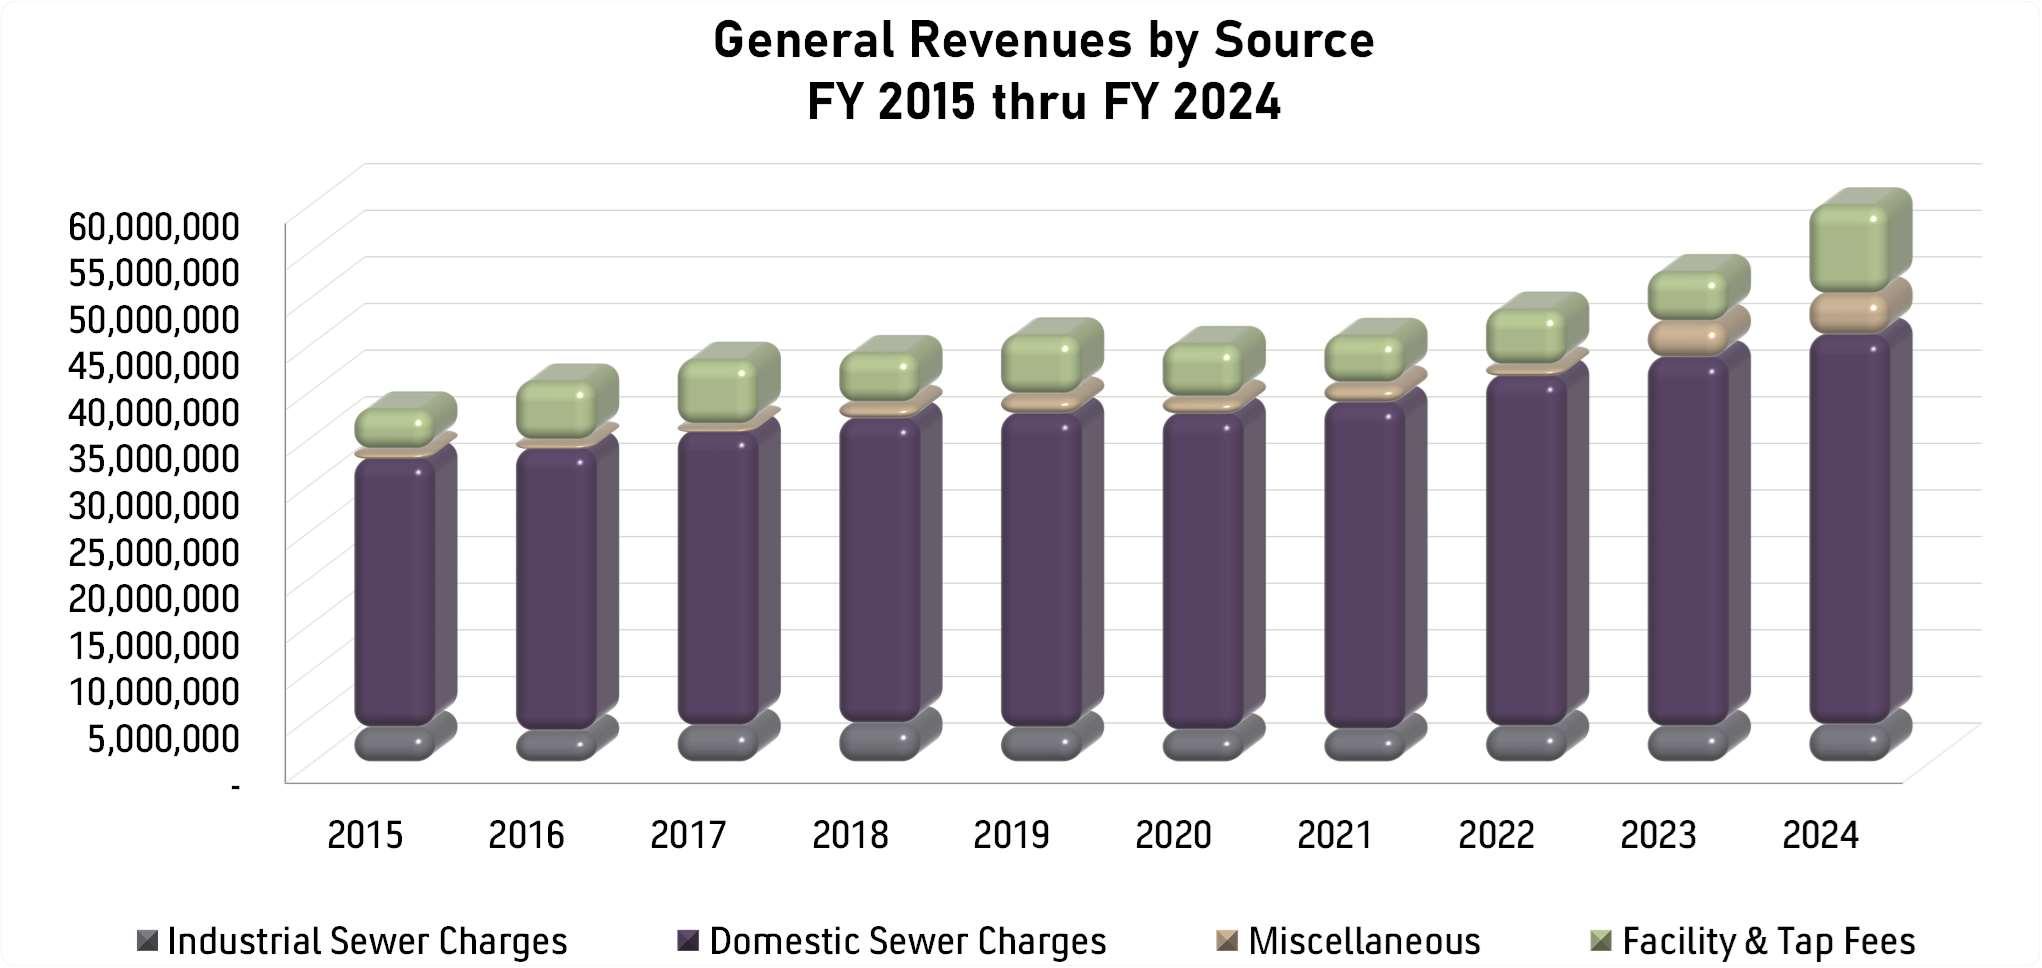
Fiscal Year Ended June30
201514,468,18416,455,6533,078,5208,154,35042,156,707 201615,204,11719,201,5012,392,7818,722,49545,520,894 201715,767,82414,631,1553,478,3378,069,90241,947,218 201816,536,83022,528,7403,222,0317,841,62650,129,227 201916,315,76020,860,3634,354,0718,505,56050,035,754 202016,158,23923,629,7144,281,7228,558,10752,627,782 202116,441,11618,377,09327,495,5668,966,31271,280,087 202216,698,18514,984,6863,348,1099,070,33444,101,314 202318,451,22621,084,8276,399,9059,126,19755,062,155 202419,605,15218,490,1374,566,1378,232,83750,894,263
1 SeeNote10
2 Excludesdepreciationexpense
3ThisincludescollectionsysteminfrastructurecontributedbydevelopersandCaneCreekWaterandSewer DistrictassetcontributionfromHendersonCounty
4IncludesBondPrincipalExpenseandBondInterestLessCapitalizedInterestPortionandexcludesearly retirementoflong-termdebt
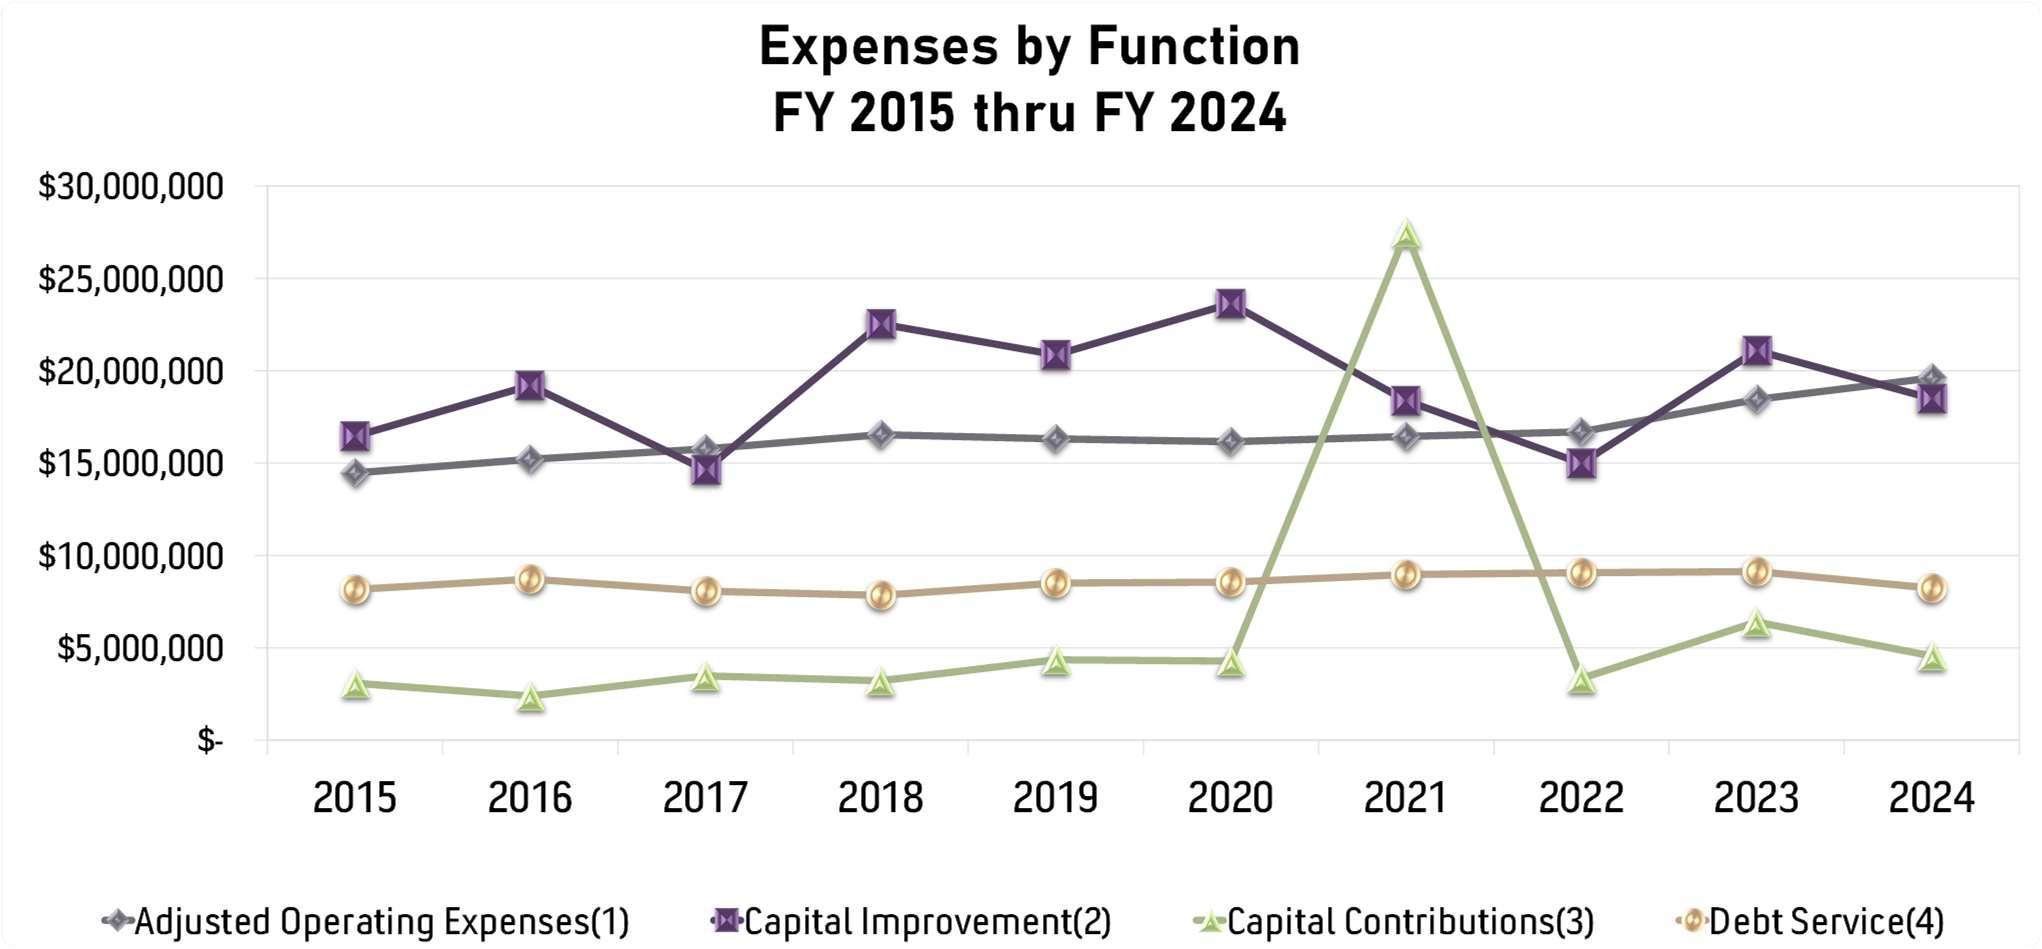
DomesticUsers
Asheville22,423,891
$ BiltmoreForest366,741366,135348,323322,377326,587346,937317,195356,509391,433404,838 BlackMountain1,052,8691,069,9011,096,6041,169,8781,195,8931,244,8351,256,3341,364,2241,426,0551,578,635 HendersonCounty1,203,4771,250,1461,447,6131,493,9121,535,6751,431,0151,403,9081,743,2091,831,2911,916,707 Montreat256,944260,871268,045244,133290,989278,707247,890247,366266,184259,081 Weaverville749,113814,691887,368932,0601,007,8331,030,5051,007,7541,143,2221,246,2281,339,912
WoodfinSanitaryWater &SewerDistrict1,049,0611,084,7171,120,0141,171,1111,198,4671,201,3321,251,9371,204,6371,303,7391,329,896
Other1,790,2061,994,3331,925,2831,910,7341,985,9171,928,0682,749,0643,232,4633,240,3123,374,619
IndustrialUsers3,725,5843,344,0743,909,9254,159,7673,687,7033,426,1033,497,0703,816,1033,805,0643,987,537
Total32,617,886$33,679,560$35,521,220$36,891,000$37,393,609$37,371,562$38,591,901$41,484,740$43,422,124$45,847,633 $
Note: Municipalitiesincludesewerchargesonwaterbills."Other"representssewerchargesbilleddirectly bytheDistricttodomesticusers.
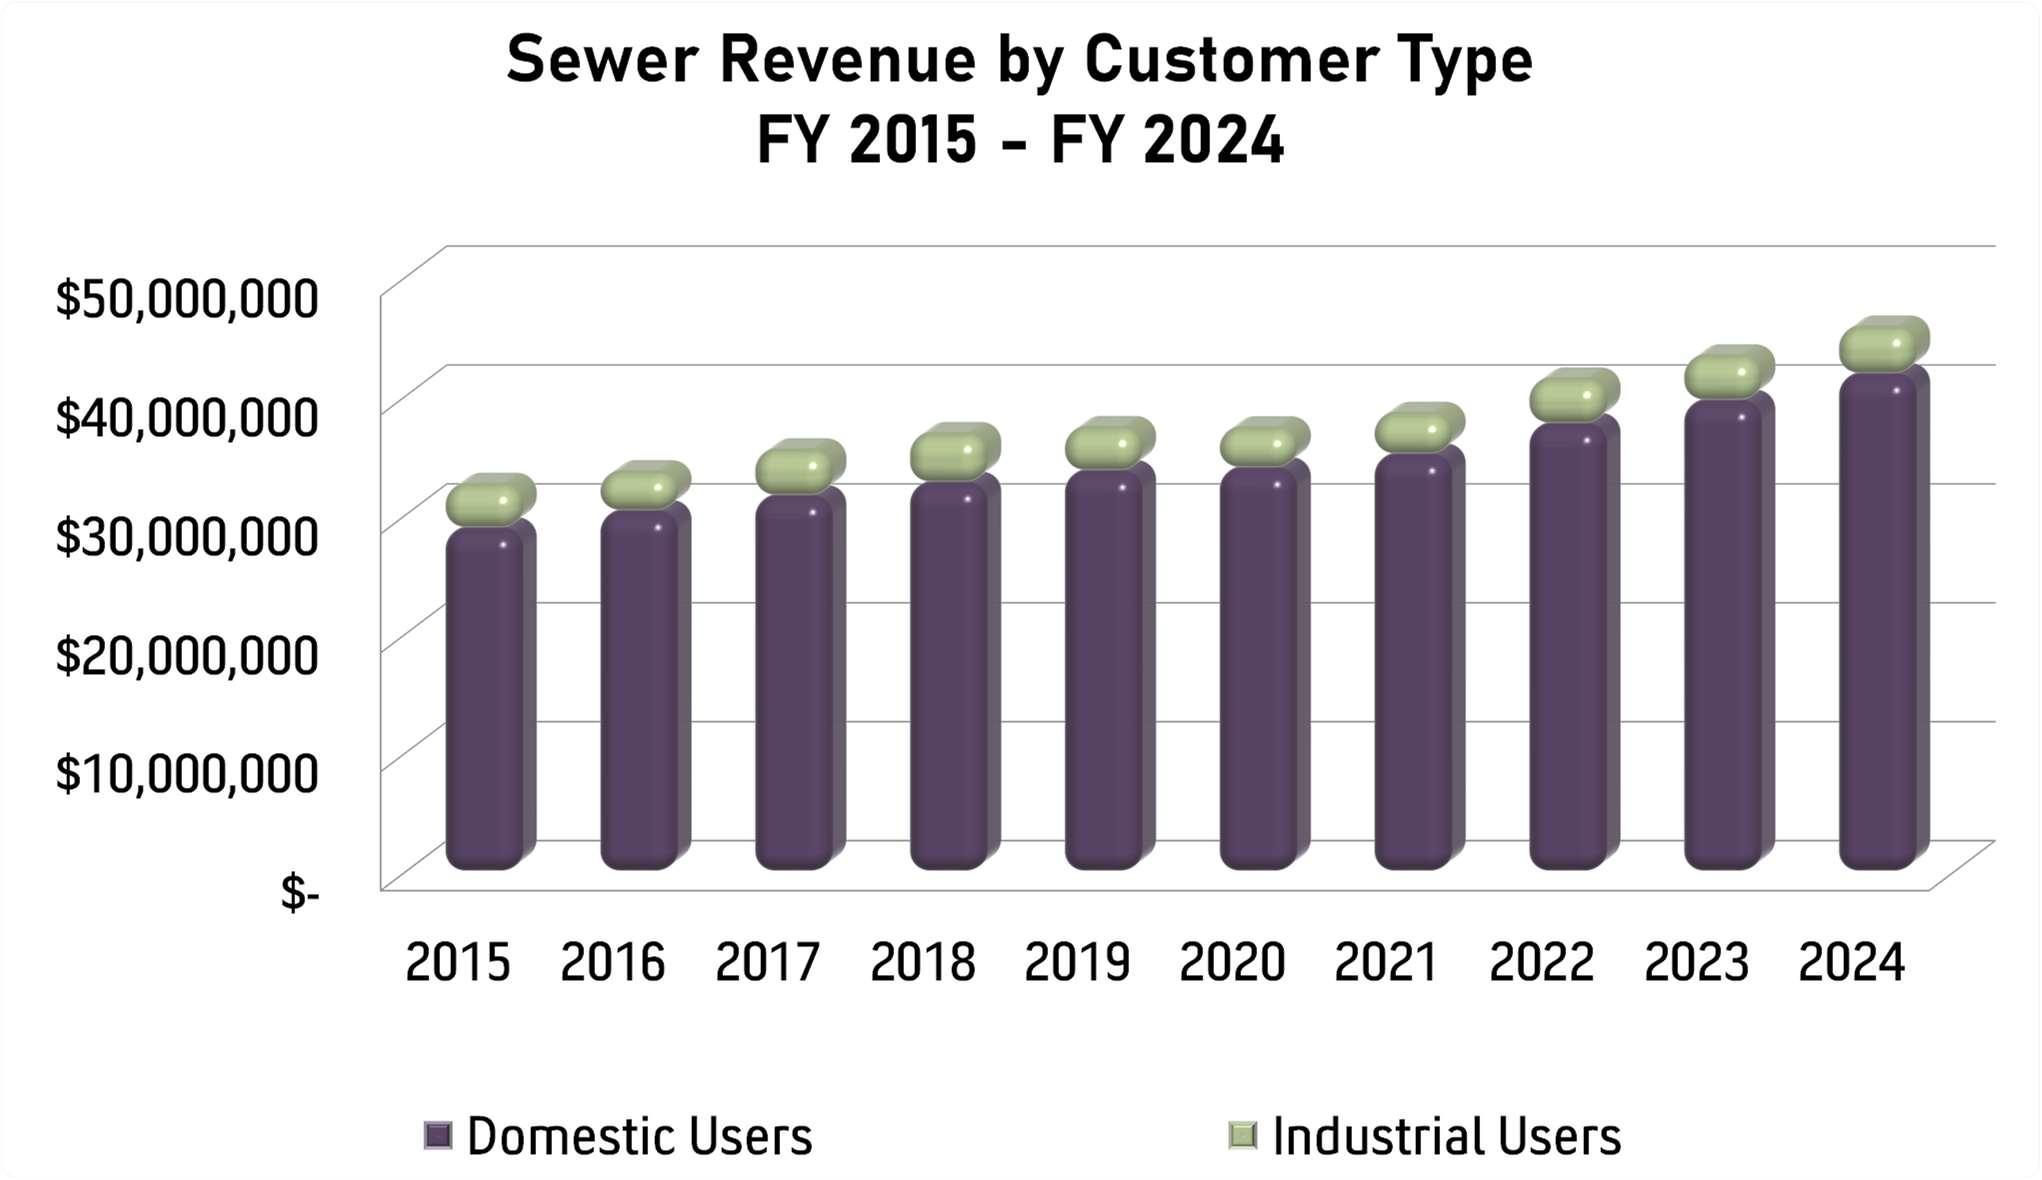
Asheville41,02041,63442,24242,29842,84242,86643,58744,37644,99045,615
BiltmoreForest653662649649653658658662667671
BlackMountain2,6422,7292,7882,8542,9082,9813,5053,5873,4853,475
HendersonCounty3,5123,7743,8983,9643,9114,2013,3453,3743,3943,503
Montreat666666669669674677678680679683
Weaverville1,7401,7791,8301,9011,9012,1262,2242,3092,3532,389
WoodfinSanitaryWater&SewerDistrict2,4692,5272,5572,5672,6162,6862,9693,1513,1562,879
Total52,70253,77154,63354,90255,50556,19556,96658,13958,72459,215
Source: MemberAgencies
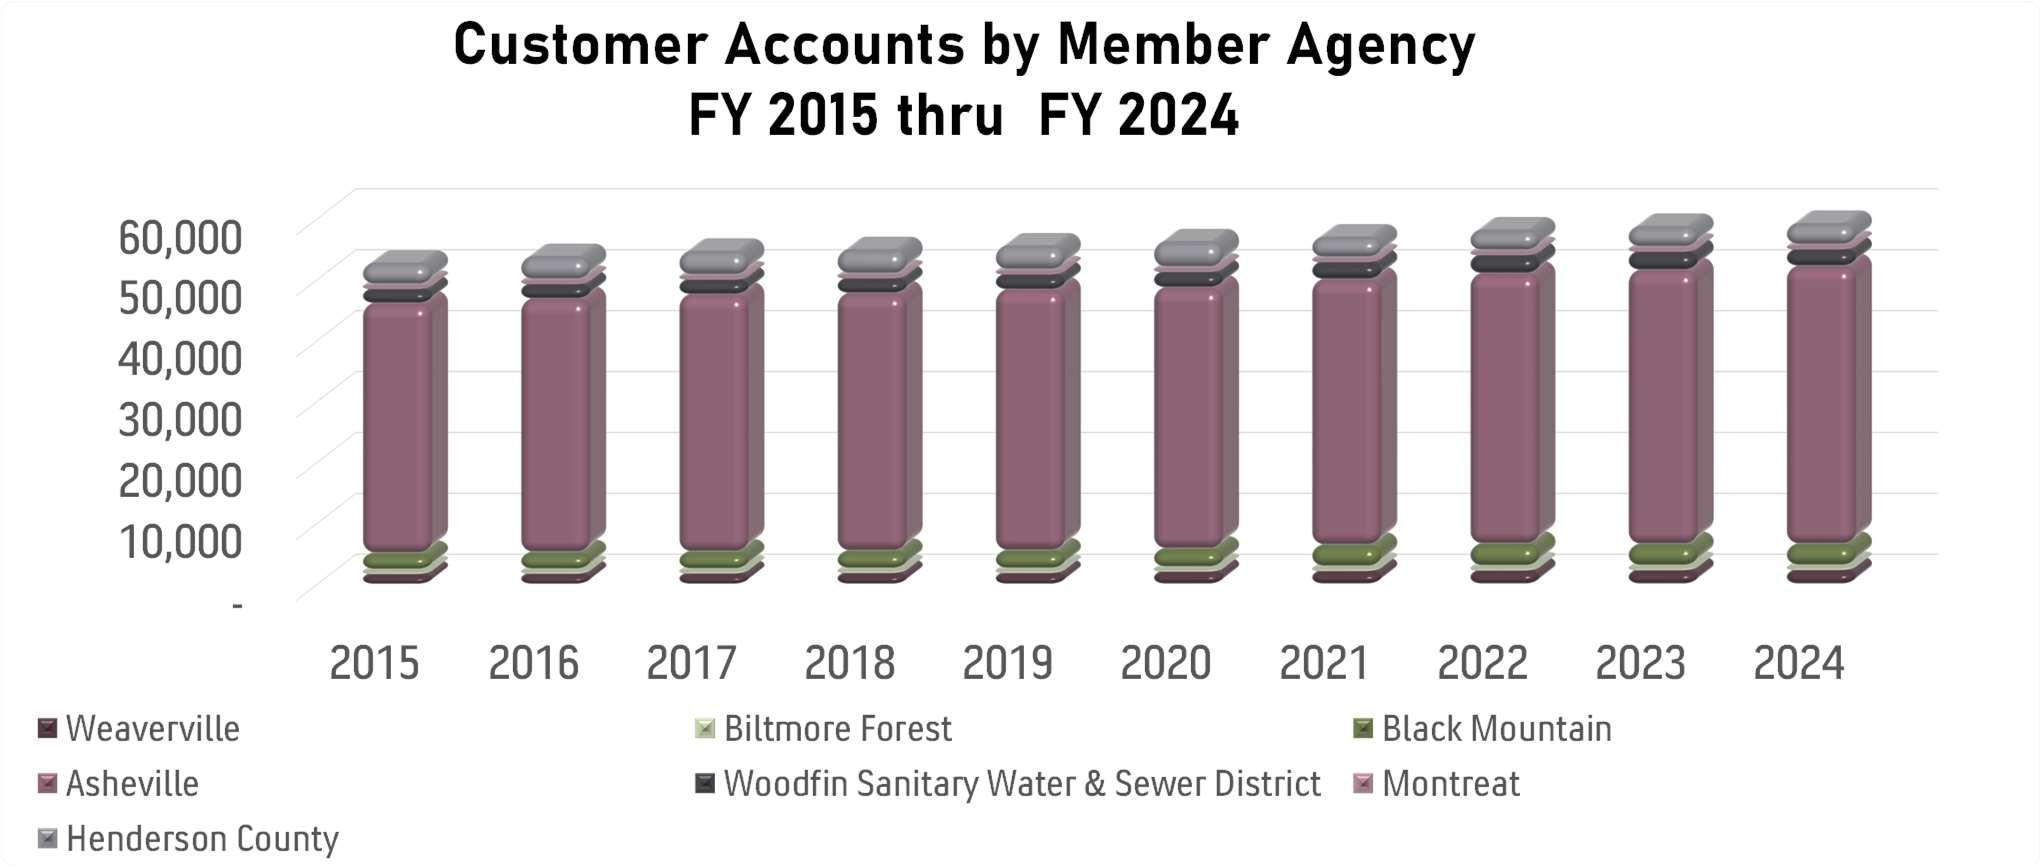
SierraNevadaMicro-BreweryManufacturer179,13140.59%372,46720.86%
GlatfelterIndustriesTextileManufacturer127,91570.42%339,37630.78% -formerlyJacobHolmIndustries
NewBelgiumBrewingMicro-BreweryManufacturer299,11740.69%
ArcadiaBeverageBeverageSupplierforlocal/globalretailers246,85250.57% MissionHealthSystemHealth&EmergencyServices306,75421.01%228,08760.53%
MeritorHeavyVehicleSystemsAutomotivePartsManufacturer219,42070.51%
UniversityofNorthCarolina-AshevilleUniversity219,19480.50%
RidgecrestBaptistConferenceCenterChristianConferenceCenter200,68030.66%213,84590.49%
TheBiltmoreCompanyTouristAttraction/Winery/ResortServices177,491100.41% GivensEstates,Inc.ContinuingCareRetirementCommunity150,91250.50% BonarChemicalManufacturer133,46960.44% -(formerlyColbond)
VAMedicalCenterVeteransHospital126,17480.42% -AshevilleDepartmentofVeteransAffairs
BlueRidgeMetalsAutomotivePartsManufacturer93,02790.31%
RalphWilsonPlastics(Wilsonart)EngineeredSurfaceManufacturer91,714100.30%
Source: District Billing Records
1 CalculationsderivedfromthebalanceofoutstandingdebtinNote3lesstheunamortizedbondrefunding chargesinNote11
2 ThisratiowascalculatedbyusingthenumberofdomesticaccountsandmultiplyingbyBuncombeCounty censusaverageof2.3personsperhouseholdtogetthenumberofusersintheDistrict.
3 RegionalEconomicInformationSystem,BureauofEconomicAnalysis,U.S.DepartmentofCommerce
From 1985to 2002, the District was subject to Section 501of the 1985 Bond Order whichcovenants that the District will set rates to produce sufficient revenues, together with any other available funds, includingthe amounts transferred bytheDistrict from theGeneral Fund to the RevenueFund, to permit the deposit and transfer to the credit of the Revenue Fund in the then current fiscal year of a sum at least equal to the total of the following:
1. the current expenses of the Sewerage System for the current fiscal year, and
2. to provide for the higher of either:
a. the amounts needed for making the required cash deposits in each fiscal year to the credit of the several accounts in the Bond Service Fund and to the credit of the Subordinated Indebtedness Service Fund, the Debt Service Reserve Fund, and the Maintenance Reserve Fund, or
b. one hundred twenty per centum (120%) of the amount of the principal and interest requirements for the current fiscal year on account of the indebtedness then outstanding excludingprincipalandinterestrequirementsonaccount ofindebtednessincurredtofinance improvements or additional improvements which have not been completed as of the beginning of such fiscal year.
However, with the issuance of refunding bonds on April 3, 2003, a sufficient amount of debt subject to the 1985 bond order was defeased allowing application of the 1999 Amended Bond Order whose rate covenant is summarized in the following paragraph.
TheDistrictcovenantstosetratesandchargessothattheIncomeAvailableforDebtService (definedastheexcessof“Revenues”over“CurrentExpenses”)willnotbelessthanthegreater of(i)onehundredtwentypercent(120%)oftheLong-TermDebtServiceRequirementforParity IndebtednessonlyforsuchFiscalYearand(ii)onehundredpercent(100%)oftheLong-TermDebt ServiceRequirementforParityIndebtednessandSubordinatedIndebtednessforsuchFiscal Year. Thedefinitionofrevenuesforthispurposedoesnotincludegrants,contributions, investment incomecreditedtonon-operatingfunds,ortapandconnectionfees.Current expendituresincludeoperatingexpensesotherthanadditionstoreservefunds,depreciationor amortization,ordebtservicepayments.
The District does not currently have any subordinated indebtedness, so the computation of the current fiscal year’s compliance with this covenant is based solely on 120% of the debt service requirement.
Long-Term Debt Service Requirement is defined as interest and principal required to be remitted to the Trustee, except that interest shall be excluded from the determination of Long-Term Debt Service Requirement to the extent the same is provided from the proceeds of the Long-Term Indebtedness. The coverage ratio is computed on the basis of 100% of required debt service.
FiscalYear
EndedJune 30
201533,428,66915,179,80218,248,86710,184,46012,221,3528,064,4071.79 201634,529,56815,688,25818,841,3109,003,51910,804,2239,837,7912.09 201736,402,13516,280,64420,121,4917,918,5579,502,26812,202,9342.54 201838,102,68216,536,83021,565,8529,423,68911,308,42712,142,1632.29 201939,379,53316,315,76023,063,7739,412,54011,295,04813,651,2332.45 202039,022,65416,158,23922,864,4159,826,54711,791,85613,037,8682.33 202140,325,77216,441,11623,884,6569,811,69611,774,03514,072,9602.43 202242,157,73716,698,18525,459,5529,797,85011,757,42015,661,7022.60 202347,070,10518,451,22628,618,8798,829,77210,595,72619,789,1073.24 202450,866,98919,605,15231,261,8378,801,71810,538,06222,460,1193.55
(A)Includesalloperationandmaintenanceexpenses,exceptdepreciation.
(B)Doesnotincludetapandconnectionfees,grants,contributions,investmentincomeallocatedtononoperatingfunds.
FiscalYear EndedJune 30
CivilianLaborForce3
PopulationPerCapitaMedianUnemployment Estimates1Income2Age1EmployedUnemployedRate
2015252,16042,99641.1125,3556,1314.7% 2016255,22244,40341.7129,3245,4124.0% 2017257,40846,32341.9130,4184,8013.6% 2018259,72648,81942.1133,7104,5013.3% 2019262,04950,80442.2135,7494,5543.2% 2020263,47753,30942.3116,65816,81712.6% 2021271,53457,89542.2129,6556,6484.9% 2022273,58961,56042.3136,8194,6823.3% 2023UnavailableUnavailableUnavailable141,0464,0252.8% 2024UnavailableUnavailableUnavailable139,1914,6303.2%
Note: TheinformationaboveisforBuncombeCounty,NorthCarolina.TheDistrictbelievesthattheabove informationisrepresentativeoftheservicearea,whichextendsoverapproximately80%ofthecounty.
Statisticaldataforpopulationestimate/percapitapersonalincome/medianageforcalendaryears2023&2024 werenotavailableatthetimeofthisreport.
Sources:
1 UnitedStatesCensusBureau
2 RegionalEconomicInformationSystem,BureauofEconomicAnalysis,U.S.DepartmentofCommerce; Lastupdated:November16,2023--newstatisticsfor2022
3 U.S.DepartmentofLabor-BureauofLaborStatistics;LocalAreaUnemploymentStatistics
TotalPersonalIncome7,621,2918,065,9828,400,9728,939,8759,453,9239,337,10010,405,98311,494,311UnavailableUnavailable Farmearnings30,28325,50428,66117,22424,58634,29920,07819,877-Nonfarmearnings7,591,0088,040,4788,372,3118,922,6519,429,3379,302,80110,385,90511,474,434-Privateearnings6,523,4106,952,0637,233,9287,712,6948,166,4117,961,6789,040,46610,054,487-Agriculturalservices,forestry,fishing5,9296,6277,0367,3805,9288,2888,44210,728-Mining6,5854,9146,1415,4416,0325,9828,96411,045-Construction448,839477,954529,089623,861692,455636,325682,024783,017-Manufacturing:821,492836,339862,114912,148983,570966,2051,052,4611,072,361-Durablegoods541,045530,183553,542596,298645,581638,867684,049724,639-Nondurablegoods280,447306,156308,572315,850337,989327,338368,412347,722-Wholesaletrade248,576255,030265,004269,683278,843273,254298,338368,953-RetailTrade593,659631,294652,947678,692692,068708,733797,993846,195-Transportationandpublicutilities302,007267,878295,011303,259322,035324,524351,936407,935-Services4,096,3234,472,0274,616,5864,912,2305,183,7495,038,3675,840,3086,554,253-Governmentandgovernmententerprises:1,067,5981,088,4151,138,3831,209,9571,262,9261,341,1231,345,4391,419,947-Federal,civilian316,318323,143336,206361,488394,451454,291467,748504,365-Military23,63724,23524,65227,93229,18430,60829,75326,890-Stateandlocal727,643741,037777,525820,537839,291856,224847,938888,692--
Note: TheabovedataisforBuncombeCounty,NorthCarolina.MSDbelievesthedataisrepresentativeofthe entireservicearea.Growthinpersonalincomeovertimemaybecomparedtoaveragemonthlybilling toevaluatetheaffordabilityofsewerratesforcustomers.
Source: RegionalEconomicAccounts,BureauofEconomicAnalysis,USDepartmentofCommerce; Lastupdated:November16,2023–newstatisticsfor2022;revisedstatisticsfor2001-2021.
Note:TheinformationaboveisforBuncombeCounty,NorthCarolina.TheDistrictbelievesthattheabove informationisrepresentativeoftheentireservicearea,whichextendsoverapproximately80%ofthe County.
EngineeringServicesDepartment
SewerTapApplications1,3821,1771,6311,4431,1691,0041,2041,1231,0391,184 PlansReviewed62667678686960636067
LinearFeetofrehabilitatedSewerSystems46,72942,67549,78249,91844,79030,04134,50622,62731,01532,897
LinearFeetofAcceptedSewerSystems29,18543,61632,94539,88848,45523,69934,00027,30846,20628,731
HumanResourcesDepartment
SystemServicesDepartment
AverageResponseTimetosewerproblem(hours)0.550.520.520.510.510.510.520.570.570.68
LinesWashed(linealfeet)-in-houseonly729,451730,000885,6871,124,220900,249905,778917,978874,899898,1771,318,230
ConstructionRepairstoSewerLines543500555508493380466433409425
TapsInstalled239234358351324294285317273261
ManholeRepairs376294330323286217183178173168
SanitarySewerOverflows37533025401911262510
PumpStations32313030303141404038
WaterReclamationFacility
SanitarySewers(approximatemiles)1,0001,0001,0201,0271,0431,0411,1301,1401,1401,157
TreatmentProvided(millionsofgallons)6,971.507,884.007,117.507,592.009,453.508,541.007,993.507,884.007,621.207,343.80
Daily(average)flowtreated(millionsofgallonsdaily)19.121.619.520.825.923.421.921.620.920.1
Maximumdailyflowtreated(millionsofgallonsdaily)39.067.153.064.867.567.267.353.760.071.7
Percentageofplantcapacityused47.8%54.0%48.8%52.0%64.8%58.5%54.8%54.0%52.2%50.3%
Source: