M:

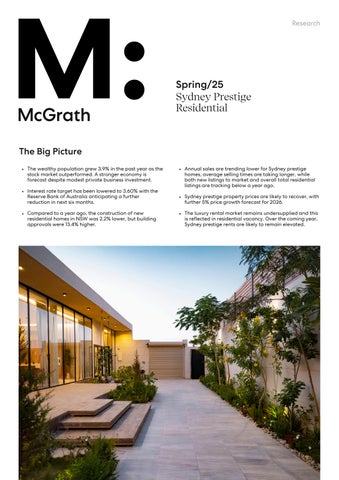
The Big Picture
Spring/25
Sydney Prestige Residential


Sydney prestige residential sale transactions above $5 million tallied to 385 in Q2 2025, moving upwards by 52% from the previous quarter This was influenced by a lower number of new listings and the market anticipating a further reduction in interest rates. Over the past year to Q2 2025, the total number of prestige sales was 6% lower, reaching 1,622 sales. As a benchmark, over the past five years, the annual average was 1,375 sales
The share of super-prestige sales (above $10 million) was recorded at 24%, after analysing the total number of prestige sales (above $5 million) across Sydney in the year ending Q2 2025. This was higher than one year ago when the proportion was 20%, and remains above the 19% share recorded five years ago Over the past year to Q2 2025, Sydney’s super-prestige sales volume has increased by 12%, and grown by 338% over the past five years
Prestige Sales -6% 24%
Total Number of Prestige Sales ($5m+)
Sydney Prestige
Share of Super-Prestige Sales ($10m+), by Number
Sydney Prestige
Prestige, Q2/25

Prestige homes across Sydney took an average 81 days on market - from the time they were listed to the day they went under contract - in the year ending Q2 2025 This duration was 76 days a quarter ago (+5 days) and 68 days a year ago (+13 days) A lower number of days on market tends to mean homes are selling fast with more desirable properties, while a higher number of days suggests a slower market with above market values. Looking back, the five-year average has taken 74 days to sell a home
Average Days on the Market
New Listings
Newly advertised property listings in Sydney were 14 1% lower in the month of June 2025 than the equivalent period last year, according to Cotality This trended below the Australian average of -11.7% and below the -12.9% across Australian capital cities
Sydney’s total number of listings in the month of June 2025 were 0.4% below the equivalent period last year, according to Cotality By comparison, the Australian average for total listings was -5.8% and across Australian capital cities was -4 4% -14.1% -0.4%
Change in Prestige Prices
Sydney Prestige Prestige Prices
Sydney prestige property prices fell by 1 6% in the year ending Q2 2025, with a gain of 0 1% recorded in the last quarter Looking back at price growth since Q2 2020, prestige houses (23 7%) outpaced prestige apartments (17.1%) over the five years. In Q2 2025, prestige house prices were 0 3% higher but were 1 1% lower on the previous year In the same quarter, prestige apartment prices fell by 0.2% after declining 2 1% in the past year Annual residential price growth has averaged 3 9% over the past five years

Price Outlook
Looking ahead, McGrath Research anticipates Sydney prestige residential prices to increase by 1% by the end of 2025, followed by a stronger 5% rise in 2026. Factors taken into consideration include the forecast of a stronger economy, a solid performing stock market and the reduction of interest rates encouraging growing buyer confidence
Forecast for Prestige Prices
Sydney Prestige

Residential gross rental yields remained stable in the Q2 2025 quarter to be 2 59% across the Sydney prestige market, while being 5 bps more than a year ago Gross rental yields are a good initial measure of comparing the return of a property investment before expenses are deducted Gross rental yields have averaged 2.31% over the past five years.
Change in Gross Rental Yield Sydney Prestige

Sydney residential rental vacancy was recorded at 1 1% in Q2 2025, rising 20 bps in the quarter but fell 10 bps over the past year according to APM Generally, around 3% vacancy is considered a balanced market between rental supply and demand. Below this equilibrium is considered to be an undersupplied pool of rental homes Over the past five years, rental vacancy has averaged 1.5% per year.
Change in Residential Rental Vacancy
Change from a year ago
Sydney Prestige Prestige Rents +2.0%
Change in Prestige Rents
Sydney prestige property rents rose by 2.0% in the year ending Q2 2025, with a rise of 0 8% recorded in the last quarter Looking back at rental growth over the five years since Q2 2020, prestige apartments (52 0%) outpaced prestige houses (34 8%) Prestige apartment rents in Q2 2025 were 3.2% above a quarter ago, and were 11.6% higher over the year In the same quarter, prestige house rents fell by 1.2% after falling 5.3% in the past year. On average, over the past five years, prestige rents grew 7 6% per year
In recent years, a modest number of new prestige homes have been built in Sydney and only a small share of these homes have been made available in the rental pool As a result, McGrath Research forecast there will remain upward pressure on rents of 3% at the end of 2025, with a further 3% rental growth likely in 2026
Forecast for Prestige Rents
Prestige Property
The most desirable and most expensive property in a given location, generally defined as the top 5% of each market, by value.
Prestige Sales
Sydney prestige sale transactions hold a threshold of A$5 million
Super-Prestige Sales
Sydney super-prestige sale transactions hold a threshold of A$10 million.
Wealthy Population
A high-net-worth individual (HNWI) with a net worth of at least US$10 million.
Michelle Ciesielski Head of Research, McGrath Research
michelleciesielski@mcgrath com au
+61 414 694 220
www mcgrath com au