


Big ideas
• The properties of real numbers can be applied to many types of expressions.
• Expressions are the building blocks of algebra. They can be used to represent and interpret realworld situations.
• Integers
a subset of the set of real

After this lesson, you will be able to...
• Comparing rational numbers in different forms can easily be done by converting them first to the same form.
We have previously compared and ordered fractions, decimals, and percents. We have also compared and ordered integers. All of those are types of rational numbers, and they can all be represented on the same number line.
As we move to the right on the number line the numbers get larger.
As we move to the left on the number line the numbers get smaller.
For example, 3.12, is to the left of , so 3.12 is smaller than
We can write this statement as the following inequalities: because 3.12 is further to the left on the number line because is further to the right on the number line
Sometimes, it’s easiest to compare rational numbers if they are written in the same form. For example, by converting decimal values to fractions or fractions to decimals.
For 3.12 and we can write as the decimal 1.5 to more easily see that 1.5 is closer to 0 on the negative side of the number line, so it must be larger than 3.12.
This also shows how we can use benchmarks, or commonly known values, to approximate the size of a number. The most commonly used benchmarks are 0, , and 1. Some other common benchmarks are:
We can also use multiples of those benchmarks to create other benchmarks to get closer to the numbers we’re using. For example: 6 = = 0.6 = 60%.
Knowing the relative size of numbers also allows us to order them in ascending order (least to greatest) or descending order (greatest to least).
A number line automatically puts numbers in ascending order.
Which is the largest rational number marked on the number line?
Create a strategy
Recall that the further a number is to the right on a number line, the larger the number is. Notice this number line is split into thirds.
Apply the idea
The rational number farthest to the right on the number line is . So, the largest number is .
Consider the values 1.25 and 0.75.
a Plot the pair of numbers on a number line.
Create a strategy
We can see that 1.25 and 0.75 are both positive and so will be to the right of 0.
Apply the idea
To plot the point 1.25, start at 0 and count right 1 place and then move to the right 0.25 one time past 1. To plot the point 0.75, we can start at 0 and jump to the right by 0.25 three times.
b State the inequality sign that makes the statement true. 1.25 ⬚ 0.75
Create a strategy
Compare the plotted decimals given in the answer found from part (a).
Apply the idea
The rational number farther to the right on the number line is 1.25 so the larger number is 1.25
1.25 > 0.75 1.25 is greater than 0.75
1.25 > 0.75 Complete the inequality with the greater than symbol
Consider the statement:
a Convert to a percentage.
Create a strategy
Multiply the numerator and denominator by 2, then the result by 100%.
Apply the idea
Multiply both numerator and denominator by 2
Evaluate
Multiply by 100%
Evaluate
b Is the statement true or false?
Create a strategy
Use the answer from part (a) to compare the given numbers.
Apply the idea
Let’s start with the original statement to see if it is true.
Original statement
Substitute 134% for
The statement is false. 134% is not greater than 164%.
Write the numbers in ascending order: 71%, , 0.7, 0.99
Create a strategy
We know 0.99 is the largest because it is almost 1, which is 100%. 71% is a little bigger than 0.7 which is equal to 70%.
For , simplify to , which we know is 66.67% because it’s a common benchmark.
Apply the idea
List the numbers from smallest to the largest: , 0.7, 71%, 0.99
The symbol < represents the phrase “is less than”.
The symbol > represents the phrase “is greater than”.
The symbol = represents the phrase “is equal to”.
Descending rational numbers get smaller as we move to the left on the number line.
Ascending rational numbers get larger as we move to the right on the number line.
1 Write an expression using the symbols < or >, that compares the two numbers plotted on the number lines:
2 For each of the pairs of numbers:
i Plot the pair of numbers on a number line.
ii Identify the inequality sign, < or >, that should appear between each pair to make the statement true.
3 For each of the sets of numbers: i Plot the numbers on a number line. ii State the largest value.
4 For each of the sets of numbers: i Plot the numbers on a number line. ii Arrange the set from smallest to largest.
a 0.15, 0.65, 0.85, 0.05 b 0.8, 0.765, 0.890, 0.833 c d
Let’s practice
5 State the larger value in each pair. Justify your answer in writing.
0.75, 50%
6 Is each statement true or false?
2.73 = 273% f g h
7 Complete the expression by writing the inequality sign or equal sign, <, > or =, that would make the statement true. Justify your answer with a tape diagram. 0.75 ⬚
8 Complete the expressions by writing the inequality sign or equal sign, <, > or =, that would make the statement true. Justify your answer in writing.
9 Consider the numbers: 0.35, , 0.5, i Plot the numbers on a number line. ii Arrange the set from smallest to largest.
10 Order these fractions in ascending order.
Justify your answer using one or more of the benchmark fractions:
11 Arrange each of the sets of numbers in ascending order. a b 0.6, 0.25, 0.5 c d 0.37, 0.208, 4% e f g h
12 Arrange each of the sets of numbers in descending order.
a 0.8, 0.35, 0.15 b c 445%, 421%, 375% d
e f g h
13 Explain how comparing fractions to is used to determine which fraction is greater between and
14 Leslie is comparing and ordering 0.75, and 80% and says the common denominator is 12. Is Leslie correct? If not, what mistake did Leslie make?
15 Milk Mart sells bottles of milk containing 13.5 oz while Merry Milk sells bottles of milk containing 13.25 oz. Which store sells larger milk bottles. Explain your reasoning.
16 This morning Freezerford recorded a temperature of 3.5 °C while Coldville recorded a temperature of 2.5 °C. Which city has a colder temperature? Explain your answer.
17 A clothing store is offering two different deals on a pair of jeans:
• Deal A: Buy one pair of jeans for $40 and get the second pair at 50% off.
• Deal B: Buy one pair of jeans for $35 and get a $10 gift card with your purchase. Which deal is the better option if you want to buy two pairs of jeans? Show your work and explain your reasoning.
18 You are planning to make a batch of cookies, and you have two different recipes to choose from:
• Recipe A: Requires cups of flour, cup of sugar, and cup of butter.
• Recipe B: Requires cups of flour, cup of sugar, and cup of butter. Which recipe requires more sugar, Recipe A or Recipe B? Show your work and explain your reasoning.
After this lesson, you will be able to...
• add and subtract integers, fractions, mixed numbers, and decimals.
• solve simple real-world problems by adding and subtracting integers, fractions, mixed numbers, and decimals.
When adding or subtracting rational numbers, it is helpful to write the numbers in the same form like we did when comparing rational numbers.
Let’s review some of the key points for adding and subtracting with different types of rational numbers.
• Fractions: make sure that there is a common denominator. Once the denominators are equal, we add the numerators and the denominator remains the same.
The least common denominator between 3 and 4 is 12
Multiply to create common denominator
Evaluate the multiplication
Add the fractions and keep common denominator
• Mixed numbers: it is usually helpful to change any mixed numbers into improper fractions and then follow the same steps for adding fractions.
Convert mixed numbers to improper fractions
Multiply to get least common denominator of 12
Evaluate the multiplication
Add the fractions and keep common denominator
Convert back to a mixed number
• Decimals: we can use a vertical algorithm to line up the decimals and their place values. Pay careful attention to whether a whole is gained during addition or lost during subtraction.
Using the number line or zero pairs may be helpful when working positive and negative rational numbers.
For example, adding to is the same as subtracting
On the number line, this is moving units to the left of the
This gives us:
It is helpful to understand how to interpret adjacent signs with rational numbers:
• Adding a positive integer means we move to the right, and simplify the problem to addition: 2 + (+3) = 2 + 3
• Adding a negative decimal means we move to the left, and simplify the problem to subtraction:
• Subtracting a positive fraction means we move to the left, and simplify the problem to subtraction:
• Subtracting a negative mixed number means we move to the right, and simplify the problem to addition:
Consider the following expression:
a Estimate the solution.
Create a strategy
We know that subtracting a negative value is the same as adding its opposite and that is close to 1.
Apply the idea
3 + 4 + 1 = 8
We can estimate that the solution will be close to 8.
b Evaluate, write your answer in simplest form.
Create a strategy
Follow the order of operations and evaluate the addition and subtraction from left to right.
Apply the idea
Evaluate the addition
Combine adjacent signs
Write as a mixed number
Reflect and check
Alternatively, we could have also converted 7 to an improper fraction, and performed the addition to get an improper fraction as our answer.
Convert 7 to an improper fraction
Combine adjacent signs
Multiply for common denominator of 5
Evaluate the multiplication
Add numerators and keep common denominator
However, converting the result back into a mixed number gives us a better idea of the size of the number which can be helpful when solving real-world problems.
Consider the expression
a Evaluate, write your answer as a mixed number.
Create a strategy
Convert both numbers into improper fractions, perform the addition, then convert the answer back into a mixed number.
Apply the idea
b Justify your solution.
Create a strategy
We can use estimation to justify our solution.
Convert the mixed number to an improper fraction
Convert the decimal to an improper fraction
Add the numerators
Evaluate the addition
Simplify the fraction
Convert the improper fraction to a mixed number
is close to, but slightly smaller than 7.5 and 4.375 is close to but slightly smaller than 4.5
We can use the estimations to evaluate 7.5 + 4.5 to get 3. So we know that the solution of is reasonable.
Operations with fractions:
• When adding or subtracting fractions, be sure there is a common denominator. Then add or subtract the numerators and keep the denominator.
• When there is a mixed number, change it to an improper fraction, and proceed as if this were a normal fraction operation.
• If you have adjacent positive (plus) and negative (minus) signs, this will become a minus sign.
• If you have two adjacent negative (minus) signs, this will become an addition sign.
• When adding two numbers with different signs, we can use the number line to illustrate the process.
1 Evaluate, writing your answer in the same simplest form:
2 Determine whether the value of each expression is negative or positive. a 12.7 + 8.4
c 20 ( 21.42)
3 What do you need to check before adding or subtracting two fractions?
Let’s practice
4 Estimate which expression has a value closest to 7.
5 Estimate the solution:
6 Evaluate, writing your answers in simplest form:
7 Evaluate, writing your answers in simplest form:
8 Evaluate, writing your answers as mixed numbers in simplest form:
9 Evaluate and justify, writing your answers as a decimal:
10
Evaluate and justify, writing your answers as mixed numbers in simplest form:
11 Evaluate and justify, writing your answers in simplest form:
12
Evaluate and justify, writing your answers in simplest form:
13 For 9 + ( 2.4),
a Evaluate the expression.
b Determine whether the situations could be calculated using 9 + ( 2.4):
i Rose has $9 in her account. If she spends $2.40, how much does Rose have left in her account?
ii Lily has $9 in her account. If she spends $2.40, how overdrawn is Lily?
iii Ben has $9 in his account. If he deposits $2.40 into his account, how much does Ben have?
14 Consider 3.87 ( 0.55).
a Evaluate 3.87 ( 0.55)
b Determine whether the situations could be calculated using 3.87 ( 0.55):
i The temperature at midnight was 0.55 °C. By midday, the temperature was 3.87 °C. What was the temperature change?
ii At midday, the temperature was 3.87 °C. The temperature then fell by 0.55 °C. What was the final temperature?
iii It was really cold at midnight. During the morning, the temperature rose 3.87 °C. By midday, it had reached 0.55 °C. What was the temperature at midnight?
15 At the end of last month, a dam was full. Over the current month, of the dam’s capacity was used up by the town. Meanwhile, rain filled of the dam’s capacity. What fraction of the dam is full at end of this month?
16 Consider 13.8 + ( 14.52) 22.03.
Mia and James evaluate the expression in different ways.
Mia’s working:
James’ working:
Who do you think is correct? Explain.
After this lesson, you will be able to...
• multiply and divide integers, fractions, mixed numbers, and decimals.
• solve simple real-world problems by multiplying and dividing integers, fractions, mixed numbers, and decimals.
Just like with adding and subtracting different types of rational numbers, it is helpful to convert numbers to the same form when multiplying or dividing them.
• Multiplying decimals: multiply the numbers as if there were no decimal points at all. Then, count the numbers after the decimal points in the original numbers, and place the decimal in the total number of places to the left.
Multiply 4.83 by 5.7
In this case, the original numbers are 4.83, which has two decimal places, and 5.7, which has one decimal place. So, their product will have 2 + 1 = 3 decimal places.
27.531
• Dividing decimals: use the fact that multiplying by 10 moves the decimal one place to the right. Take the divisor and multiply it by 10 until it is a whole number, then multiply the dividend by that same power of 10. We can then use long division rules for whole numbers.
Divide 5.6 by 0.7
5.6 ÷ 0.7 = (5.6 ⋅ 10) ÷ (0.7 ⋅ 10) Convert divisor to a whole number by multiplying by both values by 10
= 56 ÷ 7
= 8
Divide 56 by 7 using long division
Evaluate
• Multiplying fractions: multiply the numerators, multiply the denominators, and simplify.
Multiply by
Multiply the numerators
Multiply the denominators
Simplify the fraction
• Dividing fractions: take the reciprocal of the divisor and multiply. Then, follow the rules for multiplication.
Divide by
Take the reciprocal of the divisor and multiply
Multiply the numerators and denominators
Simplify the fraction
• Mixed numbers: change it into an improper fraction and proceed to use the rules for multiplying or dividing fractions.
Divide by
Convert mixed numbers to improper fractions
Take the reciprocal of the divisor and multiply
Multiply the numerators and denominators
Simplify the fraction
When we have negative rational numbers, the same rules of negative and positive integers apply:
• Multiplying or dividing two positive rational numbers gives a positive result.
Multiply by
Multiply the numerators and denominators
Simplify the fraction
• Multiplying or dividing two negative rational numbers gives a positive result.
Multiply 2.5 by 4
2.5 ⋅ 4 = 25 ⋅ 4
= 100
= 10.0
= 10
Multiply the numbers as if there were no decimal places
The product will have 1 + 0 = 1 decimal place
Rewrite 100 with one decimal place added in
• Multiplying or dividing one positive and one negative rational number gives a negative result.
Divide by
Convert to improper fractions
Take the reciprocal of the divisor
Multiply the numerators and denominators
Simplify the fraction
Consider the expression 10 a Estimate the solution.
Create a strategy
We know that product of two negative numbers is a positive and that is close to but a little bit less than 2 and more than 3.
Apply the idea
10 2 = 20
10 ⋅ 2 = 30
We can estimate that the solution will be between 20 and 30 but closer to 20.
Reflect and check
The exact calculation from the problem gives when using the precise values. Our estimate of 20 is slightly smaller because we changed the value of . Depending on the context of the problem this difference may be important or the estimate may be close enough.
b Evaluate, give your answer as a mixed number.
Create a strategy
Convert the mixed number to an improper fraction, then evaluate.
Apply the idea
Convert the mixed number to improper fraction
Multiply the numerators and denominators
Evaluate the multiplications
Convert the improper fraction to a mixed number
Simplify
Consider the expression 9.11 ⋅
a Evaluate, writing your answer as decimals to the thousandths.
Create a strategy
Convert the fraction to decimal form, then multiply.
Apply the idea
Convert to decimal
Multiply the numbers as if there were no decimals at all
The product of a negative and a positive value is negative
The original values had a total of 2 + 3 = 5 decimal places
b Justify your solution.
Create a strategy
We can use estimation to justify our solution.
Apply the idea
9.11 is close to but slightly less than 9 and is close to but slightly more than
We can use the estimations to evaluate 9 to get 4.5 so we know that the solution of 5.06516 is reasonable.
Decimals
• Multiplying: treat the numbers as whole numbers initially. After multiplying, count the total number of decimal places in the original numbers and place the decimal in the product.
• Dividing: eliminate the decimal in the divisor by multiplying it and the dividend by 10 repeatedly until the divisor is a whole number. Then use long division.
Fractions
• Multiply the numerators, multiply the denominators, and simplify.
• To divide, take the reciprocal of the divisor and rewrite as multiplication.
• Rewrite mixed numbers as improper fractions first.
Signs with multiplication and division
• If signs are opposite the answer will be negative.
• If signs are the same the answer will be positive.
1 How do we evaluate operations involving mixed numbers?
2 Compare the steps for multiplying fractions to the steps for dividing fractions.
3 Evaluate:
4 Determine whether each expression is negative or positive.
5 Estimate which expression has a value closest to 12.
Let’s practice
6 Estimate the value as an integer and justify your answer:
7 Evaluate, writing your answers as decimals to the thousandths place:
8 Evaluate, writing your answers as mixed numbers in simplest form:
9 Evaluate, writing your answers as a fraction in simplest form:
10 Evaluate 5 0.51 ( 3) 0.4
11 Evaluate and express your answers in simplest form for fractions and rounded to the nearest thousandth for decimals.
12 For 15 ( 5.5),
a Evaluate the expression.
b Determine whether the situations could be calculated using 15 ( 5.5): i Zayn has 15 marbles, and he wants to share them equally among his 6 friends. How many marbles does each friend get?
ii Malik has a debt of $15. He needs to pay off $5.50 each day until he clears the debt. How many days will it take for Malik to pay off his debt?
iii Harry has 15 apples, and he wants to buy 15 more. Each apple costs $5.50. How much money does Harry need to buy all the apples he wants?
13 For ,
a Evaluate the expression.
b Determine whether the situations could be calculated using :
i Moira has liters of lemonade, and she wants to divide it equally among containers. How much lemonade does each container get?
ii Arthur has a debt of . He needs to make payments of each week until he clears the debt. How many weeks will it take for Arthur to pay off his debt?
iii Martha has pizzas, and she wants to distribute them into sets of pizzas each.
How many sets can Martha create?
14 In a survey of 270 people, said their favorite sport was football, and said their favorite sport was tennis.
a Find the total fraction of people who said their favorite sport was football or tennis.
b Find the fraction of people who did not put football or tennis as their favorite sport.
c How many people did not put football or tennis as their favorite sport?
15 Victoria borrows a 360-page novel from the library. She reads of the novel.
a How many pages did she read?
b How many more pages does she have to read to finish her novel?
After this lesson, you will be able to...
• solve multistep real-world problems involving addition, subtraction, multiplication, and division with rational numbers.
• estimate solutions to real-world problems involving addition, subtraction, multiplication, and division with rational numbers.
• justify solutions to real-world problems involving addition, subtraction, multiplication, and division with rational numbers.
The numbers involved in solving real-world problems are not always nice whole numbers or even integers. We need a variety of numbers to be able to accurately represent real-world situations. That is where rational numbers come in.
Rational numbers
The set of all numbers that can be written as the ratio of two integers with a non-zero denominator
Example: , 15, 0, 0.5 , 72, 81%,
When working with real-world problems, it’s important to be able to identify keywords. These keywords can help us determine which operation(s) can be used to solve the problem. Here are some examples of keywords which indicate the use of a certain operation
addition
subtraction multiplication division more less product equally shared add subtract by in each all together how many left times per total difference groups of divided by increase decrease double half combined fewer multiply split
Estimation can be a very useful strategy when solving real-world problems. They can help us quickly find a solution that is close to the answer and depending on the context, we may not need an exact answer, an approximation may be good enough.
Jenny takes out a loan of $2200. She pays back $42.60 each month and doesn’t have to pay interest.
If she has made 5 repayments so far, how much does Jenny still owe?
Create a strategy
Subtract the total repaid from the total amount borrowed.
Apply the idea
Balance = 2200 (42.60 5)
Subtract the total repaid from borrowed amount = 2200 – 213
Evaluate the multiplication = $1987.00
Evaluate
A bottle is full of orange juice. If 230 milliliters of orange juice is added to it, the bottle is full. How many milliliters does the bottle hold when full?
Create a strategy
Divide the added amount by the difference of first full amount from the second full amount.
Apply the idea
Divide the added amount by the amount difference
Find the common denominator
Evaluate the parenthesis
Multiply by the reciprocal
Evaluate the multiplication
Evaluate
Reflect and check
When checking our answer, we can use estimation to verify if our answer seems reasonable. For example, we can say that is not much different from , which allows us to find a common denominator.
Divide the added amount by an estimated difference
Evaluate the subtraction
After subtracting, we get , which is close to or
Estimate as
Multiply by the reciprocal
Evaluate the multiplication
This estimation is close to our actual answer of 420 mL, confirming that our answer is reasonable.
It is important to keep in mind that, while estimation is a good strategy for verifying our answer, it is not an ideal strategy for actually finding the capacity of the bottle. In this case, we slightly overestimated the result, which might lead to overfilling the bottle if we were to rely solely on the estimation. Therefore, it’s important to use the precise calculation we performed earlier to determine the exact capacity of the bottle and ensure that we don’t overfill it.
Recall the following operations and keywords when solving real-world problems. addition subtraction multiplication division more less product equally shared add subtract by in each all together how many left times per total difference groups of divided by increase decrease double half combined fewer multiply split
1 Match the context to the operation you would use to solve the problem.
a Calculating the total cost of items purchased at a store.
b Withdrawing a sum of money from a bank account.
c Determining the area of a rectangular room.
d Distributing a sum of money equally among a group of people.
i Addition
ii Multiplication
iii Subtraction
iv Division
2 Sebastian owes $47.59 to each of his 3 friends. If we want to find how much he owes altogether, what operation would we use?
3 Katrina is baking a muffin and a cake. She needs cup of sugar for the muffin and cup of sugar for the cake.
How much sugar will she need to make both the muffin and the cake?
4 Luisa has meters of string. She needs meters of string to make a bracelet. How many bracelets can Luisa make with her string?
5 Consider the following table that shows the heights of different buildings in meters:
a Find the change in height from the Burj Khalifa to the Shanghai Tower.
b If the height difference from one of one building to another was 99.6 yd, what were the buildings?
c Taipei 101 is a famous building in Taiwan that is 61.2 yd taller than the Petronas Tower. Find the height of the Taipei 101 building.
6 Evaluate:
yd
yd
yd
7 Jamal has a pizza that’s divided into 8 equal slices. He eats 3.5 slices for lunch and then shares the remaining pizza equally with his 2 friends.
a How many slices does each person get when they share the pizza? Justify your answer.
b How many slices did Jamal eat in total? Justify your answer.
8 Vanessa earns $897.35 a month, and deposits it in to her bank account. She also withdraws $190 a month to pay for rent.
a Estimate how much Vanessa’s bank account changes every month.
b What is the exact change in her bank account over one year?
9 At midnight, the temperature in Buffalo is 45.7 °F. Each hour, the temperature decreases by 2.87 °F. What is the temperature 5 hours later?
10 Ellen bought a total of 56 muffins. Each muffin cost $0.78, including tax. Of the muffins she bought, were banana muffins. What was the total cost of only the banana muffins?
11 Mariela is planning a hiking trip and has a budget of $300. She spends $75 on hiking gear, $119.27 on food, and $43.85 on transportation. How many friends can she treat to a $30 meal with the remaining budget? Justify your answer.
12 Suleka takes out a loan of $2200. She pays back $42.60 each month and doesn’t have to pay interest. If she has made 5 repayments so far, how much does Suleka still owe?
13 Caitlin is planning to make an investment. She is told by her bank manager that if she puts her money into their new account, she will have 1.6 times her investment, minus a fee of $122, by the end of the year. Calculate how much money she will have at the end of the year if she invests $1000.
14 During a clearance sale, 247 T-shirts were available for purchase, but not all of them found buyers. If 0.2 of the T-shirts were sold, estimate how many T-shirts were left on the rack.
15 At the end of last month, a dam was full. Over the current month, of the dam’s capacity was used up by the town. Meanwhile, rain filled of the dam’s capacity over the duration of the month. Calculate the fraction of the dam filled at the end of this month.
16 In direct sunlight, solar panels on a house generate 8.71 kWh of electricity each hour, and on average, the house gets 7 hours of sunlight a day. Any unused power is returned to the main grid and the homeowner receives 33 cents per kWh.
Over a 24-hour period, the household’s usage averages out to 1.87 kWh each hour. How much will the homeowner expect to make each day by selling back electricity if they install the solar panels?
17 After an earthquake, of all claims were paid within a month. Of the remaining claims that had not yet been paid, of them were paid within the second month. What fraction of all claims were paid in the second month?
18 A pitcher contains 0.25 gallons lemonade. When an additional 1 gal of lemonade is poured into the pitcher, it becomes half full. What is the total capacity of the pitcher when it’s full? Justify your work.
19 Luke has a dice tin that is full. He puts 8 extra dice in and the tin is now full.
a What fraction of the tin do the 8 extra dice take up?
b How many dice can fit inside the tin?
20 At a bookstore, there were 120 books on sale, but not all of them were purchased. If some books were sold at a discount, which is of the total number of books that were sold, how many books remain unsold?
Recall for positive powers of 10, we realized that the exponent was the same as the number of zeros after the 1 once evaluated. For negative powers of 10, the exponent relates to the number of zeros between the decimal point and the 1, however not quite in the same way.
What’s really happening is the negative exponent is reducing the place value of the number. This makes it look like the decimal point is “moving” to the left a number of places equal to the exponent. But it’s really the place value that is changing, not the decimal point.
Rewrite 10 7 as both a fraction and a decimal.
Create a strategy
For the fraction, we will apply the negative exponent property. For the decimal, using the patterns discovered in the lesson, we will adjust the place value by 7 places.
Apply the idea
Apply the negative exponent property
Adjust the place value by 7 places
The negative exponent property states:
That is, when raising a base to a negative power:
• Take the reciprocal of the expression
• Change the sign of the power
This is equivalent to adjusting the place value by n places.
1 What is the result of 10 to the power of 3 (103)?
a Explain the process of calculating this power of 10 with a whole number exponent.
b Provide the final answer.
2 Answer the following:
a What are the next two numbers in this sequence: 0.1, 0.01, 0.001?
b Re-write this sequence as powers of 10.
c Explain how the decimal numbers relate to their counterparts as powers of 10.
3 Explain how 10 3 is related to ?
4 For each pair of numbers, determine the smaller value: a 105 or 107 b 103 or 10 3 c 10 6 or 10 8 d 103 or 10 4
5 Write as a power of 10 with a negative.
6 Represent the following in fractional and decimal form: a 10 5 b 10 1 c 10 8
7 Write each of the following as a power of 10: a 0.001 b
10 10
0.000 000 000 01
8 Which of the following is the fraction and decimal form of 10 4?
A and 0.001 B and 0.01 C and 0.0001 D and 0.000 01
9 Match the powers of 10 with negative exponents to their decimal forms. a 10 2 i 0.1
b 10 6 ii 0.000 001 c 10 1 iii 0.01
10 Fill in the blank with the appropriate power of 10 with a negative exponent:
11 Explain how the value of 10 n changes as, n increases. Provide an example with your explanation.
12
A certain medication requires a dosage of 0.000 01 grams. Write this dosage as a negative power of 10 and explain in context what the negative exponent represents.
13 If one cell divides into 10 cells every hour, how would you represent the fraction of the original cell size after 3 hours using a power of 10 with a negative exponent?
14 Complete the statements using <, =, or > sign.
100 ⬚ 103 f 0.001 ⬚ 10 3
15 The mass of a grain of rice is approximately 10 2 grams. About how many grains of rice are in a 5 kg bag? (There are 1000 grams in a kg).
16 Mari claims that multiplying by 10 2 is the same as dividing by 102. Do you agree or disagree? Justify your conclusion.
After this lesson, you will be able to...
• convert positive numbers between scientific notation and decimal form.
Scientific notation is a way of representing very large or very small numbers, without needing to write lots of zeros. Consider the mass of the sun, which is approximately 1, 988, 000, 000, 000, 000, 000, 000, 000, 000, 000 kg. That’s a very large number. How do scientists deal with numbers so large?
Explore online to answer the questions
mathspace.co
Use the interactive exploration in 1.06 to answer these questions.
1. Explore 10 random numbers and how the power of ten relates to the number in the tens position.
2. What types of numbers have positive or negative powers of ten?
3. Describe the relationship between the place value of the digits and the number in scientific notation.
4. Can you come up with a rule for taking a very large number in scientific notation? What about a very small number?
Going back to the example about the mass of the sun:
• The sun has a mass of approximately 1.988 1030 kg, which is much easier to write than 1, 988, 000, 000, 000, 000, 000, 000, 000, 000, 000 kg.
• The mass of an atom of Uranium (one of the heaviest elements) is approximately 3.95 × 10 22 g. That is 0.000 000 000 000 000 000 000 395 g.
In scientific notation, numbers are written in the form:
a × 10n
a decimal number greater than or equal to 1 but less than 10 n positive or negative integer
• A negative exponent indicates how many factors of ten smaller than a the value is.
• A positive exponent indicates how many factors of ten larger than a the value is.
We can follow these steps in writing numbers in scientific notation.
1. Move the decimal point to the left or right so that it is right after the first non-zero digit (from 1 to 9).
Where’s the decimal point in 2, 680, 000? Because it’s a whole number, the decimal point is understood to be at the end of the number: 2, 680, 000.
The first non-zero number is 2. If we move the decimal point 6 places from the end of the number to the right of the 2, we will get 2.68. We don’t need the extra zeroes. The number 2.68 is between 1 and 10 as we wanted.
2. Multiply by 10 to the power of the number of places the decimal moved.
We moved 6 places to the left so we have 106
Remember, we’re not actually “moving” the decimal point. We’re adjusting the place value. Then to balance that out, we have to multiply by the correct power of 10.
What value should go in the space to make the expression on the right in scientific notation form?
300 = ⬚ × 102
Create a strategy
Write the expression without scientific notation.
Apply the idea 102 is equivalent to 10 × 10 or 100.
300 = 3 × 10 × 10
300 = 3 × 10²
The value that should go in the space is 3.
Express 0.07 in scientific notation.
Create a strategy
Since the number is less than 1, we will move the decimal point to the right so that we have the decimal point right after the first non-zero single digit.
Reflect and check
This means that 300 in scientific notation is 3 × 10²
Note that the definition of scientific notation form is a × 10n, where a is greater than or equal to 1 and less than 10. This is why we are putting 3 into the blank space, and not 30 or 300.
Apply the idea
We’ll move the decimal point of 0.07 two places to the right so we’ll have 7.0 or simply 7.
Moving to the right means a negative power of 10.
The number 0.07 expressed in scientific notation is 7 × 10 2
Express 3.66 × 10 6 as a decimal number.
Create a strategy
Since the power is negative, the answer will be a smaller decimal.
Apply the idea
We should move the decimal point 6 places to the left, and fill the spaces with zeros.
3.66 × 10 6 = 0.000 003 66 Move the decimal point
Scientists recorded the diameter of Mercury as 4.879 × 10³ km. Write the diameter of mercury in standard form.
Create a strategy
Find the value of the power of ten then multiply it by the constant term to get the number in standard form.
Apply the idea
Diameter of mercury = 4.879 × 10³ Given = 4.879 × 1000
Evaluate the power = 4879 km
Evaluate the multiplication
A number is written in scientific notation if it has the form a × 10n where a is greater than or equal to 1 and less than 10, and n is an integer.
Standard form Product form Scientific notation
000
1 Write as fractions.
2 Write as decimals.
3 Write as powers of 10:
4 105 is equal to:
5 In scientific notation, numbers are written in the form a × 10n where:
A a is any decimal number and n is any integer
B a is a decimal number between 1 and 10 (not equal to 10) and n is any integer
C a is a decimal number between 1 and 10 (not equal to 10) and n is a positive integer
D a is an integer between 1 and 10 (not equal to 10) and n is any decimal
6 Rewrite each expression using the correct form of scientific notation.
7 Complete the following equations:
8 Consider the following numbers:
a Which numbers are equivalent to 0.000 45?
b From your answers in part (a), which one is in scientific notation?
9 Express each number in scientific notation:
10 Express each number in scientific notation:
11 Express each number in scientific notation:
12 Express as whole numbers:
13 Express as decimals:
14 What is 0.000 001 8 written in scientific notation?
15 Which two statements show a number and its equivalent written in scientific notation? A 18 590 000 = 1.859 × 10⁷ B 7
000 = 7.25 × 10 6
= 8.84 × 10³ D 0.000 023 = 2.3 × 10⁶ E 0.000 001 05 = 1.05 × 10 6
16 The distance between two stars is approximately 9 × 10⁷ meters. Express this distance as a whole number.
17 The thickness of coating on a camera lens is 0.000 001 m. Express the thickness in scientific notation.
18 The world’s oceans hold approximately 188 000 000 000 000 000 000 gallons of water. Express this volume of water in scientific notation.
19 Emmy and Ram are having a discussion about the number 368.23 × 10⁵. Emmy says that it is correctly written in scientific notation, and Ram says it is not correctly written in scientific notation. Who is correct? Explain.
20 Explain why a scientist would want to express a very large or small number in scientific notation.
21 Simplify the expression 2.34 × 10³ + 5.67 × 10³
22 Convert the number 5.25 × 10 4 to fractional form.
23 Which of the following could reasonably represent the number of spectators in a large stadium during a major sports event?
24 Bone marrow in a person’s body produces 2.3 × 10⁶ red blood cells each second.
a Express the amount of red blood cells as a whole number.
b Find the number of red blood cells produced each minute. Express your answer in scientific notation.
After this lesson, you will be able to...
• compare positive numbers written in scientific notation using inequality symbols.
• order positive numbers written in scientific notation from least to greatest and greatest to least.
Consider the following pairs of numbers written in scientific notation. Evaluate each number and write it in standard form and determine which of the two numbers is larger.
Scientific notation Standard form Which is larger?
1.2 × 10 2 and 1.2 × 10² 0.012 and 120 1.2 × 10²
2.3 × 10² and 3.4 × 10²
4.8 × 10 5 and 2.3 × 10⁵
8 × 10⁴ and 6 × 10⁸
2.3 × 10 3 and 3.4 × 10 3
4.8 × 10 5 and 2 × 10 2
1. If the numbers in scientific notation have the same decimal number, what helps us to determine which is larger?
2. If the numbers in scientific notation have the same exponent, what helps us to determine which is larger?
3. How do negative exponents and positive exponents on the power of 10 in scientific notation change the number in standard form?
You can compare two numbers written in scientific notation by looking at their powers of 10. We can compare numbers in scientific notation by looking at their powers. When ordering numbers in scientific notation, there are a few strategies we can utilize.
• The number with the greater power of 10 will be the greater number.
• If two numbers have the same power of 10, then compare the decimal numbers to determine the greater number.
• Numbers in scientific notation with negative exponents will always be smaller than numbers in scientific notation with positive exponents.
We can use these strategies when asked to order numbers in scientific notation in either ascending or descending order. Listing numbers in ascending order means listing them from least to greatest. Listing numbers in descending order means listing them from greatest to least.
Which of the numbers is larger: 2.7 × 10⁴ or 3.4 × 10³
Create a strategy
The powers are different values so we can compare the powers to determine which number is larger.
Apply the idea
104 > 103 Compare the powers of 10
4 > 3 The exponent 4 is greater than the exponent 3
2.7 × 10⁴ > 3.4 × 10³ So, 2.7 × 10⁴ is the larger number.
Order the numbers from least to greatest: 7.23 × 10⁷, 7.1 × 10⁶, 5.6 × 10⁷
Create a strategy
We can start by comparing the powers of 10, then by comparing the decimal numbers.
Apply the idea
The powers of 10 of the three numbers are 7, 6, and 7. 107 > 106 Compare the powers of 10
7 > 6 The exponent 7 is greater than the exponent 6
7.23 × 10⁷ and 5.6 × 10⁷ > 7.1 × 10⁶ So, 7.1 × 10⁶ is the smallest number.
The remaining two numbers have an equal power of 107, so we will compare the decimal values.
7.23 > 5.6 Compare the place value farthest to the left.
7 > 5 In the ones place 7 is greater than 5
7.23 × 10⁷ > 5.6 × 10⁷ So, 7.23 × 10⁷ is the largest number.
And that means 5.6 × 10⁷ is the middle number. So, from least to greatest we have:
7.1 × 10⁶, 5.6 × 10⁷, and 7.23 × 10⁷
When ordering and comparing numbers in scientific notation, we can do the following:
• If the powers of 10 are different, the larger number is the one with the larger exponent.
• If the powers of 10 are equal, compare the decimal numbers. The larger number is the one with the larger decimal number.
1 To compare 4.13 × 10⁴ and 4.3 × 10⁴:
a Express 4.13 × 10⁴ as a decimal. b Express 4.3 × 10⁴ as a decimal.
c Determine the larger number.
2 To compare 7.14 × 10 3 and 6.14 × 10 4 :
a Express 7.14 × 10 3 as a decimal. b Express 6.14 × 10 4 as a decimal.
c Determine the larger number.
3 For each pair of numbers, determine the smaller value: a 105 or 107 b 103 or 10 3 c 10 6 or 10 8 d 103 or 10 4
Let’s practice
4 Fill in the blank to make the statement true. 3.2 × 10⁵ > 7.6 × 10⬚ A 7 B 6 C 5 D 4
5 Fill in the blank to make the statement true. 2.44 × 10² < ⬚ × 102
6 Fill in the blank to make the statement true. ⬚ × 106 = 9.51 × 10⁴ A 0.951 B 0.0951 C 95.1 D 951
7 Complete the statements using <, > or = sign. a 4 × 10 5 ⬚ 3 × 10 5 b 1 × 10 2 ⬚ 2 × 10
× 10 5 d 4.75 × 10 3 ⬚ 5.25 × 10 5 e 300 ⬚ 3 × 10³ f 0.007 ⬚ 6 × 10 3
8 For each set of numbers: i Determine the largest number. ii Determine the smallest number. a b c d e f g h
• 7.27 × 10 7
• 2.22 × 10 7
• 4.76 × 10 7
• 2.93 × 10 2
• 7.88 × 10²
• 7.88 × 10 2
• 1.25 × 10 2
• 1.25 × 10 6
• 1.25 × 10²
• 8.99 × 10 3
• 1.99 × 10 6
• 8.99 × 10 6
• 9.37 × 10 4
• 6 × 10 4
• 6 × 10 9
• 4.7 × 102 × 103
• 4.7 × 10 8 × 10⁸
• 4.7 × 109 × 108
• 7.31 × 10 9
• 5.13 × 10 9
• 8.31 × 10 9
• 2.12 × 10 1 × 10⁷
• 2.12 × 10 7 × 10⁴
• 2.12 × 107 × 102
9 Arrange the numbers in ascending order. a 7 × 10 6, 7 × 10 5, 7 × 10 3, 7 × 10 4 b 6.2 × 10 3, 2.6 × 10 3, 1.5 × 10 3 c 1.4 × 10 4, 1.4 × 10⁴, 4.1 × 10 4 d 3.25 × 10 6, 2.67 × 10 8, 4.72 × 10 7, 1.36 × 10 9
10 Arrange the numbers in descending order.
a 4.35 × 10 5, 3.76 × 10 7, 5.82 × 10 6, 2.46 × 10 8 b 7.3 × 10 2, 3.7 × 10 2, 2.5 × 10 2
c 8 × 10 5, 8 × 10 4, 8 × 10 2, 8 × 10 3 d 2.5 × 10 3, 2.5 × 10³, 5.2 × 10 3
11 Fill in the blank in the correct order: 5.8 × 10⁴, ⬚, 2.3 × 10⁵, 4.1 × 10⁶
A 1.9 × 10⁵ B 3.2 × 104
× 105
12 Fill in the blank in the correct order:
13 Arrange the numbers shown into an ascending sequence.
• 8.6 × 10³
• 2.1 × 10⁵
• 3.4 × 10⁴
• 4.8 × 10²
14 Arrange the numbers shown in order from largest to smallest.
Numbers
7.3 × 10³
1.6 × 10 3
6.9 × 10⁴
5.4 × 10 3
15 A certain type of microscopic bacteria has an average diameter of 2.4 × 10 6 meters, while a human red blood cell has an average diameter of 1.2 × 10 5 meters. Which one is larger?
16 Consider the distances from Earth to two different planets in our solar system: Jupiter and Saturn. The distance from Earth to Jupiter is approximately 6.2 × 10⁸ kilometers, and the distance from Earth to Saturn is around 1.2 × 10⁹ kilometers at their closest approach. Which planet is closest during their closest approach?
17 A kitten weighs 1.6 × 101 kg and a mouse weighs 1.9 × 101 g. Which animal is heavier?
Let’s extend our thinking
18 For each pair of numbers:
i Determine the largest number. ii Find the factor by which it is greater.
a 780 × 10 1 and 7.8 × 10²
19 When rounded to one significant figure, sound travels at a speed of approximately 0.3 kilometers per second, while light travels at a speed of approximately 300 000 kilometers per second.
a Express the speed of sound in kilometers per second in scientific notation.
b Express the speed of light in kilometers per second in scientific notation.
c How many times faster does light travel than sound?
20 Consider:
• A plane is traveling eight hundred thousand meters per hour.
• An asteroid is traveling at 8 × 10⁸ meters per hour.
a Express the speed of the plane in scientific notation.
b How many times faster is the asteroid traveling?
21 Two stars, A and B, in neighboring galaxies have masses of 2.7 × 1041 kg and 8.91 × 1044 kg respectively. How many times more massive is star B than star A?
22 The mass of the largest mammal on Earth is approximately 1.5 × 10³ times greater than the mass of an average adult human who weighs 90 kg. According to this information, find the approximate mass of the largest mammal on Earth.
Evaluate
Create a strategy
We need to find a positive number that equals 256 when multiplied by itself. We can start from a perfect square that we have memorized, such as 122 = 144, then square numbers larger than 12.
Apply the idea
256 is larger than 144, which is 122, so we can begin by squaring 13, 14, 15, etc. until we find the solution.
13 13 = 169
14 14 = 196
15 15 = 225
16 16 = 256
The answer is 16.
Reflect and check
We can also use a grid to verify our answer. If we create a square grid with 256 smaller squares, we should be able to see that each side length is 16. 16
Finding the square root of a perfect square is looking for a number that, when multiplied to itself, will give the value.
1 Evaluate the following:
2 Explain the difference between a perfect square and a non-perfect square.
3 Consider the perfect squares: 1, 4, 9, 16, 25, 36
What pattern do you notice that is formed by these perfect squares?
4 State whether the following numbers are perfect squares:
5 For each of the following, determine the square root:
a If 5 5 = 25, find .
c If 6 ⋅ 6 = 36, find
e If 0.4 0.4 = 0.16, find
g If , find
Let’s practice
b If 7 7 = 49, find .
d If 7 ⋅ 7 = 49, find
f If 0.05 0.05 = 0.0025, find
h If , find
6 Evaluate the following: a b c d e f g h
7 Evaluate the following: a b c d
8 a What is the relationship between square roots and squaring a number.
b How can we explain the concept of square roots as the inverse of squaring a number?
9 Amina finds an older square-screen TV that can play old video games, the TV screen is in the shape of a square. Each side of the TV screen measures 16 inches.
a What is the total area of the TV screen in square inches?
b How can the concept of squares be used to calculate it?
10 A homeowner wants to build a square garden and knows she wants the total area to be 169 ft2 for the plants she intends to grow.
a What is the length of one side of a square garden?
b How can the concept of square roots be used to calculate it?
11 Identify the missing perfect squares from the list of numbers between 1 and 100 provided below: 25, 9, 1, 81, 49, 36, 100, 4
12 Alex is an artist designing a square mosaic. He wants to create a mosaic that covers an exact square area, making it simpler to design symmetric patterns. Alex is aware that for a square area, the length of each side is the square root of the total area. If Alex decides to make the mosaic with an area of 289 ft2, what should be the length of each side of the mosaic? Explain your answer using the concept of square roots.
13 You know that = 3, = 4, and = 5. Now, use your calculator to find the approximate values of: a b c
d What do you notice about the decimal answers you obtain for these square roots in relation to the numbers whose square roots you already know?
e Approximate the without a calculator and justify your reasoning.
14 Calculate the value of . Express your answer in simplest form.
15 Find the square root of 0.25. Express your answer in simplest form.
16 Evaluate and determine if the result is positive or negative. Express your answer in simplest form.
17 If a = and b = , compare the values of a and b. Express your answer in simplest form.
18 Is zero a perfect square? Why or why not?
19 Is 100 a perfect square? Why or why not?
20 Imagine a tiled square area where each tile is 1 square unit. If the total area of the square is a perfect square number, can the length of each side of the square also be a perfect square? Explain your reasoning and provide an example to illustrate your answer.
Big ideas
• If two quantities are proportional, the relationship can be represented in a variety of ways.
• Percents are useful for comparing a quantity to a whole amount.
• A family of functions is defined by a unique set of characteristics shared by all functions that belong to that family. These characteristics give insight into the types of real-world situations that a function models.
• A standard algorithm can be followed to solve a wide range of equations. This algorithm is reliable and useful in a variety of situations, but there is often a more efficient method that can be used based on the structure of the equation.
• There are many ways to represent a function (equation, table, graph, written description, etc.). The way a function is represented can affect what conclusions can be made.

After this lesson, you will be able to...
• create a ratio table for a proportional relationship.
• use a ratio table to find missing values in a proportional relationship.
• solve real-world problems using ratio tables.
We say that two quantities have a proportional relationship if the ratio between quantities is constant. This ratio, called the constant of proportionality, can be any non-zero number. When two quantities are proportional, we can use a ratio table to represent equivalent ratios, as well as determine unknown values.
If a car can drive 51 miles on 3 gallons of gas, we could write this as a ratio: 51 : 3.
In a ratio table, we have:
Gas (gallon) Distance (mi) 1 17 ×17 ×17 3 51 4 68 5 85
This relationship is proportional because the ratio of miles driven to gas is constant:
Since our first ratio has a denominator of 1, we know 17 is the unit rate, or rate of change. We can also use a ratio table or unit rate to help us determine unknown values. For example, if we wanted to find out how far we could drive with 11 gallons of gas, we have the following:
Gas (gallon) 1 3 4 5 11 Distance (mi) 17 51 68 85 ⬚
As we know that the ratios in the table are proportional, we can determine the corresponding distance to 11 gallons of gas by equating ratios.
17 : 1 = ⬚ : 11
17 : 1 = 17 11 : 1 11
Equivalent ratios
Multiply both parts of the ratio by 11 = 187 : 11
Therefore, for every 11 gallons of gas, we can drive 187 miles.
The constant of proportionality, also called the rate of change, can also be negative: x 1 2 3 4 10 y 5 10 15 20 50
The unit rate is 5 which means as x increases by 1, we know y decreases by 5.
Determine whether each table of values represents a proportional relationship, and explain your reasoning.
a
x 2 6 10 14 18 y 1 3 5 7 9
Create a strategy
If the table represents a proportional relationship, it will be made up entirely of equivalent ratios. We can check to see if each ratio is equal by first writing the ratios in fraction form, .
Apply the idea
As we can see, all of the ratios are equal. The table of values represent a proportional relationship because the ratio is constant.
b
Create a strategy
If the table represents a proportional relationship, it will be made up entirely of equivalent ratios. We can check to see if each ratio is equal by first writing the ratios in fraction form,
Reflect and check is called the constant of proportionality.
Apply the idea
The table of values does not represent a proportional relationship because one of the the ratios is , while the rest are
c Create a strategy
If the table represents a proportional relationship, it will be made up entirely of equivalent ratios. We can check to see if each ratio is equal by first writing the ratios in fraction form, .
4 8 16 20 6 18 24
Create a strategy
Apply the idea
The table of values represent a proportional relationship because the ratio is constant 3.2.
Complete the pattern of equivalent ratios by filling in the gaps in the following tables: a
Since we are told the ratios of each row are equivalent, each value in a row must be multiplied by the same number to get values for a new row.
Apply the idea
Since we need to multiply 4 by 2 to get 8, we can find the first missing value by creating an equivalent ratio:
4 : 6 = 8 : ⬚ Equate the ratios
4 : 6 = 4 ⋅ 2 : 6 ⋅ 2 Multiply both parts of the ratio by 2 = 8 : 12
To create a ratio equivalent to 4 : 6 in the form x : 18, we must multiply by 3 since 6 3 = 18.
4 : 6 = ⬚ : 18 Equate the ratios
4 : 6 = 4 3 : 6 3 Multiply both parts of the ratio by 3 = 12 : 18
To create a ratio equivalent to 4 : 6 in the form 20 : x, we must multiply by 5 since 4 5 = 20.
The equivalent ratios are: 4 8 12 16 20 6 12 18 24 30 x 1 4 6 8 12
4 : 6 = 20 : ⬚ Equate the ratios
4 : 6 = 2 5 : 6 5 Multiply both parts of the ratio by 5
= 20 : 30
Reflect and check
We could have chosen any ratios to work with since they are all equivalent. We chose the ratios that are easiest to manipulate with multiplication.
How can we check if this table represents a proportional relationship? Since we know that each ratio is equivalent, the table must represent a proportional relationship.
b Create a strategy
Since we are told the ratios of each row are equivalent, each value in a row must be multiplied by the same number to get values for a new row.
Apply the idea
In order to create a ratio equivalent to 7 : 2 in the form ⬚ : 4, we must multiply by 2 since 2 ⋅ 2 = 4.
7 : 2 = ⬚ : 4
7 : 2 = 7 2 : 2 2
Equate the ratios
Multiply both parts of the ratio by 2 = 14 : 4
To create an equivalent ratio in the form ⬚ : 16, we must multiply by 8 since 2 8 = 16.
7 : 2 = ⬚ : 16
7 : 2 = 7 8 : 2 8
Equate the ratios
Multiply both parts of the ratio by 8 = 56 : 16
The equivalent ratios are: 7 14 28 56 112 2 4 8 16 32
c Create a strategy
Since we are told the ratios of each row are equivalent, each value in a row must be multiplied by the same number to get values for a new row.
Apply the idea
In this table, we don’t know the values in the first row so we will need to start with a ratio that has both values completed.
Let’s use 324 : 81. In order to create a ratio equivalent to 324 : 81 in the form 4 : ⬚, we must divide by 81 since 324 ÷ 4 = 81.
324 : 81 = 4 : ⬚
324 : 81 = 324 ÷ 81 : 81 ÷ 81
Equate the ratios
Divide both parts of the ratio by 81 = 4 : 1
To create a ratio equivalent to 108 : 27 in the form ⬚ : 3, we must divide by 9 since 27 ÷ 3 = 9.
108 : 27 = ⬚ : 3
108 : 27 = 108 ÷ 9 : 27 ÷ 9
Equate the ratios
Divide both parts of the ratio by 9 = 12 : 3
To create a ratio equivalent to 324 : 81 in the form 36 : ⬚, we must divide by 9 since 324 ÷ 9 = 36.
324 : 81 = 36 : ⬚
324 : 81 = 324 ÷ 9 : 81 ÷ 9
Equate the ratios
Divide both parts of the ratio by 9 = 36 : 9
The equivalent ratios are: 4
A potter requires 4 kilograms of clay to make 18 tea cups. How many kilograms of clay are needed to make 54 tea cups?
Create a strategy
Use equivalent ratios to determine how many kilograms of clay are needed to make 54 tea cups.
Apply the idea
We can set up a ratio table to better understand the relationship between the quantities. Let’s use c to represent the weight of the clay needed for 54 tea cups.
Clay 4 c Tea cup 18 54
We can use equivalent ratios to determine c. In order to create a ratio equivalent to 4 : 18 in the form c : 54, we must multiply both parts by 3 since 18 3 = 54.
4 : 18 = c : 54
Equate the ratios
4 : 18 = 4 3 : 18 3 Multiply both parts of the ratio by 3 = 12 : 54
The potter needs 12 kilograms of clay to make 54 tea cups.
A proportional relationship is a collection of equivalent ratios.
We can use ratio tables or equivalent ratios to determine unknown values. If a relationship is proportional, all of the values in the table will represent equivalent ratios.
The constant of proportionality can be used to solve for missing values in a proportional relationship as well. It tells us the rate necessary to go from one quantity to another.
1 Define a ratio.
2 Provide an example of a ratio in the three forms: a : b, , a is to b
3 Find the missing value, given that the two quantities are in proportion. a b
4 If the ratios are equivalent to 5 : 8, find the missing value.
a ⬚ : 32
5 Simplify these ratios.
a 7 : 28
6 Determine whether these pairs of fractions are equal.
b 400 : ⬚
b 24 : 3
7 For each table of values, determine whether or not they represent a proportional relationship. Then, explain your reasoning.
b c d e f g h
8 A recipe requires 3 cups of flour for every 4 cups of sugar. Write this ratio in all three forms.
9 Jordan is comparing two different phone plans:
• Plan A charges a flat rate of $30 per month for unlimited calls and texts, plus $10 for every gigabyte (GB) of data used.
• Plan B charges a total of $50 per month for unlimited calls, texts, and up to 5 GB of data usage. For any data used beyond 5 GB, Plan B charges an additional $8 per gigabyte.
Jordan is trying to determine if the cost of either phone plan in relation to the amount of data used represents a proportional relationship.
Analyze both plans and explain if either, both, or neither of the plans represents a proportional relationship between the cost and the amount of data used. Support your reasoning with calculations or a detailed explanation.
10 Explain how you can determine if a table represents a proportional relationship. Provide specific criteria or indicators that you would look for to identify such a relationship.
11 Complete the equivalent ratios:
12 Complete the ratio table for the ratio : 6
13 Complete the ratio table for the ratio
14 These are supposed to be tables of equivalent ratios. Find and explain the error in each.
15 A courier’s delivery charges are outlined in the following table:
a Find the cost per pound of sending a parcel that weighs:
b Is the cost of delivery proportional to the weight of the parcel?
c What would you expect the cost of delivering a 10 lb parcel to be?
16 The table shows the weekly income of a physiotherapist:
a How much does the physiotherapist charge each of her 25 patients?
b How much does the physiotherapist charge each of her 42 patients?
c Is her weekly income proportional to the number of patients she sees in those weeks?
d Complete the table.
17 A fruit punch recipe says that 5 cups of apple juice should be mixed with a of a cup of lemonade.
Complete the given table.
18 A recipe requires 3 cups of flour to make 24 cookies. How many cups of flour are needed to make 40 cookies?
19 A marathon is 42.195 kilometers long. If Paul runs at a constant speed and completes the marathon in 4 hours, how many kilometers does he run per hour? Round your answer to two decimal places.
20 A recipe calls for 2 liters of water, but the measuring cup only measures in cups. How many cups of water should be used to match the recipe if 1 liter is approximately 4.23 cups?
A 6.45 cups B 8.46 cups C 10.46 cups D 12.46 cups
21 To convert US dollars, USD ($), to Japanese yen, JPY (¥), we can use the ratio table:
1 2 3 4 5
a What is the exchange rate between US dollars and Japanese yen?
b Complete the ratio table.
c How many Japanese yen will you be able to buy for $20?
d Beth wants to buy a pair of jeans that costs ¥4272. What is this equivalent to in US dollars?
22 The cost of different amounts of pens is shown in the ratio table:
a Complete the ratio table.
b How many pens can Lea buy for $30?
c How much would her change be?
23 During a gym session, participants can either do full push-ups (on toes) or half push-ups (on knees). However since half push-ups are easier, those who choose this option will need to do more of them. The table shows how many full and half push-ups participants had to do:
a Find the number of full push-ups participants need to complete every 30 seconds.
b Is the number of full push-ups proportional to the number of seconds passed?
c Find the number of half push-ups the participants need to complete every 30 seconds.
d Is the number of half push-ups proportional to the number of seconds passed?
e For every full push-up, how many half push-ups need to be done?
f Is the number of half push-ups proportional to the number of full push-ups?
24 The 7th-grade class is planning a fundraiser by selling homemade lemonade. They decide to sell the lemonade in small cups (8 ounces each) and large cups (16 ounces each). The recipe they are using makes 1 gallon of lemonade at a time. To meet their goal, they need to prepare enough lemonade to fill at least 150 small cups and 100 large cups during the event.
a How many ounces are in 1 gallon?
b Calculate how many gallons of lemonade are needed to fill the 150 small cups and 100 large cups.
c How many batches of the recipe do they need to make to meet their goal?
25 A car rental company charges a daily rate plus a per-mile charge for renting a car. The daily rate is $20, and the company charges an additional $0.50 for every mile driven.
a Use the information provided to fill in the missing values in the ratio table below.
b Explain why the relationship between the total cost and the number of miles driven is not proportional.
26 A local bakery sells cupcakes in boxes. Each box contains 6 cupcakes and costs $9.
a Create a ratio table based on the information provided to show the cost for multiple boxes of cupcakes.
of Boxes
b Use your ratio table to predict the cost of 5 and 10 boxes of cupcakes.
After this lesson, you will be able to...
• write a proportion to represent a proportional relationship.
• solve a proportion to find a missing value.
• solve real-world problems using proportions.
A proportional relationship shows the relationship between two quantities; it compares how much there is of one thing compared to another. In other words, it is a collection of equivalent ratios.
We can use this relationship to help us write equations to solve problems. A proportion is an equality between 2 ratios, or an equation that states that two ratios are equal.
a, c represent same part or type
b, d represent same type, sum of parts, or whole
When writing a proportion, we need to make sure that both numerators represent the same thing and both denominators represent the same thing.
Not only can we write proportions from equivalent ratios, but we can also solve these equations to help answer questions and discover missing values.
Consider this ratio table that shows how far Jenny can run in miles per minute:
We can solve for the missing distance by using equivalent ratios:
Let d represent the missing value
Looking at the denominators, we must multiply 9 by 7 to get 63. To create an equivalent ratio, we need to multiply both the numerator and denominator by 7:
Creating an equivalent ratio
Therefore, the missing value in the table is 7, and Jenny can run 7 miles in 63 minutes.
A more efficient algebraic method is the Means Extremes Property. For the proportion a : b = c : d, the extremes are a and d while the means are b and c
A proportion can be solved by determining the product of the means and the product of the extremes. These products will be equal.
a : b = c : d ⟹ a d = b c
Example:
5 : 12 = 10 : 24
5 ⋅ 24 = 12 ⋅ 10
120 = 120
We can use the Means Extremes Property to express proportions in multiple ways: extremes extremes extremes extremes means means means means a : b = a : d a d = c b
We can solve the proportion in our previous example using the Means Extremes property as well.
Equivalent ratios
Applying the Means Extremes Property
Simplifying the multiplication
Divide each side by 9
This confirms that Jenny can run 7 miles in 63 minutes.
Write proportions that could be used to solve each problem. a Joey wants to buy 8 watermelon. He knows 3 watermelon cost $5. Write a proportion that we could solve to find Joey’s total price.
Create a strategy
We can use the equation , where numerators a, c represent the cost, and the denominators b, d represent the number of watermelons.
Apply the idea
Let x represent the cost that we do not know.
We can start with this equation
Substitute a = 5, b = 3, c = x, and d = 8
b Martin wants the ratio of black tiles to white tiles in their bathroom to be 5 : 7. They need 1200 total tiles. Write a proportion to figure out how many black tiles they need.
Create a strategy
We can use the equation , where the numerators a, c represent the black tiles, and the denominators b, d represent the total tiles.
Apply the idea
The ratio of “black tiles is to white tiles” is 5 : 7. So, the ratio of “black tiles is to total tiles” must be 5 : 12.
Let x represent the total number of black tiles that we do not know.
We can start with this equation
Substitute a = 5, b = 12, c = x, and d = 1 200
Consider the proportion:
a Create a ratio table with at least 4 entries to find the missing value in the proportion.
Create a strategy
Start by adding the ratios in the given proportion to the ratio table. Recall that every ratio in a ratio table is equivalent.
Apply the idea
x 5 7
y a 70
First, find the unit rate:
Set up the equivalent ratios
Looking at the denominators, we have to divide 7 by 7 to get 1. To create an equivalent fraction, we must also divide the numerator by 7.
Divide by 7
x 1 3 5 7
y 10 a 70
Notice we have found the unit rate which means every 1 unit increase in x will result in a 10 unit increase in y. We can multiply each x-value by 10 to complete our missing y-values.
x 1 3 5 7
y 10 30 50 70
We have shown that a = 50.
b Determine what x-value in this proportional relationship would have a y-value of 85.
Create a strategy
We will use the ratio table from part (a) to find the missing value.
Apply the idea
Let a represent the missing value.
Set up the proportion
Looking at the numerators, we have to multiply 10 by 8.5 to get 85 since 85 ÷ 10 = 8.5. To create an equivalent fraction, we must also multiply the denominator by 8.5.
Multiply by 8.5
Solve for a
x 1 3 5 7 8.5
y 10 30 50 70 85
The x-value is 8.5 when the y-value is 85.
Reflect and check
We could also solve for this value using the Means Extremes Property.
Set up the proportion
10 ⋅ a = 1 ⋅ 85 Use the Means Extremes Property
10 a = 85 Evaluate the multiplication a = 8.5 Dividing both sides by 10
Frank serves 2 cups of coffee every 5 minutes. Write and solve a proportion for the number of cups of coffee he serves in 1 hour.
Create a strategy
Set up the proportion and then use the Means Extremes property.
Apply the idea
It is important for our units across our proportion to match. We will write 1 hour as 60 minutes for this problem. Let x represent the missing value.
Set up the proportion
2 60 = 5 x Use the Means Extremes Property
120 = 5 ⋅ x Evaluate the multiplication
24 = x Dividing both sides by 5
Frank can serve 24 cups of coffee in 1 hour.
Proportions are equivalent ratios and can generally be written in the form:
We can use the Means Extremes Property to represent and solve proportions:
1 Fill in the blanks:
a A ⬚ is a comparison of two quantities by division. It can be expressed in various forms, such as “a to b,” “ a : b,” or as a fraction .
b A ⬚ is an equation stating that two ratios are equal. It shows that two ratios or fractions are equivalent.
c A ⬚ is a ratio that compares a quantity to one unit of another quantity. It is often used to describe how many units of the first type of quantity corresponds to one unit of the second type of quantity.
2 A classic lemonade recipe calls for mixing 4 cups of water with 2 cups of lemon juice to serve 6 people.
a Explain what equivalent ratios are.
b Calculate and list three sets of equivalent ratios based on the lemonade recipe provided, assuming the recipe is scaled up to serve: i 12 people ii 18 people iii 24 people
c Describe how you determined these equivalent ratios.
3 A school cafeteria serves fruit punch that is made by mixing 3 parts water to 2 parts fruit juice.
Which two of the following are also proportional mixture of water to fruit juice for making the same fruit punch?
A 6 parts water to 4 parts fruit juice
C 4 parts water to 3 parts fruit juice
B 5 parts water to 3 parts fruit juice
D 9 parts water to 6 parts fruit juice
4 Set up the word problems as proportions. Let x represent the missing value.
a Carlos can run miles in 3 minutes. How long will it take him to run 4 miles?
b Marie needs cups of flour for a batch of 24 cookies. How many cookies can she make with 12 cups of flour?
5 These pairs of quantities are in proportion. Find the missing value for each pair.
6 Solve for x
7 To make 3 cups of rice, Ben needs 5 cups of water. To make 15 cups of rice, he needs 25 cups of water. Write this as a proportion by filling in the blanks.
8 Mike’s dog eats cup of food in 2 days. Mike is leaving on vacation for 9 days. How much food does he need to leave for the dog? Write and solve a proportion to find the answer.
9 The ratio of males to females on a train is 7 : 4. If the train is carrying 429 passengers:
a Find the number of males on the train.
b Find the number of females on the train.
10 James and John share $77 in the ratio 5 : 2.
a What fraction of the total amount to be shared does John receive?
b Therefore, how much money must John receive?
11 Linda is planning to participate in a 5 km run. She wants to know how far this is in miles to gauge her training progress. Given that 1 kilometer is approximately equal to 0.621 371 miles, use proportional reasoning to convert 5 kilometers into miles.
12 Maria is preparing a homemade salad dressing that requires vinegar, oil, and mustard in a specific ratio to maintain its flavor. The recipe calls for 0.5 cups of vinegar for every 1.25 cups of oil and cup of mustard for every cup of vinegar. Maria wants to make a large batch of this dressing for a family gathering and plans to use 2.5 cups of oil.
a Calculate the amount of vinegar Maria will need for 2.5 cups of oil.
b Determine the amount of mustard needed once you’ve calculated the vinegar amount.
c Convert the total amount of dressing to milliliters, given that 1 cup equals approximately 237 milliliters.
13 Dave can wash 2 cars in 4 minutes.
a How long would it take for him to wash 1 car?
b How long would it take him to wash 23 cars?
14 A journalist spent a total of 24 hours researching, writing and editing a news report. She also spent 14 hours researching and 6 hours writing.
a How many hours did she spend editing the report?
b Find the ratio, in simplest form, in which her time was divided between researching, writing, and editing.
15 Dave and Luke bought a scratch ticket that cost $10. Dave contributed $8 and Luke’s contribution was $2. They won $30 000.
They decide to share their winnings in the same ratio as they contributed:
a How much should Dave receive of the prize?
b How much should Luke receive of the prize?
16 Eileen can wash 7 plates in 28 minutes and lace 11 boots in 55 minutes.
a How long does it take to wash 1 plate?
b How long does it take to lace 1 boot?
c How long would it take for Eileen to wash 13 plates and lace 19 boots?
17 Maria decides to participate in a charity walk. She walks part of the course at a speed of 3 miles per hour and then increases her pace to 5 kilometers per hour for the remainder.
Given that 1 mile is approximately equal to 1.609 34 kilometers, analyze Maria’s walking speeds in both miles per hour and kilometers per hour to determine:
a Convert Maria’s speed of 5 kilometers per hour into miles per hour. Round your answer to two decimal places.
b Compare Maria’s walking speeds before and after the pace increase.
c Discuss how the change in Maria’s pace affects her overall time to complete the charity walk if the total distance is 8 kilometers.
18 Jamie is planning a road trip from City A to City B. The distance between the two cities is 450 miles. Jamie’s car has a fuel efficiency of about 25 miles per gallon, and gas costs $3.50 per gallon at his local gas station. Jamie wants to calculate the total cost of gas for the trip.
a Calculate the total number of gallons of gas Jamie will need for the trip.
b Determine the total cost of gas for the trip.
c Evaluate the reasonableness of your solution. Consider factors such as the variability in gas prices, changes in fuel efficiency due to driving conditions, and any additional stops that might be required.
After this lesson, you will be able to...
• apply proportional reasoning to solve problems that involve converting units of measurement.
Proportions allow us to convert measurements with different units. We can use a conversion factor, which is written as a ratio in fraction form with equivalent measurements in the numerator and denominator. The first conversion values we may see are the metric system relationships:
= 1000 m
The conversion factors for the metric system are summarized in the conversion chart below:
In the United States, we will more regularly see relationships from the U.S. customary units:
mi = 1760 yards
If we want to convert 8 feet into inches, the conversion value is 1 ft = 12 in.
Multiply the given by the conversion factor
Notice that the unit of the given number is ft and the conversion factor has the unit ft in the denominator. This causes the ft to divide out leaving just the unit, in.
However, if we want to convert 96 inches into feet, the conversion value is the same, but we put the feet in the numerator.
Multiply the given by the conversion factor
Simplify the fraction by dividing and cancelling the units
We can also solve by setting up a proportion:
Setting up our proportion
Means Extremes Property
Simplify the multiplication
Divide by 12
Fortunately, we don’t have to memorize these conversions. As long as we are given the conversion factor, we can use what we know about proportions to convert between units of measurement.
To convert meters to inches, we can use the following table:
a Complete the table.
Create a strategy
Use the relationship 1 m = 39.4 in that was given in the table.
Apply the idea
We can use the conversion factor of to find other missing values in meters.
We can use the reciprocal of the conversion factor to find the missing values in inches.
Our completed table should look like this:
b Using the table, convert 13 meters to inches.
Create a strategy
Use the relationship 1 m = 39.4 in to set up a proportion.
Apply the idea
Ensure the units match in the numerators and the units match in the denominators.
Write a proportion
Means Extremes Property
Evaluate the multiplication
So, 13 meters is equivalent to 512.2 inches.
c Using the table, convert 709.2 inches to meters.
Create a strategy
Using the conversion factor from inches to meters, we calculate the equivalent amount in meters.
Reflect and check
We can also convert the units using a conversion factor. Since we are starting with units in meters, we want to make sure meters is in the denominator of the conversation factor so it will divide out and leave inches. We will use to find the missing values in inches.
Apply the idea
We can use the conversion factor of to find other missing values in meters.
So, 709.2 in is equal to 18 m.
To ride the scariest rollercoasters in an amusement park, Wynsleth needs to be over 160 cm tall.
If Wynsleth is 4 ft 11 in and 1 in = 2.54 cm, is she tall enough?
Create a strategy
First, convert the 4 feet and 11 inches to be measured in only inches. Then convert to centimeters and compare it to 160 cm.
Apply the idea
First, we will convert 4 ft to inches to convert the whole height to inches. We will use the conversion factor :
So, 4 ft 11 in is equivalent to 48 in + 11 in = 59 in. To convert from inches to centimeters, we will use the conversion factor :
Since Wynsleth’s height is 149.9 cm and the height of the rollercoaster is 160 cm tall, Wynsleth is not tall enough to ride the rollercoaster.
Reflect and check
Notice we did not need the precision of measurements to the tenths place with this problem. Oftentimes, we can use the context to determine the precision of our answer. In this problem, rounding to the nearest whole number would have been sufficient.
Conversion of units can be done by applying ratios and proportional relationships. If we know a relationship between the units, we can create a conversion factor equal to 1 where the units of the denominator match the given units in the problem.
We can also set up a proportion to convert between units.
1 State whether each unit is a measure of length, weight, or volume.
a Liter b Grams c Centimeters d Miles
2 The ratio of miles to kilometers is 1 : 1.6. How many kilometers are equal to 2 miles?
3 The ratio of ounces to grams is 1 : 28. How many grams are equal to 4 oz?
4 The ratio of kilograms to ounces is 1 : 35.3. How many ounces are equal to 10 kg?
5 The ratio of kilograms to pounds is 1 : 2.2. How many kilograms are equal to 20 kg?
6 To convert inches to centimeters, we can use the following table:
a Complete the table.
b Using the table, convert 11 in to centimeters.
c Using the table, convert 75 cm to inches.
7 Using the conversion 1 oz = 28 g, convert the following to ounces to two decimal places: a 60 g b 100 g c 45 g d 200 g
e f g 4.8 g h 28.3 g
8 Using the conversion 1 kg = 2.2 lbs, convert the following to two decimal places:
a 3000 lbs to kilograms b 3 kg to pounds c 14 lbs to kilograms d 5.5 kg to pounds
e lbs to kilograms f kg to pounds
9 Express each pair of quantities as a simplified ratio:
a 9000 meters to 8 kilometers
c 2 centuries to 409 years
e minute to 659 seconds
g 2.5 months to 2 years
g 18.7 lbs to kilograms h 11.5 kg to pounds
b $1 to 31c
d 31 minutes to 2 hours
f weeks to 1 year
h hours to 5 days
10 1 gal is approximately 3.8 L.
a Write liters to gallons as a ratio in simplest form.
b How many liters would a 10 gal vat hold?
11 1 ft is approximately 0.3 m.
a Write feet to meters as a ratio in simplest form.
b How many meters would a 100 ft garden be?
12 To ride the scariest roller coasters in an amusement park, you need to be over 130 cm tall.
a If 1 in = 2.5 cm, convert 130 cm to inches.
b Convert 130 cm to feet and inches.
13 5 mph is approximately 8 kph.
a Write miles per hour to kilometers per hour as a ratio.
b Sophia is traveling 16 kph. What is this speed in miles per hour?
14 1 lb is approximately 0.45 kg.
a Write pounds to kilograms as a ratio in simplest form.
b Paul wants to send a package that weighs 5 lbs. What is this weight in kilograms?
c It costs $2 per kilogram to send a package. Find the cost of sending Paul’s package.
15 The tallest hotel in the world is 390 m tall. Using the conversion 1 ft = 30 cm, find the height of the hotel in feet.
Let’s extend our thinking
16 Six people want to use a lift. They weigh 85 kg, 84 kg, 63 kg, 109 kg, 72 kg, and 88 kg. The lift has a sign saying it can carry up to 1000 lbs.
a If 1 kg = 2.2 lbs, calculate the combined weight of the six people in pounds.
b Is their combined weight over the recommended limit?
17 The world’s heaviest pumpkin was grown in America and weighs just over 2000 lbs. Using the conversion 1 kg = 2.2 lbs, convert the weight of the pumpkin in kilograms to one decimal place.
18 Jean-Paul is on holiday in England and he sees a road sign that says it is 120 mi to Nottingham. If 5 mi is approximately 8 km, how many kilometers is Jean-Paul from Nottingham?
19 Healthy eating is a good idea but on TV recently, a man tried and failed to eat a 74 oz steak.
a If 1 oz = 28.35 g, what was the exact weight of the steak in grams?
b Convert the answer from part (a) into kilograms to two decimal places.
c If, instead of eating a steak, the TV presenter had eaten apples that weighed about 100 g each, how many apples would he have had to eat instead?
20 NASA is planning a mission to send a probe to Mars. The distance from Earth to Mars varies throughout the year, but at the time of the mission’s planned launch, Mars is approximately 54.6 million kilometers (km) away from Earth. NASA’s communication team needs to prepare materials for the public and educational outreach, requiring the distance to be expressed in meters using scientific notation to ensure accuracy and consistency in various educational materials.
a Convert the distance from Earth to Mars from kilometers to meters, and express your answer in scientific notation.
b There are approximately 3.28 feet in one meter. Convert your answer in part (a) to feet in scientific notation.
We can represent this on a double number line to compare the benchmark percents with their whole number equivalents.
Books
We can see the 25% of 1200 lines up with 300 on our number line, and 10% of 1200 lines up with 120. We can add together those values to find 35%. So, 300 + 120 = 420 books in the library are fiction.
Sometimes we can’t use benchmark percents to easily find our desired percent. We can also solve percent problems using a proportion by creating two equivalent ratios:
Returning to our library example, if 23% of the books in the library are textbooks, let’s find the number of textbooks in the library. We could use the benchmark percents on our double number line to find 20% or 25% of the 1200 books. But if we want to find exactly 23%, we can set up a proportion where x represents the number of textbooks.
Set up proportion
Means Extremes Property
Evaluate the multiplication
Divide both sides by 100
We found that 276 of the books in the school library are textbooks.
Find 15% of 20.
Create a strategy
Find 10% and 5% and add them. We can create a double line to help.
Apply the idea
We can first create a number line with benchmark percents.
First, we know half of 100% is 50% and half of 20 is 10. So, we can add a mark halfway on both number lines and label them.
Next, we know 50% ÷ 5 is 10% and 10 ÷ 5 is 2.
Finally, we can find 5% of the total by cutting 10% in half. Half of 2 is 1, so we can add that to our double number line as well:
We can see 10% of 20 is 2, and 5% of 20 is 1. We can add these together to find 15% of 20. So, 15% of 20 is 1 + 2 = 3.
Reflect and check
We can also solve this problem using proportions. Let the unknown be x. In this problem, we know the percent and the whole or starting value.
Set up proportion
Substitute values
Means Extremes Property
Evaluate the multiplication
Divide both sides by 100
What percent of 60 is 3?
Create a strategy
Identify the given numbers and let the unknown be x
Translate the statement into a proportion.
Apply the idea
We can set up a proportion using two equivalent ratios. In this problem, we know the whole or starting value and the part we are interested in.
Setup proportion
Substitute values
Means Extremes Property
Evaluate the multiplication
Divide both sides by 60
We have found that 3 is 5% of 60.
60% of what number is 120?
Create a strategy
Identify the given numbers and let the unknown be x. Translate the statement into a proportion.
Apply the idea
We know the percent and part of the total. We want to find the whole or starting value.
Setup proportion
Substitute values
Means Extremes Property
Evaluate the multiplication
Divide both sides by 60
We found that 60% of 200 is 120.
Farrah’s bill for dinner is $45.20. She wants to leave a tip of approximately 20%. Explain how she could estimate the amount to tip quickly without a calculator.
Create a strategy
We can use benchmark percent to help us find the tip. We can find 10% and then double it.
Apply the idea
We know that 10% is the same as . Since we are approximating, we will find 10% of $45.00:
To find 20%, we need to double this:
$4.50 = $9.00
Farrah should leave a $9.00 tip on her meal if she wants to approximate 20% of the bill.
To represent percent problems, we can set up a proportion to find an equivalent ratio:
Benchmark percents and double number lines can help us solve and approximate percentages more efficiently.
1 In your own words:
a Describe what a percentage is.
b Explain how a percentage related to fractions and decimals.
c Explain how you can convert between percentages, fractions, and decimals.
2 Convert between percentages, fractions and decimals to complete the table: Fraction Decimal Percentage 0.11
3 Consider the following figures:
i Estimate the percentage of squares that are shaded.
ii What is the total number of squares?
iii How many squares are shaded?
iv What fraction of the total number of squares are shaded?
v What percent of the squares are shaded?
4
Translate the following percent statements to a proportion without solving or simplifying the proportion:
a 46 is 50% of 92.
c 21 out of 84 is 25%.
e 75% of 120 is 90.
g 567 out of 630 is 90%.
b 40% of 60 is 24.
d 56 out of 80 is 70%.
f 20% of 225 is 45.
h 3816 out of 4770 is 80%.
5 Answer the following questions in order to find 45% of 5 hours without a calculator:
a Find 10% of 5 hours.
c Find 40% of 5 hours based on your answer in a.
b Find 5% of 5 hours.
d Now, find 45% of 5 hours.
6 A salesperson earns a 13% commission on their total sales each week. In one week, their sales amounted to $640.
a Find 10% of their total sales.
b Find 3% of their total sales, correct to two decimal places.
c Now, find the total commission they made that week, correct to two decimal places.
7 A telephone marketer earns a 19% commission on their total sales each week. In one week, their sales amounted to $970.
a Estimate 19% of their total sales using a benchmark percentage
b Find 10% of their total sales.
c Find 9% of their total sales, correct to two decimal places.
d Now, find the total commission they made this week, correct to two decimal places.
8 On Monday, Derek had a full tank of 40 L gas. During the week, Derek used 55% of the gas.
a Estimate 55% of full tank of gas using benchmark percentage.
b Find 10% of 40 L.
c Find 5% of 40 L.
d Now, find how many liters of gas was used during the week.
9 Translate the following percent statements to a proportion without solving or simplifying the proportion:
a 60% of x is 144. b x% of 92 is 23. c 40% of 20 is x d 50% of x is 57.
e x% of 770 is 231. f 95% of 160 is x g x% of 180 is 63. h 45% of 920 is x
10 Solve for x:
a 50% of x is 140. b 14 is 50% of x. c 28 out of x is 35%. d x% of 400 is 64.
e 15% of x is 70. f 120 is 6% of x g 18 out of x is 50%. h x% of 440 is 198.
11 For each of these:
i Estimate and explain using a benchmark percentage.
ii Calculate the exact value.
a 51.3% of 240 b 59% of 440 kilometers c 5.2% of 80 kilograms
d 900% of 90 meters e 14% of 100 grams f 74% of 4600 kilometers
g 16% of 4590 kg h of 8500
12 Valentina has completed 25% of the necessary 70 hours of pilot training. Quentin has completed 27.5% hours of the necessary training.
Find how many more hours of training Quentin has completed than Valentina, rounding your answer to two decimal places.
13 Inflation between the years 2009 and 2010 was 1.7%, so that a purchase made in 2009 for $100 would be worth $101.70 in 2010. A product was valued at $3200 in 2009.
Find the value of the product in 2010.
14 Liam works 0.8 days for every day of the five-day work week.
a What percentage of the work week does Liam work?
b What percentage of the five-day week does Liam not work?
c What percentage of the whole 7-day week does he work? Express your answer as a percentage correct to one decimal place.
15 Your school’s science club is planning an eco-friendly project that involves planting trees in the community park and selling handmade recyclable crafts at a school fair to raise funds for the local animal shelter. The project is divided into two main activities: tree planting and craft sales. For the tree planting activity, the club aims to increase the current number of trees in the community park by 25%. The park currently has 800 trees.
In the craft sales activity, the club plans to sell 200 handmade recyclable crafts at the school fair. Based on past experience, they estimate that about 60% of all items will be sold by the end of the fair. However, to boost sales, halfway through the fair, they decide to reduce prices, which historically increases the percentage of items sold to 75%.
a Estimate the number of trees the club plans to plant to achieve their goal. Use a benchmark percentage to simplify your estimation, and explain your process.
b Initially, estimate how many crafts the club expects to sell. Then, estimate the new total of crafts sold after the price reduction. Explain your estimation process using benchmark percentages.
After this lesson, you will be able to...
• describe slope as the rate of change in a proportional relationship.
• describe the slope of a line as positive, negative, or zero from a graph.
• find the slope (rate of change) from a table of values, graph, or real-world situation.
• write an equation in the form y = mx.
Recall that a rate is a special type of ratio that is used to compare different types of quantities.
A unit rate describes how many units of the first quantity corresponds to one unit of the second quantity. Some common unit rates are distance per hour, cost per item, earnings per week, etc.
Interactive exploration
Explore online to answer the questions
mathspace.co
Use the interactive exploration in 2.05 to answer these questions.
1. What do you notice when m is negative? positive? zero?
2. How does changing m affect the equation and the graph?
When we are looking at unit rates in tables and graphs, we want to know how much the dependent variable ( y) will increase when the independent variable (x) is increased by one. The change in y for every change in x is called the slope of the line.
When x and y are related in a way where one is a constant multiple of the other, the two quantities are proportional Proportional relationships are also an example of direct variation. We can represent this type of relationship as an equation: y = m ⋅ x m slope
In a proportional relationship, the slope, also called the constant of proportionality, is the ratio of the y-values to the x-values . This means for proportional relationships the unit rate, slope, and constant of proportionality are all equivalent.
Consider the proportional equation:
y = 2 x
The slope is 2, and we can create a table of values for this proportional relationship:
x 1 0 1 2 3 4
y 2 0 2 4 6 8
Notice this is a ratio table with a unit rate of 2 since every ratio y : x is equivalent to 2.
Slope can be positive, negative or zero:
The table of values contains 6 ordered pairs: ( 1, 2), (0, 0), (1, 2), (2, 4), (3, 6), (4, 8)
We can plot these points on a coordinate plane.
Notice this relationship is proportional since it is linear and crosses the origin.
Slope (m) represents the rate of change in a linear function or the “steepness” of a line. The slope, m, can be calculated by looking at the slope triangles:
The slope triangle can be drawn between any two points on the line. Using the larger triangle, we have:
A proportional relationship with a negative slope y = 3x
A proportional relationship with a slope of zero y = 0 x = 0
As you move across a graph from left to right, a graph with a positive slope will increase, a graph with a negative slope will decrease, and a graph with a zero slope is a horizontal line.
Determine whether the line on each graph represents a positive slope, a negative slope, or a zero slope.
Create a strategy
As we move across the graph from left to right, determine whether the line is increasing, decreasing, or constant.
Apply the idea
As we move across the graph, we can see the line is decreasing, similar to walking down stairs. Therefore, the slope of this graph is negative.
Reflect and check
We can also check the direction of the slope by graphing a point on the far left and far right of our graph:
Since the point on the right is lower, the slope is negative. If the point on the right were to be higher, the slope would be positive.
Create a strategy
As we move across the graph from left to right, determine whether the line is increasing, decreasing, or constant.
Apply the idea
As we move across the graph, we can see the y-values are constant. Therefore, the slope of this graph is zero.
Create a strategy
As we move across the graph from left to right, determine whether the line is increasing, decreasing, or constant.
Apply the idea
As we move across the graph, we can see the line is increasing, similar to walking up stairs. Therefore, the slope of this graph is positive.
The graph shows the amount of time it takes Kate to make beaded bracelets.
a Find the slope of the line.
Create a strategy
For a 1 unit increase in x on the graph, find the increase of y
Apply the idea
Time (hours)
From the slope triangle, we see the change in y-values is 5 every time the change in x is 1.
To calculate slope, we know:
The slope is 5.
b Interpret the unit rate based on the slope of the line.
Create a strategy
The slope of the graph is the unit rate.
Apply the idea
The slope 5 based on the graph means that 5 bracelets are made for every hour.
The unit rate is 5 bracelets per hour. 1 2 3 4
Carl has kept a table of his reading habits which is shown below:
Number of weeks 12 24 36 48
Number of books read 20 40 60 80
a Determine the unit rate of the number of books Carl reads for every week, rounding the answer in one decimal place.
Create a strategy
Find the constant change in the y values for every change in the x values.
Based on the table, for every 12 weeks (say between 24 and 12 weeks), Carl reads 20 books (40 20).
The unit rate is books per week or 1.7 books per week.
b Write an equation that represents this situation.
Create a strategy
Recall that the equation of a proportional relationship is in the form: y = mx where m represents the slope.
Apply the idea
Notice we found the unit rate in part (a) to be
Using the equations y = mx, we have:
Since we found the decimal version of the unit rate to be 1.7, we could also write the equation as: y = 1.7x
We often leave slope as a fraction. It helps us make the connection to rates and ratios and also allows for easier graphing.
Jun needs to mix a batch of ‘flamingo pink’ paint to match his wall. ‘Flamingo pink’ is made by mixing 10 cans of white paint with 1 can of red paint.
a Find the unit rate.
Create a strategy
We know the unit rate is how much y changes for every 1 unit increase in x. We can also use the formula:
Let x represents the number of cans of red paint and y represents the number of white paint.
The unit rate, or slope, is 10, since 10 cans of white paint are required to combine with 1 can of red paint to produce ‘flamingo pink’.
b Write an equation for the situation.
In the equation y = mx, m is the slope of the line. The slope is the unit rate. Let x be the number of cans of red paint and y is the number of cans of white paint needed.
Since we found the unit rate in part (a) to be 10, we have the equation:
y = 10 x
Where x represents the number of cans of red paint and y represents the number of white paint.
A proportional relationship is represented by the equation:
y = mx where m is the slope
In a proportional relationship, the unit rate, slope, and constant of proportionality are all equivalent. They describe how many units of the first quantity corresponds to one unit of the second quantity.
On a graph, slope describes the steepness of a line, or how y changes and x changes:
1 Consider the line represented by the equation y = 2x. What does the coefficient of x tell us about the line?
A It represents the y-intercept of the line.
B It indicates the slope of the line, showing how for every increase of 1 unit in x, y increases by 2 units.
C It shows the maximum value of y the line can reach.
D It determines the curvature of the line on a graph.
2 Which of the following statements correctly describes the slope of a line in the context of its graph?
A A line with a positive slope rises from left to right. B A line with a negative slope is horizontal.
C A line with zero slope rises from right to left. D A line with a positive slope is vertical.
3 Do the following tables represent a proportional relationship? Why or why not?
a b
4 Match each table with its corresponding slope.
a i Negative slope
b ii Zero slope
c iii Positive slope
5 Match each term with its definition.
a Slope
b Rate of change
c Unit rate
d Proportional relationship
e Constant of proportionality
f Direct variation
g Positive slope
h Negative slope
i Zero slope
i The slope of a line that rises from left to right on a graph.
ii The slope of a line that falls from left to right on a graph.
iii The rate of change of a quantity relative to one unit of another quantity.
iv The slope of a horizontal line on a graph.
v The amount by which a quantity changes relative to another quantity.
vi A type of proportional relationship in which two variables increase or decrease at the same rate.
vii The change in the values of y for every change in the values of x
viii A relationship between two quantities in which the ratio of their values remains constant.
ix The factor by which one variable changes in relation to another variable in a proportional relationship.
6 Alice reads 25 pages of her book in 2 hours. State the unit rate at which Alice reads her book in pager per hour.
7 A tank is being filled with 250 L of water in 5 hours.
a State the compound unit that measures the rate of water flow.
b Find the unit rate at which the tank is being filled.
8 The following tables represent proportional relationship. Find the constant of proportionality.
a b
9 Determine whether each line has a positive, negative, or zero slope.
a b c d
10 Graph a line that matches the proportional relationship shown in the following tables: a
11 In Nico’s chocolate drink, the relationship between teaspoon of cocoa (t) and cups of milk (c) is shown on the graph.
a Find the slope of the line represented by the graph.
b Interpret the unit rate based on the slope of the graph.
12 The number of batches of cookies, y, that can be made in a bakery every hour, x, is shown in the graph:
a Find the slope of the line.
b Interpret the unit rate based on the slope of the line.
13 The graph shows the amount of time it takes Ellie to make beaded bracelets.
Find the unit rate of the graph shown.
14 The graph shows the number of liters of gas used by a fighter jet per second.
Find the unit rate of the graph shown.
15 A car travels at a constant speed, covering 50 miles in 1 hour.
a On the provided coordinate plane, plot the point that represents the situation (time = 1 hour, distance = 50 miles). Draw a line through this point and the origin (0, 0) to represent the car’s journey.
b From the graph you have drawn, determine the slope of the line.
16 William is making a fruit smoothie. The amount of bananas and strawberries he uses is shown in the proportion table:
Find the unit rate of the relationship.
17 Charlotte has kept a table of her reading habits which is shown:
Determine the unit rate of the number of books Charlotte reads for every week, rounding the answer in one decimal place.
18 Emmett is painting a fence and measuring the amount of paint used, as well as the area he covers, as shown:
Find the unit rate of paint used per square foot.
19 Zainab is jogging and keeping track of her distance and time in the proportion table:
Determine the unit rate of time per mile for Zainab’s jogging pace.
20 Djamila is filling water bottles and recording the amount of water and the number of bottles filled, as shown:
Find the unit rate of water filled per bottle.
21 You decide to run a lemonade stand for a school fundraiser. You charge $2 for each cup of lemonade sold. Write an equation in the form y = mx that represents the relationship between the total earnings ( y) from lemonade sales and the number of lemonade cups sold (x).
22 You’re participating in a community garden project and decide to sell plant seedlings. Each seedling is sold for $5. Write an equation in the form y = mx that represents the relationship between the total income ( y) from seedling sales and the number of seedlings sold (x).
23 You and your family decide to go on a road trip for your vacation. If your car consumes gasoline at a rate of 30 miles per gallon, write an equation in the form y = mx that represents the relationship between the total miles traveled ( y) on your trip and the number of gallons of gasoline consumed (x).
24 Heavy rainfall has resulted in flooding of some roads. The equation for the relationship between the water level x in inches and the number of hours t is represented by x = 1.5t
Based on the equation, what is the unit rate?
25 The number of cupcakes y eaten by the number of guests x at a party is represented by the equation y = 2x. What is the unit rate based on the slope of the equation?
26 The number of cans of white and red paint needed to make ‘flamingo pink’ is represented by the equation y = 10x where x is the number of cans of white paint and y is the number of cans of red paint needed.
Based on the equation, how many cans of red paint are needed for every white paint?
27 Lionel was given a task to determine the slope from a table that shows the total cost of apples depending on their weight. The table showed that 2 pounds of apples cost $4, 4 pounds cost $8, and so on. Lionel concluded that the slope, representing the rate of change, was 3, and wrote the equation as y = 3x, where y is the total cost and x is the weight in pounds.
Weight (lb) 2 4 6 8 10 12 Cost ($) 4 8 12 16 20 24
Review Lionel’s work. Identify and explain the error in determining the slope from the given table and in writing the equation that represents the direct variation relationship between the weight of the apples and their total cost.
28 The distance two swimmers have covered per minute is represented by the following graph:
a Just by observing the graph, who swims faster? Explain how you know.
b Explain how to get the speed of the swimmers.
c Find Nancy’s speed rounded to one decimal place.
d Find Ruby’s speed rounded to one decimal place.
Distance (miles)
Time (minutes) Nancy Ruby
29 Consider the equation y = 12x, which represents the total savings ( y) in dollars from your part-time job, where x represents the number of weeks you’ve been saving.
a Assuming you save a consistent amount each week. Graph this line on a coordinate plane.
b Describe what the slope of the line indicates in this context. 5 10 15 20 25 30 35 1 2 3 4 5 6
30 Marty is selling his ice cream in tubs. The relationship between the amount of ice cream in liters y and the number of tubs needed x is represented by the equation y =
a How much ice cream in liters is packed in each tub?
b If Marty has 50 liters of ice cream and there are 100 tubs available, does he have enough tubs to pack his ice cream? Explain.
31 You are planning a fundraising event for a local charity, selling handmade bracelets. Each bracelet sells for $15. The equation y = 15x represents your total earnings ( y) from selling x number of bracelets.
a Predict how much money you will raise if you sell 50 bracelets.
b Explain the significance of the slope in this context.
32 Consider a car with a full tank of gas. As you use the car for your daily commutes, the amount of gas in the tank decreases over time. If you plot a graph showing the amount of gas over time, without refilling, what would you notice about the slope of the graph?
33 Imagine a scenario where you deposit money into a savings account that unfortunately does not offer any interest. Over time, the total amount of money in your account remains the same, regardless of how many months pass. Discuss what this situation implies about the slope of the graph that represents the total amount in your savings account over time.
34 A diver is 5 m below the surface of the water. He descends 3 m/s for 6 seconds, then rises 2 m/s for 8 seconds. The level at the surface is 0 meters, and 1 meter below is represented by 1 meter.
a Find the depth of the diver after 14 seconds.
b The diver sees a turtle near the surface and needs to get to a depth of 2 m below the surface within 4 seconds to snap the perfect shot. How many meters does he need to rise each second, assuming he will rise at a constant speed?
After this lesson, you will be able to...
• graph a proportional relationship using an ordered pair and slope.
• graph a proportional relationship from an equation.
• given one form of a proportional relationship, create another (table, equation, graph, real-world situation).
Recall that a table of values shows the relationship between two quantities (usually represented by x and y).
Let’s construct our own table of values using the proportional equation:
y = 3x
The table of values for this equation connects the y-value that we get from substituting in a variety of x-values.
Let’s complete the table of values below: x 2 1 0 1 2 3 4 y
To substitute x = 1 into the equation y = 3x, we want to replace the variable x with the number 1. So, for x = 1, we get:
y = 3 ⋅ 1
y = 3
Substitute x = 1
Evaluate
So, we know that 3 is the y-value corresponding to x = 1.
3
If we substitute the remaining values of x, we can complete the table.
y
Each column in a table of values may be grouped together in the form (x, y). We call this pairing an ordered pair
The table has the following ordered pairs:
( 1, 3), (0, 0), (1, 3), (2, 6), (3, 9), (4, 12)
We can plot each ordered pair as a point on the coordinate plane.
Notice that our graph is linear and goes through the origin which confirms it is proportional.
Now that we have drawn the ordered pairs from the table of values, we can draw the graph that passes through these points.
The slope of this line is 3, and this is the graph of y = 3x which we used to complete the table of values.
We can also graph proportional relationships using the slope and a point on the line.
Start by plotting a single point. If the relationship is proportional, we can start at the origin.
We can create a slope triangle from our starting point by using the slope:
Starting at (0, 0) we move up 3 units and to the right 1 unit before placing another point.
We can repeat this process to get more points.
To find points to the left, we can reverse both directions and go down 3 units from the origin and to the left 1 unit.
This works because = 3 which is the slope.
Now, we can draw a line connecting the points. Notice it is exactly the same line as we graphed using the table.
The slope triangle approach works for various slopes:
Slope = 4 = : Move 4 units down and 1 unit right
Slope = : Move 1 unit up and 2 units right
Notice, in these examples, we let the change in x (denominator) be positive. Remember, we can find points in the opposite direction by changing the sign in both the numerator and denominator.
Consider the equation y =
a Complete the table of values:
x 7 4 3 0 y
Create a strategy
Substitute each value from the tables into the given equation.
Apply the idea
For x = 7:
Substitute x = 7
Evaluate the adjacent signs
Evaluate
Similarly, if we substitute the other values of x, ( x = 4, x = 3, x = 0 ), into y = , we get:
x 7 4 3 0
y 1 0
b Draw the graph of y =
Create a strategy
Use the plotted points on the coordinate plane from part (a).
Apply the idea
The equation y = must pass through each of the plotted points.
Reflect and check
We could also graph this relationship using slope triangles.
The equation y = is equivalent to y =
The slope of the equation is .
So, the change in y is 1 which means the slope triangle will go down 1. Our change in x is +7 which means our slope triangle will go right 7.
Continue to add points in this way and connect them to form a line.
Consider the equation y = 4x a Graph the equation on a coordinate plane.
Create a strategy
Let’s use slope triangles to graph the line. We will need to find the change in y and change in x
Apply the idea
Remember equations for proportional relationships are in the form y = mx where m is the slope. From the equation y = 4x, we know the slope is 4.
Start by plotting a point at the origin.
From there, move up 4 units and to the right 1 unit.
This triangle will end on point (1, 4). We can repeat this process for multiple points.
Reflect and check
We could also graph by creating a table of values: x 2 1 0 1
The points from the table have the coordinates ( 2, 8), ( 1, 4), (0, 0), (1, 4).
Even if we graphed different points, both graphs represent the same line.
b Is the graph of y = 4x linear?
Create a strategy
Check the graph from part (a) to see if it makes a straight line.
Apply the idea
Since the line formed is a straight line, the relationship linear.
Plot the graph of the line whose slope is 3 and passes through the point ( 2, 6).
Create a strategy
Use the slope to find another point on the line and then graph it.
Apply the idea
The slope 3 means the y-coordinate will decrease by 3 units if we increase the x-coordinate by 1. Decreasing the y-coordinate by 3 units and then decreasing the x-coordinate by 1 unit, then the new point is ( 1, 3).
Plotting the line whose slope is 3 and passes through the points ( 2, 6) and ( 1, 3), we have
2, 6)
3)
Reflect and check
We can also create a table of values from the slope and point. Start by adding the point ( 2, 6) to the table:
x 2
y 6
The slope of 3 tell us every 1 unit change in x results in a 3 unit change in y. We can use this pattern to create a table of equivalent ratios. The ratio y : x is 3 : 1. So, as the x-values are increasing by 1, while the y-values are decreasing by 3. This gives the table:
x 2 1 0 1 2
y 6 3 0 3 6
To graph proportional relationships using table of values:
1. Complete the table of values by substituting each given x-value into the equation.
2. Set the x and y-values as ordered pairs (x, y) to plot on the graph.
3. Connect the points with a line.
To graph proportional relationships using the slope of a line and a point:
1. Plot any point on the line. You can use the origin since it is proportional.
2. Find the second point by using a slope triangle. The change in y tells you how far to go up or down. The change in x tells you how far to go right.
3. Connect the two points through a line.
1 Match each term to its correct definition.
a Proportional Relationship
b Slope
c Rate of Change
d Ratio
e Linear Equation
A A mathematical statement that equates two expressions and forms a straight line when graphed.
B The measure of the steepness or incline of a line, often calculated as the change in the vertical direction divided by the change in the horizontal direction.
C A relationship between two quantities where the ratio of one quantity to the other remains constant.
D A comparison of two quantities by division, showing how many times one value contains or is contained within the other.
E The speed at which one quantity changes in relation to another quantity over time or space.
2 For each table of values:
i Plot the points on a coordinate plane. ii Is the graph of equation proportional?
a y = x
y = 4x c y =
3 For each linear equation:
i Complete the table of values.
a y = 4x
ii Sketch the graph of the line.
2x c y = x
4 What are the two characteristics every graph of a proportional relationship must have?
5 Consider the graph of a linear equation. Use the graph to answer the following questions:
a What is the slope of the line represented on the graph?
b Identify an ordered pair (x, y) that lies on the line.
6 A car travels 150 miles in 3 hours. What is the unit rate of the car’s speed in miles per hour (mph)?
7 Find the slope of the line that passes through the points (3, 10), and (6, 40).
8 Consider the equation y = 4x.
a Complete the table of values.
b Use the two points where x = 1 and x = 1 to sketch the graph of the line.
c Does the point (0, 0) lie on this line?
Let’s practice
9 Graph these lines:
a The line with slope 3 that passes through the point ( 1, 3).
b The line with slope 1 that passes through the point (0, 0).
c The line with slope that passes through the point (20, 15).
d The line with slope of that passes through the point (1.5, 0.5).
e The line with slope of 2.5 and passes through the point (5, 12.5).
f The line with slope of 0.75 that passes through the point (4, 3).
10 For each equation and table of values:
i Find one point on the line.
ii Graph the line using that point and the slope from the equation.
a y = 4x b y = c y = 3x d y =
11 Paul paints 15 plates every 6 hours.
a Complete this proportion table:
Plates painted 0 15 30 60 Hours worked 6 12 18
b Sketch the graph of this proportional relationship.
c How does graph and the table connect to Paul painting plates?
12 A tutoring service charges a fixed hourly rate of $25 per hour for tutoring sessions. The total cost of the tutoring sessions can be represented by a linear equation without a flat fee, making it directly proportional to the number of hours tutored.
a Write a linear equation in the form of y = mx that represents the total cost ( y) of tutoring as a function of the number of hours (x) of tutoring received.
b Graph this linear equation.
c How does the slope from the equation and the graph relate to the context of the problem?
13 A cyclist maintains a constant speed of 12 kilometers per hour.
a Write a linear equation in the form y = mx that represents the total distance traveled ( y) as a function of the time (x) in hours.
b Graph this linear equation.
c How does the slope from the equation and the graph relate to the context of the problem?
14 Consider a situation where a scientist is studying the growth of a plant species over time. The scientist collects data on the height of the plants at different times and represents this information in a table, a graph, and an algebraic equation.
Discuss the advantages and limitations of each representation method (table, graph, equation) for analyzing the growth pattern of the plants. In your discussion, consider aspects such as ease of identifying trends, precision of data representation, and the ability to predict future growth.
15 William is making a fruit smoothie. The amount of bananas and strawberries he uses is shown in this proportion table:
a Sketch the graph of the proportional relationship.
b Write a statement that describes the proportional relationship.
16 Consider the proportional relationship shown between hours spent fishing and the number of fish caught displayed in the table shown:
a Sketch the graph of the proportional relationship.
b Write a statement that describes the proportional relationship.
17 A local reservoir collects rainwater for use in a small community. During a particularly dry season, the reservoir’s water level decreases each day due to evaporation and community use, without any significant rainfall to replenish it.
Explain what the slope of the graph indicates about the relationship between time and the water level in the reservoir.
18 A small business offers a service package to its clients, charging a fixed hourly rate for each hour of service provided. The total cost ( y) of using the service for x hours is described by the linear equation y = 50x, where x is the number of service hours, and y is the total cost in dollars.
a Create a graph that represents the total cost as a function of the number of service hours.
b Using your graph or the equation, calculate the total cost for 4 and 8 hours of service.
c Discuss the relationship between the number of service hours and the total cost.
Each of the representations has strengths and limitations.
For example, a table of values gives a snapshot of the tree’s height at certain moments in time, but creating a large table that includes every time we’re interested in could take a very long time. It is also difficult to see overall trends like how quickly the height of the tree is changing.
The context helps make connections with the real-world application, but it can be difficult to make predictions for the pattern.
Graphs are easy to extend beyond the data we have and the slope of the graph shows us visually how quickly the height of the tree is changing.
Finally, equations help us predict future values but make it difficult to visualize what is happening. It is important to be able to navigate between representations so we can create the best one to help us solve a given problem.
The table shows how the number of hours a group of volunteers spend on a tree planting project is related to the number of trees they plant. Hours
a Write an equation that represents this relationship.
Create a strategy
We can find the slope by finding the change in the y-values (number of trees) in the table and dividing that by the change in the x-values (hours). Then write the equation in the form y = mx, where m is the slope.
Apply the idea
The change between each coordinate pair is 1 hour and 20 trees. We can use the formula to calculate slope:
Equations are helpful if we want to calculate very large values, like how many trees they can plant in 120 hours. Creating tables or graphs that include very large values can take a lot of time.
This means that the group plants 20 trees per hour. The equation that represents this relationship is y = 20x, where y is the number of trees and x is the number of hours.
b Represent this relationship on a graph.
Create a strategy
Since we already have a table, we will graph each as a coordinate pair where the x-value is the number of hours and the y-value is the number of trees.
Apply the idea
From the table, we get the points: (1, 20), (2, 40), (3, 60), (4, 80), and (5, 100).
Being able to create graphs is useful because we can easily see values that fall in between the ones that were in the table. For example, we can see that volunteers can plant 30 trees in 1.5 hours.
c At this rate, how long will it take them to plant 175 trees?
Create a strategy
The most efficient representation for answering this question is the equation because we can simply substitute 175 for y and solve for x to find the number of hours.
Apply the idea
In part (a), we wrote the equation y = 20x, where y is the number of trees and x is the number of hours. 175 = 20 x Substitute y = 175
8.75 = x Divide both sides by 20 It would take them approximately 8.75 hours to plant 175 trees.
It costs $9 a month for a music streaming service.
Create a table, graph, and equation that represent this situation.
Create a strategy
We can create our representations in any order. Let x be the number of months subscribed to the service and let y be the total cost.
Apply the idea
First, we can create a table. Let x be the number of months and y be the cost of the streaming service. We can start with x = 0 and y = 0 because 0 months of the service costs $0. For every additional month, the total cost increases by $9.
x 0 1 2 3 4 5 6
y 0 9 18 27 36 45 54
Since the cost increase by $9 every month, the slope is 9. We can use this to create and equation: y = 9x
Finally, we can use the slope triangle approach or the table to create a graph:
Understanding the connections between tables, equations, and graphs is important when working with proportional relationships.
Each of these representations offers unique insights.
• Graphs can be useful for looking at data between values in a table or visualizing the overall change in a situation.
• Equations are helpful to predict very large values.
• Tables are great for seeing a snapshot of the situation at a specific point.
1 The ordered pairs (2, 1) and (4, 2) represent a proportional relationship. Write an equation for this relationship.
2 Given the equation y = 3x, list three ordered pairs that would be on the graph of this proportional relationship.
3 What is the rate of change of the following relationships?
a The graph of a line that passes through b 2x 5y = 0 the points (5, 15) and (10, 30). c
4 John drives his car at a constant speed. After 2 hours, he has traveled 100 miles. Complete the table to represent this proportional relationship.
5 Determine if each of the following represents a proportional relationship.
a The equation, C = 25t represents the total cost, C, for t tickets to a concert, where each ticket costs $25.
b The height of a plant has been tracked over several weeks. After 5 weeks, the plant was 12 inches tall. After 7 weeks, the plant was 14 inches tall. After 8 weeks, the plant was 16 inches tall.
c The graph displays the distance a car traveled over time.
d The table represents the relationship between the temperature (in degrees Fahrenheit) and the number of cricket chirps in a minute. Temperature (°F ) Cricket Chirps/Minute
e The table below shows the number of cups of sugar needed for various batches of cookies.
Let’s practice
6 Which of these have the greatest slope?
7 Match each equation to its table and graph. Column A
8 A printer can print 15 pages in 5 minutes.
a Find the slope of this proportional relationship.
b Write an equation to show the proportional relationship.
9 Maria is saving money to buy a new bike. She saves $20 every week.
Weeks (x) 1 2 3 4 5
Amount Saved (y) 20 ⬚ ⬚ ⬚ ⬚
a Complete the table.
b Draw a graph to represent this proportional relationship.
10 The table represents the number of miles, y, that a car can travel in x hours at a constant speed.
Hours (x) 1 2 ⬚ 4 5
Miles ( y) 50 ⬚ 150 200 ⬚
Use the table to find the missing values and write an equation that represents this proportional relationship.
11 A recipe calls for 3 cups of flour to make 24 muffins. Use proportional reasoning to find and correct the error in the table.
12 The number of batches of cookies, y, that can be made in a bakery every hour, x, is shown in the graph:
a Create a table of values to represent the graph.
b Explain how finding the rate of change from the table and the graph are related.
c Write the equation of the proportional relationship.
13
In a science class, students conducted an experiment to measure the growth of a plant over time. A graph was provided showing the height of the plant in centimeters as a function of time in weeks.
The students concluded that the rate of growth was 4 cm per week and could be represented by the equation y = 4x where y was the plant’s height in centimeters, and x was the time in weeks.
Explain the students’ mistake when writing the equation.
14 This graph represents the total cost of buying apples where each apple costs $2.
a Identify two points on the graph and explain why these points are proportional.
b What is the slope of this relationship?
c Between the verbal description or the graph, which representation is best for identifying the rate of change? Explain your reasoning.
Number of apples
15 The table shows the distance a car travels over time at a constant speed.
Time (hours) 1 2 3 4
Distance (miles) 60 120 180 240
a Determine the slope of this proportional relationship.
b Write an equation to represent this proportional relationship.
c Graph this relationship.
d To determine the distance a car traveled over a period of 6 hours, which representation would you choose and why?
16 The graph of y = 20x represents a proportional relationship between the number of weeks, x, and the amount of money saved, y Would you use the equation or the graph to determine how much money will be saved after 7 weeks? Explain your answer.
17 The table represents the cost, y, of buying x tickets to a concert. Each ticket costs the same amount.
a Draw a graph that represents this proportional relationship.
b Which representation would you use to find the cost of more tickets? Explain.
18 A fruit stand sells apples for $2 each.
a Create a table to represent the total cost for buying 1 to 5 apples.
b Write an equation to represent this proportional relationship.
c Graph the line representing the proportional relationship.
d Explain the benefits of using a table, graph, and equation to represent this proportional relationship.
19 You are planning a fundraising event for a local community center. The cost to participate in the event is proportional to the number of people attending. You estimate a cost of $65 for 8 people to attend.
Choose a method (table, graph, or equation) to represent this proportional relationship and plan the budget for your event. Explain why you chose this method and how it helps in understanding or presenting the relationship effectively.
20 Explain the connections you can make between the given table, the given graph, and the equation y = 3x.
21 Lily is planning a road trip. She knows that her car uses 1 gallon of gas for every 25 miles she drives. Lily wants to drive 300 miles. Predict how many gallons of gas Lily will need for her trip. Justify your prediction by setting up a proportion and creating a graph.
22 A recipe calls for 3 cups of flour to make 12 cookies.
a Complete the table to show the proportional relationship of the cups of flour ( f ) to the number of cookies (c).
Cups of Flour ( f ) Number of Cookies (c) 3 4
b Create an equation to match this scenario.
c If you are looking to use this recipe for a bake sale and want to make 300 cookies, how many cups of flour would you need?
23 A car travels at a constant speed, covering 110 miles in 2 hours.
a Write an equation that represents the scenario.
b Create a graph that represents this scenario.
c How many miles will the car travel in 3.5 hours? Write this value as a coordinate point.
24 A printer can print 20 pages in 5 minutes.
a If the printer continues to work at the same rate, how many pages can it print in 15 minutes? Explain the method you used to solve the problem.
b Explain the benefits of using a table, graph, and equation to solve this problem and understand the proportional relationship.
25 Given the equation y = 6x:
a Create a scenario that aligns with the equation y = 6x
b Complete the table below to align with the equation.
c Describe what x and y represent in your scenario.
1 2 3 4 y
Big ideas
• Changing the form of an expression or equation can reveal information that was previously unknown.
• The properties of real numbers can be applied to many types of expressions.
• Expressions are the building blocks of algebra. They can be used to represent and interpret real-world situations.

After this lesson, you will be able to...
• apply the order of operations to simplify numerical expressions with integers.
When we work with integers, we can perform the same four operations that we use with whole numbers: addition, subtraction, multiplication, and division.
The main difference when working with integers is that we have to take into account the signs of the numbers.
To simplify expressions with mixed operations, we need to follow the order of operations:
1. Evaluate operations inside grouping symbols.
• Grouping symbols may include parentheses ( ), brackets [ ], absolute value bars ∣ ∣, square root symbols , and fraction bars .
2. Evaluate any exponents.
3. Evaluate any multiplication or division, reading from left to right.
• When multiplying and dividing, if one of your numbers is negative and the other is positive, your answer will be negative.
• When multiplying and dividing, if both numbers have the same sign, your answer will be positive.
4. Evaluate any addition or subtraction, reading from left to right.
• If you have adjacent positive (plus) and negative (minus) signs, this will become a minus sign.
• If you have two adjacent negative (minus) signs, this will become an addition sign.
• When adding two numbers with different signs, we can use the number line to illustrate the process.
5. Consider and check the sign of the final answer, especially if negative values were involved in the calculation.
Evaluate 5 + 12 ÷ 22
Create a strategy
Evaluate the exponent, then the division, and finally the addition.
Apply the idea
5 + 12 ÷ 22 = 5 + 12 ÷ 4
Evaluate the exponent = 5 + 3
Evaluate the addition
Evaluate the division = 2
Evaluate ([36 (10 + 10)] ÷ 2) + 14 ⋅ 6
Create a strategy
We first need to evaluate inside the grouping symbols. Notice there are several layers. We will start inside the innermost parentheses, then the brackets, then the outer parentheses. Once the grouping symbols are gone, we can evaluate the multiplication and the addition.
Apply the idea
([36 (10 + 10)] ÷ 2) + 14 6 = ([36 20] ÷ 2) + 14 6
= (16 ÷ 2) + 14 6
= 8 + 14 6
= 8 + 84
= 92
Evaluate + 12 ÷ 3 (2 + 1)
Create a strategy
Evaluate the innermost parentheses
Evaluate the subtraction in the brackets
Evaluate the division in the parentheses
Evaluate the multiplication
Evaluate the addition
We first need to evaluate the operations inside the grouping symbols. In this expression, the groupings symbols are the parentheses and the square root. Next is the division, then multiplication, and lastly the addition.
Apply the idea + 12 ÷ 3 (2 + 1) = + 12 ÷ 3 3
= + 12 ÷ 3 3
= 7 + 12 ÷ 3 ⋅ 3
= 7 + 4 3
= 7 + 12
= 19
Evaluate [6 (3 + 1)]2
Create a strategy
Evaluate the addition in parentheses
Evaluate subtraction under the square root
Evaluate the square root
Evaluate the division
Evaluate the multiplication
Evaluate the addition
We first need to evaluate the addition inside the parentheses, then evaluate the subtraction inside the bracket, and finally evaluate the exponent.
Apply the idea
[6 (3 + 1)]2 = [6 4]2
= [2]2
= 4
Evaluate the addition
Evaluate the subtraction
Evaluate the exponent
Evaluate
Create a strategy
Evaluate the exponents first, then evaluate the subtraction, and finally evaluate the division.
Apply the idea
Evaluate the exponents
Evaluate the subtraction
Evaluate the division
Evaluate
Create a strategy
We first evaluate the subtraction inside the absolute value bars, then evaluate the absolute value, followed by multiplication, then finally the subtraction.
Apply the idea
= 15 3 3
= 15 9
= 6
The order of operations is:
Evaluate the subtraction in the absolute value
Evaluate the absolute value
Evaluate the multiplication
Evaluate the subtraction
1. Evaluate operations inside grouping symbols.
• Grouping symbols may include parentheses ( ), brackets [ ], absolute value bars ∣ ∣, square root symbols , and fraction bars
2. Evaluate any exponents.
3. Evaluate any multiplication or division, reading from left to right.
4. Evaluate any addition or subtraction, reading from left to right.
5. Consider and check the sign of the final answer, especially if negative values were involved in the calculation.
If the problem has parentheses inside another set of parentheses, simplify the inside parentheses first.
1 Write the term that corresponds to each given definition.
a The set of numbers comprising all the natural numbers (1, 2, 3, …) and zero (0).
b A mathematical term representing a number that can be positive, negative, or zero, without any fractional or decimal parts.
c Mathematical operation involving finding the sum of two or more numbers.
d Mathematical operation involving finding the difference between two numbers.
e Mathematical operation involving finding the product of two or more numbers.
f Mathematical operation involving finding the quotient of two numbers.
g Symbol used to indicate grouping in an expression. It is shown with this symbol: ( ).
h Symbol used to indicate grouping in an expression. It is shown with this symbol: [ ].
i A mathematical notation represented by “∣” that denotes the distance of a number from zero on the number line, without considering its sign.
2 Find the value of each expression: a 7 + 4
e 74
3 Identify all the grouping symbols in the expression 3 (4 + 5) [6 ∣7 8∣]. Select all that apply: A ( ) B [ ] C
4 Which numbers from 1 to 20 are perfect squares?
5 Determine whether each statement is true or false:
a When evaluating an expression with mixed operations, you should always perform addition and subtraction before multiplication and division.
b If an expression contains only multiplication and division operations, you should evaluate them from left to right.
c Two integers can be added in any order but not subtracted.
d Two integers can be multiplied in any order and also divided in any order.
e The expression 2 (3 + 4) 5 is equivalent to (2 3) + (2 4) 5, due to the distributive property.
6 Which expression is equivalent to 5 3 + ( 2)?
A 5 + ( 3) + ( 2) B 5 3 2 C 5 + 3 2
7 Which expression is not equivalent to (4 2) + 3?
A 8 + 3 B 3 8 C (4 2) + 3
8 Which expression is equal to 3 (2 + 5)?
A 3 2 5 B 3 + 2 + 5 C 3 2 5
9 List the operations in the correct order for the expression 5 2 ⋅ 3 + 1.
10 Evaluate:
a 3 + 5 7
c 3 6 ( 4) + 4
e 2 + ( 7) [( 8) ÷ 2]
g ( 42 + 6) ÷ (11 5) ÷ ( 2 ⋅ 3)
11 Fill in the blank:
b 6 ( 3) + 7
d 36 ÷ ( 3 1) ÷ 3 + ( 6)
f ( 39 + 9) ÷ ( 5) 2 + 5
h ( 5 + 9) 15 ÷ [40 ÷ ( 8)]
2 + ⬚ ⋅ 5 = 18
12 Evaluate, showing all steps and state the operation performed at each step.
a 5 + 4 + 3
c 7 + 8 ⋅ ( 7) 8
e 4 + ( 12) ÷ ( 2 4)
13 For the following expressions:
i List the order the operations should be performed in.
ii Evaluate
b 2 1 4
d ( 4 + 2) 7 ⋅ 6
f [ 6 ÷ (9 7)] + 8
a 9 ⋅ 7 + 28 ÷ 4 6 b (21 6) ÷ [3 + ( 9) ⋅ 2]
c 48 ÷ ( 6) + ( 4 5) 3 d 4 14 ÷ ( 5 + 3) + 7
e 7 + 63 ÷ ( 7) ( 8 2) f ( 54) ÷ ( 4 3 2 + 8)
14 For the following expressions:
i List the order the operations should be performed in.
ii Evaluate
a (23) + (24 ÷ 4)2 b 5 + 12 ÷ 22
c (23 10 ÷ 21)2 d ( (62) 6) ÷ (3)3
e 24 ÷ ( 8) 64 f ( 132 23) ÷ 43 ( 7) g [72 ÷ (42 7)]3 ÷ 32 h [53 12 ÷ (32 + 3)]
15 Evaluate:
i List the order the operations should be performed in.
ii Evaluate
a 35 + ∣42 42∣ b ∣ 84 (62 + 42) ∣
c 23 ∣17 (82 + 52) ∣ d ∣ 4 (42 + 52 + 3) ∣ 22
e ∣78 ÷ ( 3) + 11∣ (52 4) f ∣ 85 + 58∣ ÷ 32 (32 3)
16 For the following expressions:
i List the order the operations should be performed in.
ii Evaluate a b c d e f
17 Evaluate: a b
18 Explain why the statement is incorrect, and find the correct answer: 6 ( 60) ÷ ( 3) = 22
19 Are the results of ( 5 + 3) ⋅ ( 4) and 5 ⋅ ( 4) + 3 ⋅ ( 4) the same? Why?
20 An expression involving mixed operations with integers is shown, along with a series of working steps to solve the expression. However, a mistake was made during the working steps. Identify where the mistake occurred and correct the mistake.
Expression: ( 3) + 10 2 ( 5)
21 Evaluate:
22 Evaluate
23 Explain why the two expressions below simplify to different values.
• 8 (3 + 5) 4 ÷ 2
• 8 3 + 5 4 ÷ 2
24 Explain why the two expressions below simplify to different values.
• 32 312 ⋅ 12
• ( 3)2 312 12
25 During a math competition, the participants were given this expression to evaluate:
2
a The judges received several different answers from the participants, including 1, 21, and 29. Which one of these is the correct answer?
b Using only parentheses, change the expression in two ways so that the other two answers would be correct.
26 Three people on a farm are given five minutes to pick as many apricots as they can. They get to keep all the ripe apricots they pick, as well as an equal split of 30 ripe apricots between the three of them (which were picked earlier in the day).
If Justin (one of the three people) picks 33 apricots, 15 of which are unripe, how many apricots will Justin get to keep in total?
27 Each week Lisa gets paid an allowance based on her age and how many chores she did that week. The allowance consists of her age, $2 for every chore she completes in a week, and is decreased by $4 for each chore she forgets to complete.
If Lisa is 11 years old, completes 4 chores in a week, but forgets to complete a chore, how much will her allowance be that week?
28 a The temperature in Paris is 13 degrees Celsius less than double the temperature in London. If it is 8 °C in London then what is the temperature in Paris?
b The temperature in Sydney is 21 degrees Celsius more than triple the temperature in New York. If it is 4 °C in New York then what is the temperature in Sydney?
29 At the start of the week, Quiana had $131 in her bank account. On Monday, she withdrew $43. On Wednesday, she deposited $11, and on Thursday, she deposited three times as much as she deposited on Wednesday. Finally, she withdrew $25 on Friday.
Find Quiana’s final bank balance at the end of the week.
30 Starting from his house, Jerry walked 1 m/s due south for 30 minutes, then 2 m/s due north for 15 minutes and then, due south again 2 m/s for 45 minutes. Find Jerry’s final distance from his house.
After this lesson, you will be able to...
• simplify expressions with real numbers using both the order of operations and the properties of real numbers.
Recall the order of operations:
1. Evaluate operations inside grouping symbols.
• Grouping symbols may include parentheses ( ), brackets [ ], absolute value bars ∣ ∣, square root symbols , and fraction bars
2. Evaluate any exponents.
3. Evaluate any multiplication or division, reading from left to right.
4. Evaluate any addition or subtraction, reading from left to right.
5. Consider and check the sign of the final answer, especially if negative values were involved in the calculation.
The order of operations we used for integers extends to all rational numbers. Here are some of the properties of real numbers that we may need to use while simplifying expressions with the order of operations:
Property
Commutative property of addition a + b = b + a
Commutative property of multiplication
Associative property of addition
Associative property of multiplication
Symbols
b = b a
+ (b + c) = (a + b) + c
Additive identity a + 0 = a and 0 + a = a
Multiplicative identity a 1 = a and 1 a = a
Additive inverse a + ( a) = 0 and ( a) + a = 0
Multiplicative inverse a = 1 and a = 1; where a ≠ 0
Multiplicative property of zero
Calculate 86 + ( 2)
Create a strategy
Follow the order of operations, starting with multiplication.
0 = 0 and 0 a = 0
Apply the idea
Evaluate the multiplication
Write the whole number as a fraction
Evaluate the subtraction
Convert the improper fraction to mixed number
Simplify the fraction
Calculate + (0.75 23) 1.2 ÷ 0.4
Create a strategy
Follow the order of operations, starting inside the grouping symbols. In this expression, the square root and parentheses are grouping symbols.
Apply the idea
+ (0.75 23) 1.2 ÷ 0.4 = + (0.75 ⋅ 23) 1.2 ÷ 0.4
= 4 + (0.75 23) 1.2 ÷ 0.4
= 4 + (0.75 ⋅ 8) 1.2 ÷ 0.4
= 4 + 6 1.2 ÷ 0.4
= 4 + 6 3
= 10 3
= 7
Calculate
Create a strategy
Subtract inside the square root
Evaluate the square root
Evaluate the exponent
Multiply inside the parentheses
Evaluate the division
Evaluate the addition
Evaluate the subtraction
Follow the order of operations. Treat the fraction bar as a grouping symbol. The numerator is one group and the denominator is the other group.
Apply the idea
Multiply in the denominator
Multiply inside the parentheses
Multiply in the numerator
Evaluate the division
Calculate
Create a strategy
Follow the order of operations, starting with the grouping symbols. In this expression the absolute value bars and parentheses are grouping symbols.
Apply the idea
Add or subtract inside the absolute value and parentheses
Evaluate the absolute value
Commutative property of addition
Additive inverse
Additive identity
When evaluating multiple operations with rational numbers:
1. Evaluate operations inside grouping symbols.
• Grouping symbols may include parentheses ( ), brackets [ ], absolute value bars
, square root symbols , and fraction bars
2. Evaluate any exponents.
3. Evaluate any multiplication or division, reading from left to right.
4. Evaluate any addition or subtraction, reading from left to right.
5. Consider and check the sign of the final answer, especially if negative values were involved in the calculation.
Here are some of the properties of real numbers that we may need to use while simplifying expressions with the order of operations:
Property
Commutative property of addition
Commutative property of multiplication
Associative property of addition
Associative property of multiplication
Additive identity
Multiplicative identity
Additive inverse
Multiplicative inverse
Multiplicative property of zero
Symbols
1 Choose the property that is demonstrated by each of the following statements:
• Associative property
• Commutative property
• Inverse property
a 0 + 44 = 44
c 8 + 17 = 17 + 8
e 56.45 + 0 = 56.45
• Identity property
• Distributive property
176.23 + ( 176.23 ) = 0
8.12 ( 4.24 7.98) = ( 8.12 4.24) 7.98
2 List the order of operations used to simplify the following expressions: a 6 ÷ 2 4 b 14 ÷ (5 3 4)
3 Explain why the following statement is incorrect, and find the correct answer:
4 Simplify:
3 + 17 ⋅ ( 4) b 4 ⋅ 52 ÷ 5 c 47 ⋅ ( 7 4) d ( 55) ⋅ 6 ÷
5 Fill in the blanks with the property or operation used at each step from the provided list
• Identity property
• Commutative property
• Inverse property
• Distributive property
• Associative property
Given 2 (28 + 17) ÷ (57 27)
Step 1 (2 ⋅ 28 + 2 ⋅ 17) ÷ (57 27) ⬚
Step 2 (56 + 34) ÷ (57 27) ⬚
Step 3 90 ÷ (57 27) ⬚
Step 4 90 ÷ 30 ⬚
Step 5 3 ⬚
Let’s practice
6 Simplify the expressions.
• Multiplication
• Division
• Addition
• Subtraction
a 3 + 5 ( 4) b 12.8 ( 9.12) ÷ 3 + 2.4
c d
7 Simplify the expressions.
a (21 12) ( 14) b 22.06 ( 5.84 4.85) ÷ 4
c d
8 Simplify the expressions.
9 Simplify the expressions.
a 45 ⋅ 4 + 212 b ⋅ ( 10 + 43)
c (28 17)2 5.29 d [32 2.22 (8.08 6.41)]4
10 Simplify the expressions.
11 The expression 82.94 ( 20.02) ⋅ [(14.14 6.17) + 43] simplifies to:
140.62
4528.35
12 What number does the expression 8.12 simplify closest to? A 495 B 700
13 The expression is simplified as shown. Identify the error and provide the correct answer.
14 Yoichi simplified an expression as shown.
Identify Yoichi’s error in the simplification and find the correct answer.
Given Step 1
Step 2 2.13 [30 892.86]
Step 3 2.13 ⋅ [ 862.86]
Answer 1837.89
Given 24 ( 3)4 + 22
Step 1 16 81 + 22
Step 2 65 + 22
Step 3 43
15 Fill in the blanks with operations or properties used to simplify the expression.
[53 + 1.21 (11.23 10.99)]2 Given
Step 1 [53 + 1.21 ⋅ 0.24]2 ⬚
Step 2 ⬚ Exponent
Step 3 [125 + 0.29]2 ⬚
Step 4 [125.29]2 ⬚
Step 5 ⬚ Exponent
16 Complete the following statements:
3 4 ⬚ = 14
17 Evaluate the following:
18 Convert the following temperatures:
a Given that F = 4°, find the value of C using the formula C = (F 32).
b Given that C = 30°, find the value of F using the formula F = C + 32.
19 David buys 3 shirts at $19.90 each, and a pair of jeans for $20.50. The shop has a sale on, and so he receives a $8.02 discount.
a Write a numerical expression to represent the scenario.
b Find the total amount he spends.
20 Three items weighing 3.41 lb, 2.58 lb and 5.79 lb are to be posted but are too heavy to send.
a Write a numerical expression to represent the scenario.
b By how much does the total weight exceed the 11.38 lb limit?
21 After an earthquake, of all claims were paid within a month. Of the remaining claims not paid of them were paid within the second month.
a Write a numerical expression to represent the scenario.
b Calculate the fraction of all claims paid in the second month.
22 Faustina is preparing her shopping list for a week’s worth of groceries. She plans to buy 3 packs of chicken breasts from the store, priced at $19.95 each. Luckily, she has a coupon that will give her $2.50 off each pack of chicken breasts when purchasing 3 or more.
Additionally, Faustina intends to purchase 5 bags of fresh vegetables, which are priced at $3.83 per bag. She has a coupon for $1.25 off per bag of fresh vegetables, which she can apply to two bags. To stock up on household essentials, Faustina plans to buy two large bottles of laundry detergent priced at $64.53 each. At checkout, she has a store credit of $15.46 that will be taken off of the total price of her bill.
a Write an expression for this scenario.
b How much will Faustina pay for her shopping trip.
After this lesson, you will be able to...
• write algebraic expressions to represent verbal expressions or real-world situations.
• represent equivalent algebraic expressions using objects and pictures.
We use algebraic expressions when we want to write a number sentence but we don’t know one of the numbers involved.
For example: What is the total weight of a cat and a 10 lb weight?
In this case, let’s use c for the weight of the cat.
c + 10 is called an algebraic expression which is an expression that contains at least one variable.
c is called a variable. This is a symbol used to represent an unknown quantity.
Coefficients are the numerical factor in a term and are used to show how many variables we have. The variable u with a coefficient of 3 is written as 3u which means 3 ⋅ u 3u = 3 ⋅ u
3 the coefficient u the variable
Terms are a number, variable, product, and/or quotient in an expression. They are the building blocks of an expression. Terms are separated by + or signs.
Consider the expression:
• This is an expression with 2 terms.
• The term has a coefficient of . The negative belongs with the coefficient.
• The term 5 has no variable. It is called a constant term.
In order to write an expression that can be used to model the total cost of a road trip, Mr. Taylor defines the variables:
Let g represent the cost per gallon of gasoline (in dollars), and m represent the cost per mile driven.
1. What could these expressions represent in this context?
2. In this context, what do the coefficients describe?
3. What expressions could we write that wouldn’t make sense in this context?
Expressions and parts of expressions, like factors and coefficients, all have unique meanings in a given context. Viewing expressions in parts and as a whole while paying attention to the quantities represented by the variables can explain the relationships described by the expressions.
For the algebraic expression 4x + :
a Determine the number of terms.
Create a strategy
Terms are separated by plus or minus signs in the expression.
b Identify the coefficient of the first term.
Create a strategy
The coefficient of a term is the number that is multiplied by the variable in the term.
c Identify the constant term.
Create a strategy
The constant term in an algebraic expression is the term that does not contain any variable.
Apply the idea
The algebraic expression 4x + contains two terms: 4x, and
Apply the idea
The first term is 4x, so the coefficient of the first term is 4.
Apply the idea
In the expression 4x + , the constant term is
A coffee shop charges $4.50 per cup of specialty coffee. Write an algebraic expression for the total cost of purchasing c cups of specialty coffee.
Create a strategy
The total cost changes based on the number of cups of coffee purchased.
Apply the idea
The total cost is $4.5 times the number of cups of coffee purchased. This can be represented by the algebraic expression of 4.5c
Write an algebraic expression for the phrase “six and a quarter more than half x”.
Create a strategy
Translate the terms into mathematical symbols and operations.
Apply the idea
The phrase “six and a quarter more than” indicates that we need to add
The “half” means divide by 2, so “half x” is
We can combine the whole description into a single expression:
The perimeter of a rectangle can be written as 2l + 2w. Explain what each part of the expression represents.
Create a strategy
First, we need to identify the two parts of the expression. The coefficients are 2 and the variables are l and w
We know that the perimeter of an object is the distance around the outside edges and a rectangle has 2 sets of sides of equal length.
Apply the idea
Perimeter = 2l + 2w
We can see from the perimeter formula that there are 2 of an unknown quantity l and 2 of an unknown quantity w.
The coefficients 2 represents the 2 sets equal length sides of the rectangle.
For 2l + 2w to be the perimeter, l must represent the length of two sides and w must represent the width of two sides of the rectangle.
Reflect and check
Another way to represent the perimeter of a rectangle is l + l + w + w. This shows that to find the perimeter of a rectangle, we just need to add two lengths and two widths.
In algebra, letters, called variables, are used to represent unknown numbers.
A term consists of a number and a variable. For example: 5.2x, and are terms.
A coefficient is a number that is placed before the variable in an algebraic term. For example: 3.7 is the coefficient of 3.7y
If there is no number placed before the variable then the coefficient is 1. For example: w has a coefficient of 1.
A constant term is a term with no variable. For example: 8.2, and 32 are constant terms.
An algebraic expression is a combination of numbers and variables with mathematical operators.
For example: 2.7x 5y + is an expression.
We can use algebra tiles to help us visualize algebraic expressions.
The tile x represents an unknown number. The tile +1 represents adding one unit and 1 represents subtracting one unit.
This table demonstrates how expressions can be built using the tiles:
Algebra tiles can also help us identify the terms of the equivalent algebraic expression. Let’s break down the algebra tiles below.
Notice that there are two different types of algebra tiles. These represent the two terms in the expression.
The first term in blue, are the three tiles with the +x. This represents the term 3x where the coefficient is the 3 and the variable is the x.
The second term in orange, are the six tiles with the 1. This represents the term 6.
When we add them together, we get the algebraic expression 3x 6.
Write an equivalent algebraic expression and identify each term for the following:
There are many ways to write expressions that are algebraically equivalent by rearranging the terms and combining like terms, but for simplicity, we’ll directly reflect the layout shown by the tiles.
From the image, we have two negative variable tiles, five negative unit tiles plus one positive variable tile, two positive unit tiles. To express this algebraically we can write:
Another way to write the expression is to count up the same tiles in each terms:
b
Apply the idea
From the image, we have two positive variable tiles, six positive unit tiles, and two negative unit tiles, plus two negative variable tiles, one positive variable tile, four negative unit tiles, and two positive unit tiles. To express this algebraically we can write:
Another way to write the expression is to count up the same tiles in each terms:
Represent the following expressions using algebra tiles.
a 7x + 2
Create a strategy
We can use negative variable tiles and positive unit tiles to represent the expression.
b 4x 5
Create a strategy
We can use positive variable tiles and negative unit tiles to represent the expression.
Apply the idea
Apply the idea
We can represent algebraic expressions with visual models to better understand them. We can rearrange models of algebraic expressions to generate equivalent expressions.
1 Match the terms with the correct example from the given options: a Variable b Coefficient c Expression d Constant
A 12 in the term 12x B b in the term 5b C 10
2 What is the coefficient in these terms?
3
Match each mathematical operation with its corresponding verbal phrase.
a + i Quotient
b ii More than
c ⋅ iii Difference
d ÷ iv Less than
e > v Product
f < vi Sum
4 Write a word statement for each expression:
a 5x b p + 7
c x 6 d
5 Write an algebraic expression for each of the statements without using a multiplication or division sign:
a Seven multiplied by x
c Three less than y
b Eight more than x
d The quotient of four and y
6 How can you tell the difference between a variable and a constant when writing algebraic expressions?
7 Write a word statement for each expression:
4x + 11
8 Write an algebraic expression for each of the statements without using a multiplication or division sign:
a Subtract 5 from the triple of x, add 12
c Add 10 to the difference between z and 3
e The quotient of 8u and 9
g 7 less than the quotient of 5 and x
9 Write a word statement for each of the expressions:
a 2 (b + 9) b x (3 y)
b Double the sum of y and 7, subtract 9
d The product of 9a and b
f Half the sum of a and b
h The sum of a and b, divided by 6
c 4 (n + 1) 11 d
10 The total cost of buying x apples is $4. Write an algebraic expression for the cost of one apple.
11 The length of a rectangle is 4 more than its width. Write an algebraic expression for the length of the rectangle in terms of its width, w
12 Using the given key, write an algebraic expression to represent the total number of oranges in each of the diagrams:
13 Which number sentence corresponds to the given number line?
14 Write the sum of two algebraic expressions modeled by the algebra tiles. Key:
Key: contains a oranges contains b oranges equals 1 orange
15 Write a simplified algebraic expression for the following diagrams: a
16 Use the following algebra tiles to draw a diagram that represents each expression:
17 Create a pictorial representation that matches the following expressions.
18 Consider the following set of algebra tiles representing different values:
a Represent the value of 4x with algebra tiles.
b You have 2 green tiles and 3 red tiles, how would you represent this as an expression?
c Represent the expression 3x 4 5x with algebra tiles.
d You have 3 red tiles, 4 green tiles and 2 blue tiles. What algebraic expression do these tiles represent?
19 Below is a pictorial representation of an algebraic expression using algebra tiles:
A student claims that the pictorial representation matches the algebraic expression 5x + 3 2x. Identify and explain the error in the student’s claim.
Use the tiles to provide the correct algebraic expression that matches the pictorial representation.
20 The cost of a movie ticket is $12. The algebraic expression for the cost of n movie tickets can be represented by 12n. Let n be represented by this DVD: Create a pictorial representation of the expression.
21 Consider the following diagram:
s s s s s s
a An algebraic expression using addition to represent the diagram is ⬚ + ⬚ + ⬚ + ⬚ + ⬚ + ⬚
b An algebraic expression using multiplication to represent the diagram is 6 ⋅ ⬚
c Write the answer to part (b) in another way.
22 Why does 5 ⋅ 7 + 2 need to have a multiplication sign, however 3b + 2 doesn’t?
23 Write “the product of 3 and k, then divided by b” in three different ways.
24 Explain how “2 groups of 8 more than x” is different to “8 more than 2x.”
25 A recipe for a cake calls for 2 cups of flour for every 3 eggs. Write an algebraic expression for the number of cups of flour needed for n eggs.
26 Write an algebraic expression for:
a The total value of m coins, where each coin is worth p cents.
b The length of string remaining when two pieces of length K cm are cut from a piece of string originally L cm long.
27 The term “consecutive integers” means whole numbers that follow each other on the number line. For example: 5, 6, 7 are three consecutive integers.
a Write algebraic expressions for three consecutive integers if the smallest integer is x
b Write algebraic expressions for three consecutive integers if the largest integer is p
c Write algebraic expressions for three consecutive integers if the middle integer is y.
28 Consider the expressions 2x + 5 and 3x 2:
a Describe how you would model each expression using algebra tiles.
b Using algebra tiles, compare the expressions 2x + 5 and 3x 2 in terms of their visual representations.
c Explain how you would determine which expression evaluates to a greater amount for a given value of x
29 Using the given key, explain why it is not possible to simplify a + b any further using algebra.
Key: contains a apples contains b apples
Evaluate a(b c) 3ac when a = 1.25, b = 13.4, and c = 7.3
Create a strategy
First we will substitute the given values for a, b, and c. Then we will use the order of operations to decide which operation to perform first.
Apply the idea
a(b c) 3ac = 1.25(13.4 7.3) 3( 1.25) (7.3)
Substitute the given values = 1.25(6.1) 3(1.25) (7.3)
Evaluate the subtraction inside of the parentheses = 7.625 ( 27.375)
Evaluate the multiplication = 19.75
Evaluate the subtraction
The area, A, of a circle is given by the formula: A =
where r is the length of its radius.
Find the area of a circle with a radius of 12 ft. Use 3.14 for the value of π
Create a strategy
First, we will substitute the given values into the formula. Then, we will use the order of operations to calculate the area.
Apply the idea
A = πr 2 = (3.14) (12 ft)2
= (3.14) (144 ft2)
Substitute the given values
Evaluate the exponent = 452.16 ft2 Evaluate the multiplication
Reflect and check
Remember that π is not a variable, it is always equal to the same value (approximately 3.14).
To evaluate expressions for given values, you will first substitute the values into the expression. Next, we use order of operations to evaluate expression.
1 What is the value of the following expression: 3 + 6(9 5) ÷ 2 A 6 B 13.5
15
18
2 Simplify the following expressions:
3 Evaluate y + 5 when:
3
4 Evaluate when:
5 Evaluate:
e when n = 8 f when w = 3
6 Evaluate each expression for the following values: x = 3, y = 2. a 5 + y x b 3x 5 y + x c d e (2x + y) (5x + 7) f
7 Evaluate:
a a + b + c when a = 10, b = 15, and c = 11 b x y z when x = 24, y = 5 and z = 6
c 3j + 5k + 6l when j = 3.5, k = 8.33, and l = 7.06 d a(b + c) 2ab when a = 3.35, b = 13.2, and c = 6.1
e ∣ m n ∣ + p 2 when m = , n = and p = f when q = 5, r = 9, and s =
8 Evaluate each expression for the following values: x = 5, y = 3. a 3 + ∣y x∣ b ∣2x 4 y∣ + x
e f [2x + 3( y 3 24)] (xy 2)2
9 Evaluate z + 15 z w, when w = 5 and z = 6. Justify your answer.
10 The perimeter of a triangle is defined by the formula P = p + q + r
Find P if the length of each of its three sides are p = in, q = in and r = 8 in.
11 For many three-dimensional shapes, we can find the number of edges, E, on the shape by using the formula E = V + F 2 where V is the number of vertices and F is the number of faces.
Find the number of edges of a three-dimensional shape which has:
a 4 vertices and 4 faces b 7 vertices and 7 faces
c 8 vertices and 6 faces d 12 vertices and 20 faces
12 The area, A, of triangle is given by the formula:
where h is the height of the triangle and b is the length of its base.
a Find the area of a triangle that has a base of 7 ft and a height of 5 ft.
b Find the area of a triangle that has a base of 25 cm and a height of 16.5 cm.
c Find the area of a triangle that has a base of 4.64 in and a height of 2.25 in.
d Find the area of a triangle that has a base of 16.175 in and a height of 24.08 in.
13 Energy can be measured in many forms. A quantity of energy is given in units of Joules (J). The kinetic energy, E, of an object in motion is calculated using the formula:
where m is the mass of the object in kilograms and v is the speed of the object in meters per second.
Find the kinetic energy, E, of an object with a mass of 6 kg, traveling at a speed of 19 m/s.
14 A student attempted to evaluate when q = 2.5, r = and s = 2.
a Identify the error in the student’s solution steps.
b Show all the steps leading to the correct answer.
15 John sells chocolates in two different sized boxes. He also sells bulk amounts in packages to supermarkets.
• Small boxes contain x chocolates
• Large boxes contain y chocolates
a Write an algebraic expression for the total number of chocolates required for each or the following orders: i 2 small and 5 large boxes.
ii 3 small boxes and 5 individual chocolates.
b If small boxes contain 10 chocolates and large boxes contain 20 chocolates, find the total number of chocolates required for each order in part (a).
16 What value of x would make the expression 4x 32 x equal to 10?
17 Consider the expression 5x + 9 3x 4 + 2x
a Evaluate the expression when x = 3.
b Simplify the expression then evaluate when x = 3.
c Which method do you prefer? Explain.
18 Are the expressions 9a 2 + 4(a 2 + b) and 8a 2 + 8b + 5a 2 6b equivalent? Explain your reasoning.
If we add a variable or constant and its opposite, we’ve added 0 or nothing, and we call these zero pairs. Adding or subtracting a zero pair from an expression makes an equivalent expression.
Zero pairs
Algebra tiles on the left side represent the expression 2x + 2. The tiles on the right side represent the expression 2x
The zero pairs x and x and 1 and 1 have added 0 to the original expression so the expressions are equivalent.
These tiles represent the expression 4x + 4 + 4x + 5.
Create a model of an equivalent expression.
Create a strategy
The original expression has eight x tiles and nine 1 tiles. We will create a model that has the same amount of each type of tile.
Apply the idea
This model represents an equivalent expression.
This model represents the expression 6x + 2 + 2x + 7.
Equivalent expressions are expressions that have the same value but do not look the same.
We can create equivalent expressions with algebra tiles by:
• Rearranging the tiles to use the same number of x tiles and 1 tiles
• Adding tiles and their opposites to create zero pairs
A simplified expression is a special type of equivalent expression. When we write simplified expressions we are rewriting the same algebraic expression with no like terms and in the most compact way we can.
Let’s look at the expression 4x + 3x 4 3x + 5 modeled with algebra tiles.
Notice that we have a lot of the same types of tiles. To simplify the expression, we can combine tiles of the same type. We call these like terms
Like terms
Terms (or parts) of an expression that have the same variables and exponents
We can start by looking for zero pairs of x tiles.
Once we eliminate the zero pairs, we are left with the expression x 4 3x + 5.
All of the x tiles have the same variable, so we can combine the like terms by counting up the amount of x tiles. We can simplify the expression to be 4x 4 + 5.
There are still some like terms, so let’s keep going.
Next, we can look at the constant terms. These are the terms with no variables. We can start by eliminating zero pairs of constant terms.
Once there are no like terms remaining, we can write the simplified expression by counting up the different types of tiles. The expression 4x + 3x 4 3x + 5 can be simplified to 4x + 1. These are equivalent expressions.
We can also simplify this expression algebraically.
4
Identify variable like terms
Simplify variable like terms
Identify constant like terms
Simplify constant like terms
Option C is equivalent to the original expression.
Reflect and check
We could have also simplified the original expression algebraically and compared it to the options given.
7s + 2 4s = 7s 4s + 2
= 3s + 2
Rearrange like terms (commutative property)
Combine the variable terms 7s 4s
Option C is not only equivalent to the original expression, but it is also fully simplified.
Write the algebraic expression represented by the algebra tiles, then simplify. a
Create a strategy
Count the number of like variable tiles for each term. This will give us the coefficients for the variables. Count the number of constant tiles. This gives us the values of the constant terms. Then we can identify and combine any like terms.
Apply the idea
There are two positive x tiles and two positive 1 tiles for the first part of the expression, and three positive x tiles and four positive 1 tiles for the second part of the expression.
We write the algebraic expression as:
2x + 2 + 3x + 4
We can rewrite it by grouping the like terms 2x and 3x and the like terms 2 and 4:
2x + 3x + 2 + 4
Simplify the expression by combining the like terms: 5x + 6
Reflect and check
We can also use the algebra tiles to find the simplified algebraic expression by combining similar tiles.
The algebra tiles represent 5x + 6.
b
Create a strategy
Count the number of like variable tiles for each term. This will give us the coefficients for the variables. Count the number of constant tiles. This gives us the values of the constant terms.
Then we can identify and combine any like terms.
Apply the idea
There are three negative x tiles and six negative 1 tiles for the first binomial, and four negative x tiles and two negative 1 tiles for the second binomial.
We can write the algebraic expression as:
3x 6 + ( 4x) 2
We can rewrite the expression by grouping like terms: 3x + ( 4x) 6 2
Simplify the expression by combining like terms. 7x 8
c
Create a strategy
Count the number of like variable tiles for each term. This will give us the coefficients for the variables. Count the number of constant tiles. This gives us the values of the constant terms.
Remember to count positive and negative tiles separately. Then we can identify and combine any like terms.
Apply the idea
Counting the positive and negative x and 1 tiles. We can write the algebraic expression as:
We can rewrite the algebraic expression by grouping like terms:
Notice the zero pair of 2x and 2x:
Simplify the expression by combining like terms:
Simplify the expression. Justify each step.
a 8x + 5 3x + x 7
Create a strategy
Rewrite to group the like terms and then combine the coefficients and constants.
Apply the idea
8x + 5 3x + x 7 = 8x 3x + x + 5 7
= 6x + 5 7
= 6x 2
b 12y + ( 9 + 5 + 11y) 17
Create a strategy
Rearrange like terms (commutative property)
Combine the x terms 8x 3x
Combine the constant terms 5 7
Rewrite to group the like terms and then combine the coefficients and constants, starting with the terms inside the parentheses.
Apply the idea
= 12y + 11y 4 17
= 23y 4 17
= 23y 21
Combine the constants inside the parentheses 9 + 5
Rearrange like terms (commutative property)
Combine the y terms 12y + 11y
Combine the constant terms 4 17
Given the following unsimplified and simplified expressions, write a real-world context for each expression and describe what each equivalent form represents.
• Unsimplified: 6x + 4 x 2
• Simplified: 5x + 2
Create a strategy
We can use x represent one object and the constants to represent another object. Then create a real-world scenario involving these objects.
Apply the idea
Let’s say x represents a box fruits, and the constants represent fruit juices.
You are planning to provide fruits and vegetables for an event at the community center. You have 6 boxes of fruits (each with the same number of fruits inside) and four fruit juices. You realize when you get to the community center, you left 1 box of fruits and 2 fruit juices at your parents’ house. This is represented by the unsimplified version of the expression.
You are now left with 5 boxes of fruits and 2 fruit juices for the event. This is shown by the simplified version of the expression.
Two algebraic terms are called like terms if they have exactly the same combination of variables. To combine like terms means to simplify an expression by combining all like terms together through addition and/or subtraction.
1 Given the algebraic expression 5n + 7, match each component of the expression with its correct description.
a 5n A Coefficient
b 7 B Variable
c 5 C Constant
d n D Term
2 Consider the expression: 9v + 6 7v 2.
Identify the following:
a Term(s) b Constant(s) c Variable(s) d Coefficient(s)
3 Which set of algebra tiles represents the expression 3r 2
4 a Find the value of each of the following expressions: i
b Which of the expressions above is equivalent to 4 groups of 7?
5 These tiles represent the expression x + 2 + 3x + 3. Which expression is equivalent to x + 2 + 3x + 3?
A 3x + 5 B 4x + 5 C 5x + 4 D 9x
6 Here are two equivalent expressions:
Evaluate each of these expressions for x = 5. What do you notice?
7 Consider
a Find the least common denominator of and b Now, write as a single fraction.
8 Determine whether the following expressions are equivalent to 11:
9 Determine whether the following expressions are equivalent to 0.4g + 6.2:
10 Determine whether the following expressions are equivalent to 4x:
11 Perform the following: i Simplify the expression ii Justify each step
a 7s + 4 4s 2 b 2n + 3 + 5n 4 c 2 8.25x 4.75x + 5 d 1.49x 3.26 3.4 + 5.21x e f
12 Perform the following: i Simplify the expression ii Justify each step
(4x + 4 2x) + x 2
c 4.5z + (5.5z + 3 2.5z) 2 d
13 i Write the algebraic expression represented by the algebra tiles. ii Simplify the expression. a b c d
14 Which two algebraic expressions, unsimplified or simplified, are represented by the following algebra tiles?
15 Luann is managing a bean bag toss at the community fair. She has two types of targets, a large green target and a small yellow target. Throughout the next hour, she records the types of targets each participant aims for. Here’s the breakdown:
• The first participant aimed at 2 large targets and 2 small targets.
• The second participant aimed at 5 large targets and 5 small targets.
• The third participant aimed at 0 large target and 6 small targets.
• The last participant aimed at 4 large targets and 2 small targets.
a Create a pictorial representation that shows all the targets aimed at during that hour.
b Show the pictorial representation as an expression where the large target equals y and the small target equals +1
c Simplify the expression that represents all the targets aimed during that hour.
16 A student simplifies this expression 3.1r 5.8 + 7.4r 2.6p + 4.3 and got 7.9r 1.5. What was the error in the student’s simplification?
17 Simplify the expression:
18 Lisa has a 5% discount voucher for her vacation, which costs $w
Determine whether the following expressions can be used to calculate the discounted price of Lisa’s vacation: a 5w w b w 0.05w c w 0.05 d 0.95w
19 Given the following unsimplified and simplified expressions below, write a real-world context for each expression and describe what each equivalent form represents.
• Unsimplified: 4x + 5 x 3
• Simplified: 3x + 2
Big ideas
• Expressions are the building blocks of algebra. They can be used to represent and interpret realworld situations.
• An equals sign indicates an equivalent relationship between two expressions.
• A solution set is the collection of all values that make an equation or inequality true.
After this lesson, you will be able to...
• represent two-step equations with objects and pictures.
• write two-step equations for verbal and real-world situations.
• write a verbal situation for a two-step equation.
An equation is a mathematical sentence or number sentence stating that two expressions are equal or that they have the same value.
Equations often contain letters or symbols that are used to represent an unknown quantity. These symbols are called variables
Let’s consider the scenario: “You have 2 times the number of tokens as your friend. After giving away 4 tokens, you have 16 tokens left. How many tokens did your friend start with?”
We can represent this statement in a few different ways. We can use pictures to represent the scenario.
We can also use algebra tiles to represent the scenario. The algebra tiles would look like this:
The equation that represents this scenario is: 2x 4 = 16
There are some key words to look out for when writing a sentence as an equation.
Addition Subtraction Multiplication Division Equal plus minus times divided by is/are the sum of the difference of the product of the quotient of equals increased by decreased by multiplied by separated into equal parts amounts to total fewer than of split totals more than less than twice equally shared added to subtracted from groups/lots of
Adam thought of a number, doubled it and added 5. The result was 13.
a Write an equation that represents this scenario.
Create a strategy
There is an unknown number so we should use a variable to represent it. ‘Doubled’ means multiplied by 2 and we are told he added 5.
Apply the idea
b Create a model using algebra tiles to represent this scenario.
Apply the idea
What scenario could the equation 3t = 2t + 12 be representing?
Create a strategy
We should start by stating what t represents.
Apply the idea
Here is one possible scenario:
Let t be the number of tickets included in a season membership to an off Broadway theater.
3 season memberships have 12 more tickets than 2 season memberships.
Write the equation
Simplify
Reflect and check
How many different scenarios can you come up with? What do all the scenarios have in common? What is different?
Write the statements as equations, where x represents the number.
a Four times a number decreased by is equal to twice the number plus
Create a strategy
Use a variable to represent the unknown number. ‘Four times’ means multiply by 4 while twice means multiply by 2. Decreased represents subtraction.
Apply the idea
b The quotient of twenty and a number increased by equals the product of three and a number minus
Create a strategy
Use a variable to represent the unknown number. ‘Quotient’ means division and ‘product’ means multiplication. ‘Increased’ represents addition.
Apply the idea
An equation is a mathematical sentence stating that two expressions are equal. Equations often contain letters or symbols used to represent an unknown quantity. These are called variables. We look for keywords to help us determine which operations are being used in an equation.
Addition Subtraction Multiplication Division Equal plus minus times divided by is/are the sum of the difference of the product of the quotient of equals increased by decreased by multiplied by separated into equal parts amounts to total fewer than of split totals more than less than twice equally shared added to subtracted from groups/lots of
1 Match these terms to their corresponding definitions:
a Equation
b Variable
c Expression
d Coefficient
e Equality
f Inequality
g Solution
i A combination of numbers, variables, and operators (such as +, , , ÷) that represents a value.
ii A relationship between two expressions that have the same value, denoted by the symbol = .
iii A mathematical statement that one quantity is less than or greater than another, represented by symbols such as <, >, ≤ or ≥
iv A mathematical statement that asserts the equality of two expressions.
v The answer to a problem, the value or set of values that satisfy an equation, inequality, or system of equations.
vi Represents an unknown quantity that can change or take on different values.
vii A numerical or constant factor in front of a variable in an algebraic expression.
2 Determine whether each of the following is an expression or an equation:
a 4p + 2q 10 b 5r 15 = 0 c 5k = 15 d x + 2
e 5y 8 ( y 9) = 6 f 7x 8 (x + 9) g u + v = 1
3 Write an equation for each of the following sentences:
a y is equal to six.
c g plus eight equals fifteen.
e Five times m is equal to ten.
g Triple r decreased by one.
b n minus one equals three.
d The sum of y and two is equal to three.
f Two subtracted from y gives eight.
h z divided by five equals six.
4 Which property of equality is used in the step from 3x + 5 = 20 to 3x = 15?
A Addition Property of Equality
C Division Property of Equality
B Subtraction Property of Equality
D Multiplication Property of Equality
5 Which property of equality is used in the step from 4(x + 2) = 24 to x + 2 = 6?
A Addition Property of Equality
C Division Property of Equality
6 Simplify:
a 3.3b 5.4 + 2(b + 6)
B Subtraction Property of Equality
D Multiplication Property of Equality
b 0.5x 2.3 + 3(x 4.2)
c d 2.7k + 3.3 4(k 2.1)
e f
7 Identify the variable, coefficients, and constants of 4x 5 = 17.
8 Solve:
9 Which of the following equations correctly represents the situation where a number is increased by 7 and then the result is multiplied by 3 to equal 24?
10 Write an equation that matches the number tiles shown.
11 Represent the following equations using number tiles.
2x + 3 = 11
= 14
12 Which of the following is the algebraic form for the verbal statement shown?
7 less than the quotient of a number, x, and 2
4.01 Write and represent two-step equations
13 Consider the verbal situation:
“You start with a number. If you triple the number and then add four, you get seventeen. Which of the following equations best represents this situation?
14
Write the following statements as equations:
a Twice the sum of n and two is equal to twenty-two.
b The sum of three times n and six is equal to thirty.
c Five less than twice n is equal to eleven.
d Three times n, decreased by four, gives twenty.
e The product of four and n, plus three, is nineteen.
f Seven more than three times n is twenty-two.
g Four times n, decreased by five, is equal to fifteen.
h Twice the difference of n and three is equal to ten.
15 Write the following statements as equations, where x represents the number:
a Three times a number decreased by 2 is equal to 7.
b The quotient of 15 and an unknown number, is 3.
c The product of 3, and a number increased by 4, is 27.
d Twenty four is equal to 12 decreased by 2 times the number.
16 Write the following statements as equations, where x represents the number:
a Three times a number decreased by is equal to twice the number plus .
b Three times a number, increased by , equals 6.
c A number divided by 5, plus , equals 4.
d Seven times a number is equal to more than twice the number.
e Twice a number, decreased by , is equal to 9.
17 Write the following statements as equations:
a The sum of 8.5 and 12x is equal to 92.5.
b The product of 5.6 and the sum of x and 7.4 equals 50.
c The difference of 5.1 from x multiplied by 3.6 is equal to 15.
d Four times the sum of a number and 0.25, equals 10.
18 Given the following equations, write a statement that matches each equation:
a 2(n + 4) = 32 b 3x 5 = 10 c d 4 (x + 0.75) = 12
19 Given these two-step equations, create a situation or word problem that could be represented by this equation.
a b 3x 5 = 16
20 John and Jay do some fundraising for their sporting team. John raised $m, and Jay raised $71. If together they raised $403, write an equation in terms of m
21 Vanessa is cutting out a rectangular board to construct a bookshelf. The board is to have a perimeter of 48 cm and its length is to be 4.5 cm shorter than double the width. Let x be the width of the board. Express the perimeter as an equation in terms of x
22 A rectangle has a perimeter of 42 cm. If its width is 7 cm, and the length is l a Express the perimeter as an equation in terms of l. b Solve for l.
23 Samantha baked 24 cookies. She baked twice the number of cookies that Jason did plus 6 additional cookies. How many cookies did Jason bake?
A 7 cookies B 8 cookies C 9 cookies D 10 cookies
24 Ericka has 24 crayons. Ericka has 8 more than 2 times the number of crayons Bryan has. Exactly how many crayons does Bryan have?
A 16 crayons B 12 crayons C 8 crayons D 4 crayons
25 Write an equation using the following algebra tiles.
After this lesson, you will be able to...
• solve two-step equations using objects and pictures.
• solve two-step equations using properties of real numbers and properties of equality.
• confirm solutions to two-step equations.
Algebra tiles allow us to represent an equation visually.
Explore online to answer the questions
mathspace.co
Use the interactive exploration in 4.02 to answer these questions.
1. What kinds of things can you add (or remove) on one side, without changing the other side, and keep the scale balanced?
2. Use the scale to find the value of one +x tile. Explain your process. (Remember the scale must stay balanced.)
Recall this scenario:
2x 4 = = 16
“You have 2 times the number of tokens as your friend. After giving away 4 tokens, you have 16 tokens left. How many tokens did your friend start with?”
We represented the scenario using pictures shown.
We can use the pictures to help us determine how many tokens your friend started with.
2x 4 = = 16 + + 4 + + 4
Add 4 tokens to each side
We can start by adding tokens to both sides of the equation to create zero pairs on the left side.
2x = = = = 20 10
Once the zero pairs are removed and we combine the tokens on the right we are left with 2 bags on the left side and 20 tokens on the right side.
Divide into two equal groups x
To determine our final answer, we can divide the tokens on the right side into 2 equal groups to find that one bag holds 10 tokens. Your friend started with 10 tokens.
We can also use algebra tiles to represent the scenario. The algebra tiles would look like this:
We can start by adding +1 tiles to both sides of the equation to create zero pairs on the left side.
add four +1 tiles to each side
Once we remove the zero pairs, we are left with two +x tiles on the left side and twenty +1 on the right side.
To solve, we can divide the +1 on the right side into 2 equal groups.
Again, we find that your friend started with 10 tokens.
Divide into two groups
Consider the following algebra tiles:
a What should we add to the left side and right side of the equation to keep only the x tiles on the left side of the equation?
Create a strategy
Keep the two sides balanced by adding tiles to have zero pairs and cancel the unit tiles on the left side.
Apply the idea
Add 3 positive unit tiles to both sides of the equation to cancel out the 3 negative unit tiles.
b Draw the final number of algebraic tiles and write the equation to solve for x
Create a strategy
Count the final number of tiles after canceling out the unit tiles.
Apply the idea
c Find the value of x.
Create a strategy
We divide the tiles into equal groups on both sides of the equation to find the equivalent of a single x tile.
Apply the idea
Divide by 2 groups.
You and your friends shared 2 pizzas. You also got a pitcher of soda for $6.75. You paid a total of $31.75.
a Create a pictorial model to represent this scenario.
Create a strategy
The unknown value is the cost of pizza.
Apply the idea
We can use a pictorial model like this:
b Find the cost of each pizza using your model.
Create a strategy
We can represent the scenario using the equation 2p + 6.75 = $31.75 and use the pictorial model to solve it.
Apply the idea
Remove $6.75 of the money from both sides of the equation.
Now we know 2 pizzas cost $25.
Organize the remaining money into two equal sized groups. We will need to break one of the $5 bills into four $1 bills and four quarters to divide the money up evenly.
= Remove one pizza and one group of money from each side. We can now see that one pizza costs $12.50.
Algebra tiles and pictorial allow us to represent an equation visually. When using these models, we can look for zero pairs to help isolate the variable and solve the equation. It is important to ensure that we are keeping the two sides of the equation balanced, so what we do to one side, we must do to the other.
Algebra tiles and pictorial models are not always a realistic or efficient way to solve an equation. We can use the properties of equality to solve an equation. These properties require us to apply the same operation on both sides of the equation as we try to isolate the variable. This keeps the equation balanced.
The properties of equality used to solve equations include:
Addition property of equality
Subtraction property of equality
If a = b, then a + c = b + c
If a = b, then a c = b c
Multiplication property of equality If a = b, then ac = bc
Division property of equality
If a = b and c ≠ 0, then
Substitution property of equality If a = b, then b may be substituted for a in any expression
The properties of real numbers are also useful in solving equations. The ones we use most often are:
Commutative property of addition
Commutative property of multiplication
Associative property of addition
Associative property of multiplication
Additive identity If a = b, then a + 0 = b and a = b + 0
Multiplicative identity If a = b, then a 1 = b and a = b 1
Additive inverse a + ( a) = 0
Multiplicative inverse a = 1
Solve the following equation: 8m + 9 = 65
Create a strategy
Use the properties of equality to isolate the variable.
Apply the idea
8m + 9 = 65
Start with the given equation
8m + 9 9 = 65 9 Subtraction property of equality
8m = 56
Evaluate the subtraction
= Division property of equality
m = 7
Evaluate the division
Reflect and check
We can check our answer by substituting the value we found for m, back into the equation.
8(7) + 9 = 65
56 + 9 = 65
65 = 65
Substitution property
Evaluate the multiplication
Evaluate the addition
When we substitute the value of m into the equation, we are left with 65 = 65. This is true, so our solution is correct.
Solve the following equation: = 8.2. Round to 2 decimal places if necessary.
Create a strategy
Use the properties of equality to isolate the variable.
Apply the idea
Start with the given equation
Multiplication property of equality
Multiplicative inverse
Evaluate the multiplication
Addition property of equality
Evaluate the addition
Reflect and check
We can check our answer by substituting the value we found for x back into the equation.
Substitution property
Evaluate the subtraction
Evaluate the division
When we substitute the value of x into the equation, we are left with 8.2 = 8.2. This is true, so our solution is correct.
Determine whether the given value is a solution to the following equations.
a 5x + 3 = 23 where x = 4
Create a strategy
To determine if the value is a solution, we will use the substitution property to substitute 4 into the equation for x
5(4) + 3 = 23
20 + 3 = 23
23 = 23
Substitution Property
Evaluate the multiplication
Evaluate the addition
Because 23 = 23, x = 4 is a solution to the equation 5x + 3 = 23.
b where f = 6
Create a strategy
To determine if the value is a solution, we will use the substitution property to substitute 6 in the equation for f.
Apply the idea
Substitution Property
Evaluate the multiplication
Evaluate the addition
Because , f = 6 is not a solution to the equation .
We can use the properties of real numbers and properties of equality to solve two-step equations. When solving two-step equations:
• We want to get the variable by itself on one side of the equal sign.
• To keep everything balanced, we must do the same operations to both sides by applying the properties of equality.
1 For the equation 3x 7 = 5, match each component with the appropriate label.
a x i Constant
b 3 ii Coefficient
c 7, 5 iii Term
d 3x, 7, 5 iv Variable
2 Match each given property of real numbers with the correct representation.
a Identity Property i q ⋅ 0 = 0
b Inverse Property ii a + b = c, if b = d, then a + d = c
c Multiplicative Property of zero iii d ⋅ = 1
d Substitution Property iv a + 0 = a
3 Fill in the blanks with the property used for each step to solve 12k + 8 = 32.
4 Solve for the variable. Round to 2 decimal places as needed. a 3x = 42 b 2h = 12
5 Determine whether the given value of x is a solution to the following equations:
a 5x = 40 where x = 8
b 4x = 14 where x = 3
c 11x = 44 where x = 4 d 7x = 48 where x = 7
6 The product of 3.2 and a number is 8.5 less than 6. What is the equation that represents this situation?
7 Consider the following scale:
a Write an equation to represent the scale.
b Identify whether the scale would remain balanced after the following:
i Take away a +1 tile from the left side of the scale and add a +1 tile to the right side of the scale.
ii Take away a +1 tile from the left side of the scale and take away a +1 tile to the right side of the scale.
iii Add a +1 tile from the left side of the scale and add a +1 tile to the right side of the scale.
iv Add a +1 tile from the left side of the scale and take away a +1 tile to the right side of the scale.
8 Determine whether the given value of x is a solution to the following equations: a 4x 2 = 18 where x = 5
9 For each of the following equations:
i Describe the operation required to solve the equation.
ii Now, solve the equation.
practice
a Write an equation to represent the scale. b Solve
a Write an equation to represent the scale.
b Solve
12 For the equation 5x + 10 = 30:
a Create a pictorial balance scale to represent the equation.
b Solve
13 For the given equations:
i What common method is used to solve all the parts in this question? ii Solve. Round to 2 decimal places as needed. a x 7 =
14 For the given equations:
i What common method is used to solve all the parts in this question?
ii Solve. Round to 2 decimal places as needed. a 3 = 4
+ 3 = 11
3.3 = 1.11 d 17.72 = 13.98 e f
15 For the given equations:
i What common method is used to solve all the parts in this question? ii Solve. Round to 2 decimal places as needed. a b c
16 For the given equations:
i What common method is used to solve all the parts in this question? ii Solve. Round to 2 decimal places as needed.
= 4
= 3.1
17 For the given equations:
i What common method is used to solve all the parts in this question? ii Solve. Round to 2 decimal places as needed.
a 5 (t + 9) = 60 b 6 (x + 5) = 54
3.9 (s 16.7) = 21.2 e
18 Solve. Round to 2 decimal places as needed.
a 7.99x 63.67 = 49.52 b + 8 = 10 c + 3.89 = 1.27 d e = 3.14
19 Chae solved an equation as shown: = 45 Given
s + 11 = 45 Step 1. Divide 22 by 2
s + 11 11 = 45 11 Step 2. Subtract 11 from both sides of the equation
s = 34 Answer
Identify the error made by Chae and find the correct answer.
20 Solve. Round to 2 decimal places as needed.
a 12x + 7 = 4x + 111 b 2b 6 = 3b + 15 c 9u + 20 = 4u 50 d 10m 23 = 2m 47
21 A student is given the equation 2x 6.3 = 8.5 and solves it to find x = 7.2. Explain how to verify whether x = 7.2 is a correct solution to the equation and provide a detailed explanation of why it is or is not correct.
22 One quarter of a number is equal to triple that number less 22. Let x be the unknown number.
a Write an equation in terms of x b Find the value of x
23 The relationship between F degrees Fahrenheit and C degrees Celsius is F = 1.8C + 32. Find the temperature in degrees Celsius that is equivalent to 51.8°F.
24 Identify a contextual situation that could be represented by the equation 4x + 7 = 25.
25 Create an equation using the digits 1 to 9, at most one time each, by placing a digit in each box. You may reuse all the digits for each equation.
⬚x + ⬚ = ⬚
a x has a positive value. b x has a negative value.
The sum of 7 and 8x is equal to 47.
Construct the equation and find the value of x
Create a strategy
Translate the keywords into mathematical operations to set-up the equation.
Apply the idea
7 + 8x = 47
8x + 7 7 = 47 7
8x = 40
Write the equation
Subtract 7 from both sides
Evaluate the subtraction
= Divide both sides by 8
x = 5
Evaluate the division
Reflect and check
We can substitute 5 into the original equation to verify our answer.
7 + 8(5) = 47
7 + 40 = 47
47 = 47
Substitute x = 5
Evaluate the multiplication
Evaluate the addition
Sally and Eileen do some fundraising for their sporting team. Together, they raised $600. If Sally raised $272 more than Eileen, and Eileen raised $p:
a Write and solve an equation in terms of p that represents the relationship between the different amounts.
Create a strategy
Translate the keywords into mathematical operations to set up the equation.
Apply the idea
p represents the amount of money Eileen raised and p + 272 is the amount Sally raised. Adding these amounts will give the total $600 raised.
p + p + 272 = 600
2p + 272 = 600
2p + 272 272 = 600 272
2p = 328
=
Reflect and check
Write the equation
Combine like terms
Subtract 272 from both sides
Evaluate the subtraction
Divide both sides by 2 p = 164
Evaluate the division
We can substitute $164 back into the equation to see if our solution makes the equation true.
2(164) + 272 = 600
328 + 272 = 600
600 = 600
Substitute the answer into the original equation
Evaluate the multiplication
Evaluate the addition
b Now, calculate how much Sally raised.
Create a strategy
We know that Sally raised $272 more than Eileen.
Apply the idea
Eileen raised $164 and Sally raised $272 more than that.
Amount Sally raised = p + 272 Write an equation for the amount Sally raised = 164 + 272 Substitute p = 272 = 436 Evaluate the addition
Sally raised $436.
Reflect and check
Check your solutions by adding the amount that we found Eileen raised to the amount that Sally raised to see if it equals the total amount raised of $600.
436 + 272 = 600 600 = 600
This confirms our answer.
Consider the following equation.
7.50h + 25 = 115
a Create a real-world scenario that could be represented by the equation.
Create a strategy
We know that 7.50h represents a quantity that will occur more than once, where the 25 term only occurs once.
Apply the idea
Here is one possible scenario:
A rental service charges $7.50 per hour plus an additional $25 one-time registration fee.
You have a budget of $115. This equation can be used to determine how many hours you can afford to use the rental service.
Let h be the number of hours a rental service is used.
Reflect and check
How many different scenarios can you come up with? What do all the scenarios have in common? What is different?
b Solve the equation and explain the answer in context to the scenario you created in part (a).
Create a strategy
Use inverse operations to isolate the variable.
Apply the idea
7.50h + 25 = 115
7.50h + 25 25 = 115 25
7.50h = 90
Write the equation
Subtract 25 from both sides
Evaluate the subtraction
= Divide both sides by 7.50 h = 12
Evaluate the division
This means that someone can use the rental service for 12 hours and will pay $115.
Reflect and check
We can substitute 12 back into the equation to see if our solution makes the equation true.
7.50(12) + 25 = 115
90 + 25 = 115
Substitute 12 into the original equation
Evaluate the multiplication 115 = 115
Evaluate the addition
This confirms 12 is a solution to the equation.
When working to solve problems, always be sure to:
• Read the question at least twice and find keywords.
• Be clear what your variable is representing, for example instead of saying that “x is chickens” we could say “ x is the number of chickens” or “x is the weight of each chicken.”
• Check your answer to see if it is reasonable and then check it by substituting into your equation.
1 Match each term with its definition.
a Two-Step Equation
b Equation
c Property of Equality
d Inverse Operation
i A statement expressing the equality of two mathematical expressions.
ii A mathematical sentence involving two operations, typically requiring two steps to solve.
iii An operation that undoes the effect of another operation.
iv Fundamental rules governing the behavior of equations.
2 For each of the following statements:
i Write the statement as an equation, where x represents the number.
ii Solve for the value of x
a Thrice a number is 72.
c A number divided by three is equal to 4.
e Forty less than a number is 22.
3 Solve:
e 3.01m = 12.04 f 5.16p = 35.01
b Twenty more than a number is 31.
d The difference between a number and nine is 17.
f The quotient of a number and six is equal to 42.
4 Susie wants to buy a bicycle for $200. If she saves $20 a week, how many weeks will she have enough to buy the bicycle?
5 Identify the steps used to solve the following equations:
6 Write the following statements as equations, where x represents the number:
a Five less than 2.50 times a number gives 22.5.
b The quotient of 15 and a number is 3.
c The product of 3.18 and a number increased by 4.71 is 28.42.
d One-third of a number is equal to 12 decreased by the number.
e A quarter less than times a number is
f Five more than triple a number is 29.72.
g The product of and a number increased by is
h Three times a number is equal to 3.71 increased by twice the number.
7 For each of the following statements:
i Write the statement as an equation, where x represents the number.
ii Solve for the value of x
a The sum of a twice a number and 7 is 17.
b Seven more than twice a number is 23.
c Fifteen minus three quarters of a number is 9.
d Seven times a number is equal to 10.10 more than twice the number.
e Eight divided by a number equals times that number.
f Three-quarters is the difference of a number and 7, divided by 2.
g Five less than the quotient of a number and 4.81 gives 1.76.
h Six is equal to double the difference of a number and .
8 Consider the statement: “The sum of 8 and 12x is equal to 92”
a Write the statement as an equation. b Find the value of x
9 Ella and Liam are buying concert tickets. Together they spend $350. If Ella spends $e, and Liam spends $40 more than twice as much as Ella, write an equation that represents the relationship between the amounts each spent.
10 Anna and David are shopping for groceries. Together they spend $90. Anna spends $a, and David spends $15 more than three times as much as Anna. Why is the equation a + 3 (a + 15) = 90 not a representation of the relationship between how much each spent on groceries.
11 Hayley and Aoife donate to charity. Together they donate $260.50. If Hayley donated $m, and Aoife donated $55.70 less than twice as Hayley:
a Write an equation that represents the relationship between the amounts each donated.
b Find the value of m.
12 At the start of spring, there are 60 birds living in the park. Each day 3 more birds arrive in the park. Days have passed since the start of spring and there are currently 126 birds living in the park.
a Let x be the number of days that passed. Write an equation that represents the context.
b Find the value of x
13
A rectangle has a length of and a perimeter of . Let w be the width of the rectangle.
a Find an equation for the perimeter of the rectangle.
b Find the value of w
14 Sharon, a tennis player has won 5 times as many matches than Gabby in her career. Gabby won 10 matches more than Kevin. Let x be the number of matches won by Kevin.
a Write an equation if Sharon has won 265 matches in her career.
b Find the value of x.
15 Valentina tries to guess how many people are at a concert. Her guess is twice the exact number of people at the concert. Kenneth guess that there are 1850 attended the concert. The sum of their guesses is 7250. Let x be the exact number of people at the concert.
a Write an equation that models the situation. b Find the value of x
16 Sophia is the youngest child in her family. She has three older brothers of ages 19, 16 and 12, and a sister who is eight years older than Sophia. The average age of the five children is 15 years.
a If Sophia is k years old, write an equation that models the situation.
b Is Sophia 10 years old?
17 A piece of cord 2.87 ft long is cut evenly into smaller pieces of 0.07 ft each. Each piece cost $x. The total cost of the smaller pieces is $51.25.
a Write an equation that models the situation.
b Does each piece cost $1.75?
18 If Luigi earns $238.42 for working 7 hours, how much does he earn in 2 hours?
19 A clothing store is giving out discounts if you buy in bulk. How much would you pay for a single t-shirt if the total cost of 8 t-shirts is $265.57 with a discount of $9.47?
23 Create a real-world scenario that can be represented by the equation 2.25x + 5.50 = 25.50.
20 Three consecutive integers are so that the sum of the first and twice the second, is 12 more than twice the third. Let x be the smallest of the numbers.
a Form an equation and solve it for x b Find the three consecutive integers.
21 Lesley is creating a 3-minute slide show with pictures from her holiday. Each picture will be displayed for 4.5 seconds.
How many pictures can she show in 3 minutes?
22 About of the cars in a city are less than 5 years old. About of the cars are between 5 and 10 years old. If there is a total of 1200 cars registered in the city, find the number of cars that are greater than 10 years old.
24 At a store Esther buys 6 shirts and 4 pairs of jeans for $160. Each shirt costs $28, and each pair of jeans costs $j. Write an equation that represents the cost of the trip and solve for the cost of each pair of Jeans. Explain why this is an impossible price for the Jeans.
After this lesson, you will be able to...
• write inequalities for verbal and real-world situations.
• write a verbal situation for an inequality.
• represent given solutions to inequalities using a number line.
In mathematics we have special symbols to indicate that an inequality exists. Let’s review them now.
When we write an equation, we are able to write it in two orders. For example, x = 10 and 10 = x mean the same thing.
We can also write inequality statements in two orders, but we need to be careful and switch the inequality sign being used as well. For example, x > 10 means the same thing as 10 < x. That is, “x is greater than ten” is the same as “ten is less than x”.
When graphing inequalities, we have to consider which inequality symbol is used.
The > and < both use an open (unfilled) circle as their endpoint. The ≥ and ≤ use a closed (filled) circle for their endpoint.
Let’s see an example of each case.
The graph of x > 3 or “x is greater than 3” is:
Notice the open circle to show that 3 is not part of the solution set and the shading to the right to show that all numbers larger than 3 are in the solution set.
The graph of x ≥ 3 or “x is greater than or equal to 3” is:
Notice the closed circle to show that 3 is included in the solution set and the shading to the right to show that all numbers larger than 3 are also in the solution set.
The graph of x < 3 or “x is less than 3” is: 2
Notice the open circle to show that 3 is not part of the solution set and the shading to the left to show that all numbers smaller than 3 are in the solution set.
The graph of x ≤ 3 or “x is less than or equal to 3” is:
Notice the closed circle to show that 3 is included in the solution set and the shading to the left to show that all numbers smaller than 3 are also in the solution set.
Inequalities are used in many real-life scenarios.
Consider the situation where Alex is at a trampoline park. Jumping on a trampoline costs $12 per hour and there is a one-time entrance fee of $8. He has a budget of $52.
In this situation, we know Alex only has $52 to spend. He can spend all of his money or just some of it, but it is not possible for him to spend more money than he has. This means the amount he spends at the trampoline park has to be less than or equal to $52.
The amount he spends at the park is the cost of the entrance fee, $8, plus the cost for jumping, $12 per hour. We can represent the cost of jumping as $12 times the number of hours, h or 12h. The total cost can be represented by 8 + 12h
Putting this all together we get the inequality 8 + 12h ≤ 52.
Assume Alex solves this inequality and gets the solution h ≤ 4. This means that to stay within his budget, Alex can spend no more than 4 hours jumping on trampolines.
We can graph the inequality, h ≤ 4.
Notice that the inequality and the number line include values that are not possible in the scenario, i.e. 2. It is impossible to go to the trampoline park for 2 hours. These negative values are mathematical solutions to the inequality but they do not make sense for this context. We always need to think about the meaning of each value in a solution set to determine if it makes sense for the context.
Write and graph an inequality to represent the statement “k is less than or equal to seven.”
Create a strategy
The words “less than or equal to” refer to the symbol ≤ and the graph will have a closed (filled) circle at 7.
Apply the idea
The inequality is: k ≤ 7
To graph it on a numberline we will start with a closed (filled) point at 7 and shade all values that are less than (to the left of) 7.
Reflect and check
There are a whole range of values of k which make this inequality true, including k = 7, k =
Write an inequality to represent the statement “The sum of 3 and 5 groups of x is at least 23.”
Create a strategy
The word “sum” refers to addition, “groups of” refers to multiplication. “At least” means the amount needs to be that much or more which is represented by ≥
Apply the idea
Write an inequality to represent the following situations.
a A painter is buying cans of paint. Each can costs $40 and the painter has a budget of $320.
Create a strategy
To find the total cost, we need to multiply the cost of a can by the number of cans bought. Having a budget means you have a maximum amount that you can spend. The painter can spend all of the money, or some of the money, but not more than $320.
Let n be the number of cans the painter buys. The total cost is 40n.
The inequality symbol that represents being on a budget is ≤ because you can spend less than your total budget or all of it but not more.
The inequality to represent this situation is: 40n ≤ 320
b A gardener is planning to plant trees in a park. Each tree costs $250 to plant, and there are additional setup costs totaling $1500. The gardener’s budget for planting trees is $5500.
Create a strategy
Just like in part (a) being on a budget means you can spend all of the money or some of the money which is represented by ≤. To find the total cost we need to multiply the cost of planting a tree by the number of trees planted and add that to the setup costs.
Apply the idea
Let t represent the number of trees planted. Then we can write the cost of planting trees as 250t and the total cost of planting all of the trees as 250t + 1500.
Using the ≤ symbol to show the total cost cannot be more than $5500 we get the inequality:
250t + 1500 ≤ 5500
Reflect and check
We can also represent this inequality where the total cost and the budget are flipped to the other side of the inequality.
5500 ≥ 250t + 1500
This is tells us that the budget has to be greater than or equal to the total cost of planting the trees.
c A contractor is bidding on a job to install flooring in several rooms of a building. Each room costs $400 to install, and there are additional setup costs amounting to $1000. The contractor needs to make at least $3000 to cover their expenses and profit.
Create a strategy
We need to set up an inequality to represent the total earnings from installing the rooms, including setup costs, and ensure it is greater than or equal to the amount to cover the expenses.
Write a real-world scenario for each inequality.
a 50x ≤ 1000
Create a strategy
We can think of x as an amount that can change, and each x has to be 50 of something. All together this must be no more than 1000.
b 100 + 25p ≥ 600
Create a strategy
We can think of 100 as a fixed starting amount and p as an amount that can change. Each p must be 25 of something and the total amount cannot be less than 600.
Apply the idea
Let r be the number of rooms.
400r + 1000 ≥ 3000
c < 20
Create a strategy
We can think of b as an amount that can change, and when divided into 5 equal groups the size of each group is less than 20.
Apply the idea
A sample scenario would be “A worker is loading 50 lb bags of cement onto a truck. The total truck load weight cannot exceed 1000 lbs. Let x represent the number of bags that can fit on the truck.”
Apply the idea
A sample scenario would be “A graphic designer is creating posters for a client. She charges a one time consultation fee of $100 and each poster costs $25 to produce. The designer needs to make at least $600. Let p represent the number of posters being created.”
Apply the idea
A sample scenario would be “A baker is baking cookies for some family members. She has 5 boxes to fill with the same number of cookies in each. Each box must contain fewer than 20 cookies. Let b represent the total number of cookies she bakes.”
The smaller side of the inequality symbol matches the side with the smaller number. That is, the inequality symbol “points to” the smaller number.
The greater than symbol is >. This is an open circle on the number line and is shaded to the right.
The less than symbol is <. This is an open circle on the number line and is shaded to the left.
The greater than or equal to symbol is ≥. This is a closed circle on the number line and is shaded to the right.
The less than or equal to symbol is ≤. This is a closed circle on the number line and is shaded to the left.
1 Match each inequality symbol with its correct meaning:
a > i Less than
b < ii Less than or equal to
c ≥ iii Greater than or equal to
d ≤ iv Greater than
2 In the inequality 3x + 15 > 30, identify the variable, coefficient, constant terms, and the inequality symbol.
3 Which correctly represents the graph?
4 Identify the mathematical symbol (<, >, = ) that makes each statement true:
5 Write the following inequalities in words:
6 Write using symbols.
a Eight is greater than a number.
b A quarter is less than or equal to a number.
c A number is less than Twenty-one.
d Five and a half is greater than or equal to a number.
e A number is greater than eleven and a quarter.
f A number is less than or equal to Fifty.
g Three-fourths is less than a number.
h A number is greater than or equal to Five hundred.
7 m can take the following set of values: 11, 10, 9, 8, 7, …, and so on. Write an inequality that describes the set of values for m
8 Determine whether or not each of the following is a solution of k ≤ 17:
9 If x ≤ 4, find the largest integer value x can have.
10 If q < 0, find the largest integer value q can have.
11 If x > , find the smallest integer value x can have.
12 If n ≥ 88, find the smallest integer value n can have.
13 Graph the solution set of each inequality on a number line:
14 Write the inequality described by the following statements:
a n is greater than 9.
c n is less than 10.11.
b n is greater than or equal to 9.
d n is less than or equal to .
15 Write an inequality to represent each of the following situations:
a The width of a particular road is 5.55 yd or greater. Let w be the width of the road.
b The elevator in a building should carry less than 13 people at one time. Let p be the number of people in the elevator.
c Michael lives where it takes him at most 1.5 hours to get to work. Let x be the time it takes Michael to get to work.
d A building must be more than 160 m tall to be considered a skyscraper. Let h be the height of the building.
e The temperature inside a freezer is always below 0 °F. Let T be the temperature inside the freezer.
f In an amusement park, children below 5 years old can enter free of charge. Let c be the age of the a child that can enter the park free of charge.
g Frasier is expecting that at least 50 guests will attend his party. Let g be the number of guests in Frasier’s party.
h In a gift exchange party, the attendees must spend at most $50 on their gifts. Let x be the cost of a gift at the party.
16 Write the inequality described by the following statements:
a The sum of 3 and the product of 2 and a is greater than 0.
b The difference of 10 and the product of 5 and x is less than or equal to 20.
c Seven and a half more than the value of the product of 3.24 and x is at least 9.88.
d Eight is greater than the result of taking 7 away from the product of 3 and x
e The sum of 3.50 groups of p, and 9.12, is less than 24.70.
f The sum of 5 groups of x, and 3 is at least 23.
g A quarter more than half of x is at least seven.
h The difference of eight and four groups of x is greater than twelve.
i The sum of 5.21 and the product of 4.79 and x is greater than or equal to 28.20.
j The sum of five and half of x is no more than three.
17 Write an inequality to represent each situation:
a The maximum capacity of a water tank is 300 gallons. Currently, there are 150 gallons of water in the tank. Let w + 150 represent the amount of water that can be in the water tank.
b A parcel delivery service charges $5 for each package delivery. Let p represent the number of packages that can be delivered for $100 or less.
c A classroom can hold a maximum of 30 students. There are currently 20 students present. Let s + 20 represent the maximum number of students allowed to join the class.
d A truck would be loaded with logs and would pass through a tunnel that has a maximum clearance of 17 ft. The height from the ground to the container of the truck is 7 ft. Let h + 7 represent the maximum height of the truck including the loaded logs.
e You plan to buy a bike costing $10 000.00 using your savings. However, you want to ensure that your balance would not fall below $20 000.00. Let s 10, 000 represent the savings balance after deducting the cost of the bike.
f Carrera has a trucking business with a delivery truck that can accommodate a maximum of 12 000 lbs. There’s a total of 80 000 lbs to be delivered and she needs to know the number of trucks needed (t).
Let represent the number of trucks.
18 Write an inequality to represent each situation:
a Zcarina is at a go-kart park. Renting a go-kart would cost $15 per lap and a one-time fee of $10. She has a budget of $50. Let 15l represent the cost per lap.
b You ordered a bulk of compost. Only half of it would be used for your current garden project. Of the said half, an amount equivalent to 5 pots would be set aside, leaving you with more than 15 pots’ worth of compost. Let represent the amount of compost for the current project.
c A candy store at a festival offers a discount of $5.75 for the first 100 customers. A single box costs $29.99. Marieanna is 50th in line, and she has $55.25 with her. Let 29.99b represent the initial cost of chocolate.
d Renting a music band would cost $15 000 per member plus other costs amounting to $10 000. A couple plans to rent a music band, thinking that their budget of $100 000 is more than sufficient to cover the costs. Let 15 000m represent the cost per member.
e A group of five friends plans to avail a tour package. A certain travel company offers different packages, all with an additional environmental fee of $200. The group plans to divide the total cost equally among themselves and estimates that each would contribute no more than $800. Let p + 200 represent the total cost of the tour package.
f A freezer is currently at 18 °C. Each turn of the dial lowers the temperature by another 5 °C. To freeze a certain product within an hour, you need to set the temperature to more than 30 °C. Let d represent the number of turns of the dial needed.
19 A certain bank requires that a savings balance should not go below $100. Let b represent the balance.
a Write an inequality to represent the scenario.
b Justify your answer in part a.
20 Create a verbal situation in a real-world context for each inequality:
21 Which of the number lines correctly represents the solution set of the inequality 2x + 3 < 7?
22 Clara tried to plot the solution to the inequality x + 8.4 < 5.9 on a number line, however, her answer is incorrect.
Identify and explain how to correct the error.
23 Given the inequality x + 4 > 9, write an equivalent equation replacing the inequality symbol and solve. How is the solution of the equation different from the solution of the inequality?
24 Consider the statement:
The sum of three times a number and 11 is less than 22.
a Write an inequality.
b Solve
c Graph the solution set on a number line.
25 Jack is saving up to buy a smartphone that is selling for $510. He has $210 in his bank account and expects some money for his birthday next week and some money from his parents for his allowance.
The amount he is about to receive for his birthday is represented by x and the amount of money he is about to receive for his allowance is represented by x + 50.
a Write an inequality that models the situation where he is able to afford the smartphone.
b How is the solution to the equation different from the inequality?
26 To get a grade of C, Luke must obtain a total score of at least 300 over his four exams. So far, he has taken the first two exams and achieved scores of 65 and 97. If x represents what he must score on the third exam and x + 18 represents what he must score on the last exam to get a C or better, write an inequality to represent the given data.
27 Sandy has a budget for school supplies of $46, but has already spent $12.10 on books and $6.80 folders. Let p represent the amount that Sandy can spend on buying pencils and p + 5 on buying notebook paper. Write an inequality that models the situation where she is able to buy the supplies given the budget.
28 Which number line correctly represents the inequality 4 < x < 5?
29 Write a survey question that involves an age restriction for participants. Write the inequality representing the age restriction.
30 Given the inequality representing the temperature (T ), necessary for water to freeze, T ≤ 0 °C, extend this to create a real-world problem involving the temperature at which a particular salt water solution freezes, knowing that salt water freezes at a lower temperature than water.
31 Given the inequalities x + 5 > 10 and 2x ≤ 8, compare their solution sets and discuss under what conditions the sets might overlap.
Division property of inequality
Division property of inequality (by a negative number)
If a < b and c > 0, then < If a > b and c > 0, then >
if a < b and c < 0, then > if a > b and c < 0, then <
Let’s compare the equation 2x = 8 and the inequality 2x > 8.
We will start by solving the equation 2x = 8
Division property of equality (divide by 2)
Evaluate the division
This equation has exactly one solution, x = 4. We can graph the solution of 2x = 8 on the number line like this: 8 7 6 5 4 3 2 1 0
This number line shows that there is only one solution to the equation, x = 4. Next, let’s solve the inequality 2x > 8.
Division property of inequality (reverse the inequality symbol)
Evaluate the division
We can graph the solution of 2x > 8 on the number line like this: 8 7 6 5 4 3 2
This number line shows that there are many solutions to the inequality, including any number that is less than, but not equal to 4.
We can verify solutions algebraically, by substituting the value of x back into the equation or inequality. Let’s verify the solution to the equation 2x = 8. We found that the solution was x = 2.
2 ( 4) = 8
8 = 8
Substitution
Evaluate the multiplication
After substituting the value and evaluating the equation, we are left with 8 = 8. This is true, so the answer is correct.
To determine if a value is a solution to the inequality, we can substitute values to determine if they are true. Inequalities can have multiple solutions, so let’s see if x = 2 satisfies the inequality 2x > 8.
2 ( 2) > 8
4 > 8
Substitution property
Evaluate the multiplication
We can read this as “4 is greater than 8” which is not true. x = 2 is not a solution to the inequality 2x > 8.
Consider the inequality 1 + x < 2.
a Solve the inequality for x.
Create a strategy
We solve an inequality by isolating x on one side of the inequality.
Apply the idea 1 + x < 2
Start with the given inequality 1 1 + x < 2 1
Subtraction property of inequality x < 1
Evaluate the subtraction
b Now plot the solutions to the inequality 1 + x < 2 on the number line below.
Create a strategy
Use the < symbol to identify what type of endpoint to use and which direction to shade.
Apply the idea
The inequality x < 1 means that x can have any value less than but not equal to 1.
To show that 1 is not part of the solution, we will plot the point at 1 with an open (unfilled) circle. To show all values that are less than 1, we draw a ray from 1 pointing to the left.
Consider the inequality 4 < 2m a Solve the inequality.
Create a strategy
Solve the inequality by isolating m on one side of the inequality.
Apply the idea
b Now plot the solutions to the inequality 4 < 2m on the number line below.
Start with the given inequality Division property of inequality
Evaluate the division
Create a strategy
Rewrite the inequality first so that we would have the variable on the left side. This would make understanding the variable easier.
Take note that when rewriting or switching the values on both sides of inequalities, we also switch the inequality symbol.
Then identify what the inequality means before plotting on the number line.
Apply the idea
Rewrite the inequality: m > 2
The inequality m > 2 means that m can have any value greater than but not equal to 2.
To show that 2 is not part of the solution, we will plot the point at 2 with an unfilled circle. To show all values that are greater than 2, we draw a ray from 2 pointing to the right.
Determine whether c = 2 satisfies the inequality c + 3 < 4.
Create a strategy
Substitute the value of c into the inequality. The value on the left hand side should be less than 4.
Apply the idea
c + 3 < 4
2 + 3 < 4
1 < 4
Start with the given inequality
Substitution property
Evaluate the addition 1 is less than 4 so c = 2 satisfies the inequality.
Reflect and check
Substituting the possible solution back into the inequality to see if the inequality remains true is a helpful strategy for checking your work.
Solve ≥ 5 for x
Apply the idea
Start with the given inequality
Multiplication property of inequality (reverse inequality symbol)
Multiplicative inverse
Evaluate the multiplication
Reflect and check
When we multiply both sides by 2, we must reverse the inequality symbol. If we had not reversed the symbol, we would have gotten:
Let’s use the substitution property to check if a number in the solution set will satisfy the inequality. Let’s use x = 6, because it would be in the solution set for x ≥ 10.
Start with the original inequality
Substitution property
Evaluate the division
Evaluate the multiplication
Because 3 is not greater than 5 or equal to 5, this solution set is invalid. This shows the importance of reversing the inequality sign when multiplying or dividing by a negative number.
Compare the process for solving 4.5x = 27 and 4.5x > 27 and their solution sets.
Create a strategy
Begin by solving the equation and the inequality, then compare their solutions.
Apply the idea
First, we will solve the equation 4.5x = 27.
Start with the given equation
Division property of equality
Evaluate the division
The solution is x = 6
Next, we will solve the inequality 4.5x > 27.
Start with the given inequality
Division property of inequality
Evaluate the division
The solution is x > 6
Both processes are very similar in how they use properties of equality and inequality. They also both have the number 6 related to their solutions.
The difference is in the actual solution sets. The equation has only one value, x = 6, in its solution set. On a number line it looks like this:
The inequality has a range of values in its solution set. It is all values greater than 6 so, unlike the equation, x = 6 is not a part of the solution set.
You have $18 and you want to buy some slices of cake.
a If a slice of cake costs $5, write an inequality to find how many cake slices you can buy.
Create a strategy
Let x represent the number of cake slices. The total number of slices you can buy is limited by the money you have, so we should set up the inequality to show that the amount you can spend is less than your budget.
Apply the idea
b Solve the inequality you wrote in part (a).
Create a strategy
Solve the inequality by isolating x to one side of the inequality.
the
Inequality from part (a)
Division property of inequality
Evaluate the division
Since you can’t buy a portion of a cake slice, the number of cake slices you can buy is 3 at most.
The properties of inequality are used when solving inequalities:
Addition property of inequality
Subtraction property of inequality
Multiplication property of inequality
Multiplication property of inequality (by a negative number)
Division property of inequality
Division property of inequality (by a negative number)
If a < b, then a + c < b + c
If a > b, then a + c > b + c
If a < b, then a c < b c
If a > b, then a c > b c
If a < b and c > 0, then a c < b c
If a > b and c > 0, then a ⋅ c > b ⋅ c
If a < b and c < 0, then a c > b c
If a > b and c < 0, then a ⋅ c < b ⋅ c
If a < b and c > 0, then <
If a > b and c > 0, then >
if a < b and c < 0, then > if a > b and c < 0, then <
Remember, when multiplying or dividing both sides of an inequality by a negative number, you must reverse the inequality symbol so the inequality stays true.
1 For each of the following operations:
i Write the new inequality. ii State whether the new inequality still holds true.
a Add 6 to both sides of the inequality 7 < 10.
b Add 3 to both sides of the inequality 4 > 2.
c Subtract 5 from both sides of the inequality 1 < 3.
d Subtract from both sides of the inequality
e Multiply both sides of the inequality 5 < 7 by 2.
f Divide both sides of the inequality 5 > 2 by 6.
g Multiply both sides of the inequality 5 ≤ 10 by 2.
h Divide both sides of the inequality 24 ≥ 18 by 3.
2 Determine whether the following values satisfy the inequality x + 3 > 5:
a x = 1 b x = 3
c x = 9 d x = 2
e x = 5 f x = 0 g x = 12 h x = 2
3 Given an inequality x > 3. Which options satisfy the inequality?
4 Choose the correct symbol to represents:
a 5 is less than 12. Then there is 5 ⬚ 12.
c y is less than or equal to 5. Then there is y ⬚ 5.
b 9 is greater than 7. Then there is 9 ⬚ 7.
d 15 is equal to 15. Then there is 15 ⬚ 15.
e 2x is greater than or equal to 10. Then there is 2x ⬚ 10.
f 6a is greater than 4a. Then there is 6a ⬚ 4a.
5 Identify the property used in the following statements.
a If 5 + x > 7, then x > 2.
c If 3x = 12, then x = 4.
e If < 8, then x < 80.
b If x 3 = 9, then x = 12.
d If 3x ≤ 18, then x ≤ 6.
f If 4y ≥ 20, then y ≥ 5.
6 Represent each of the following inequalities on a number line:
> 3
7 Write the inequality of the following situations.
a Andrei need at least $40 to buy a game. If x represents Andrei’s money.
b The freezer compartment of your refrigerator can hold up to 30 kg of food. If x represents the weight of food in kilograms you place in the freezer.
c Your phone’s data plan allows up to, but not including, 5GB of data usage per month to avoid extra charges. If x represents the amount of data you’ve used.
d A recipe requires more than 6 cups of flour to make a batch of cookies. If x represents the cups of flour you have.
8 Solve: a x + 7 = 11 b x 5 = 3 c 6x = 36 d = 2
practice
9 Explain why the inequality sign flips when we multiply both sides of < 4 by 1.
10 a Solve x 14 < 5.
b Choose the correct values from the following list that satisfy the inequality. 10, 15, 18, 19, 20
11 For each of the following:
i Write the inequality described by the statement.
ii Solve for the value of x
iii Check the solution.
a Seven more than the value of x is at least nine.
b Half of x is no more than four.
c Eight is greater than the result of taking seven away from x
d Negative eight multiplied by x is less than three.
13 Solve:
15 Match the inequality with the correct answer:
16 For each of the following: i Solve the inequality. ii Graph the solution of the inequality on a number line.
17 For each of the following: i Solve the inequality. ii Graph the solution of the
18 Write the inequality that matches that graph.
19 You have $15. Write an inequality to find how many $3 sandwiches you can buy.
20 Compare solving 2x + 5 = 15 and 2x + 5 > 15.
21 Solve 12 > 4 + x using properties of inequality, and justify each step.
22 Is a = a solution of a + < 12? Explain your answer.
23 Is y = 0.85 a solution of 5.69 y > 3.65? Explain your answer.
24 Given that a is a positive integer, determine whether the following operations maintain the inequality x ≥ 6.5:
a Adding or subtracting a to both sides of the inequality.
b Multiplying or dividing both sides of the inequality by a
c Multiplying or dividing both sides of the inequality by a
d Adding or subtracting a to both sides of the inequality.
25 Given that a is a negative integer, determine whether the following operations maintain the inequality x ≤ :
a Adding or subtracting a to both sides of the inequality.
b Multiplying or dividing both sides of the inequality by a
c Multiplying or dividing both sides of the inequality by a
d Adding or subtracting a to both sides of the inequality.
26 Jack is moving dirt out of his back yard to build a patio. Every week (w) he removes two square yards of dirt to create a hole represented by 2. He needs to remove at least 30 square yards to be ready for the patio. Write an inequality to represent this situation.
27 Solve:
After this lesson, you will be able to...
• solve two-step inequalities using properties of real numbers and properties of inequality.
• identify values in the solution set of a two-step inequality.
• compare solving two-step inequalities to solving two-step equations.
Let’s look at the inequality 3x + 2 ≥ 14 and think about the order of operations. We can see that the operations applied to the variable x are:
• First multiply by 3
• Next add 2
To solve this inequality, we want to undo these operations in reverse order. So we will:
• First, subtract 2 from both sides
• Next, divide both sides by 3 (and reverse the inequality symbol)
All together this looks like:
Given inequality
Subtraction 2 from both sides
Evaluate the subtraction
Divide both sides by 3 (reverse the inequality sign)
Evaluate the division
We found that x ≤ 4. We can test some values in the given inequality to see if the solution set is true. Let’s try the numbers just above and below 4, say x = 5 and x = 3.
• When x = 5, we have 3x + 2 = 3 ( 5) + 2 = 17, which is greater than or equal to 14.
• When x = 3, we have 3x + 2 = 3 ( 3) + 2 = 11, which is not greater than or equal to 14.
So, our result of x ≤ 4 seems to be correct. We can also graph this on the number line. For x ≤ 4, we will include 4 on the number line as a filled circle and a ray pointing to the left side. 8
Let’s compare how we solved that inequality to how we solve a similar equation, 3x + 2 = 14.
Given equation
Subtraction 2 from both sides
Evaluate the subtraction
Divide both sides by 3
Evaluate the division
We can check the solution to the equation using the substitution property.
3( 4) + 2 = 14
12 + 2 = 14
14 = 14
Substitution property
Evaluate the multiplication
Evaluate the addition
Because 14 = 14, our solution is correct. We can graph the solution to the equation as a single point on a number line like this:
8 7 6 5 4 3 2 1 0 1 2 3 4
This graph differs from the graph of the solution to 3x + 2 ≥ 14 because the solution to the equation 3x + 2 = 14 is only one value while the solution set for the inequality contains an infinite number of values.
Given 3x + 27 > 3 a Solve the inequality.
Create a strategy
Solve the inequality by isolating x on one side of the inequality.
Apply the idea
Subtraction property of inequality
Evaluate the subtraction
Division property of inequality
Evaluate the division
b Determine if 8 is a solution to the inequality.
Create a strategy
Determine if 8 is included in the possible values of x using the answer from part (a).
Apply the idea
We know that x is any value that is greater than but not equal 8 when we solved the inequality in part a.
So, 8 is not solution to the inequality.
Solve the following inequality:
Create a strategy
Reflect and check
We can also substitute 8 into the given inequality.
3 ( 8) + 27 27 > 3 27
24 > 24
Substitute x = 8
Evaluate 24 is not greater than 24, so 8 is not a solution to the inequality.
Solve the inequality by isolating a on one side of the inequality.
Apply the idea
Subtraction property of inequality
Evaluate the subtraction
Multiplication property of inequality
Evaluate the multiplication
Reflect and check
If what was given were an equation instead, we would have solved it similarly:
Subtraction property of equality
Evaluate the subtraction
Multiplication property of equality
Evaluate the multiplication
Then we can just flip the equation to have the variable on the left side: a = 5.72
However, if we do this with the given inequality, we need to reverse the inequality sign because we reversed the order of the entire inequality. So, using the symmetric property of inequality we can rewrite the solution as a > 5.72
Consider the inequality 7 x > 13. a Solve the inequality.
Create a strategy
Solve the inequality by isolating x on one side of the inequality.
Apply the idea
Addition property of inequality
Evaluate the addition Multiplicative identity
Division property of inequality, reverse the inequality sign
Evaluate the division
Reflect and check
If we had forgotten to reverse the inequality sign, we would have been left with an inequality that was not true. We would have gotten a solution of x > 20, let’s test a point that satisfies the inequality to see if it is true. We can use x = 4 to test.
7 (4) > 13
11 > 13
Substitution property
Simplify 11 ≯ 13, so the inequality is false.
b Now, plot the solutions to the inequality 7 x > 13 on a number line.
Create a strategy
Plot the inequality from part (a) on the number line.
Apply the idea
The inequality x < 20 means that x can have any value less than but not equal to 20.
To show that 20 is not part of the solution, we will plot the point at 20 with an unfilled circle. To show all values that are less than 20, we draw a ray from 20 pointing to the left.
25 24 23 22 21 20 19 18 17 16 15
Reflect and check
We can verify that we plotted the solution to the inequality correctly by selecting a value from the portion of the number line covered by the ray.
Let’s use 22 as an example.
7 ( 22) > 13
Substitute x = 22
15 > 13 Evaluate 15 is indeed greater than 13, so we correctly plotted the solution on the number line. Let’s also use 20 to verify that its not part of the solution.
7 ( 20) > 13
Substitute x = 20
13 > 13 Evaluate 13 is not greater but equal to 13, so we are correct to exclude 20 when plotting the solution by using an unfilled circle.
In an ecological park, you were assigned to manage the number of people who can go through the underground cave. According to safety guidelines, no more than 10 people can be in the cave at a time. Write an inequality to represent the number of people that can go through the underground cave at a time, given that there are 2 accompanying guides for each group going.
Let p represent the number of people. We should set the inequality to show that total number of people ( p) going through the underground cave cannot be more than 10, including the accompanying guides.
When solving any inequality:
The cave can have 10 total people or less than that so we need to use ≤ p + 2 ≤ 10
• Multiplying or dividing both sides of an inequality by a negative number reverses the inequality symbol.
• Writing an inequality in reverse order also reverses the inequality symbol.
When solving an inequality with two (or more) operations:
• It is generally easiest to undo one operation at a time, in reverse order to the order of operations.
1 For the inequality x 8 > 4, which values of x are valid?
A x = 4
E x = 12
2 Select the property that justifies the step from 3x + 4 < 12 to 3x < 8.
A Addition Property of Inequality
C Multiplication Property of Inequality
3 Express each statement as an inequality:
a A number decreased by 11 is greater than 20.
b A number increased by 7 is less than 2.
B Subtraction Property of Inequality
D Division Property of Inequality
c The sum of a number and is greater than or equal to
d The difference between a number and 6.72 is less than or equal to 2.24.
4 Identify the inverse operation used to isolate the variable in order to solve each inequality.
5 Identify the inverse operation that is used first to solve each inequality: a 9.11k
3
6 Solve the inequalities:
7 State whether the following statements are equivalent to 3 x ≥ 5:
8 Consider the inequality 21 + 7x > 21:
a Solve the inequality.
b State whether the following values of x satisfy the inequality:
9 Consider the inequality 6 (x + 2) ≤ 48:
a Solve the inequality.
b State whether the following values of x satisfy the inequality:
10 Solve:
11 Match each inequality to its solution.
a 20x 42 ≤ 98 i x ≤ 10
b ii x > 101
c 20 15x ≥ 130 iii x ≤ 6
d 625 ≤ 115 85x iv x ≤ 7
12
Match each inequality to its solution.
a i x < 5
b ii x < 6
c iii d iv x > 4
13 Solve:
14 If x = 2.5 is a solution to the inequality 5.1x 3.4 < 10.6, verify by substitution.
15 Compare solving 8x + 6 = 74 with solving 8x + 6 > 74.
16 Graph the solution set of each inequality on a number line: a x + 8 ≤ 10
17 For each of the following: i Solve the inequality.
ii Graph the solution to the inequality on a number line.
a 2x 2 < 6
3 < 4x 1
18 Write the inequality required on each scenario.
a You and your sister are participating in an Easter egg hunt in the neighborhood park. To secure a win, you both aim to find a combined total of at least 25 eggs. However, the organizers have included 10 “minus” eggs, which would be subtracted from your total count. Write an inequality to represent the total number of eggs you both need to find, accounting for the “minus” eggs, in order to guarantee a win
b You are at an amusement park and you can stay no more than 10 hours. Write an inequality to represent how many rides you can enjoy if each ride takes you 2 hours from lining up to the end of the ride.
c You are responsible for managing visitors crossing a suspension bridge in a forest park, which has a capacity limit. According to the signboard, the total number of people who can cross simultaneously should be less than 5. Write an inequality to represent the number of visitors that can cross the bridge at a time, given that there is 1 accompanying guide for each group crossing.
d You booked a flight with a baggage weight limit of 20 kg. You have 3 small suitcases to pack your belongings. Write an inequality to represent the maximum weight each suitcase should have to avoid exceeding the weight limit.
19 Isabelle tried to solve the inequality shown but made a mistake in her work. Determine which step is incorrect and explain the error.
20 Norton tried to solve the inequality shown but made a mistake in his work. Determine which step is incorrect and explain the error.
21 Write the corresponding inequality for each number line. a b
22 Explain how the solution set changes when both sides of the inequality > 4.1 are 2.7 multiplied by 2.7.
23 Solve each inequality. Write answers as mixed numbers for fractions and up to two decimal places for decimals.
5y 20 < 30 y
24 Tyesha tried to graph the solution to the inequality on a number line. However, her answer is incorrect:
Determine the error(s) and explain how to fix them.
25 Percy tried to graph the solution to the inequality on a number line. However, his answer is incorrect.
Determine the error(s) and explain how to fix them.
26 If a group of friends needs at least $125 to fund a trip, and they already have $50, write and solve an inequality for the amount each of the 15 friends needs to contribute.
After this lesson, you will be able to...
• write and solve a one- and two-step inequalities representing real-world situations.
• identify values in the solution set of one- and two-step inequalities that make sense for the real-world situation.
Much like solving equations from real-world problems, there are certain keywords or phrases to look out for. When it comes to inequalities, we now have a few extra keywords and phrases to represent the different inequality symbols.
Keywords:
• > greater than, more than.
• ≥ greater than or equal to, at least, no less than.
• < less than
• ≤ less than or equal to, at most, no more than.
When working to solve problems always be sure to check your answer to see if it is reasonable and then check it by substituting into your inequality.
Consider the following situation:
“The sum of 2 groups of x and 1 is at least 7.”
a Construct and solve an inequality for the given situation.
Create a strategy
Translate the phrases into mathematical symbols then solve the inequality by isolating the x on side of the inequality.
Apply the idea
The phrase “at least” means the same as “greater than or equal to”, “groups of” means multiplication, and “sum” means addition.
Write the inequality
Subtract 1 from both sides
Simplify
Divide both sides by 2
Simplify
Using a number line, the solution to this inequality is:
So, the possible values of x are those that are greater than or equal to 3.
b Does the solution x = 3 satisfy the inequality?
Create a strategy
Substitute the value of x into the inequality and evaluate.
Apply the idea
2x + 1 ≥ 7
2 ( 3) + 1 ≥ 7
6 + 1 ≥ 7
5 ≥ 7
Substitution property
Evaluate the multiplication
Evaluate the addition
Because 5 ≱ 7, x = 3 does not satisfy the inequality and is not a solution.
Lachlan is planning on going on vacation. He has saved $2118.40, and spends $488.30 on his airplane ticket.
a Let x represent the amount of money Lachlan spends on the rest of his holiday. Write an inequality to represent the situation, and then solve for x
Create a strategy
The amount of money that he can spend on his holiday is up to but not more than the difference between his savings and the amount spent on the airplane ticket. Translate this information into mathematical symbols.
Apply the idea
The phrase “up to but not more than” means that we are going to use the ≤ symbol and the phrase “difference between” means subtraction.
x ≤ 2118.40 488.30 Write the inequality
x ≤ $1630.10 Evaluate
b What is the most that Lachlan could spend on the rest of his holiday?
Create a strategy
Determine the largest value of the inequality from part (a) by recalling the definition of inequality symbol.
Apply the idea
The inequality x ≤ $1630.10 means that x can take any value that is less than or equal to $1630.10. So, the maximum amount that Lachlan can spend on his holiday is $1630.10.
At a sport clubhouse the coach wants to rope off a rectangular area that is adjacent to the building. He uses the length of the building as one side of the area, which measures 26 meters. He has at most 42 meters of rope available to use.
If the width of the roped area is W, form an inequality and solve for the range of possible widths.
Create a strategy
Translate the given information into mathematical symbols and use the perimeter equation to solve for the possible width of the rope.
Apply the idea
One side of the roped area is the length of the clubhouse. So, the situation looks something like this:
The length of the roped area is equal to the length of the clubhouse which is 26 meters.
Rope perimeter is equal to the sum of two widths and the length
Substitute the values and variables
Subtract 26 from both sides
Simplify
Divide both sides by 2
Simplify
The maximum width should be 8 meters to be able to use all of the 42-meter rope and we will have enough.
The student government association is planning a seventh grade dance as a fundraiser. It costs $250 to pay for the DJ and decorations. Tickets to the dance cost $8 each. How many tickets must they sell to raise at least $1000?
Create a strategy
Translate the given information into an inequality and use that to determine how many tickets they must sell.
Apply the idea
Each ticket costs $8, so that will be the value that is multiplied by the variable t. The cost of the DJ and decorations must be subtracted from the amount they raise. They need to raise at least $1000, so their amount must be greater than or equal to $1000, so we will use the symbol ≥
We can use the inequality 8t 250 ≥ 1000 to find how many tickets they must sell.
Addition property of inequality
Simplify
Division property of inequality
Simplify
The student government association must sell at least 156.25 tickets. Since tickets must be sold in whole amounts, they must sell 157 tickets or more.
Consider the following inequality: 3.7 + 8x ≥ 19.5
a Create a real-world scenario that could be represented by the equation.
Create a strategy
We know that x represents a quantity that will occur more than once and 3.7 only occurs once. The total of those amounts must be greater than or equal to 19.5.
Apply the idea
Here is one possible scenario: Luella needs to log at least 19.5 hours in her reading log. So far, she has logged 3.7 hours. She has eight days left to reach her goal. This inequality will help determine the amount of hours Luella needs to read in the remaining time to reach her goal. x represents the number of hours spent reading each day.
b Solve the inequality and explain the answer in context to the scenario you created.
Create a strategy
Use the properties of inequality to solve the inequality.
Apply the idea
3.7 + 8x ≥ 19.5
3.7 3.7 + 8x ≥ 19.5 3.7
Subtraction property of inequality 8x ≥ 15.8 Evaluate the subtraction
≥ Division property of inequality
x ≥ 1.975 Evaluate the division Luella needs to read at least 1.975 hours per day to reach her goal.
Reflect and check
We can check our solution by substituting the value we found for x back into the inequality.
3.7 + 8x ≥ 19.5
3.7 + 8 (1.975) ≥ 19.5 Substitution property
3.7 + 15.8 ≥ 19.5 Evaluate the multiplication
19.5 ≥ 19.5 Evaluate the addition
Keywords and phrases to represent the different inequality symbols:
• > greater than, more than.
• ≥ greater than or equal to, at least, no less than.
• < less than.
• ≤ less than or equal to, at most, no more than.
1 The table shows the times of six swimmers in a 1500 m race. Only those who achieve a time of 22 minutes or below qualify for the final.
Use the inequality t ≤ 22, where t is the time of each swimmer, to find all of the swimmers who qualify for the final.
2 Translate the following into an inequality:
a The number of book, b, is greater than 15.
b The amount of water in liters, w, is at most 20.
c The height in centimeters, h, is more than or equal to 170.
d The speed in kilometers per hour, s, is less than or equal to 90.
3 Identify the correct inequality sign:
a A number x is less than 5.
b The sum of a number y and 7 is greater than 12.
c Three times a number n at most 15.
d Two subtracted from a number m is more than or equal to 8.
e The product of 4 and a number z is less than or equal to 20.
f A number k divided by 5 is greater than 3.
Swimmer Time (minutes)
4 For each of the following: i Solve the inequality. ii Graph the solution on a number line.
5 Solve the equation 3y 4 = 11.
6 Fill in the blanks:
2x 5 > 7 Given equation 2x 5 + ⬚ = 7 + ⬚ Add ⬚ to both sides to isolate the term x 2x = ⬚ Simplify both sides
x = Divide both sides by ⬚ to solve for x x > ⬚ Final solution
7 Write and solve an inequality for the following statements:
a 5 groups of p, added to 5, is less than 25.
b The sum of 2 groups of x and 1 is at least 9.
c 8 times x minus 5 is less than 35.
d 5 subtracted from 4 groups of n is greater than 11.
e 5 more than one half of p is less than 103.
f 24 less than one quarter of z is less than or equal to 2.
g 3 groups of y divided by 4 is less than or equal 6.
h The sum of m and 10 divided by 2 is greater than 12.
8 Consider the following statement: “Two less than 4 groups of p is no more than 18”.
a Write and solve the inequality.
b Find the greatest value of p that satisfies this condition.
9 Lesley gets paid $12.50 for each sale, plus a base salary of $245.75 per week. Lesley wants to earn at least $605.75 this week.
a Let x be the number of sales. Which inequality models the problem?
A 12.5x + 245.75 > 605.75
C 12.5x + 245.75 < 605.75
b Solve for x
B 12.5x + 245.75 ≥ 605.75
10 The dance committee of Perk Middle School earns $57.50 from a bake sale and will earn $3.50 for each ticket they sell to the Spring Fling dance. The dance will cost $250.
a Which inequality correctly determines the number of tickets, t, the committee needs to sell to have money left over after paying for this year’s dance?
A 3.5t + 57.50 < 250
b Solve for t
11 Neil has $256. He earns $10.60 for each hour that he works at a restaurant. He wants to earn enough money to buy a new laptop for $658.80.
a Which inequality determines the number of hours, h, Neil needs to work to have enough money to buy the new laptop?
A 10.6h + 256
b Solve for h
12 Sarah is gathering signatures on a petition to save the orangutans. She needs at least 9000 signatures to get mentioned on the “Save the Orangutans” website. If she gets 300 less than 3 times the number of signatures that she has right now, she will achieve her goal.
a Write an inequality where n represents the number of signatures Sarah has now.
b Solve for n.
c Graph the solution for n on a number line.
13 At a sports clubhouse, the coach wants to rope off a rectangular area that is adjacent to the building. He uses the length of the building as 13.5 yd. He has at most 42.75 yd of rope available to use.
a If the width of the roped area is W, write an inequality that models the situation.
b Solve for the range of possible widths, W.
c Graph the solution for the possible widths W on a number line.
14 Oprah charges $34.50 to style hair, as well as $4 per foil. Pauline would like a style and foil, but has no more than $58.50 to spend.
a If N represents the number of foils Pauline could get, write an inequality that models the situation.
b Solve for N.
c Graph the solution for N on a number line.
15 Hiro and Nico earned a team badge that required their team to collect no less than 1000 cans for recycling. Nico collected 186 more cans than Hiro did.
a Write an inequality to determine the number of cans, H, that Hiro could have collected.
b Solve for H
c Graph the solution for H on a number line.
16 Skye was given $72 for a birthday present. This present, along with earnings from a Saturday job, is being set aside for a mountain bike. The job pays $5.00 per hour and the bike costs $379.
a Write an inequality to find the minimum number of hours that Skye needs to work to be able to buy the mountain bike, where h represents the number of hours worked.
b Solve for h. Round your answer to one decimal place.
c If Skye can only work her job for a whole number of hours, find the minimum number of hours she must work to afford her bike.
17 Sean wants to save up enough money so that he can buy a new sports equipment set, which costs $50.00. Sean has $15.50 he saved from his birthday. In order to make more money, he plans to wash neighbors’ windows for $2 per window.
a Let w be the number of windows that Sean washes. Write an inequality to find the minimum number of windows he needs to wash in order to afford the equipment set.
b Solve for w
c Find the minimum whole number of windows that Sean must wash to be able to afford the set.
18 James wants to order some books from an online bookstore. Each book costs $13.30 and shipping for the entire order is a flat rate of $29.05. James can spend no more than $74.00.
a If B represents the possible number of books that James can buy, write an inequality that models the situations.
b Solve for B. Round your answer to one decimal place.
c Find the maximum number of books that James can afford to buy.
19 James is saving up to buy a laptop that is selling for $590. He has $410 in his bank account and expects a nice sum of money for his birthday next month.
a His Mother give him twice as much money his Father gave on his birthday. Let x be the amount of money he received from his Father. Write an inequality that models the situation in which James can afford the laptop.
b Solve for x
c Plot the solution to the inequality on a number line.
20 Given the inequality 2.2x + 1.5 ≤ 6.5, create a real-world scenario it could represent.
21 Given the inequality 2.75y 4.25 ≥ 13.75, create a real-world scenario it could represent.
22 Ryan is trying to break his own record for eating a burger in 10 minutes. He needs to eat more than 25 burgers to break his record. After 1 minute, Ryan has eaten burgers. Let b represent the number of burgers Ryan eats per minute for the next 9 minutes.
a Write an inequality that represents the number of burgers per minute Ryan could eat for the last 9 minutes to break his record?
b Will Ryan break his record if he eats 2 burgers per minute for the next 9 minutes? Justify your reasoning.
23 Hiro is saving up to buy a tablet that is selling for $890. He has $501.50 in his bank account and expects a sum of money for his birthday next month from his parents.
a His mother gave him x amount of money while his father gave him twice as much money his mother gave. Write an inequality that models the situation.
b The graph shows the solution to the inequality. Describe the graph based on the context.
24 A particular bus can carry a maximum weight of 9500 lb on board. If the average adult passenger weighs 150.75 lb and the driver weighs 160.85 lb, then the number of passengers on board the bus at any one time must satisfy 150.75a + 160.85 ≤ 9500, where a represents the number of adult passengers.
a There are 58 adults already on board and 8 more at the bus stop waiting to get on. Find the combined weight of everyone on board if the driver lets all of the new passengers on.
b Can the driver safely let all of the new passengers on board?
25 Given the inequality 5.2y + 2.31 < 34.03, create the following:
• Verbal Representation Solution
• Algebraic Representation Solution
• Graphical Representation Solution
Discuss how they relate.
26 Melanie is planning a garden party for her friends. She wants to prepare individual gift bags for each guest. Each gift bag’s materials cost $4.75, and she has already spent $20 on decorations for the party. Melanie has a budget of no more than $100 to spend on both the decorations and the gift bags.
Melanie provided this inequality to represent this scenario:
4.75g + 20 > 100 where g represents the number of gift bags Melanie can prepare.
a Explain why the given inequality is incorrect in the context of Melanie’s budget for the garden party.
b Write the correct inequality that models the situation, taking into account Melanie’s total budget for the gift bags and decorations.
c Discuss why your provided inequality correctly represents Melanie’s situation and budget constraints.
27 Tara is organizing a charity run to raise funds for a local animal shelter. The registration fee for each participant is $25. Tara hopes to raise at least $1000 through the event. Before the event, she spends $150 on promotional materials and refreshments.
Tara believes that if she gets 35 participants, she will meet her fundraising goal, represented by the inequality 25p 150 ≥ 1000, where p represents the number of participants. The graphical representation is shown below:
a Explain why the graphical representation of the inequality is incorrect based on Tara’s fundraising goal and initial expenses.
b Provide a correct graphical representation of the inequality that models Tara’s situation, including her initial expenses and fundraising goal.
c Discuss how your corrected graphical representation accurately models the situation and meets the fundraising goal after accounting for initial expenses.
28 When breeding certain types of fish, it is recommended that the number of female fish is more than double the number of male fish.
a Write the inequality for the recommended relationship. Let f be the number of female fish and m be the number of male fish.
b State whether the following combinations align with the recommendation, using decimals and fractions where appropriate.
i f = 10.5, m = 4.25 ii f = , m = iii f = 12.75, m = 6.5 iv f = , m =
Big ideas
• Models may be used to simulate real-world situations and can inform predictions and decisions.
• Probability helps us analyze the chance that an event will occur and provides us with tools to make decisions about the future based on known information.
• Collecting and analyzing data can inform predictions and decisions, as long as the data is based on a valid sample.
• Different representations of data highlight different characteristics of the data.
After this lesson, you will be able to...
• define probability.
• describe the likelihood of an outcome.
• identify all the outcomes in a sample space.
Probability is the study of chance and prediction. To make sure our predictions are valid, we need to use the right mathematical language.
In general, we will be thinking about a single test, known as a trial that has more than one possible result, known as an outcome. A trial is a repeated part of an experiment that is repeated over and over. A good example is flipping a coin:
We say that flipping the coin is a trial, and there are two equally likely outcomes: heads and tails. The list of all possible outcomes of a trial is called the sample space
Another example of a trial is rolling a die:
A single die All possible faces
There are 6 equally likely outcomes in the sample space: 1, 2, 3, 4, 5, and 6. We can group these outcomes into events, such as “rolling an even number” or “rolling more than 3.” Each outcome on its own is always an event, and sometimes events do not correspond to any outcomes.
We can think about different kinds of events that we care about, and sort them into categories of likelihood. The likelihood of an event depends on what happens when you repeat the trial many times.
• Impossible: no outcomes correspond to the event
• Unlikely: the event happens less than half the time
• Equally likely: the event happens the same number of times as the other events
• Likely: the event happens more than half the time
• Certain: every outcome corresponds to the event
Here are some examples when rolling a die:
Likelihood Event
Impossible Rolling a 9
Unlikely Rolling a 1
Equally likely Rolling 4 or more
Likely Rolling 2 or more
Certain Rolling between 1 and 6
A six-sided die is rolled in a trial. Describe the likelihood that the outcome is 2 or more.
Create a strategy
First, we want to list the sample space (all the possible outcomes) of rolling a die. Then, we want to count the number of outcomes that are 2 or more and compare it to the total number of outcomes.
• Impossible: no outcomes correspond to the event
• Unlikely: the event happens less than half the time
• Equally likely: the event happens the same number of times as the other events
• Likely: the event happens more than half the time
• Certain: every outcome corresponds to the event
Apply the idea
The sample space of rolling a die is {1, 2, 3, 4, 5, 6}. This shows that there are 6 possible outcomes. There are 5 outcomes that result in 2 or a number greater than 2, which is more than half of the outcomes. The chances of rolling a 2 or more is likely.
Look at this spinner:
a Which symbol is most likely to be spun?
Create a strategy
This question is asking us to find the symbol that has more outcomes than the other symbols on the spinner. This will be the symbol that appears most on the spinner.
Apply the idea
The spinner has 8 sectors that show a ball, an apple, a pig, or a star.
• There are 3 sections or outcomes with a ball
• There is 1 section or outcome with an apple
• There are 2 sections or outcomes with a pig
• There are 2 sections or outcomes with a star
The ball has more outcomes than the other symbols, so the most likely symbol to spin is a ball.
b Describe the likelihood of spinning a ball.
Create a strategy
In the previous part, we found that the sample space has 8 outcomes and spinning a ball has 3 outcomes. Likelihood can be described as impossible, unlikely, equally likely, likely, or certain.
Apply the idea
Spinning a ball has only 3 outcomes, which is less than half of the total number of outcomes (8). So, the likelihood of spinning a ball is unlikely.
Trial - a part of an experiment with different possible results. It is usually repeated many times.
Outcome - the possible results of a trial.
Event - a grouping of outcomes. Each possible outcome is always an event on its own.
Likelihood - an event can be:
• impossible - can never happen
• unlikely - happens less than half the time
• equally likely - happens the same number of times as the other events
• likely - happens more than half the time
• certain - always happens
Sample space - a list of all the possible outcomes of a trial.
1 Determine the possible outcomes of each trial:
a Flipping a coin
2 Determine whether each of the statements is true.
a An event includes all outcomes in a sample space.
b Rolling a six-sided die
b When rolling a die, rolling an even number is an example of an event.
c If the event happens more than half the time, we say it is likely.
d If no outcomes correspond to the event, we say it is unlikely.
e If an event happens exactly half the time, we say it is equally likely.
3 Vincent rolls a twelve-sided die and writes down whether he rolls 6 or more. If he does, he writes “yes”, otherwise he writes “no”.
List all possible outcomes that correspond to the event where he writes “yes”.
4 The spinner shown is spun once:
a What are the possible outcomes?
b What outcome is the most likely?
Let’s practice
5 A standard six-sided die is rolled. Using a term from the list, determine the likelihood that the outcome is:
a 2 or greater
b 7 or greater
c An even number
6 A twelve-sided die is rolled. Determine the likelihood that the outcome is 8 or greater.
• Impossible
• Unlikely
• Equally likely
• Likely
• Certain
7 One marble is drawn out of the jar containing 3 black, 3 red, and 5 blue marbles:
a Determine the color of the marble that you are most likely to draw.
b Determine the likelihood that you draw a marble that is not blue.
8 Consider the following spinner:
a Are the events of spinning an apple and a star equally likely?
b Are the events of spinning a ball and an apple equally likely?
c Are the events of spinning a ball and a star equally likely?
9 There are 40 marbles in a jar: 11 red, 7 blue, 9 green, 5 yellow and 8 orange. If a marble is chosen at random:
a What color marble is most likely to be chosen?
b What color marble is least likely to be chosen?
c How many marbles satisfy the event ‘Picking a green marble’.
10 The three cards are shuffled. One card is then drawn at random:
a Determine the likelihood of drawing a Heart.
b Determine the likelihood of drawing a number card.
11 The four cards are shuffled. One card is then drawn at random:
a Determine the likelihood of drawing a Jack, Queen or King.
b Determine the likelihood of drawing a card with a number less than 4.
12 Consider the spinner shown:
a What is the least likely symbol to spin?
b Determine the likelihood of spinning a star.
c Which one of the pairs of events is equally likely to occur?
A Spinning an apple or a pig
B Spinning a star or a ball
C Spinning a pig or a star
D Spinning a ball or a pig
13 Consider the spinner shown:
a Determine whether the events are equally likely:
i Spinning an even number
ii Spinning 7 or more
iii Spinning 12 or less
iv Spinning 7 or less
b Determine the likelihood of spinning 15 or more.
14 Yuri plays a game using the 8-sided spinner shown. Using the terms: Impossible, Unlikely, Likely, Certain or Equally likely:
a Determine the likelihood that he spins a number less than 15.
b Determine the likelihood that he spins the same number three times in a row.
c Determine the likelihood that he spins an even number.
d Determine the likelihood that he spins the number 4.
e Determine the likelihood that he spins a number between 5 and 14.
15
Determine the likelihood of the events as either: Impossible, Unlikely, Likely, Certain or Equally likely.
a Winning the lottery.
b Scoring 140% on an exam.
c Flipping tails with a coin.
d Next week will have 8 days.
e A number greater than 5 is rolled with a standard die.
f When a standard die is rolled, we get a number from 1 to 6.
16 Kenneth has a six-sided die. Lisa has a twelve-sided die. They decide to roll both their dice and the winner is the person who rolls the highest. Who is more likely to win?
17 Nica is planning to go to the beach on the 28th of April. She is hoping that the weather would be mostly sunny or partially cloudy so she looks at the previous data and weather forecast in New York from April 22 to April 27.
Based on the data and weather forecast, is it a good idea to go to the beach on the 28th of April? Explain your reasoning.
18 James has a bag of eleven counters numbered 1 to 11. Mae has a bag of twenty counters numbered 1 to 20. Each chooses a counter from their own bag without looking. Determine whether the statements are true or false:
a James is more likely than Mae to choose a counter numbered 11.
b They are equally likely to choose a number less than 3.
c James is more likely than Mae to choose an odd number.
d Mae is less likely than James to choose a counter numbered 16.
19 Marie is watching a car race where there are 48 Holdens and 16 Fords. Each car is equally likely to win. Marie says that Fords are impossible to win.
Is Marie correct? Explain your reasoning.
After this lesson, you will be able to...
• calculate the theoretical probability of an event.
• represent probabilities using ratios, fractions, decimals, and percents.
Probability is used to describe the likelihood of an event occurring. The probability of an event can be represented as a ratio or an equivalent fraction. It can be represented with a fraction or decimal between 0 and 1. It can also be represented by a percentage between 0% and 100%.
A probability can never be less than 0 or more than 1. The larger the number, the more likely it is, and the smaller the number, the less likely it is.
Probability (of an event)
The ratio of desired outcomes to the total number of possible outcomes in the sample space
We can calculate the probability of an event by first creating the sample space and counting the number of possible outcomes. If the events in the sample space are equally likely, the ratio will be the same for each event.
For example, let’s look at a full set of 52 playing cards:
There are 52 cards in the sample space, and each card has an equal chance of being drawn. The probability of drawing any one card is . Adding up the probabilities for each card gives a sum of 1 or 100%.
If the outcomes in a sample space are not equally likely, then we have to find the number of favorable outcomes for the given event. Theoretical probability is the ratio of the number of favorable outcomes to the total number of possible outcomes. We can use the formula:
Theoretical probability =
Let’s look at events for the playing cards with outcomes that are not equally likely. For example, what is the probability of drawing a 7?
We already know that there are 52 possible outcomes, so we only need to determine the number of favorable outcomes. There are 4 cards with a 7 on them, so there are 4 favorable events. Therefore, the probability of drawing a 7 is If every outcome is favorable, then it is certain to occur, so we will have a probability of 1. If there are no favorable outcomes, it is impossible for the event to occur, so the probability will be 0.
Here are some events sorted into each of the five likelihood categories:
Event
Drawing a blue card
Probability Likelihood
0 : 52 Impossible
Drawing a Spade Unlikely
Drawing a black card
0.5 Equally likely
Drawing a number card (2 through 10) Likely
Drawing a card that is a Spade, Heart, Club, or Diamond 100% Certain
A bag contains 28 red marbles, 27 blue marbles, and 26 black marbles.
What is the probability of drawing a blue marble?
Create a strategy
To find this probability, we need to determine the sample space or total number of outcomes. In this case, the sample space is the total number of marbles in the bag.
Next, we need to identify the number of favorable outcomes, which will be the number of blue marbles in the bag. We will divide this by the total number of marbles in the bag.
Apply the idea
There are 27 blue marbles, and the bag contains a total of 28 + 27 + 26 = 81 marbles.
Formula for theoretical probability
Substitute the values
Simplify the fraction
The probability of drawing a blue marble is 1 : 3.
Reflect and check
27 is less than half the total number of outcomes, so drawing a blue marble is unlikely.
The eight-sided die shown is rolled.
a What is the chance of rolling a five or more?
Create a strategy
The sample space of an 8-sided die is {1, 2, 3, 4, 5, 6, 7, 8}
We can use the sample space to count the number of favorable outcomes (outcomes with a value of five or more), then find the ratio of favorable outcomes to total possible outcomes.
Apply the idea
The die has 8 sides, so there are a total of 8 possible outcomes in the sample space. There are 4 favorable outcomes or outcomes of rolling a five or more: 5, 6, 7, 8.
The chance of rolling a five or more is 4 : 8 or 1 : 2.
b What is the chance of rolling less than five? Write your answer as a percentage.
Create a strategy
We can use the sample space from part (a) to count the number of outcomes of rolling less than five, then find the ratio of favorable outcomes to the total number of outcomes.
Apply the idea
There are 8 total possible outcomes, and there are 4 outcomes of rolling less than five, 1, 2, 3, 4. The chance of rolling a number that is less than five is 1 : 2, which is 50%.
Reflect and check
The sum of all the probabilities in a sample space will always be equal to 100% or 1. In this example, notice that the outcomes in part (a) (rolling a five or more) and the outcomes in part (b) (rolling less than five) make up the total sample space, {1, 2, 3, 4, 5, 6, 7, 8}
This means their probabilities will add to 1 or 100%.
Sum of the probabilities as fractions
Sum of the probabilities as percents
What is the probability of spinning a Star or an Apple on this spinner? Express your answer as a decimal.
Create a strategy
The number of favorable outcomes will be the number of sectors that have a star or an apple. The total number of outcomes is the total number of sectors on the spinner.
Apply the idea
There are 10 different sectors, so there are 10 total possible outcomes. 3 of sectors are stars and 3 of the sectors are apples. That means there are 3 + 3 = 6 favorable outcomes.
Formula for theoretical probability
Substitute the known values
Write as a decimal
The probability of spinning a Star or an Apple is 0.6.
A jar contains 10 marbles in total. Some of the marbles are blue and the rest are red.
a If the probability of picking a red marble is , how many red marbles are there in the jar?
Create a strategy
In the theoretical probability formula, the numerator represents the number of favorable outcomes, and the denominator represents the total number of outcomes.
Since the denominator matches the total number of marbles in the bag, the numerator will represent the number of red marbles.
Apply the idea
We know that the probability of picking a red marble is . That means 4 of the 10 marbles in the bag are red.
b What is the probability of picking a blue marble?
Create a strategy
We have already found that 4 of the 10 marbles are red. Since there are only red and blue marbles in the bag, the rest of the marbles will be blue.
Apply the idea
There are 10 marbles in total. We know that 4 of them are red and the rest are blue. So, there are 10 4 = 6 blue marbles.
The probability of picking a blue marble is
Reflect and check
Since the sum of the probabilities in a sample space will sum to 1, we could have subtracted the probability of drawing a red marble from 1 to find the probability of drawing a blue marble:
The theoretical probability of an event is the ratio of the number of favorable outcomes to the total number of possible outcomes.
Theoretical Probability =
If every outcome is favorable, then we have a probability of 1. If there are no favorable outcomes, then the probability is 0.
1 State the possible outcomes of choosing a random letter of the alphabet. How many outcomes are possible?
2 Consider a trial where there are six different outcomes and each outcome is equally likely. What will be the probability of one particular outcome?
3 What is probability? How can we use probability to make predictions?
4 State the formula for calculating the theoretical probability of an event.
5 A letter from the word VOLLEYBALL is chosen at random.
a List the possible outcomes.
b List the favorable outcomes for: i choosing Y ii not choosing L iii choosing O or V iv choosing a constant
6 Consider the spinner shown:
a What are the possible outcomes?
b Which outcome is most likely to occur?
7 Describe the likelihood that corresponds to each of the following probabilities out of the following: impossible, unlikely, even chance, likely or certain.
a 0.1 b 1
8 Are these statements true or false?
a The probability of an event occurring is always between 0 and 1, inclusive.
b The sum of the probabilities of all possible outcomes in a sample space is always equal to 1.
c An event includes all outcomes in a sample space.
9 Given an event with a probability of 4%, determine whether the following statements are true or false:
a It is likely to occur.
c It should occur 4 times every 100 trials.
e It should occur 20 times every 500 trials.
10
A twelve-sided die is rolled.
a Find the probability of rolling 5 or more.
b Find the probability of rolling less than 5.
c Find the probability of rolling 3 or more.
b It is unlikely to occur.
d It should occur 2 times every 100 trials.
f It should never occur.
d Find the probability of rolling a number that is divisible by 3.
e Find the probability of rolling an odd number.
11 Using the spinner shown, find the probability of spinning:
a A pig
b A ball or a pig
c A pig or an apple
d An apple or a star
12 Dylan has 32 marbles in a bag. 20 of them are orange. What is the probability Dylan will pick an orange marble from the bag without looking?
13 Juaquin has a bag of 5 marbles, 4 of which are red.
a Find the probability of drawing a red marble. Give your answer in fraction form.
b Find the probability of drawing a red marble. Give your answer in decimal form.
c Find the probability of drawing a blue marble. Give your answer as a percent.
d Find the probability of drawing a blue marble. Give your answer as a ratio.
14
A single marble is drawn from the following jar that has 5 red, 7 blue and 8 black marbles inside.
a Find the probability of drawing a blue marble. Give your answer as a percentage.
b Find the probability of drawing a blue marble or a red marble. Give your answer as a decimal.
15 Charlene spins the spinner shown:
a List the sample space.
b Find the probability of spinning a number greater than 29.
c Find the probability of spinning a number in the twenties.
16 A number is randomly selected from the following list:
{1, 3, 3, 6, 6, 6, 8, 8, 8, 8, 10, 10, 10, 10, 10}
a What is the probability of selecting a 1?
b What is the probability of selecting a 3?
c What is the probability of selecting an 8?
d Which number is most likely to be selected?
17 Paulo has 23 marbles in a bag and 4 of them are black. Paulo picks a marble from the bag without looking. Find the probability that Paulo picks a marble that is not black. Justify your answer.
18 A cookie jar contains 20 cookies inside. Some are snickerdoodle cookies, and the rest are chocolate chip cookies.
a If the probability of picking a chocolate chip cookie is , how many chocolate chip cookies are there in the jar?
b Find the probability of picking a snickerdoodle cookie as a percentage.
19 The 26 letters of the alphabet are written on pieces of paper and placed in a bag. If one letter is to be picked out of the bag at random, find the probability of picking a:
a J b K, Y or R
c M, K, D, O, H or B
e A letter in the word WORKBOOK.
d A letter in the word PROBABILITY.
20 Which of these events has a probability closer to 0.05?
• You roll a six-sided die and get a 5 or more.
• You find $100 on the ground today.
21 For each spinner, find the probability of getting a star. Write your answer as a percentage. a b c d
22 A bag of marbles contains different colored marbles. The probabilities of drawing a particular color are listed below:
• Red: 10%
• Blue: 20%
• Green: 30%
• Orange: 40%
Determine whether the bag could contain marbles of a color that is not listed. Explain your reasoning.
23 Consider the following spinner.
State the two equally likely events. Justify your answer with probability.
24 Consider the following spinner:
a Find the probability of getting the following shapes. Simplify your answers.
i An apple
ii A pig
iii An elephant
iv A ball
v A pig or a ball
vi Anything but an apple
vii An elephant, a star or a teddy bear
viii Anything but a ball or teddy bear
b Determine whether the following events have a probability less than 10%.
i Spinning a teddy bear
iii Spinning an apple
ii Spinning a star
iv Spinning a ball or an elephant
25 A card is drawn from a standard deck of cards:
a Find the probability of drawing the Jack of Hearts or the Jack of Clubs.
b Rosey draws a 6 of Spades and puts it back in the deck and asks you to draw a card. Find the probability that you will draw a card with a number larger than 6, and the same color as Rosey’s card.
26 Consider the four numbered cards:
Two of the cards are randomly chosen and the sum of their numbers is listed in the following sample space:
{15, 10, 8, 11, 9, 4}
a Find the missing number on the fourth card.
b If two cards are chosen at random, find the probability that the sum of their numbers is: i Even ii At least 10
27 Consider the following dice:
Four-sided die
Six-sided die
Eight-sided die
Ten-sided die
Twelve-sided die
Twenty-sided die
You are playing a game that requires you to move across a game board. If you roll a multiple of 3, you get to move twice the amount that you roll on the die. Which die would be best to choose for this game? Explain.
Here is the table again, with the experimental probability of each face listed as a percentage:
A normal die has around a 17% chance of rolling a 6, but this die rolls a 6 more than half the time.
Sometimes our “experiments” involve looking at historical data instead. For example, we can’t run hundreds of Eurovision Song Contests to test out who would win, so instead we look at past performances when trying to predict the future. This table shows the winner of the Eurovision Song Contest from 1999 to 2023:
Year Winning country
1999 Sweden 2008 Russia 2017 Portugal
2000 Denmark 2009 Norway 2018 Israel
2001 Estonia 2010 Germany 2019 Netherlands
2002 Latvia 2011 Azerbaijan 2020 Contest cancelled
2003 Turkey 2012 Sweden 2021 Italy
2004 Ukraine 2013 Denmark 2022 Ukraine
2005 Greece 2014 Austria 2023 Sweden
2006 Finland 2015 Sweden
2007 Serbia 2016 Ukraine
What is the experimental probability that Sweden will win the next Eurovision Song Contest?
We think of each contest as an “experiment”, and there are 24 in total. The winning country is the event, and we can tell that 4 of the contests were won by Sweden. So using the same formula as above,
Experimental probability of event =
the experimental probability is , which is about 17%.
To prepare for the week ahead, a restaurant keeps a record of the number of each main meal ordered throughout the previous week:
a How many meals were ordered altogether?
Create a strategy
Find the total number of meals ordered by adding the frequencies in the table together.
Apply the idea
b Determine the experimental probability, as a ratio, that a customer will order a beef meal.
Create a strategy
The experimental probability of event is the ratio of the number of times the event occurred to the total number of experiments.
The number of times a beef meal was ordered is 32. The total number of meals that were ordered is 157.
Therefore, the experimental probability that a customer will order a beef meal is 32 : 157.
An insurance company found that in the past year, of the 2558 claims made, 1493 of them were from drivers under the age of 25.
Give your answers to the following questions as percentages, rounded to the nearest whole percent.
a What is the experimental probability that a claim is filed by someone under the age of 25?
Create a strategy
Use the formula for experimental probability and convert to a percentage by multiplying by 100%.
Apply the idea
The number of times a claim was filed by a driver under the age of 25 is 1493. The total number of claims that were filed is 2558.
Experimental probability = Substitute the given values
= 0.58
Divide to write as a decimal
= 0.58 100 Multiply by 100 to convert to a percent
= 58% Evaluate to the nearest whole percent
b What is the experimental probability that a claim is filed by someone 25 or older?
Create a strategy
Find the number of claims were made by people who are 25 or older and use the formula for experimental probability.
Apply the idea
The number of claims made by drivers 25 or older is the remaining number of claims. We can find this number by subtracting the claims made by drivers under the age of 25 from the total:
2558 1493 = 1065
So, the number of claims filed by someone 25 or older is 1065.
Experimental probability = Substitute the values
= 0.42
Divide to find the decimal
= 0.42 100% Multiply by 100%
= 42% Evaluate to the nearest whole percent
Reflect and check
Recall that the probabilities of all the possible outcomes in a sample space will sum to 1. We can verify our answers by making sure the probability that a claim was filed by drivers under 25 and the probability that a claim was filed by drivers 25 or older is equal to 100% of the claims made.
58% + 42% = 100%
This verifies our answers.
Experimental probability of event =
Interactive exploration
Explore online to answer the questions
mathspace.co
Use the interactive exploration in 5.03 to answer these questions.
1. Click the “Roll the die 6 times” button. How do the experimental probabilities compare to the theoretical probabilities?
2. Reset the frequencies, then click the “Roll the die 60 times” button. How do the experimental probabilities compare to the theoretical probabilities? Are the results closer than when you rolled it 6 times?
3. Reset the frequencies, then click the “Roll the die 600 times” button. How do the experimental probabilities compare to the theoretical probabilities now?
4. What do you notice about the probabilities as the number of trials increases?
The experimental probability does not always equal the theoretical probability.
As we compare theoretical and experimental probabilities and conduct more trials, we begin to notice a pattern. The more trials that we run, the closer the experimental probabilities will be to the theoretical probabilities of the event. This is known as the law of large numbers
As the number of trials increase, the experimental probability gets closer to the theoretical probability.
Suppose you want to know if flipping the coin shown truly results in an expected probability of 50% for heads and 50% for tails.
The table shows the number of flips and the actual frequency of heads and tails.
As the number of flips increase, we see that the percentages are becoming closer and closer to the theoretical probability or 50% for each side of the coin.
A trial is to be conducted by flipping a coin.
a What is the theoretical probability of flipping tails on a coin?
Create a strategy
Use the formula Theoretical probability =
Apply the idea
When flipping a coin, there are 2 possible outcomes: heads or tail. There is only 1 favorable outcome as only one side of the coin shows tails.
Theoretical probability = Substitute known values
The theoretical probability of flipping tails is or 50%.
b A coin was flipped 184 times with 93 tails recorded. What is the exact experimental probability of flipping tails with this coin?
Create a strategy
We will substitute the given values into the formula for experimental probability.
Apply the idea
Experimental probability = =
c Compare the theoretical and experimental probabilities of flipping tails.
Create a strategy
To compare the fractions we found in parts (a) and (b), we need both fractions to have the same denominator. Then, we can compare their numerators.
The theoretical probability of flipping tails is , and the experimental probability is . Since the experimental probability cannot be reduced further, we use the theoretical probability to create an equivalent fraction with a denominator of 184.
The theoretical probability of is slightly less than the experimental probability of
Reflect and check
If we convert to a decimal or a percent, we would get a value that would need to be rounded.
However, we can still compare the rational numbers regardless of which form they are written in.
Comparing as decimals:
≈ 0.505 434 78… Convert to a decimal
0.5 < 0.505 434 78 … Compare the probabilities
Comparing as percentages:
≈ 50.543 478 … % Convert to a percent
50% < 50.543 478 … % Compare the probabilities
Anasofia and Caio each surveyed students from their school to see how many people would be interested in a fun run event. The results of their surveys are shown in the table.
Anasofia’s survey Caio’s survey
Anasofia claims that about 38% of the students would join the fun run based on her survey results. Caio claims that about 47% of the students would join the fun run based on his survey results. Which claim do you think is more valid? Explain your reasoning.
In the context of surveys, the law of large numbers suggests that larger sample sizes will tend to yield more accurate and reliable estimates of the entire population. So, we will compare the sample sizes of each survey.
The total sample size for Anasofia’s survey is 54 + 89 = 143.
The total sample size for Caio’s survey is 408 + 460 = 868.
Caio’s claim is the more valid because he has surveyed more people. By the law of large numbers, his claim is closer to the true percentage of all students who would join the fun run.
The law of large numbers states that as the number of trials increase, the experimental probability gets closer to the theoretical probability.
1 State the formula for calculating the experimental probability of an event.
2 How is experimental probability different from theoretical probability?
3 State whether each of the following are theoretical or experimental probabilities:
a A coin was flipped 150 times, and it was found to land on tails 52% of the time.
b Only 1 of the 16 batteries in the package did not work.
c When a standard die is rolled, there is a 50% chance of landing on an even number.
d Collin drew 10 cards, and half of them were red.
e 6 of the 20 marbles in the bag are green.
4 True or False: As the number of trials in an experiment increases, the experimental probability gets closer to the theoretical probability.
5 Describe what would need to happen in an experiment for an event to have an experimental probability of 1.
6 At a factory, 1000 computers were tested with 15 found to be faulty. Calculate the experimental probability as a percentage that a computer at this factory will be faulty.
7 A retail store served 773 customers in October, and there were 44 complaints during that month. Calculate the experimental probability that a customer complains. Give your answer as a percentage, rounded to the nearest whole percent.
8 An event organization, the Ultimate Triathlon Challenge, analyzed the participants in their past year’s event. They found that out of 8929 participants, 6784 were under the age of 40. Calculate the experimental probability, to the nearest percentage, that a participant is:
a Under the age of 40 b 40 years or older
9 The table shows the results of rolling a die multiple times:
a How many times was the die rolled?
b Find the experimental probability of rolling a 1 as a reduced fraction.
c Find the experimental probability of rolling a 5 as a reduced fraction.
d Find the sum of probabilities of all the outcomes of rolling a die.
10 To prepare for the week ahead, a restaurant keeps a record of the number of each main meal ordered throughout the previous week:
a How many meals were ordered altogether?
b As a whole percent, what was the experimental probability of a lamb meal being ordered?
11
High school students attending an international conference were asked to register what language other than English they speak. The results are shown in the table:
a How many students attended the conference?
b Find the probability that a student chosen at random speaks:
i French
ii Arabic or Mandarin
iii Spanish or Other
12 A die is rolled 121 times with the results recorded in the following table:
Find the experimental probability of:
a Rolling a 5
b Rolling a 4 or greater
c Rolling a 4 or less
13 Boxes of toothpicks are examined and the number of toothpicks in each box is recorded in the following table:
If the number of toothpicks of another box were counted, find the experimental probability as a whole percentage that it will have:
a 89 toothpicks
b More than 90 toothpicks
c Less than 90 toothpicks
14 Five schools compete in a basketball competition. The results from the last season are given in the table below:
Schools competing each game Winner
St. Clare vs Fort Meyer
Fort Meyer vs Summerland
Lakeview vs Jefferson
Jefferson vs St. Clare
St. Clare vs Summerland
St. Clare vs Lakeview
Fort Meyer vs Jefferson
Jefferson vs Summerland
Lakeview vs Summerland
Fort Meyer vs Lakeview
St. Clare
Summerland
Jefferson
St. Clare
Summerland
Lakeview
Fort Meyer
Summerland
Lakeview
Lakeview
Calculate the experimental probability that Fort Meyer wins one of their matches.
15 A fair die with faces labeled 1 through 6 is rolled 60 times. This table shows the results.
Rachel compared the theoretical and experimental probabilities. Which statement correctly compares the theoretical and experimental probabilities that the number landing face-up is odd?
A The theoretical probability of is less than the experimental probability.
B The experimental probability of is less than the theoretical probability.
C The theoretical probability of is equal to the experimental probability.
D The experimental probability of is less than the theoretical probability.
16
The table shows the results of spinning the spinner 300 times.
a Compare the theoretical and experimental probabilities of the event.
i Spinning a 10
ii Spinning a 7
iii Spinning a number greater than 9
b If you spin the spinner a total of 15 000 times, what would you expect the experimental probability of spinning a 7 to be?
17 A coin was flipped 184 times with 89 heads recorded.
a Find the experimental probability of flipping heads with this coin.
b A simulation of flipping a coin is ran 500 times and the results show 255 heads recorded. Find the experimental probability of flipping heads with the simulation.
c How do the two experimental probabilities compare to the theoretical probability of landing on heads?
18 Maria is tossing a coin. She continues tossing the coin until she gets a Tail. Her first set of tosses resulted in Heads, Heads, Tails, so she stopped after three tosses. She then repeated the experiment 19 more times and recorded her results in the following table:
a Based off Maria’s experiment, what is the experimental probability that it takes 5 tosses of the coin before a Tail appears?
b The theoretical probability that it takes 5 tosses of the coin before a Tail appears is 3.125%. Why is there a difference between the theoretical and experimental probabilities?
19 Pablo has concluded that about 36% of people would drive an electric car based on his survey results:
Would drive an electric car 58
Would not drive an electric car 104
Jenny has concluded that about 31% of people would drive an electric car based on her survey results:
Would drive an electric car 224
Would not drive an electric car 504
Which claim do you think is more valid? Explain your reasoning.
20 Derek spun the following spinner 20 times.
a How many times would he expect the arrow to land on X?
b After he finished spinning, he noticed that the arrow fell on X 8 times. Find the experimental probability of getting an X.
21 The table shows the fighting style of each competitor in a mixed martial arts tournament:
a Find the experimental probability of a competitor being a wrestler.
b Find the experimental probability of a competitor not being a Taekwondo fighter.
c If 100 more competitors joined the competition, how many of them would you expect to use Karate as their fighting style?
22 Each player draws as many dominoes as they like from a bag. A domino has two numbers from 1 to 6 on it as shown. A high value domino occurs if the sum of its two numbers is greater or equal to 6. Otherwise, it is a low value domino.
The table below shows how many dominoes each player has, and how many of them have a high value:
A player wins by randomly selecting a low value domino from their drawn sample. Which player has the least chance of winning? Explain your thinking.
23 Homer used a spinner to choose “YES” or “NO”. The table shows three different days, how many times he spun the spinner, and how many times it landed on “YES”:
“Yes”
a Create a possible spinner that Homer used in his experiment.
b If the radius of the spinner is 5 cm, calculate the area of the “NO” section of the spinner.
24 Anna, Ben, and Cara share an apartment and dislike doing the dishes the most. The eldest sibling, Anna, suggested they should draw straws to decide who does the dishes each day instead of rotating chores. She prepared three straws of equal length, marked with each of their names, and placed them in a jar.
a Ben was frustrated because he ended up doing the dishes 5 times in one week, and Anna only did it twice. He suspects Anna is not drawing straws in a fair manner. Explain why Ben thinks that with a fair draw, he would typically have to do the dishes around 2 to 3 times in a week.
b The siblings decide to run a simulation showing the outcome of random name draws for 300 weeks. The table shows the outcomes of the 300 simulations, each simulating 7 draws with each person having a chance of being selected.
Number of times a person is picked 0 1 2 3 4 5 6 7 Frequency
Determine if Ben is correct. Is it reasonable to believe the draw was unfair?
Apply the idea
Answer to this question could include things like:
• Bike • Bus
• Car
These are categories, not quantities or numbers, so this data is not numerical.
Reflect and check
• Walk
This data could be organized in a pictograph which is used for categorical data, not numerical.
1 image = 9 people
b How do the heights of students in your class vary?
Create a strategy
We want to know if we can measure or do calculations with the answers to this question.
Apply the idea
Height is something that we can measure, so this is numerical data. If we measure to the nearest quarter inch, it is unlikely that any two students in the class would be the exact same height, so we would need to group this numerical data in order to organize and analyze with it.
Reflect and check
If we tried to make a display, like a dot plot or bar graph, without grouping or rounding to the nearest inch, there would be too many values along the horizontal axis.
c What is a typical score for a hockey team in a single NHL game?
Create a strategy
We need to be able to count or measure the score for it to be numerical.
Apply the idea
The score of a hockey game is the number of goals, so it is numerical.
NHL hockey games are generally fairly low scoring with an average of around 3 goals per game and the highest score ever being 14 goals. This data does not need to be grouped as it does not have a very wide spread or possible responses.
Reflect and check
For the first game of the 2023-2024 season, this is what a dot plot would look like:
Number of goals scored in the first game of the 2023/2024 season
Is each question well formulated for the data cycle? Explain why or why not.
a How many years has the Boston Red Sox baseball team been around?
Create a strategy
A well formulated question should have a variety of possible answers and relate to a specific population.
Apply the idea
There is one answer and no clear population, so this is not a well formulated question for the data cycle.
Reflect and check
A related question we could use the data cycle for is “How many years does the average MLB player play for?”
b How do the heights of 7th and 8th graders at my school compare?
Create a strategy
A well formulated question should have a variety of possible answers and relate to a specific population.
Apply the idea
This is a well formulated question as height is a clear attribute with different possible answers.
Reflect and check
This data would be numerical and need to be grouped.
c What is the distribution of ages at the local martial arts studio?
Create a strategy
There is a clear population of people at the local martial arts studio. Now we need to check if data could be collected to give a variety of answers.
Different martial arts athletes will have different ages, so this something we could find data on. This is a well formulated question.
We follow the data cycle to help us formulate questions and use data to answer them. The questions we ask may lead to data that is numerical data. This data may be left as individual data values or grouped when it is displayed.
Well formulated questions should have more than one possible answer and clearly identify the population we are looking to investigate.
When we have questions, we use different ways to collect data to find answers:
• Observation: Watching and noting things as they happen
• Measurement: Using tools to find out how much, how long, or how heavy something is
• Survey: Asking people questions to get information
• Experiment: Doing tests in a controlled way to get data. For example, planting two identical plants, giving one sunlight and the other only artificial light, and observing the differences
• Acquire existing secondary data: Use data which was collected by a reliable source like census data, Common Online Data Analysis Platform (CODAP), or National Oceanic and Atmospheric Administration (NOAA) weather data.
c Explain how Donovan could collect data that could be used to answer his question from part (a).
Create a strategy
He would need to find a reliable secondary source that has the data he is looking for. He may need to reformat or summarize the raw data.
Apply the idea
He can submit a request through the National Centers for Environmental Information which is run by the NOAA. He will get an email with a spreadsheet that shows the raw data he selected. From there, he can reformat it to find the total for each year.
For example, here is the raw data in tables:
Reflect and check
We could organize and analyze this numerical data with a line graph to see the trend over time.
The longer the time period we look at, the more work it would be to analyze. However, the results would be more reliable and tell a more complete story.
d How do the temperature trends in your hometown compare to Donovan’s?
Create a strategy
We can use NOAA’s database, or something similar for other countries, to find data for our location or as close as possible. Usually, airports collect excellent weather data, so we may need to use the closest airport.
For hometowns in the US, we can copy and paste this link into our internet browser: https://www.ncei.noaa.gov/weather-climate-links
Then ask your teacher for help with finding and summarizing the data you need for your hometown.
2 Is each statement true or false?
a A population is larger than a sample.
b A sample will always have the same characteristics as the population.
c A representative sample will look similar to the population, just smaller.
d A random sample is selected however the study designer finds easiest.
e When given grouped numerical data, we can see individual data values.
f When the spread of numerical data is very large, we may need to group the data into intervals in order to organize it.
3 Is each statement true or false for a well formulated question for the data cycle?
a The question should have a yes or no answer.
b A survey could be used to collect data to help answer the question.
c We can find the answer to the question using a single internet search.
d The answers to question can be categorical or numerical variables.
4 Are these questions well formulated for the data cycle?
a How tall are the science teachers in your school?
b Which city is the capital of France?
c For people who can ride a bike, at what age do they typically learn how?
d What is your favorite movie?
e Generally, how long are movies?
5 Match each procedure with the type of method that was used.
a Observation b Measurement c Survey d Experiment
i Everly asks each student in her wrestling club questions about shoe and singlet sizes.
ii A by-law officer uses a radar gun to record data on the speeds of cars on a dangerous stretch of road.
iii Sergio asks all of the adults in his school to complete a crossword puzzle. He gives some pens and some pencils and compares the differences between pens and pencils.
iv Mehrab watches and counts how many cars don’t do a full stop at the stop sign on his street.
6 When choosing a sample of people, does each of the following matter or not?
a The size of the sample.
b How the sample is chosen.
c The order that the people in the sample are surveyed.
d The characteristics of the people in the sample.
e The style of hat that names were drawn from.
7 If two samples from the same population have very different results and lead to opposite conclusions, what might this tell us?
8 Determine if each question would result in numerical data or not. If it is numerical, explain if the collected data could be grouped or if we need to keep the individual data values.
a What school clubs are popular at my school?
b How long does it take for a broken bone to heal?
c What attendance can be expected at a local art installation?
d What types of dogs can be seen at the local dog park?
e How many accessible entrances do public buildings have in my city?
9 Is each question well formulated for the data cycle? Explain why or why not. If not, rewrite it to be well formulated.
a What is the highest selling book in the world?
b What proportion of new businesses in America make a profit after one year?
c How many families have a vegetable garden?
d Do you like pineapple on your pizza?
10 Which formulated questions could be answered by analyzing the given circle graph?
A What proportion of households rent compared to owning?
B How have housing prices changed over time?
C What do Americans spend their money on?
11 Dax’s family is moving for the sixth time. He wonders if other kids at his new school also move a lot. He collects some data and organizes it in a table.
Formulate two possible questions for the data cycle that could be answered by analyzing the data.
Time in current living situation Number of people (frequency)
than one year 20
12 Aurelia formulates the question, “How does the cost of renting housing compare to the cost of owning?”
Create a plan for collecting data using one of the methods we have seen: survey, experiment, observation, measurement, or acquiring from secondary sources. Explain why that method is a good choice.
13 Fiona owns a bakery and wants to add some new options to the menu. She isn’t sure what to add. She decides to adjust the menu based on the age group of majority of the customers. She writes three statistical questions:
• What is the age range of the customers who visit the bakery?
• What age group comes to the bakery most frequently?
• What types of baked goods do people of each age group prefer?
a What type of data does Fiona need to collect to answer her statistical questions?
b Should Fiona collect the data by observation, a survey, or a measurement? Explain your answer.
c Formulate another question that Fiona could ask where an experiment would be suitable.
14 A school principal doesn’t think that the current school schedule is suitable and wants to explore options like starting the day later, having longer breaks, and having blocks that are shorter with more blocks per day. She wants to make sure that the data represents the everyone who might be impacted by the change. She has four options for selecting the sample for a survey.
• Select the parent volunteers.
• Select every 100th student, teacher, or parent they see on campus.
• Select every 10th student, teacher, or parent they see on campus.
• Select all of the students signed up for an after school activity. Which option would provide the best representative sample for results? Justify your answer.
15 A middle school is growing and is adding some outdoor portables. The principal wants to determine which classes should be moved to the new portable.
a Identify the target population.
b What method would be best to find out how the teachers and students feel about their class being moved to a portable?
A Observation
C Survey
B Measurement
D Acquire secondary data
c Explain why just the art teachers about their preference is not representative of the population.
16 Irene hears from two neighbors in her apartment building that they traveled across the US with only $10 in their pocket. She said that this is an observational study and we can draw the conclusion that “$10 is enough money for a fun cross-country trip.”
Give two reasons why we can’t make this conclusion.
17 Kai and Edith both run construction companies in a small town. Kai runs a poll at an event he is hosting for general contractors and takes a sample of the first ten people who arrive at his event. Edith runs a poll at the local community center and takes a sample of every 5th person who walks in the community center.
They both take the results of their poll to the town council and say that their study shows the construction company should do the next major project.
Whose poll do you think would better represent the entire town population? Explain.
18 Saad’s mom has a new role at work and can now work from home. This will give her the chance to complete her high school diploma. This makes him curious about education and employment of Americans and how it has changed over the years.
a Formulate a question to help him complete his investigation.
b Could he use observation, measurement, survey, experiment, or acquire secondary sources? Explain.
c Explain how Saad could collect data that could be used to answer his question from part (a).
d Analyze the data to draw a conclusion for Saad.
19 Lourice is interested in the variety of extracurricular activities students participate in at her school. She notices that some students are involved in sports such as basketball, soccer, or volleyball, while others prefer artistic pursuits like painting, music, or drama. Additionally, she observes that some students dedicate their time to academic clubs such as mathletes or debate teams, while others volunteer for community service organizations.
Go through the whole data cycle at least once using a context that is related to extracurricular activities where the data can be organized into categories.
The horizontal axis of a histogram can be labeled in two different ways. One method is to label each column with the interval of values it represents. The other method is to label the boundaries of each interval. In this method, the lower endpoint is always included, and the upper endpoint is excluded.
So, the first bin includes everyone who has from 20 to 39 apps on their phone. But those with 40 apps are counted in the second bin.
Histograms are a special type of bar graph. For a bar graph to be a histogram:
1. The bars must touch because they measure consecutive intervals.
2. It must measure quantitative, numerical data.
Explore online to answer the questions
Use the interactive exploration in 5.05 to answer these questions.
1. Describe what happens to the histogram as you increase the number of intervals.
2. What number of intervals is the most appropriate? Would this answer change if the data set looked different?
The intervals in a histogram could result in misleading conclusions regarding the data set. For example, extremely large or small intervals (bins) can make it difficult to see the shape of the data.
Consider the data set: 11, 13, 26, 35, 33, 37, 41, 42, 45, 45, 50, 52, 54, 55, 55, 58, 60, 60, 62, 63, 65, 67, 68, 77, 78
In this histogram, we might conclude that the least likely values are those below 21, or the most likely values are from 41 to 60.
The following histogram represents the same data with different sized bins. Here, we see that the least likely values are actually 20–29 and the most likely values are actually 60–69.
Histogram
There are some general guidelines to use when choosing bin intervals:
• Intervals should all be equal in size.
• Intervals should include all of the data.
• Boundaries for intervals should reflect the data values being represented.
• Determine the number of intervals based upon the data.
• If possible, create a number of intervals that is a factor of the number of data values (ie. a histogram representing 20 data values might have 4 or 5 intervals) will simplify the process.
A government agency records how long people wait on hold to speak to their representatives. The results are displayed in the histogram:
a Complete the corresponding frequency table:
Create a strategy
List the corresponding frequency of each length of hold (minutes).
Apply the idea
b How many phone calls were made?
Create a strategy
Add all the frequencies from part (a).
Apply the idea
Number of calls = 11 + 12 + 11 + 2 + 4
Find the sum of all frequencies = 40
Evaluate
c Find the number of people that waited less than 30 minutes.
Create a strategy
The number of people that waited less than 30 minutes will be the sum of the heights (frequencies) of the first three columns of the histogram.
Apply the idea
The frequencies of the first three bins are 11, 12, and 11.
The number of people that waited less than 30 minutes is 11 + 12 + 11 = 34.
d Find the proportion of people that waited 40–49 minutes.
Create a strategy
We can find the proportion by finding the height (frequency) of the 40–49 column and dividing it by the total number of calls made.
Apply the idea
The number of people that waited 40–49 minutes is 4. The total number of phone calls made is 40.
The proportion of people that waited 40–49 minutes is =
In product testing, the number of faults found in a certain piece of machinery is recorded over time. The number of faults found each day is shown:
0, 0, 2, 1, 0, 1, 2, 3, 0, 1, 4, 5, 6, 7, 4, 5, 5, 7, 6, 5, 6, 4, 4, 5, 8, 9, 8, 9, 10, 11, 8, 9, 9, 8, 10, 8, 11, 9, 10, 11, 10, 9, 10, 10, 12, 13, 14, 15, 12, 12, 14, 13, 12, 13, 14, 15, 15, 13, 12, 14
a Use the data to construct a histogram.
Create a strategy
We can use technology to construct the histogram by following these steps:
1. In the GeoGebra Statistics calculator, enter the data in a single column.
2. Select all of the cells containing data and choose “One Variable Analysis.”
3. Use the settings to adjust the histogram as needed.
Apply the idea
1. Enter the data in a single column.
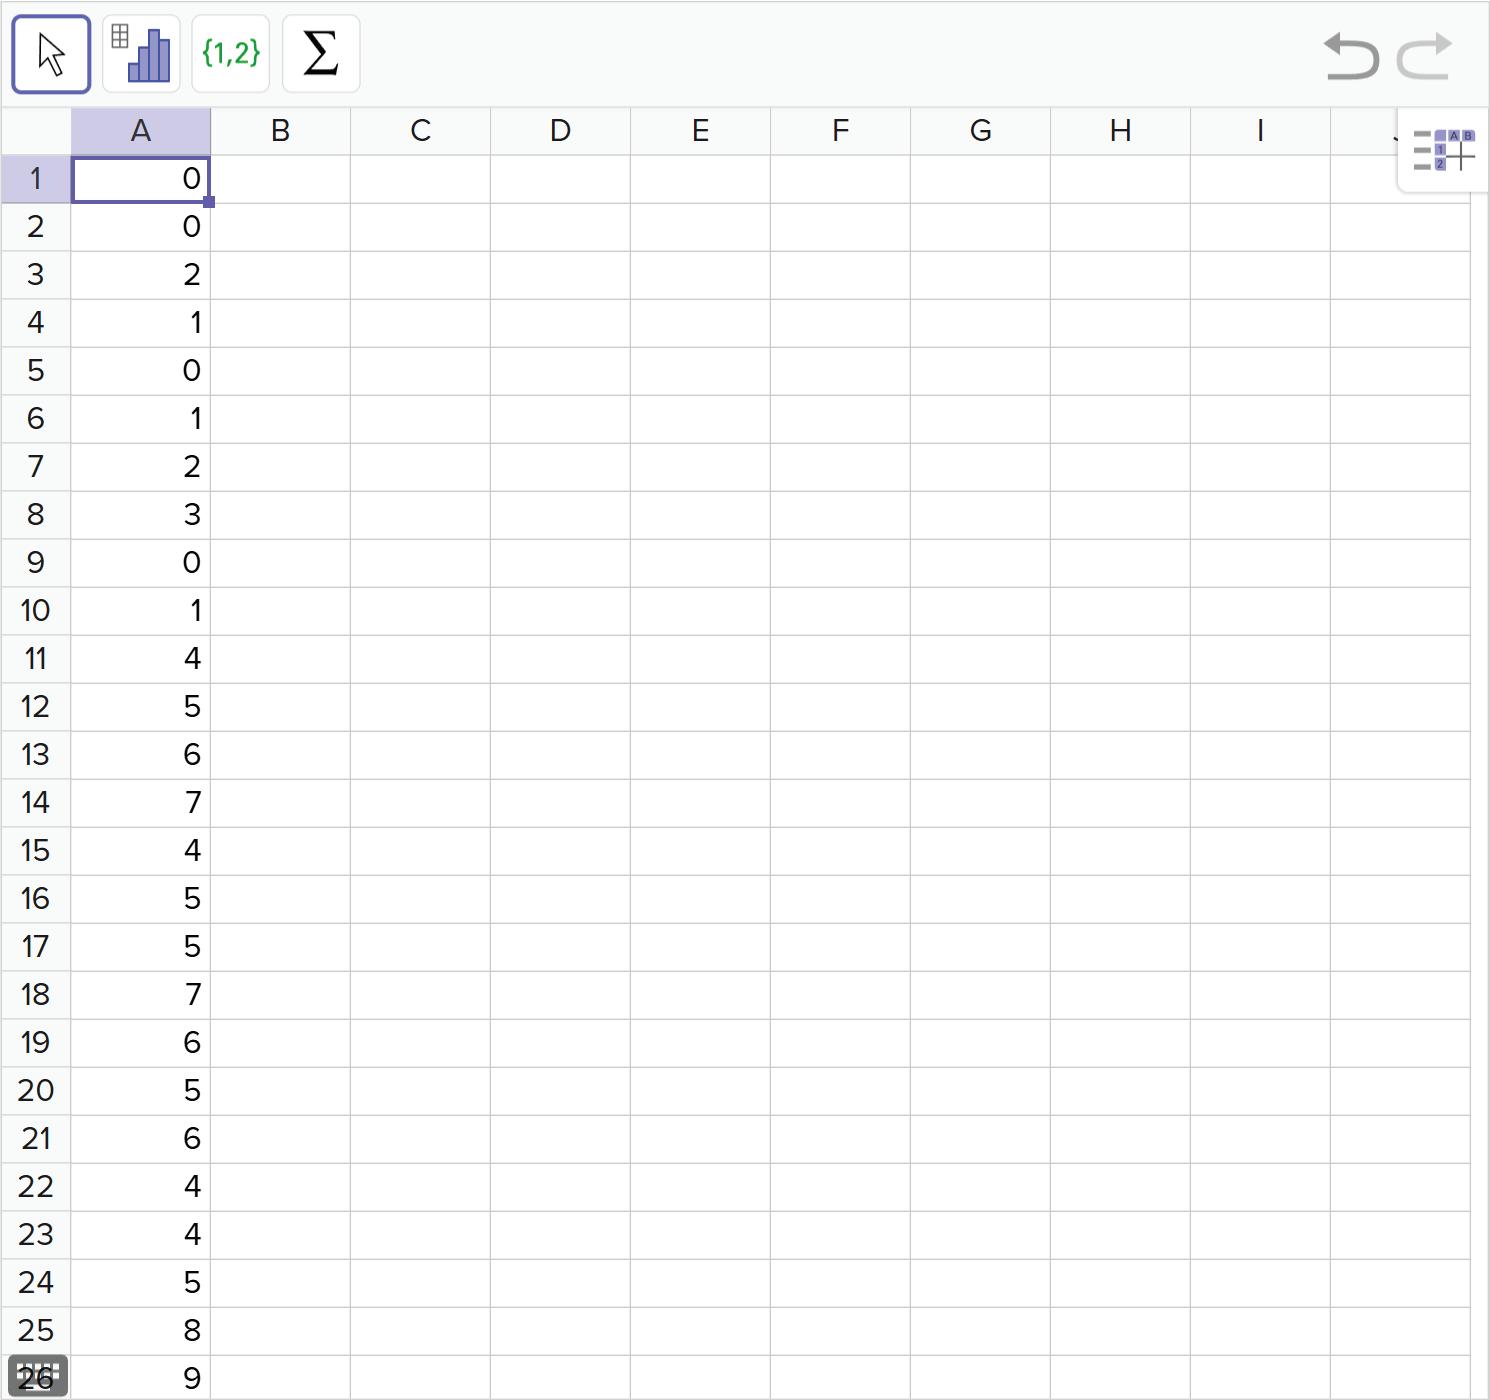
2. Select all of the cells containing data and choose “One Variable Analysis.”
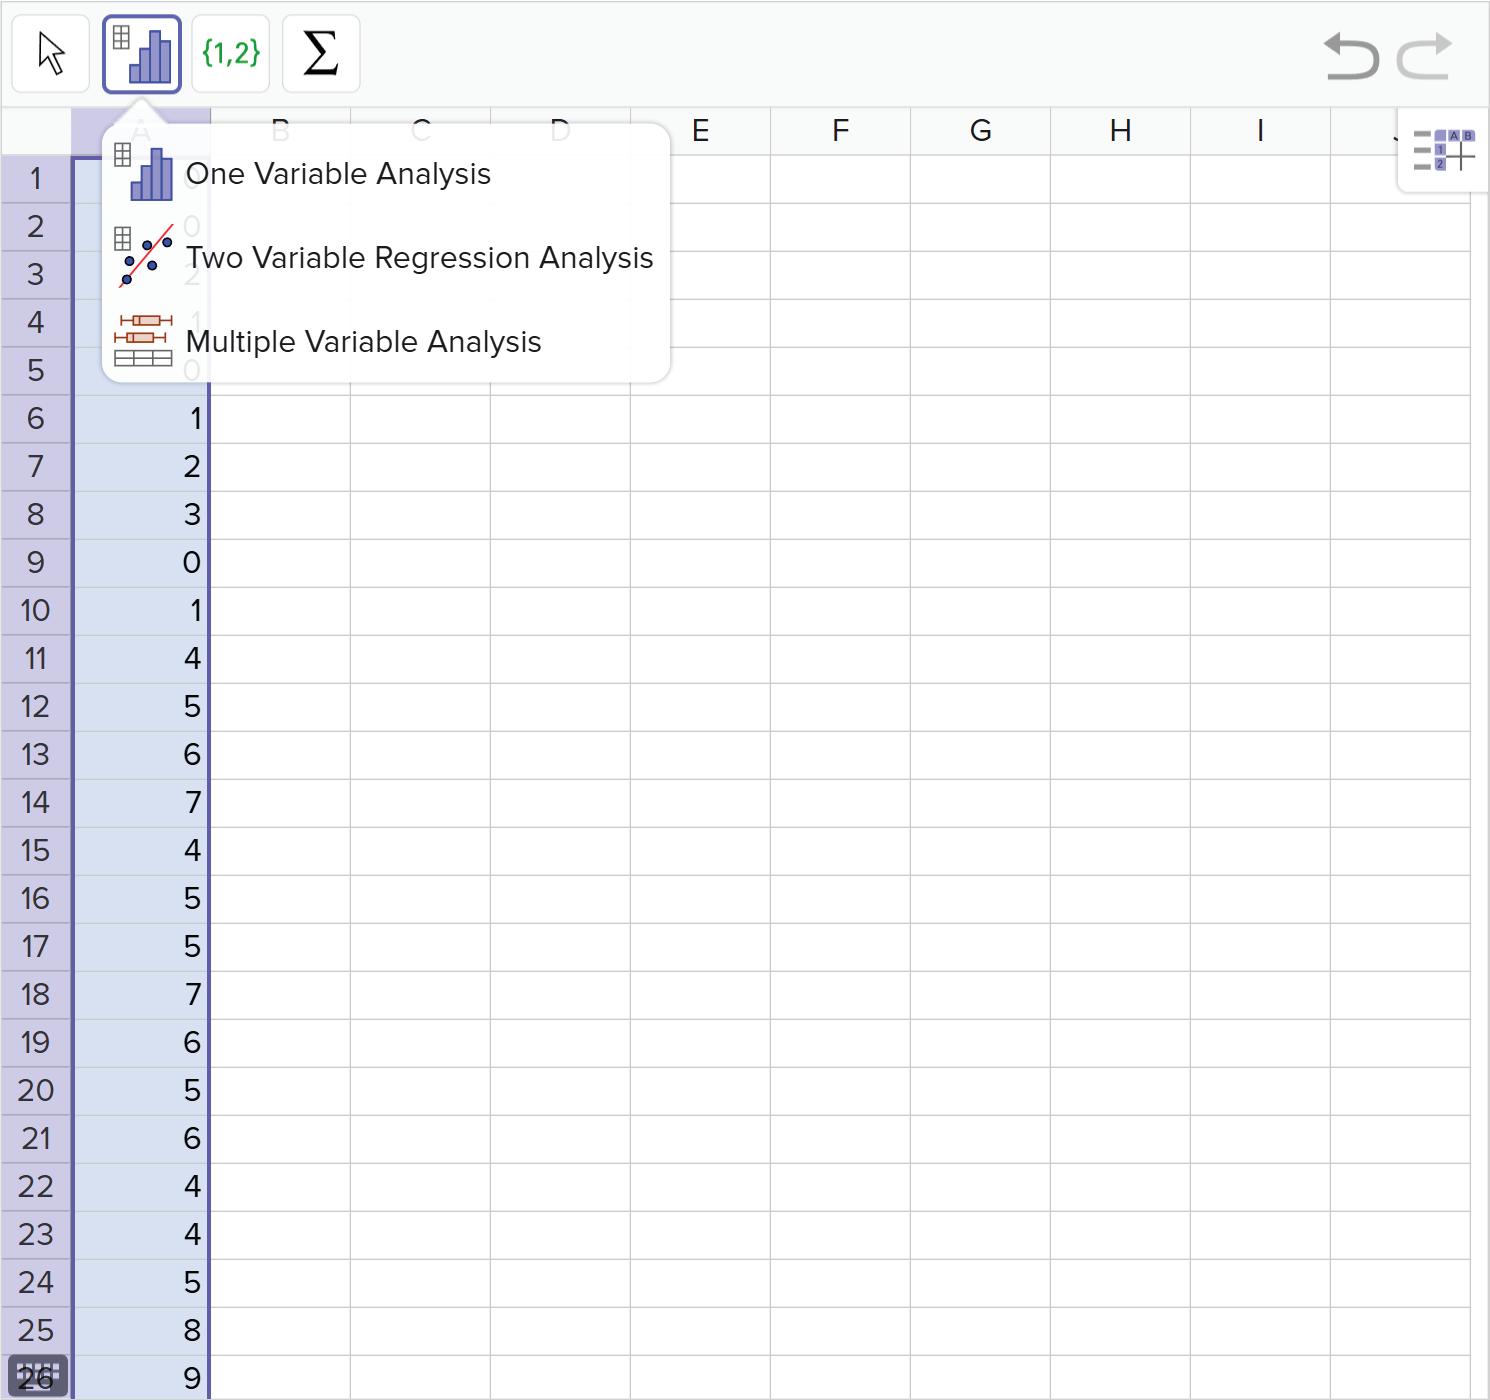
3. After the histogram is generated, we can adjust the width of the columns by checking the box that says “Set Classes Manually”. At the top, we can set the width to 4, since 4 is a factor of 60. We can also check the box to show the frequency table below the histogram.
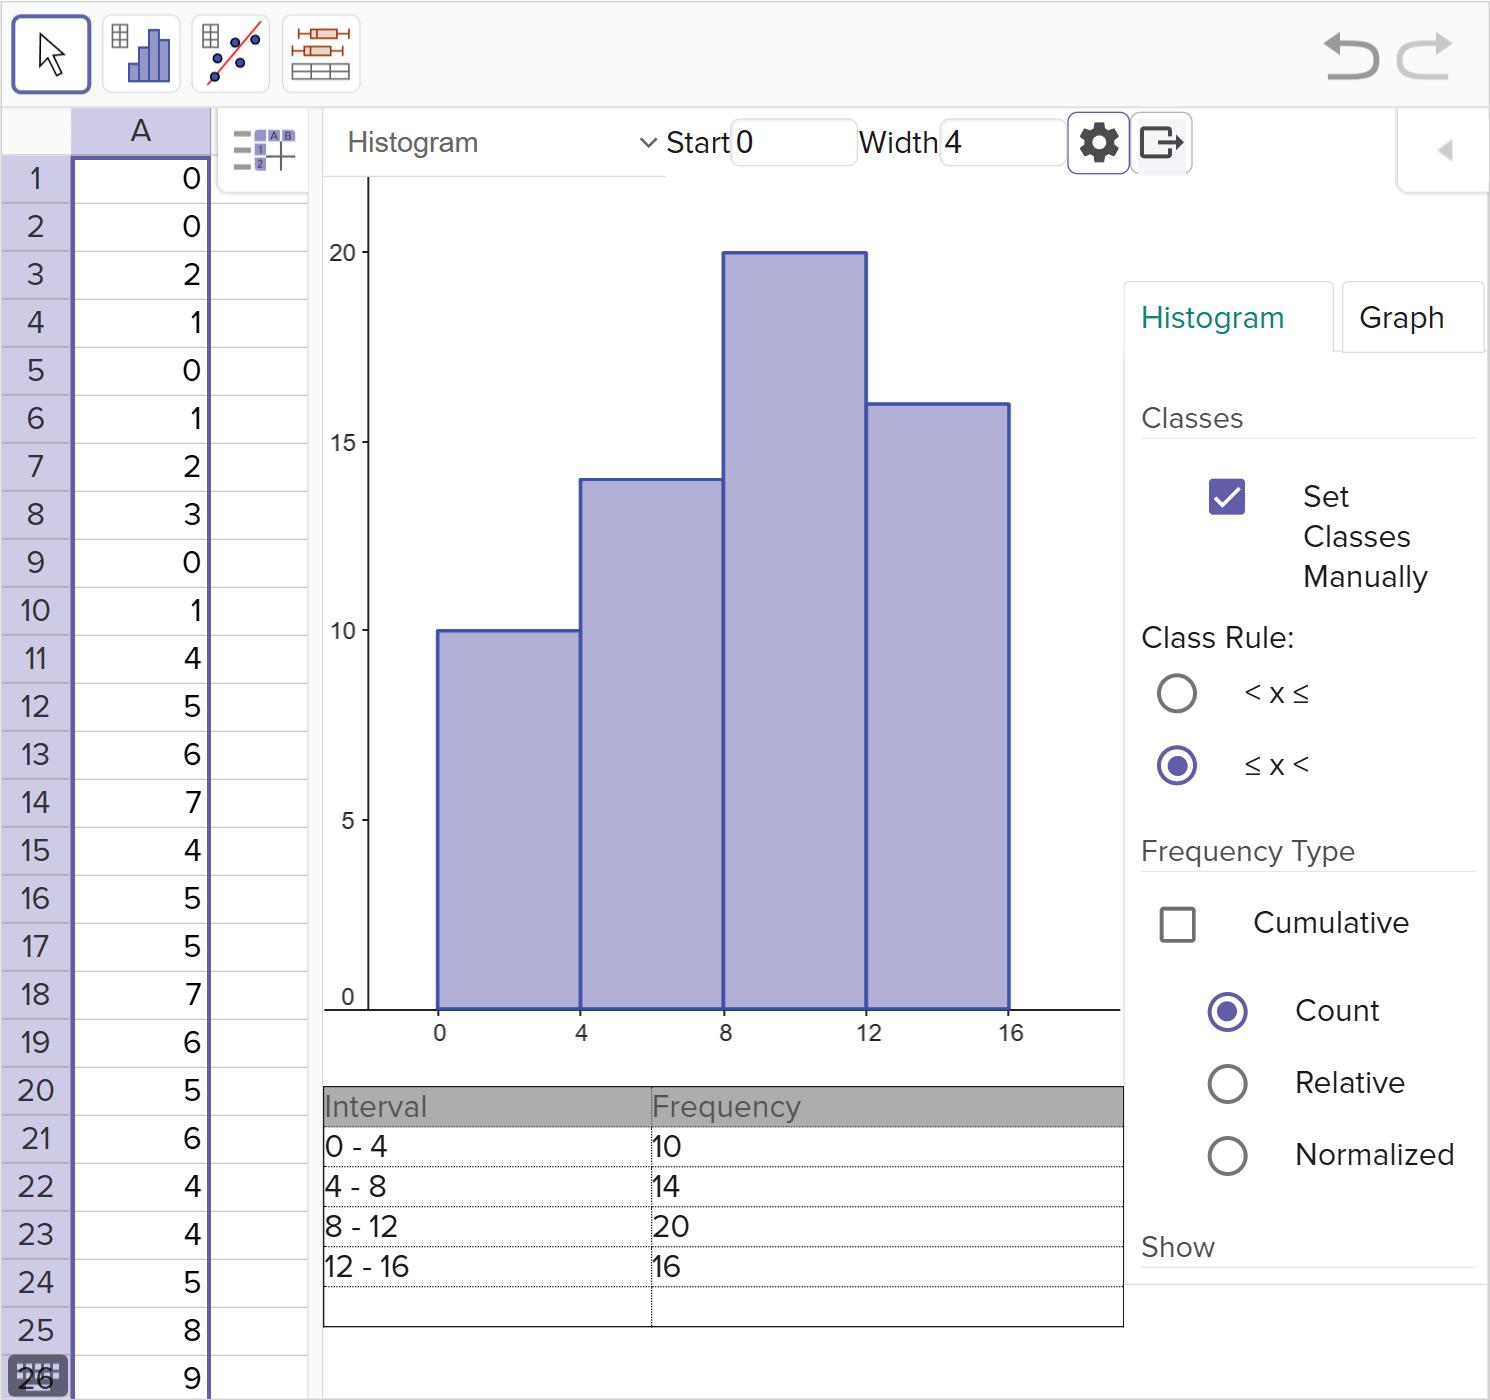
We could have chosen different widths for the classes, but the other options may show different trends. For example, a width of 3 shows that the frequency increases with the number of faults. It also shows a different range for the most common number of faults.
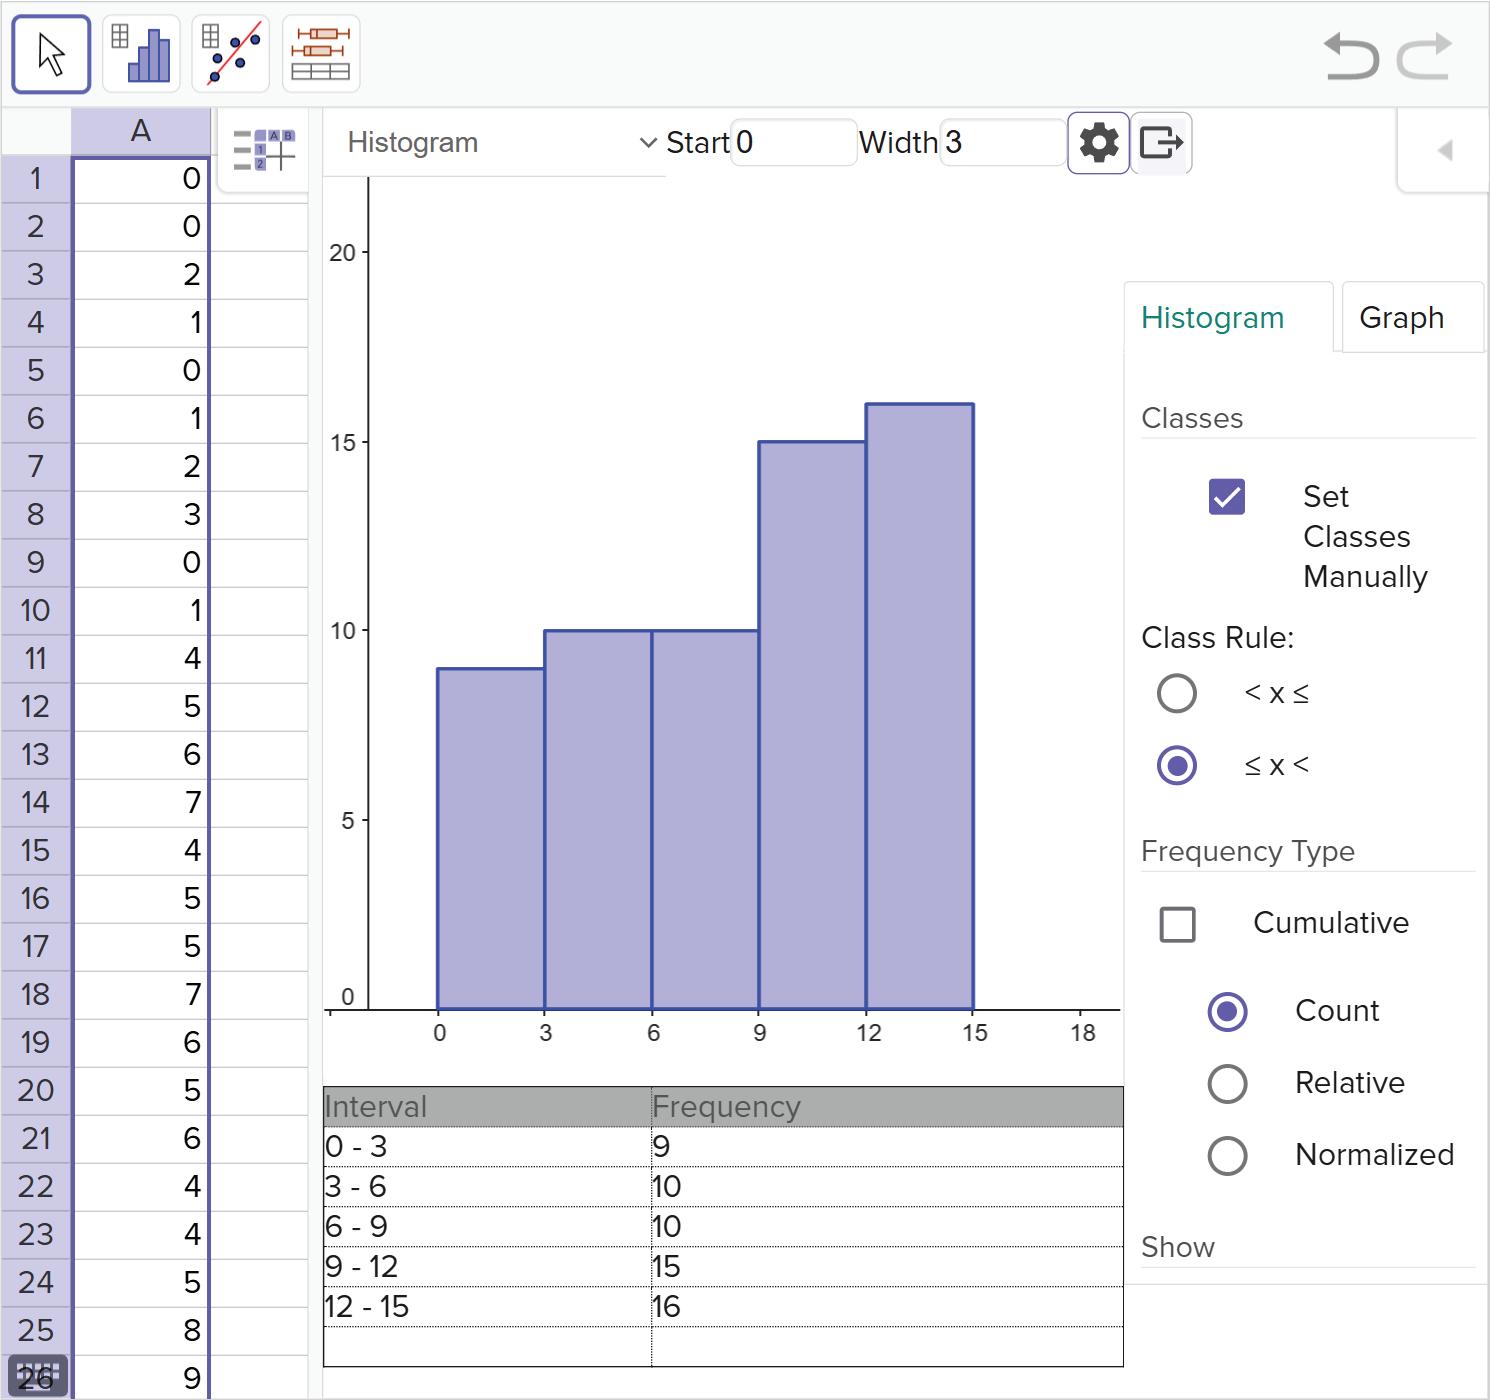
We should consider other possible bin sizes and explore the trends that arise. However, we should not use bin intervals to manipulate how others might interpret our results.
b How many days did the company record the number of faults?
Create a strategy
Add the frequency columns to find the total number of days the company recorded faults.
Apply the idea
Each value in the frequency column represents a fault that was recorded. Number of faults = 10 + 14 + 20 + 16 Add the frequencies = 60
Evaluate
There were 60 days in which the company recorded faults.
c On how many days were no more than 8 faults recorded?
Create a strategy
Check the frequencies where the faults are less than 8.
Apply the idea
If we look at the first and second rows of the table, we see that there were 10 + 14, which equals 24 days, so 24 days recorded less than 8 faults.
d What percentage of the days were 12–15 faults recorded?
Create a strategy
Look at the frequency for the last interval, which corresponds to 12–15 faults.
Apply the idea
The last row of the table shows that 16 faults were recorded out of 60 which is about 26.7% of the total faults.
A city’s botanical garden recently planted a new species of tree. They want to learn more about the tree’s characteristics so they can share their findings with the public. One of the investigative questions they asked is, “What are the possible lengths of the leaves of this tree when it is mature?”
a What type of data needs to be collected to answer their question?
Apply the idea
To answer the question, the staff at the botanical gardens must collect data on the lengths of the leaves of mature trees of this species. Since this is only one variable of interest, the data is univariate.
Reflect and check
This data will be collected by measuring the lengths of the leaves. We cannot survey the leaves or observe them to identify their lengths. We also do not want to try to control the lengths of the leaves, so an experiment is not a good method for data collection.
Option B is incorrect.
The class with the highest frequency is 60–80, so option C is correct.
The two rightmost columns have the highest frequencies. Each of their frequencies are higher than the left three columns combined. So, option D is correct.
Histograms and frequency tables do not provide information on specific data values, so we do not know whether any leaves had a length of 10 mm.
The correct options are: A, C, and D.
The following set of values represent the distances (in inches) reached by 8th grade students in a standing long jump exercise.
44, 62, 56, 53, 31, 78, 59, 46, 32, 41, 65, 45, 48, 57, 61, 98, 35, 42, 88, 49, 33, 75, 95, 55, 97
a Formulate a question that could be answered by constructing a histogram.
Create a strategy
Histograms help us see the modal class (which interval has the most data values) and the spread of the data. They can help us answer statistical questions about how data varies or how common a range of values.
Apply the idea
One question that a histogram can help us answer is, “What proportion of students jumped further than 90 in?”
Reflect and check
There are many possible questions we could ask that a histogram could help us answer. Another question might be, “What is most common range of distances jumped by 8th grade students?”
b Which histogram should we use to analyze this data? Explain your answer.
Create a strategy
We can begin by checking for the basic characteristics of histograms:
• The intervals should cover all the values in the data set. That is, there should be no value that does not belong to a set.
• The upper boundary of any class should be adjacent to the lower boundary of the next interval. That is, there should be no gaps between the interval boundaries.
• The size of each interval must be the same.
All of these are satisfied, so we now need to consider the lengths of each interval. We need to choose an interval that helps us identify trends in the data. If the length of intervals is too small or too large, it can be difficult to see any trends.
In histogram A, the columns have a relatively good length which leads to a good number of columns. This length also helps us see trends in the data, such as the most common or least common ranges of long jumps.
The intervals in the second histogram have a relatively large range. Although it shows one column taller than the other, it is still too general to make any specific conclusions about the data.
The intervals in histogram C are very small, so there are many peaks, gaps, and valleys in the columns. With so many differences between the columns, the conclusions drawn from this histogram would be too specific.
The intervals in the last histogram have a very large range. This makes it difficult to identify specific trends in the data, and the conclusions would be too general.
The correct answer is option A, histogram.
Reflect and check
Now that the data is represented in a histogram, we can answer our question from part (a), “What proportion of students jumped further than 90 in?”
There are 25 data values in total, and 3 students jumped in the largest class interval of 90–99 in. So, jumped further than 90 in. Although we could have answered this question using the raw data, the histogram makes it easier to identify exactly how many students are in the largest class interval.
c Approximately half of the data falls within which two bins of the histogram?
Counting the values in the data set, we see there are 25 data values in total. That means half of the data values is 12.5. Using the histogram from part (b), we need to look for two bins whose frequencies sum to about 12.5.
Reflect and check
Because approximately half of the data are within the two bins we identified, that means the other half of the data must in the remaining bins. When we add the frequencies of all the other bins, we get 4 + 3 + 2 + 1 + 3 = 13
This confirms our answer because = 0.48 and = 0.52 and 0.48 + 0.52 = 1 or 100% of the data.
The two tallest columns in the histogram have frequencies of 7 and 5 which sum to 12. This shows approximately half of the data falls within the bins 40–49 and 50–59.
Every data value must go into exactly one and only one interval or interval. The key features of a histogram are:
• The horizontal axis is a numerical scale (like a number line)
• The data on the horizontal axis may be grouped into intervals
• There are no gaps between the columns of a histogram
• The height of each column will be the frequency
1 Use the data from the histogram to complete the frequency table:
2 Complete the frequency table for the data set in the histogram:
Height, h (inches)
48 ≤ h < 52
52 ≤ h < 56
56 ≤ h < 60
60 ≤ h < 64
64 ≤ h < 68
Frequency
3 Would each survey question lead to data that could be displayed in a histogram?
a What languages do you speak?
b How many different countries do know the names of?
c How many minutes do you spend on your phone each week?
d What types of pets do you have?
4 If the range of a set of data is 28, find the size of each interval if we group the data into: a 4 equal-width intervals b 7 equal-width intervals
5 If one of the class intervals on a histogram is 10–19, find the next equal-width class interval.
6 Consider the following data set:
30, 67, 24, 51, 49, 53, 36, 24, 57, 66, 26
a Determine a set of five intervals that could be used to analyze this data.
b Construct a grouped frequency table for the data.
7 Select a grouped frequency table that appropriately represents the data. 83, 68, 39, 42, 86, 66, 64, 76, 63, 43, 65, 83, 63, 67, 49, 51, 32, 55, 38, 65, 41, 73, 35, 36, 74
Score Frequency
30–39 5 40–49 4
50–59 2
8
3
3 Score Frequency
Score Frequency
30–35 2
36–41 5
42–47 2
48–53 2
54–59 1
60–65 4
66–71 3
72–77 3
78–83 2
84–89 1
practice
8 Mr. Psi surveyed his students to see how long it took them to complete their end-of-year project. Their responses are shown.
36, 50, 66, 46, 78, 63, 58, 39, 84, 40, 81, 45, 86, 51, 68, 43, 64, 67, 37, 68, 48, 65, 60, 82, 75
a Use the data to complete the frequency table.
b Construct a histogram.
9 For the data set:
5
4
2
5
7
2
Score Frequency 31–39 5 41–49 4 51–59 2 61–69 8 71–79 3 81–89 3 Time (minutes) Frequency 30–39 40–49 50–59 60–69 70–79 80–89
12, 59, 61, 27, 58, 18, 76, 27, 52, 19, 13, 56, 71, 31, 73, 60, 41, 17, 22, 68, 57, 15, 40, 19, 76, 44, 60, 55, 36
a Determine a set of seven class intervals that could be used to analyze this data.
b Make a conjecture about which interval will have the largest frequency.
c Construct a histogram.
d Explain how the histogram can be used to verify or disprove your conjecture from part (b).
10 Some people were asked approximately how many of their friends they talk to during a typical month. The results are shown.
1, 2, 27, 14, 29, 14, 27, 11, 29, 14, 11, 37, 41, 5, 4, 26, 6, 22, 29, 10, 18, 3, 6, 19, 44, 17, 14
a Construct a histogram with five bins, each with an interval length of nine.
b Construct a histogram with nine bins, each with a length of four.
c Explain how the size of the bin affects the appearance of the histogram.
11 A frequency table shows the resting heart rate (in beats per minute) of some people taking part in a statistical investigation.
a What data collection method was used to collect the data?
A Observation B Measurement
C Survey D Experiment
b Construct a histogram.
c How many people took part in the study?
d How many people had a resting heart rate between 55 and 74?
e How many people had a resting heart rate below 65?
12 The teachers at Haunted Hills High were asked for their age (in years) and their responses are shown: 28, 55, 42, 37, 34, 29, 61, 45, 36, 28, 30, 25, 56, 62, 25, 41, 24, 39, 60
a What method of data collection was used to collect the data?
A Observation B Measurement
C Survey D Experiment
b Complete the frequency table.
c Construct a histogram.
d What fraction of the teachers are between 30 and 39 years old?
13 A student was interested in analyzing the number of hours her classmates spent studying per week.
She collected data and organized it into a frequency table.
a Formulate a question that could be answered using this data.
b Create a histogram to represent the data.
c Which study hour range is the most common?
14 The following statistical question was used to write an investigative report: “How does the number of movies people in my neighborhood watch in a month vary?” Data was collected, and the results are shown. 5, 9, 11, 9, 7, 14, 6, 2, 8, 16, 5, 18, 22, 1, 1, 15, 0, 6, 6, 4, 2, 14, 4, 10, 11, 3, 20, 9, 9, 7, 5, 3, 8, 0, 12, 7, 14, 16, 2, 5, 12, 7, 3, 17, 9
a What does each piece of data represent?
b Create a histogram to represent the data.
c Determine whether each conclusion is accurate and justify your reasoning.
i The majority of participants watched between 5 and 10 movies in the last month.
ii Most participants watched less than 15 movies in the last month.
iii Only a small number of participants watched 20 or more movies last month.
15 A survey was conducted where 30 people were asked, “How many books have you read in the past month?” The data was collected and organized into the histogram shown. State whether the following conclusions are correct:
a 11 people have read between 6 to 10 books in the past month.
b 28 people have read at most 15 books in the past month.
c 50% of people have read more than 10 books in the past month.
d We cannot determine from the table how many people have read exactly 12 books.
16 People from a particular neighborhood were asked, “At what age did you purchase your first car?” Their responses are displayed in the histogram.
Age (years) Frequency
16–17
18–19
20–21
22–23
24–25
26–27
a Complete the frequency table based on the histogram.
b How many people were surveyed?
c How many people bought their first car before they were 22 years old?
d How many people bought their first car when they were 24 years old or older?
of first car purchase
e Suppose someone was interested in the age at which anyone in the U.S. purchased their first car. Could they use these conclusions in their report? Explain your answer.
17 The histogram shows the number of hours that students in a particular class had slept the night before.
a How many students are in the class?
b How many students had at least 8 hours of sleep that night?
c What percentage of students had less than 6 hours of sleep?
18 Sylvia and Lee create two different histograms for the same data set. The data collected shows the years of life expectancy after patients were diagnosed with lung cancer.
a Explain which histogram is more useful to analyze the data set.
b Lee claims that his histogram shows that 51 patients lived 30 years after being diagnosed with lung cancer. Is this correct? Explain your answer.
19 A student attempted to draw a histogram based on the data shown in the table.
Price, p ($) Frequency
0 ≤ p < 20 6
20 ≤ p < 40 20
40 ≤ p < 60 12
60 ≤ p < 80 6
80 ≤ p < 100 19
100 ≤ p < 120 9
a Identify two mistakes with the histogram.
b Considering the data could include values such as $19.99 or $39.50, redraw the histogram correctly.
c Formulate two questions that could be answered using the histogram.
20 A battery manufacturer tests their batteries in a portable music player, to find out how long the batteries last under constant use. The histogram shows the data from their tests.
a Explain why the class intervals might be misleading.
b What percentage of batteries last longer than 10 hours? Round your answer to one decimal place.
c If the average length of a song is 4 minutes, what percentage of batteries will last for an average of 250 songs or more? Round your answer to one decimal place.
Cost of college textbooks
21 Roanne wants to investigate how much time the teachers at her school spend traveling to work. She wants to use the data cycle to investigate.
a Formulate a question which could be investigated using a histogram.
b Describe a method which could be used to collect data.
c Collect data for your formulated question.
d Organize your data using a histogram.
e Based on the data you collected, state whether the following conclusions can be made.
i The data shows that most people travel to work by car or by walking, since most travel times are fairly short, and only a few people travel by bus or train.
ii The data suggests that people prefer a shorter commute to work. In general, the longer the commute the less people there are in that category.
iii The data suggests that people do not care too much about how far away from work they live. Roughly equal portions of people live less than 40 minutes away and more than 40 minutes away.
iv The data shows that everyone lives within an hour travel from their work.
f This histogram shows the data for a sample of teachers. Are the results similar or different to the results from your sample? Explain.
22 The first time Kris watched a cricket match, she was shocked by how fast the ball was thrown by the cricket bowlers. Every time they bowled, the screen would display how fast the ball was in kilometers per hour. Kris is interested in learning more about the speed of the bowls in cricket.
Go through the whole data cycle at least once using a context that is related to the speed of cricket bowls, where the data can be organized into a histogram.
Histograms display the frequency of data as either a count or relative proportion along the y-axis and divide the numerical data into bins of equal width along the x-axis.
Generally, we include the lower bound and exclude the upper bound, so the equivalent labels for the first bin would be 1 ≤ Rainfall < 5. Annual Rainfall (inches)
Ages on the spinning strawberry ride
(in)
Histograms can also have the intervals labeled on the bars for data that is rounded.
Histograms
Advantages
Good for large quantities of data
Disadvantages
Individual data values are lost
Easy to read off the spread, clusters, and trends Bin size can affect the conclusion We do not need to round when collecting data
Line plots or dot plots display the frequency of data by the number of dots at each value. This display is best used for countable values with a small range.
Dot plot (line plot)
Advantages
Simple to create
Can read off the most and least common response
Can see some clusters in the data
Disadvantages
Difficult to show for large quantities of data
Difficult to show a large number of categories or a large spread
Reflect and check
Technology can make it easier to graph data. With technology, we can create and compare a dot plot or histogram to determine which visual best represents the data. We can also play with the bin or category width for histograms to see the best display.
Shown below are the quiz score percentages from Mr. Sanchez’s first period math class: {20, 25, 26, 30, 30, 40, 43, 63, 65, 67, 70, 70, 75, 90, 93}
a Construct a histogram of the quiz scores with intervals of 15.
Create a strategy
We can use technology or create the histogram by hand. Let’s look at how to do it using technology.
1. Enter the data in a single column.
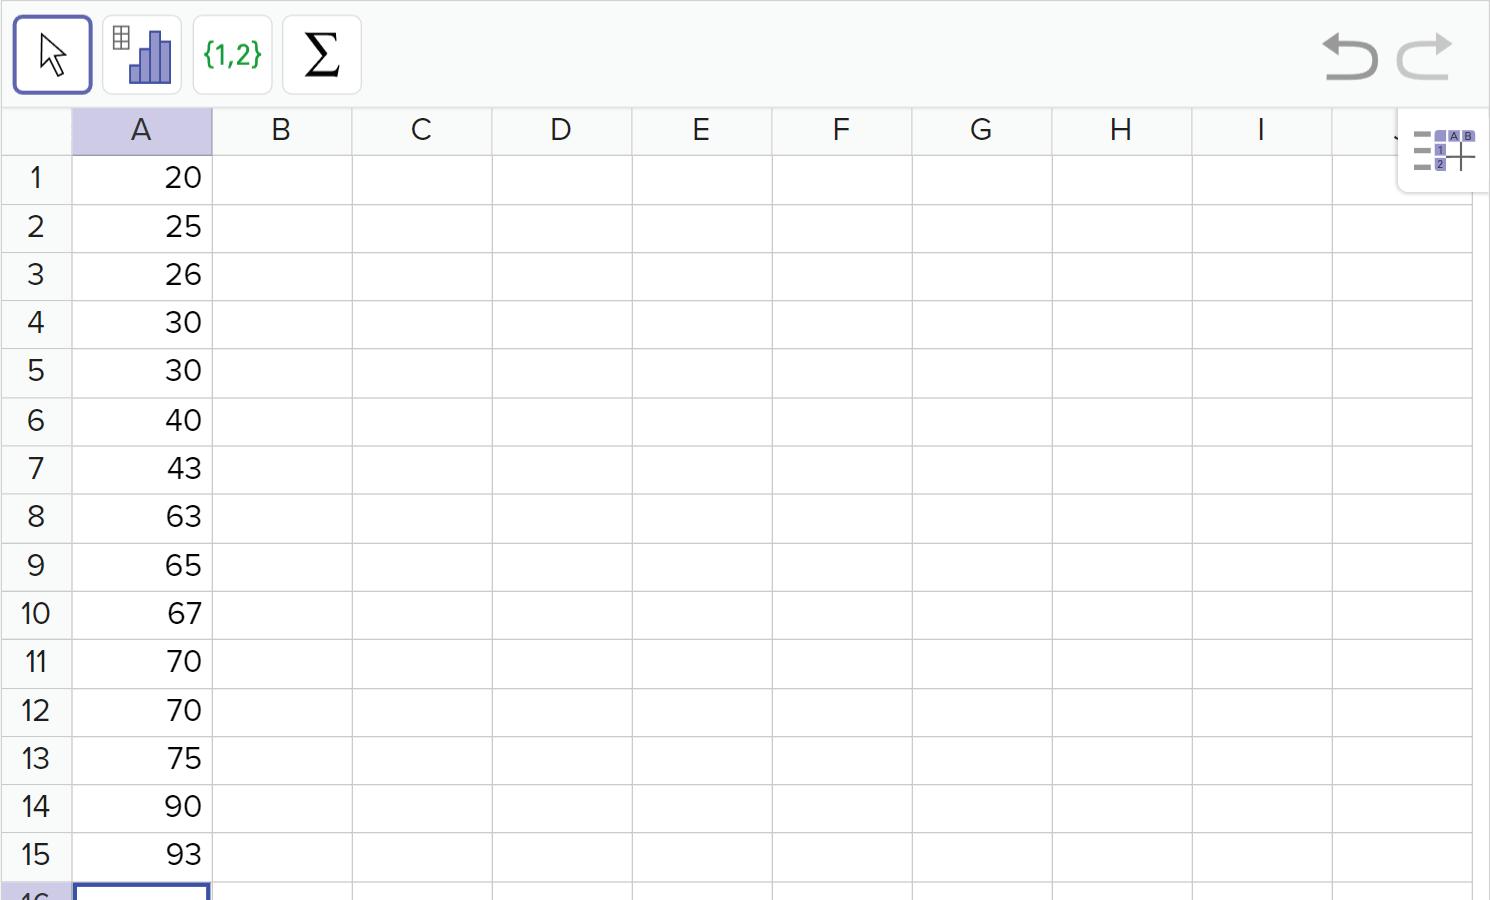
2. Select all of the cells containing data and choose “One Variable Analysis”.

3. By default a histogram is created, but we can then adjust the bin or category widths.
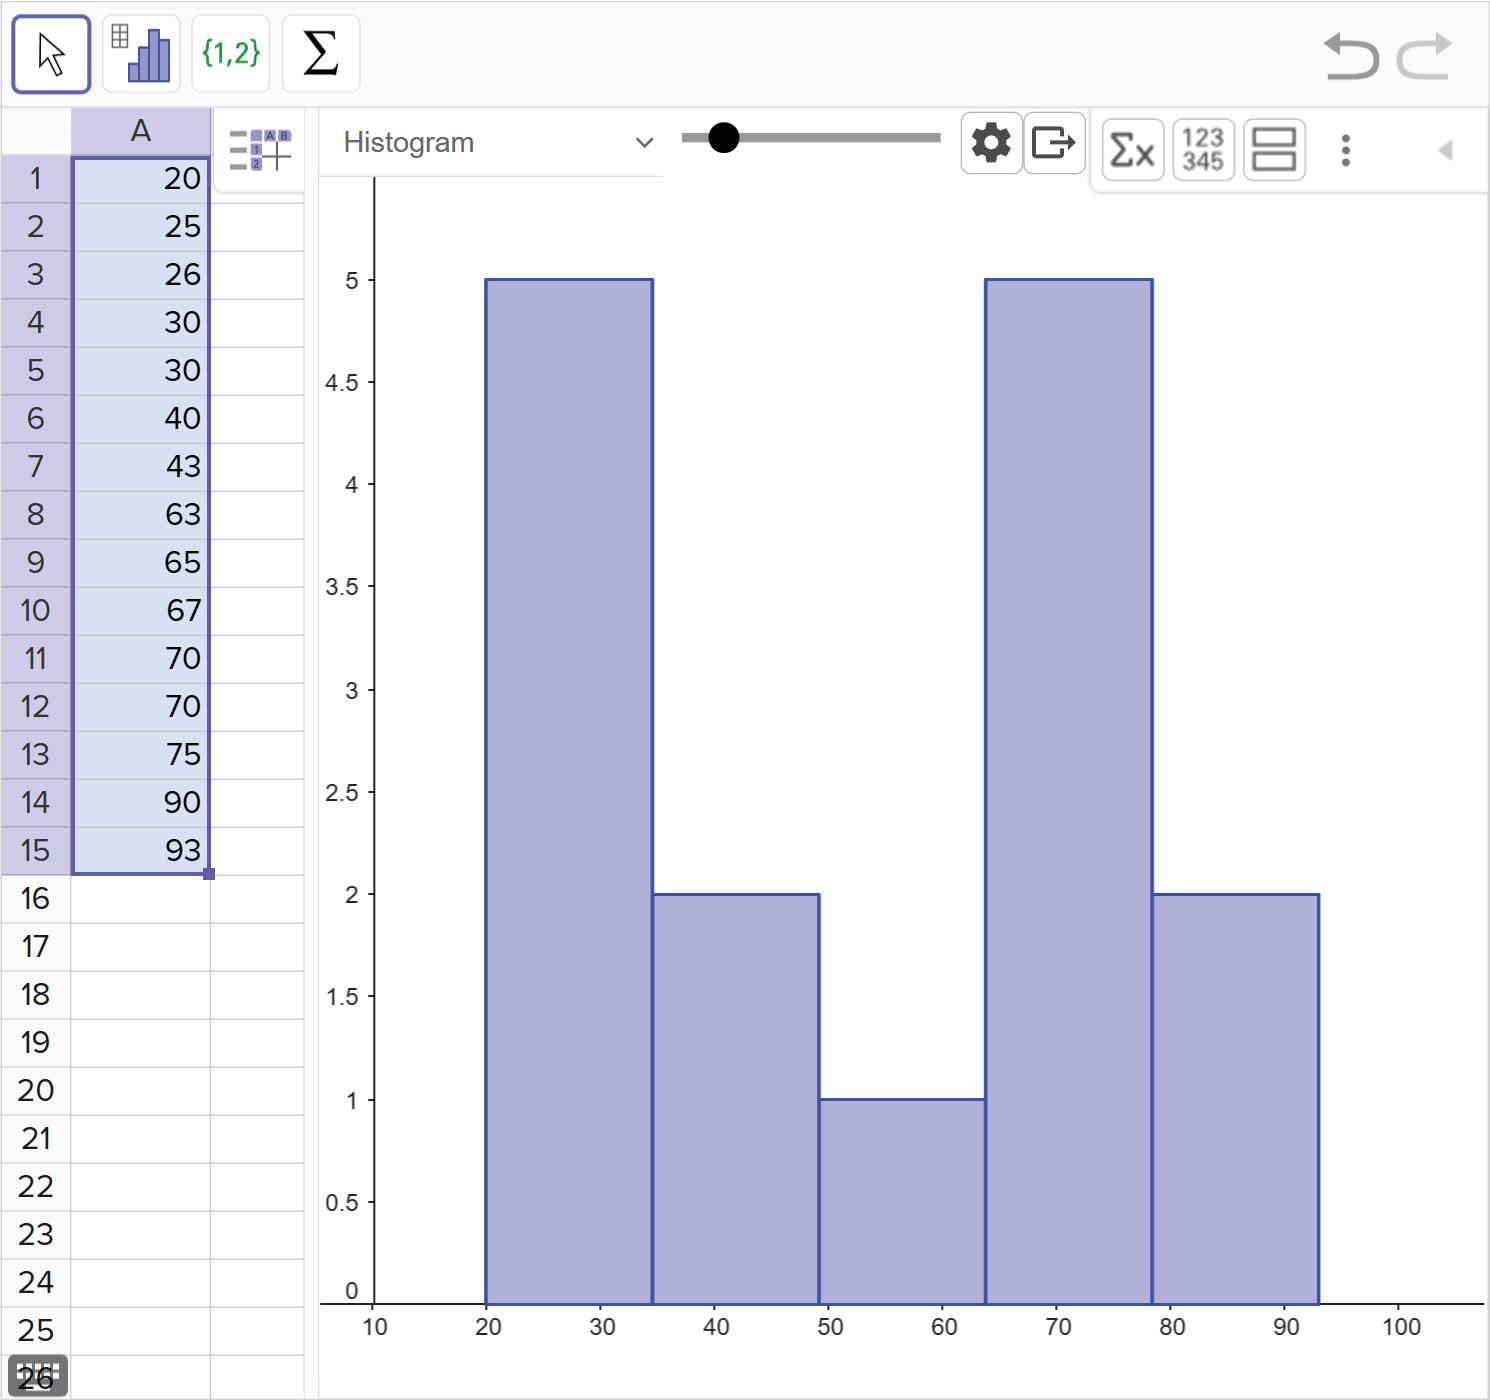
Apply the idea
We now need to adjust the settings by clicking on the gear, ticking the box for Set Classes Manually, and then checking the boxes on top of the histogram as Start: 20 and Width: 15.
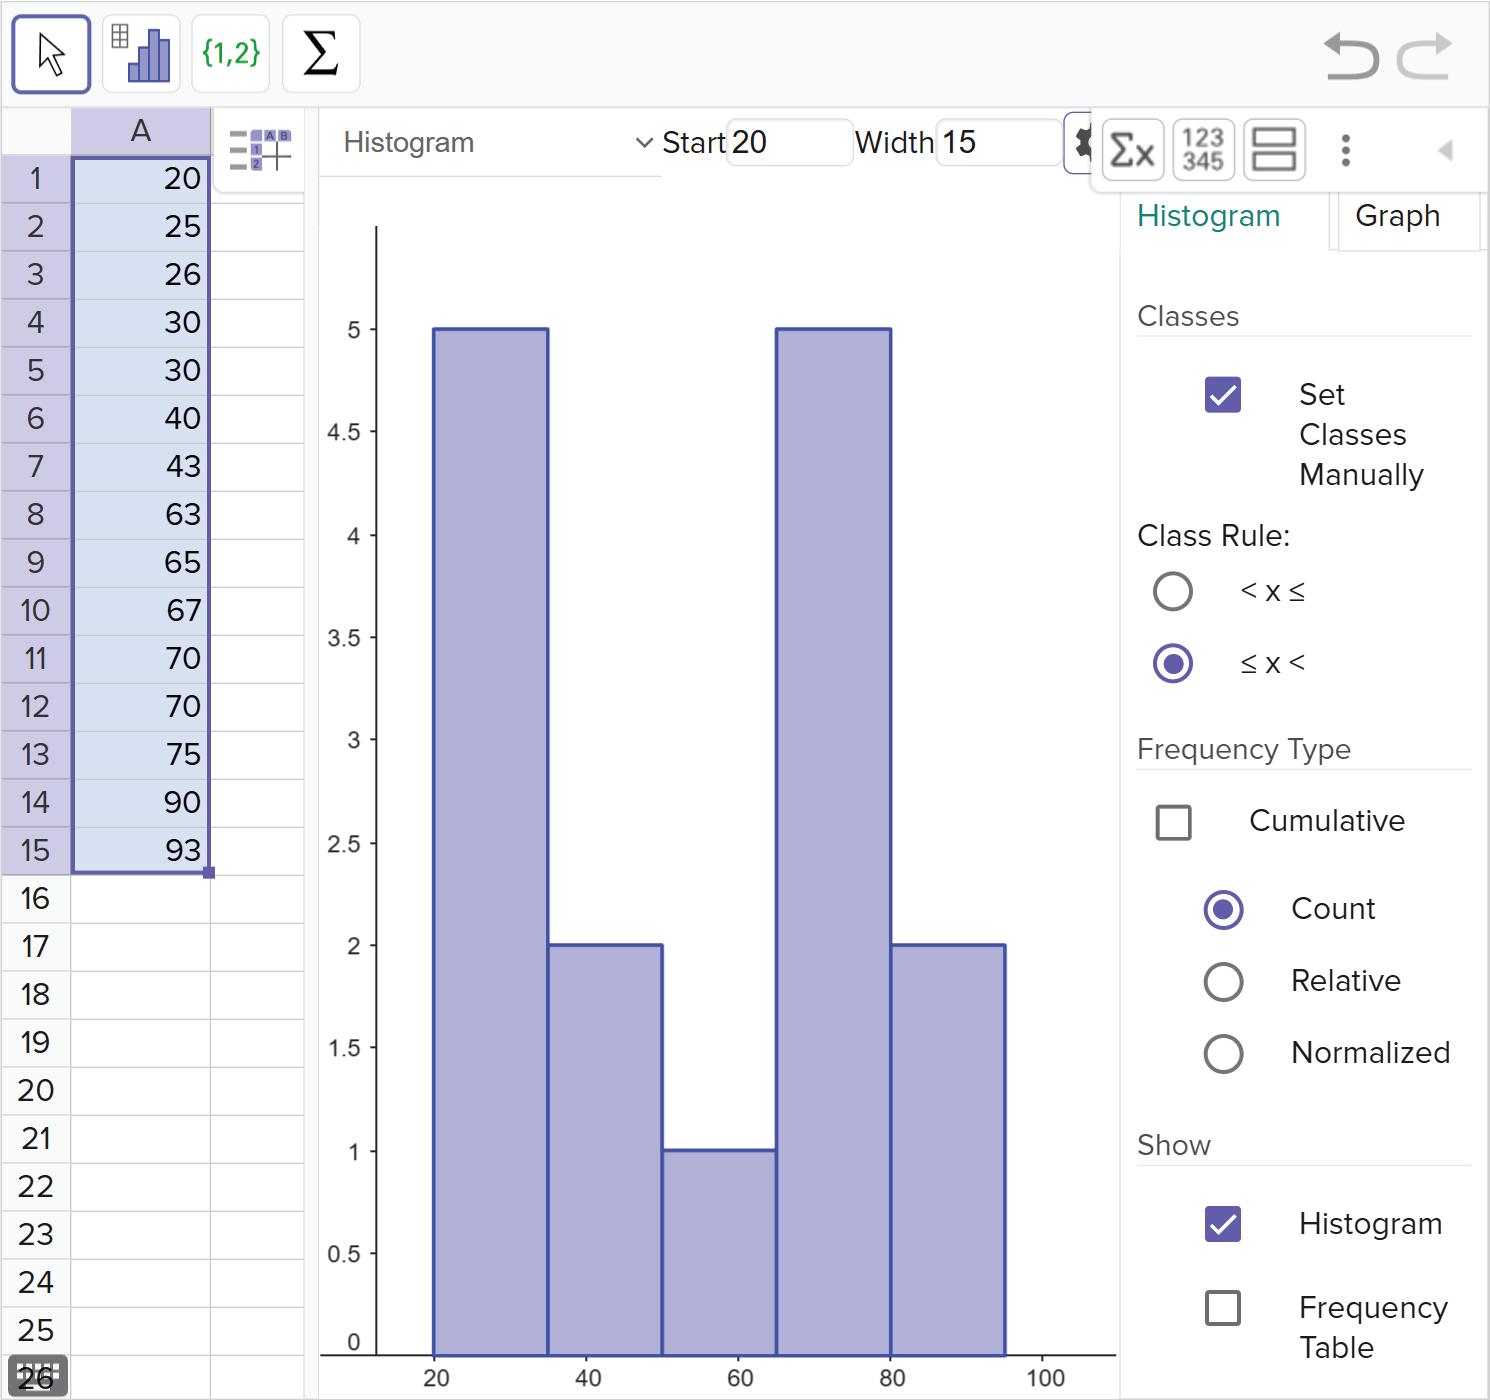
Compare data representations with histograms
8 The CDC surveyed some random people, asking them to estimate approximately how much time they spent in the sun during the previous summer. The frequency histogram shows their responses.
a State what time interval in the sun occurred least often.
b State how many people spent less than 10 hours in the sun.
c Find the number of people who were surveyed.
d Find the proportion of responders who spent at least 60 hours in the sun.
9 Match each of the following scenarios to a type of data display that would be appropriate: i Line plot (dot plot) ii Circle graph iii Histogram iv Stem-and-leaf plot
a A statistician surveyed 1000 people to answer the question “How many hours per day do you spend on your phone?”
b A rental property surveyed the last 30 guests and asked them to rate their stay on a scale of 1 to 5.
c A teacher surveys her students to see what portion would rather paint the door blue compared to yellow or red.
d A fitness instructor recorded the maximum heart rate of her 30 clients during a session.
10 Use any graph to answer each question.
shoppers
a What percentage of people spend less than $40?
b How many people spent more than $100?
c What spending interval was the most common?
d Did more people spend less than $20 or more than $120?
e What types of questions were more easily answered using the: i Histogram? ii Circle graph?
11 The amount of snowfall (in inches) is recorded at the base of a mountain each day. The results are given: 6, 2, 0,
Select the most appropriate display to represent the given set of data: A Circle graph B Line plot (dot plot) C Stem-and-leaf plot D Histogram
Compare data representations with histograms
Big ideas
• The relationship between similar figures can be applied to solve a variety of problems.
• A dilation preserves angle measure but not distance resulting in figures that are similar but not congruent (assuming the scale factor is not 1).
• The relationships between the sides, angles, and diagonals of a polygon can be used to classify the polygon and solve problems.
6.01
After this lesson, you will be able to...
• identify corresponding sides and angles of similar figures with geometric markings.
• write similarity statements using symbols.
Remember that congruent figures have the exact same size and shape. In other words, two figures are congruent if all corresponding sides and all corresponding angles are congruent.
Corresponding sides and angles are a pair of matching angles or sides that are in the same spot in two different shapes.
Recall, we use markings on figures to show congruency.
The curved markings on the angles show us which corresponding angles are congruent.
The hash or hatch marks on the sides show which sides are congruent.
Different numbers of markings represent different measures.
We can use notation to write that different parts of a figure are congruent. The symbol ≅ means ‘is congruent to’.
For the angles:
For the sides: , and .
For the triangles: △ABC ≅ △DEF
Similar Figures
Similar figures have corresponding sides that are proportional and corresponding interior angles that are congruent. The symbol ∼ is used to represent similarity.
Parallelograms CATS and BIRD are similar because all of their corresponding angles are congruent and their corresponding sides are proportional. Specifically, each side of BIRD is 2 times longer than the corresponding side of CATS
We can write the similarity statement: CATS ∼ BIRD
We can identify corresponding angles directly from the similarity statement. Corresponding interior angles are congruent in similar figures.
The sides connecting corresponding angles will be corresponding sides.
corresponds to corresponds to corresponds to , and corresponds to
Similarity does not depend on the position or orientation of the figures. Figures can be turned differently and still be similar. We need to be extra careful with identifying corresponding parts when this is the case.
Here we have two similar triangles. Because their corresponding angles are congruent and their corresponding sides are proportional (by a factor of 3).
Identify congruent angles to find corresponding angles:
and
The sides connecting the corresponding angles will be corresponding sides.
Side corresponds to side . Side corresponds to side
Side corresponds to side .
We can write a similarity statement for the above triangles:
PQR ∼ △EDF
This statement is read as “Triangle PQR is similar to triangle EDF.”
Congruent polygons are similar polygons for which the ratio of the corresponding sides is 1 : 1. However, similar polygons are not necessarily congruent.
The two figures shown are similar with a similarity statement NOPM ∼ TQRS
a Identify all corresponding angles.
Create a strategy
Use the given similarity statement to match up corresponding angles.
b Identify all corresponding sides.
Create a strategy
Use the similarity statement to match up corresponding sides.
Apply the idea
∠N corresponds to ∠T
∠O corresponds to ∠Q
∠P corresponds to ∠R
∠M corresponds to ∠S
Apply the idea
Side corresponds to side
Side corresponds to side
Side corresponds to side
Side corresponds to side
c Write a different similarity statement for these two figures.
Create a strategy
Name both figures using a different, but still corresponding, order of letters. Write a similarity statement using the symbol ∼ for similar figures.
Apply the idea
PMNO ∼ RSTQ
The two triangles shown are similar.
a Identify all corresponding angles.
Create a strategy
Corresponding angles are congruent. This means they have the same measure.
Reflect and check
There are multiple ways we could have written our similarity statement, ensuring corresponding parts.
Another correct way could have been MNOP STQR.
b Identify all corresponding sides.
Create a strategy
Use the corresponding angles found in part (a) to help identify corresponding sides.
Apply the idea
∠A corresponds to ∠X
∠B corresponds to ∠Y
∠C corresponds to ∠Z
Apply the idea
Side corresponds to side
Side corresponds to side
Side corresponds to side
c Write a similarity statement for these two figures.
Create a strategy
Name both figures using a corresponding order of letters. Write a similarity statement using the symbol ∼ for similar figures.
Apply the idea
△ABC ∼ △XY Z
Reflect and check
There are multiple ways we could have written our similarity statement, ensuring corresponding parts.
Another correct way could have been △BCA △YZX.
Figures are similar if:
• All corresponding sides are proportional.
• All corresponding angles are equal.
The symbol ∼ is used to represent similarity. Similarity statements can be used to determine corresponding parts of similar figures. △ABC ∼ △DEF is read as “Triangle ABC is similar to triangle DEF.” Similarity does not depend on the position or orientation of the figures.
1 In the diagram, △ECD ∼ △LMN.
a What must be true about each pair of corresponding angles?
b What must be true about each pair of corresponding sides?
2 What is the difference between congruent shapes and similar shapes?
3 Determine the side corresponding to in each pair of congruent shapes:
4 If △XY Z ∼ △QSR, draw in the angle markers to show the corresponding angles.
5 If quadrilateral ABCD is similar to quadrilateral LMNO, draw in the angle markers to show the corresponding angles.
Let’s practice
6 Which similarity statements can be used to describe the figures? Select all that apply. A
7 Quadrilateral ABCD and quadrilateral WXZY are similar. Which pairs of segments are corresponding sides of these quadrilaterals? Match all pairs that are corresponding.
8 Consider the two similar triangles:
a Identify the angle corresponding to: i ∠D ii ∠B iii ∠C
b corresponds to which side in △RPQ?
c corresponds to which side in △RPQ?
d Write a similarity statement for the two similar triangles.
9 Consider the two triangles. △ECD is similar to △MLN.
a Use the similarity statement to place each letter on a vertex it could describe. C D E N L M
b Fill in the blanks with ∼ , ≅, or ≇ to make each statement true.
i △CED ⬚ △LMN ii ∠D ⬚ ∠M iii ⬚ iv ∠C ⬚ ∠L
10 In the diagram, quadrilateral ABCD is similar to quadrilateral EFGH.
a Match the corresponding angles by filling in the blanks:
∠A corresponds to ∠⬚
∠D corresponds to ∠⬚
∠C corresponds to ∠⬚
∠B corresponds to ∠⬚
b What must be true about these pairs of angles?
c Which side in quadrilateral EFGH corresponds to ?
d Which side in quadrilateral EFGH corresponds to ?
11 The two triangles shown are similar:
a Identify the angle corresponding to: i ∠D ii ∠B iii ∠C
b Match the corresponding sides by filling in the blanks. i corresponds to ⬚ ii corresponds to ⬚ iii corresponds to ⬚
12 These two quadrilaterals are similar:
a Which side in the larger shape corresponds to side ?
b Which angle in the larger shape corresponds to ∠D?
c Write a similarity statement for the two quadrilaterals.
13 If △ABC ∼ △RST, fill in the blanks to complete the statements.
a ∠B corresponds to ⬚ b corresponds to ⬚
c corresponds to ⬚ d ∠C corresponds to ⬚
e corresponds to ⬚ f ∠A corresponds to ⬚
14 Consider a pair of similar quadrilaterals.
In quadrilateral ABCD, ∠A = 105°, ∠B = 45°, ∠C = 75°, and ∠D = 135°.
In quadrilateral RSTU, ∠R = 45°, ∠S = 75°, ∠T = 135°, and ∠U = 105°.
Julio wrote the similarity statement for the two triangles incorrectly as ABCD ∼ RSTU
a Explain why the given similarity statement is incorrect.
b Correct the similarity statement based on the information provided.
15 a Write two different similarity statements using the points D, E, F.
b List all corresponding sides and angles for each similarity statement.
c Explain why the order of the points in the similarity statement is important.
16 Consider the triangles:
Given that , and ∠M = 79°, find the value of x
17 For each pair of similar shapes determine the value of x:
18 If two shapes are congruent, are they also similar? Explain your answer.
19 If two shapes are similar, are they are also congruent? Explain your answer.
20 Determine whether the two shapes are similar and give a reason for your answer:
21 Give an example of two quadrilaterals in which all four pairs of sides are congruent, but the quadrilaterals themselves are not congruent.
After this lesson, you will be able to...
• write proportions for pairs of similar figures.
• identify the scale factor for a pair of similar figures.
• identify and justify whether two figures are similar.
Similar Figures
Similar figures have corresponding sides that are proportional and corresponding interior angles that are congruent. The symbol ∼ is used to represent similarity.
Interactive exploration
Explore online to answer the questions
mathspace.co
Use the interactive exploration in 6.02 to answer these questions.
1. Which parts of the shape stay the same?
2. Which parts of the shape change?
3. What is special about a scale factor of 1? What name can we use for these shapes?
4. What do you think a scale factor is?
A scale factor is the ratio between the corresponding sides of two similar figures.
An enlargement is an increase in size without changing the shape. This means a scale factor greater than 1.
A reduction is a decrease in size without changing the shape. This means a scale factor between 0 and 1.
To find the scale factor, we need to figure out what number we can multiply all of the sides of a given figure by to create the similar figure.
Consider these triangles that have the same angle measures but different side lengths.
Notice, each side in the smaller triangle is multiplied by 3 to create the side of the larger triangle. This means that the scale factor is 3.
Consider these polygons. All of their corresponding angles are congruent but we need to check to see whether the corresponding sides are proportional before we decide that the polygons are similar.
We can write the ratio for each pair of corresponding sides to see if they all have the same ratio. corresponds to corresponds to corresponds to , and corresponds .
All of the ratios are the same so all of the corresponding sides are proportional. Since we already noticed the corresponding angles are congruent, we can say the figures are similar.
We can write a similarity statement:
∼ ABCD
The scale factor is , making this a reduction in size since the scale factor is between 0 and 1.
Identify the scale factor for each pair of similar figures. a LMNO ∼ STUV
Create a strategy
Use the given similarity statement to identify corresponding sides. Look at how the side lengths of the original figure have changed to create the new figure. What were they all multiplied by?
Apply the idea
Identify the corresponding sides: corresponds to corresponds to corresponds to , and corresponds to Each side of figure LMNO was multiplied by 3 to create the second figure, STUV. The scale factor is 3.
Reflect and check
Since the scale factor is larger than one, this is an enlargement.
We could have also set up a ratio of corresponding sides. Since we are told the figures are similar, you only need one pair of corresponding sides to find scale factor.
Set up a ratio of corresponding sides ST and LM
Divide
Create a strategy
Use the given similarity statement or image to identify a pair of corresponding sides. Use the sides to write a ratio and find the scale factor.
Apply the idea corresponds to . Use this to create a ratio:
Set up a ratio of corresponding sides LM and QR
Simplify the fraction
The scale factor is
Reflect and check
Since the scale factor is between 0 and 1, this is a reduction. We could have used any pair of corresponding sides to find scale factor.
Set up a ratio of corresponding sides MN and RS
Simplify the fraction
Set up ratio of corresponding sides MN and RS
Simplify the fraction
Create a strategy
Use the given similarity statement or image to identify a pair of corresponding sides. Use the sides to write a ratio and find the scale factor.
Apply the idea corresponds to . Use this to create a ratio:
Set up a ratio of corresponding sides LM and QR
Divide
The scale factor is 2.5.
Determine whether each pair of figures is similar. Justify your reasoning.
Create a strategy
Two figures are similar if all corresponding angles are congruent and all corresponding sides are proportional.
Apply the idea
First, we will check to see if all of the corresponding angles are congruent.
We can see m∠C = 40° in △ABC and there is no angle in △DEF with the same measure.
Since all corresponding interior angles are not congruent, these figures are not similar.
Reflect and check
We did not need to check for proportional sides since the corresponding angles are not congruent. This automatically tells us that these two triangles are not similar.
Create a strategy
All rectangles have four 90° angles. This means all of the corresponding angles between any two rectangles are always congruent. So, we just need to see if all of the corresponding sides are proportional.
Apply the idea
Set up ratios of the corresponding sides:
Ratio of corresponding sides AB and QR
Simplify the fraction
Ratio of corresponding sides BC and RS
Simplify the fraction
The ratios are not equal, so the rectangle ABCD is not similar to rectangle QRST.
Create a strategy
Two figures are similar if all corresponding angles are congruent and all corresponding sides are proportional.
Apply the idea
Using the curved angle markings, we can see that all corresponding interior angles are congruent.
Use the corresponding angles from above part (a) to help identify corresponding sides:
• corresponds to since ∠
• corresponds to since
• corresponds to since ∠J
and
and
and
W
• corresponds to since ∠H ≅ ∠X and ∠G ≅ ∠Y
Set up ratios of corresponding sides to determine if they are proportional:
Ratio of corresponding sides FG and ZY
Simplify the fraction
Ratio of corresponding sides FJ and ZW
Simplify the fraction
Ratio of corresponding sides JX and WX
Simplify the fraction
Ratio of corresponding sides HG and XY
Simplify ratio
All corresponding sides are proportional since they all have the same ratio, or scale factor. These two figures are similar, since all corresponding angles are congruent and corresponding sides are proportional.
Reflect and check
This represents an enlargement since the scale factor, , is greater than 1. We can write a similarity statement:
Figures are similar when both:
• Corresponding interior angles are congruent, and
• Corresponding sides are proportional.
Scale factor is the ratio of corresponding sides in similar figures.
Similarity Statements are written as △ABC ∼ △XY Z. This can help us identify corresponding parts and set up our ratio of corresponding sides.
1 What characteristics are required for two shapes to be similar?
2 Consider each of the following proportional relationships.
i Identify the constant of proportionality. ii Complete the table by filling in the missing values.
3 In the diagram, JK ∥ MN so that △LJK and △LNM are similar.
a Use the correct mathematical symbols to state that the two triangles are similar.
b Identify the angle that is congruent to: i ∠J ii ∠K
c Identify the side that corresponds to: i ii
4 In each pair of figures, determine whether the figures are similar. If they are, find the scale factor of the larger shape to the side lengths of the smaller shape.
5 Determine whether each statement is true or false.
a All rectangles are similar.
c All equilateral triangles are similar.
Let’s practice
6 Look at this triangle:
b All squares are similar.
d All isosceles triangles are similar.
7 Fill in the blanks to show that the two quadrilaterals are similar. In similar figures, the ratios between corresponding side lengths are ⬚
Therefore, ABCD ∼ ⬚
8 The following ratio table shows the side lengths of two triangles.
a Complete the table with the missing values.
△XY Z △MON Ratio of side lengths
b Write a similarity statement for the triangles.
9 Explain how you know these pairs of figures are similar:
10 Triangle LMN is similar to triangle QRS. Which proportion can be used to find e?
11 Quadrilateral CDEF is similar to quadrilateral QRST.
Which proportion could be used to find x?
12 Consider quadrilateral ABCD and quadrilateral LMNO. If we know ABCD ∼ NOLM, which of the following ratios must be equal to ?
13 For two right triangles △ABC and △XY Z, is each statement true or false?
a Since they are both right triangles, they are similar.
b If they have one acute angle in common, they are similar.
c If they have the same hypotenuse length, they are similar.
d If △ABC △XY Z, then .
e If △ABC ∼ △XY Z, then .
f If △ABC ∼ △XY Z, then .
14 Given two quadrilaterals, we know JKLM ∼ TV US. Fill in the blanks below to write two more similarity statements for these quadrilaterals.
a LMJK ∼ ⬚ b ⬚ ∼ UV TS
15 Quadrilateral CDEF is similar to Quadrilateral VWXY. Which one doesn’t belong with the other three? Explain your reasoning.
16 Which two triangles are similar? Explain your answer.
1
2 Triangle 3
17 Explain how you know these hexagons are similar.
4
18 Determine whether the two given shapes are similar. Explain your answer.
19 Consider the two circles.
a Determine the ratio of the diameter of the small circle to the diameter of the large circle.
b Determine the ratio of the area of the small circle to the area of the large circle.
20 Using the digits 0 9, at most one time each, fill in the boxes so that the two rectangles are similar.
21 If every angle in an n-sided polygon matches exactly with an angle in another n-sided polygon, does this mean that the two polygons are definitely similar? Explain your answer.
After this lesson, you will be able to...
• solve for unknown side lengths in similar figures.
• solve for unknown angle measures in similar figures.
• solve real-world problems using similar figures.
Recall the side lengths of similar shapes are in the same ratio or proportion.
If two figures are similar, we can use the definition of similarity to find unknown measures.
Consider these triangles where we do not know the measure of ∠E, but we are told:
△ABC ∼ △DEF
We know similar figures have congruent corresponding angles. The similarity statement, tells us ∠B corresponds to ∠E
If angles are congruent, they have the same degree measure, so x = 46°.
If these figures are similar, find the value of x
It is difficult to identify the scale factor when one side is not a clear multiple of its corresponding side. In situations like this we can write a proportion.
A proportion is an equation involving the ratios of corresponding sides. We need to make sure to use the pair of corresponding sides that includes the unknown side length x for one side of the equation. For the other side, we can choose any other corresponding pair as long as we know both side lengths.
Let’s use sides (the unknown) and for the left side and sides and for the right side.
Write the proportion of the side lengths
Substitute the known values
Means extremes property
Evaluate the multiplication
Divide both sides by 9.8
Evaluate the division
So the length of is 2.5 inches.
We can confirm this by finding the scale factor which is the ratio between the corresponding sides. The ratio
CD : KM = 9.8 : 3.5 or . Simplifying that fraction we get a scale factor of 2.8.
To get from the side with length x = 2.5 to its corresponding side with length 7 we can multiply 2.5 2.8 = 7. This confirms the length of side .
Given that the two quadrilaterals shown are similar, what is the value of x?
Create a strategy
Corresponding angles are congruent in similar figures. So, we need to find the measure of the angle that corresponds with ∠S
Apply the idea
∠S corresponds with ∠D so ∠S ≅ ∠D
Congruent angles have the same degree measure.
x = 105
Reflect and check
Keep in mind the value of x is 105, but m∠S = 105°.
Given that the two quadrilaterals shown are similar, find the value of w.
Create a strategy
Write the proportion between the corresponding sides to find w. The side corresponds to the side which has the length w
Apply the idea
Write the proportion for the given sides
Simplify the fraction
Means extremes property
Evaluate the multiplication
Divide both sides by 4
Evaluate the division
Reflect and check
We can confirm this by finding the scale factor which is the ratio between the corresponding sides.
The ratio BC : FG = 18 : 8 or . Simplifying that fraction, we get a scale factor of . This is greater than 1 which makes sense because the shape was enlarged.
To get from length EF = 16 to its corresponding side length AB = w we can multiply 16 = = 36. This confirms the length of side
A 4.5 m high flagpole casts a shadow of 4.4 m. At the same time, the shadow of a nearby building falls at the same point (S). The shadow cast by the building creates a pair of similar triangles and measures 8.8 m. Find h, the height of the building, using a proportion statement.
Create a strategy
Write a proportion to represent the ratios of the corresponding sides of the similar triangles.
Apply the idea
Write a proportion with the corresponding sides
Simplify the fraction
Multiply both sides by 4.5
Evaluate
If two figures are similar, their:
• Corresponding angles are congruent.
• Corresponding sides are proportional.
Unknown side lengths can be found by writing a proportion with the corresponding sides and solving using the means extremes property.
1 The following tables represent the relationship between corresponding side lengths in similar shapes. Complete the missing values in the table.
a Constant of proportion: 2
2 Solve for x in the following proportions.
b Constant of proportion:
3 The triangles shown are congruent. Find the value of x:
4 Consider the following pair of similar triangles.
a Write a similarity statement.
b Which of these proportions could be used to solve for x?
c Find the value of x by solving the proportion.
Let’s practice
5 The two given trapezoids are similar:
a Write a proportion that could be used to solve for x
b Calculate the size of x
6 For each pair of similar triangles:
i Write a proportion that could be used to solve for the unknown variable.
ii Find the value of the variable.
7 The two given triangles are similar:
Find the missing length y
8 The diagram shows two similar triangles with given side lengths:
a Find the value of v
b Find the value of u
c State the constant of proportion from the smaller triangle to the larger triangle.
9 The two given triangles are similar:
a Write a similarity statement for the two triangles.
b Find the value of x
c Find the value of c
10 For what value of x is △EFG ∼ △HIJ ?
11 For each of the given diagrams, the two quadrilaterals are similar.
a If a = 6 cm, d = 11 cm and g = 5 cm, find the exact value of k
b If r = 9 m, s = 17 m and c = 5 m, find the exact value of d
c If a = 20 cm, d = 68 cm and s = 51 cm, find the exact value of p
12 Consider the pair of similar triangles:
a Find the value of x.
b Explain your answer to part (a).
13 The two given triangles are similar:
a Justify the similarity of the two triangles.
b Find the value of each variable: i s ii n iii m
14 If quadrilateral EFGH is similar to quadrilateral STQR, find the missing angle measurements.
15 Given quadrilaterals BCDE ∼ FGHI and the proportion If EB = 13 inches, which could be the length of IF ?
A 15 inches B inches C inches D 65 inches
16 A scale model of a skyscraper is a smaller version of an actual skyscraper, where all sides of the models are proportional. The scale model of a skyscraper is 24 inches tall. The actual skyscraper is 600 feet tall. If the width of the model is 6 inches, what is the width of the actual skyscraper?
17 The city council has designed plans for a triangular courtyard in the town square. Their scale drawing, which is similar to the actual courtyard, shows the courtyard to have dimensions of 4 cm, 6 cm and 9 cm. The shortest side of the actual courtyard is to be 80 m long.
a State the longest side length of the actual courtyard in meters.
b State the middle side length of the actual courtyard in meters.
18 Clarence made a scale drawing of a classroom. The scale in the drawing is 2 inches represents 9 feet. The actual length of the classroom is 36 feet. What is the length of the classroom on the scale drawing?
A 4 inches B 8 inches C 27 inches D 162 inches
19 Jenny wants to find the height of her school’s flag pole. During recess, she measures the length of the flag pole’s shadow to be 335 cm. Her friend then measures her own shadow which turns out to be 95 cm. The triangles formed by casting these shadows are similar.
If Jenny is 160 cm tall, what is the height of the flag pole? Round your answer to the nearest whole centimeter.
20 Two similar triangles are created by cables supporting a yacht’s mast. Solve for h, the height of the mast.
21 An equilateral triangle of side length 6 ft is to be enlarged by a factor of 5. This means the ratio of the sides of the larger triangle to the smaller triangle is 5 : 1.
a Determine the side length of the resulting triangle.
b Determine the measure of each angle in the resulting triangle.
22 A 4 in × 6 in (10 cm × 15 cm) picture of a sun is enlarged. The new picture is similar to the original picture.
a What is the ratio of the new picture to the original picture?
b If the diameter of the sun in the 4 × 6 photo is 6.35 cm, what is the diameter of the sun in the 8 in × 12 in photo?
After this lesson, you will be able to...
• find the coordinates of a polygon that has been dilated.
• draw a dilated polygon in the coordinate plane.
• describe dilations of polygons that represent real-world scenarios.
We’ve learned that similar polygons have all corresponding sides in the same ratio. So if a shape is enlarged or reduced, all the side lengths will increase or decrease in the same ratio. This enlargement or reduction is called a dilation. For example, let’s say △ABC has side lengths of 3 cm, 4 cm, and 5 cm. If it is dilated by a scale factor of 2 to produce △XY Z, then △XY Z will have side lengths of 6 cm, 8 cm, and 10 cm, as shown:
If any of these ratios were not equal to 2, then this would not be a dilation.
Well, we need two things:
1. A center of dilation: a point from where we start the enlargement. This may be inside or outside the original shape, and for now we will only use the origin on a coordinate plane.
2. A scale factor: the ratio by which we increase or decrease the shape. We calculate a scale factor just like we would calculate the ratio of the sides in similar triangles.
Interactive exploration
Explore online to answer the questions
Use the interactive exploration in 6.04 to answer these questions.
1. Can you make a preimage where the point (0, 0) is inside the image? outside the image? on an edge of the image? How?
2. Can you make a preimage which is completely inside the image? How?
3. What scale factors make the image larger than the preimage? Which make is smaller? Which make it the same size?
A scale factor can increase or decrease the size of the new shape, called the image. The original shape before the dilation is called the preimage
Emma and Noah are designing a garden layout. They measured their garden and are trying to make a scale model to plan the placement of plants and pathways. Their garden includes a section for a rectangular vegetable garden and a square flower bed on the corner to attract pollinators.
Scale drawing
a What is the scale factor from the garden to the drawing?
Create a strategy
Convert both dimensions to the same units and compare the ratio of the corresponding side lengths to determine the scale factor.
Apply the idea
The actual length of the garden is 6 m and the length in the drawing is 15 cm. We can use these two side lengths to create a ratio.
To convert the length of 6 m to cm we need to multiply by 100.
6 m 100 = 600 cm
Divide corresponding lengths
Simplify the fraction
The scale factor from the actual garden to the scaled down drawing is
b Draw the scale model with all sides labeled.
Create a strategy
Scale down all dimensions by the scale factor of after converting to the same units.
Apply the idea
First, to convert from meters to centimeters we need to multiply each actual length by 100.
4 m 100 = 400 cm
1 m ⋅ 100 = 100 cm
Then, we need to use the scale factor to dilate these actual lengths down to the drawing lengths.
400 cm = 10 cm
100 cm = 2.5 cm Real garden 1 m
We know the opposite length of the rectangular vegetable garden because it will be equivalent to the opposite side. Same goes for the square flower bed, because we know the shape is a square all the sides are equal.
Instead of having those individual lengths listed on the side where the vegetable garden and flower bed are adjacent, we can total those lengths.
We can find the final missing length by subtracting the side length of the flower bed from the width of the vegetable garden. 10 cm 2.5 cm = 7.5 cm
A scale factor can increase or decrease the size of the new shape.
• If the scale factor, k, has k > 1, the image will be larger than the preimage
• If the scale factor, k, has 0 < k < 1, the image will be smaller than the preimage
With a scale factor of k and a center of dilation (0, 0), the preimage point (x, y) will become the image point of (kx, ky).
The ratios of corresponding side lengths must be the same, for example in a rectangle:
1 Fill in the blanks with the word “reduced”, “enlarged, or “unchanged”.
a Any dilation with a scale factor less than 1 will be ⬚
b Any dilation with a scale factor greater than 1 will be ⬚
c Any dilation with a scale factor equal to 1 will be ⬚
After this lesson, you will be able to...
• compare and contrast the properties of different types of quadrilaterals.
• classify quadrilaterals based on their properties.
A polygon is a closed plane figure composed of at least three line segments that do not cross.
Quadrilateral
A polygon with exactly four sides and four vertices.
Properties of quadrilaterals include the number of parallel sides, angle measures, number of congruent sides, lines of symmetry, and the relationship between the diagonals.
Diagonal
A diagonal is a segment in a polygon that connects two vertices but is not a side.
Line of symmetry
A line of symmetry divides a figure into two congruent parts, each of which are mirror images of the other.
Use the interactive exploration in 6.05 to answer these questions.
1. Sides
2. Angles
3. Diagonals
4. Lines of symmetry
A parallelogram is a quadrilateral with both pairs of opposite sides parallel.
The properties of parallelograms are:
• Opposite sides are parallel and congruent
• Opposite angles are congruent
• Diagonals bisect each other (cut each other equally in half)
• Each diagonal divides the figure into two congruent triangles
Parallelograms, have no lines of symmetry (except for rectangles and rhombi).
A rectangle is a special type of parallelogram with four right angles.
Rectangles have the following properties:
• Opposite sides are parallel and congruent
• All four angles are 90° and congruent.
• Diagonals are congruent and bisect each other
• Have two lines of symmetry
Notice a rectangle has all of the properties of a parallelogram, plus some of its own properties.
A rhombus is a special type of parallelogram with four congruent sides.
The following are properties of a rhombus:
• All sides are congruent
• Opposite sides are parallel
• Opposite angles are congruent
• Diagonals bisect each other at right angles
• Has two lines of symmetry
Notice a rhombus has all of the properties of a parallelogram, plus some of its own properties.
A square is a regular polygon with four congruent sides and four right angles. This makes a square not only a parallelogram but also a rectangle and a rhombus. Its properties are:
• Opposite sides are congruent and parallel
• All four angles are congruent and each angle measures 90°
• Diagonals are congruent and bisect each other at right angles
• Has four lines of symmetry
A trapezoid is a quadrilateral with exactly one pair of parallel sides. This means it is not a parallelogram.
The parallel sides of a trapezoid are called bases
The nonparallel sides are called the legs.
An isosceles trapezoid is a type of trapezoid whose legs are equal in length. Its properties are:
• Legs are congruent
• Base angles are congruent
• Bases are parallel
• Has one line of symmetry
Example 1
Place each shape in its appropriate place in the Venn diagram.
trapezoid rectangle square parallelogram rhombus
Diagonals always...
are equal in length
Create a strategy
We need to understand the properties of each shape and how they relate to one another in the Venn diagram.
Apply the idea
Square - Diagonals are congruent and are bisect each other at right angles (are perpendicular)
Rectangle - Diagonals are congruent and bisect each other
Rhombus - Diagonals bisect each other at right angles (are perpendicular)
Parallelogram - Diagonals bisect each other
Trapezoid - Diagonals have none of the listed properties
Diagonals always...
are equal in length
Place the shapes in order from smallest to greatest number of lines of symmetry.
Square Isosceles trapezoid Parallelogram Rhombus
Create a strategy
First, we need to draw and count the number of lines of symmetry each shape has. Then, we can order them by the number of their lines of symmetry.
Apply the idea
Square
Isosceles trapezoid Parallelogram Rhombus
A square has 4 lines of symmetry, an isosceles trapezoid has 1, a parallelogram has none, and a rhombus has 2. In order from smallest to great:
The properties of sides and angles of the different properties of quadrilaterals can be summarized as follows: All Sides Congruent Four Right Angles Opposite Sides Congruent Opposite Sides Parallel Opposite Angles Congruent
Trapezoid
The properties of diagonals can be summarized as follows:
Diagonals congruent Diagonals perpendicular Diagonals bisect each other Diagonals bisect opposite angle
Parallelogram
We’ve just learned all about some different properties of quadrilaterals. Let’s explore whether there is any overlap.
1. Review the properties of all of the different types of quadrilaterals. Are there any shapes that satisfy all of the criteria of a different shape?
2. Are there any quadrilaterals that do not satisfy the criteria for a different type of shape?
All of the shapes we’ve discussed are quadrilaterals because they have 4 sides. Quadrilaterals all share some properties, but they can be divided in to different subgroups based on additional properties that a given shape has. Let’s take a look at the quadrilateral hierarchy:
quadrilateral
rectangle trapezoid isosceles trapezoid
parallelogram
Each shape belongs to all of the groups connected above it.
rhombus
square
Quadrilaterals Parallelograms
The Venn diagram is another way to visualize which groups a figure belongs to.
Some figures belong to multiple groups. When a shape belongs to multiple groups, the most precise classification is the group that is the most restrictive one (the one with the most properties).
For example, we see that a square is a rectangle, a rhombus, a parallelogram, and a quadrilateral. The most precise classification is the most detailed one, in this case a square.
trapezoid isosceles trapezoid
rectangle
Rhombi Squares Rectangles Trapezoids
quadrilateral
parallelogram
rhombus
square
1 Which statements are true?
A All squares are rectangles.
C All rectangles are parallelograms.
E All rhombuses are parallelograms.
2 Name two types of quadrilaterals with four right angles.
B All squares are parallelograms.
D All squares are rhombuses.
3 Which type of quadrilateral does not belong with the other three? Explain your reasoning.
A Rectangle B Parallelogram C Square
4 The Venn Diagram represents the relationships between the following quadrilaterals: Rectangle, Parallelogram, Rhombus, Square, Trapezoid, and Quadrilateral
Label the Venn Diagram accordingly.
5 In the quadrilateral ABCD, side AB has a length of 6 units. State the other side of ABCD which must have a length of 6 units.
6 Below are pictures of four quadrilaterals: a square, a rectangle, a trapezoid and a parallelogram. Identify and draw the lines of symmetry in each figure.
7 Consider the following shapes.
i Determine whether the following shapes are rectangles.
ii If the shape is not a rectangle, state a reason why. a b c
e f
8 Consider the following shapes.
i Determine whether the following shapes are squares.
ii If the shape is not a square, state a reason why.
b c d
9 Consider the following shapes.
i Determine whether the following shapes are trapezoids.
ii If the shape is not a trapezoid, state a reason why.
10 Consider the following shapes.
i Determine whether each of the following shapes is a rhombus.
ii If the shape is not a rhombus, state a reason why.
a b c d
11 Consider the following shapes.
i Determine whether the following shapes are parallelograms.
ii If the shape is not a parallelogram, state a reason why.
12 Which statement best describes the properties of a rectangle?
A All sides are congruent, and opposite sides are parallel.
B Opposite sides are parallel, and all angles are right angles.
C Two sides are parallel, and two sides are perpendicular.
D All sides are congruent, and each angle is less than 90 degrees.
13 Which two shapes have the same number of lines of symmetry? A B C D
14 Which of the following quadrilaterals has two pairs of congruent sides that are also adjacent to each other?
A Square B Rectangle C Rhombus D Parallelogram
15 Which parallelogram has the greatest number of lines of symmetry?
A Square B Rectangle C Rhombus
16 Which quadrilateral has 4 congruent sides and exactly 2 lines of symmetry?
A Trapezoid B Square C Rectangle D Rhombus
17 Quadrilateral QRST has the following properties:
• The diagonals are congruent.
• The diagonals bisect each other.
• The diagonals are NOT perpendicular.
Quadrilateral QRST is ⬚
A a parallelogram that is a rhombus
C a parallelogram that is a rectangle
18 Quadrilateral QRST has the following properties:
• Exactly two right angles
• One pair of parallel sides
• No lines of symmetry
Quadrilateral QRST is a ⬚
A parallelogram B square
B a rhombus that is a square
D a rectangle that is a square
C rectangle D trapezoid
19 Which of the following statements does not correctly describe a property of a rectangle?
A All four angles are right angles
C Diagonals are congruent
B Opposite sides are congruent
D All sides are congruent
20 Identify whether rectangle, square or trapezoid is the most specific classification of the following quadrilaterals:
21 Identify whether parallelogram, trapezoid, or rhombus is the most specific classification of the following quadrilaterals:
22 Classify each quadrilateral using all the terms that apply out of: rectangle, rhombus, parallelogram, square, trapezoid. Also state if none of these terms apply. a b c d e f g h
23 A square is a type of rectangle because squares have all the properties of rectangles. However, there are two properties that squares have that make them different from rectangles. Which two properties are they?
24 Classify each quadrilateral. Explain your reasoning. a b c d
25 Identify the type of quadrilaterals that have diagonals with these properties: a b c d e
• Their diagonals are equal in length.
• Their diagonals bisect each other.
• Their diagonals are perpendicular.
• Their diagonals are equal in length.
• Their diagonals bisect each other.
• Their diagonals are not perpendicular.
• Their diagonals are not equal in length.
• Their diagonals bisect each other.
• Their diagonals are not perpendicular.
• Their diagonals are not equal in length.
• Their diagonals bisect each other.
• Their diagonals are perpendicular.
• Their diagonals are not equal in length.
• One diagonal bisects the other.
• Their diagonals are perpendicular.
26 Every rectangle is also a ⬚. A parallelogram B trapezoid C rhombus D square
27 Can a quadrilateral have exactly 2 right angles? If so, name a quadrilateral that could have two right angles.
28 Sheldon draws a quadrilateral and covers it up. He tells Wanda that the quadrilateral has opposite sides that are equal in length.
From this information, determine the most specific classification that Wanda can determine for the figure. Explain your answer.
29 Patricia draws a quadrilateral, and covers it up. She tells Glen that the quadrilateral consists of right angles only. Using the given information, state the most specific classification of the quadrilateral.
30 Decide whether each quadrilateral is a trapezoid, parallelogram, or neither: a
31 Sketch each labelling all sides and angles accordingly:
a A parallelogram that is neither a rectangle or a rhombus.
b A parallelogram with a pair of connected sides that are equal, and a pair of acute angles.
c A parallelogram with a right angle.
32 What is the greatest number of obtuse angles that a quadrilateral can have? Explain your answer.
33 What is the greatest number of right angles that a quadrilateral can have? Explain your answer.
34 An isosceles triangle is cut along its height. Identify the quadrilateral that can be formed by joining the two smaller triangles in another way.
35 Two identical scalene triangles are joined along the longest edge. Identify the quadrilateral that can be formed.
36 Which two sides are parallel in this trapezoid?
37 Explain why a square is a regular polygon while a rhombus is not.
38 Find the value of x if the perimeter of this parallelogram is 48 m.
After this lesson, you will be able to...
• solve for unknown side lengths in quadrilaterals.
• solve for unknown angle measures in quadrilaterals.
We can use the properties to find unknown lengths in a quadrilateral. Recall the properties of quadrilaterals related to length are:
Parallelogram Rectangle Rhombus Square Trapezoid Isosceles Trapezoid
All sides congruent
Opposite sides are congruent
Opposite sides parallel
Diagonals bisect each other
Diagonals are congruent
Diagonals are perpendicular
Example 1
Consider the rectangle ABCD below, where AC = 16 m and AD = 9 m.
(one pair) (one pair)
(one pair)
a Find BD
Create a strategy
Recall that the diagonals of a rectangle are equal in length.
Apply the idea
Since AC = BD and AC = 16 m, then BD = 16 m
Reflect and check
Not only are the diagonals of a rectangle congruent, they also bisect each other. Since we know BD = 16 m, each half of the diagonal will have a length of 8 m.
b Find BC
Create a strategy
Recall that opposite sides of a rectangle are equal in length.
Apply the idea
Since AD = BC, then BC = 9 m
Reflect and check
Opposite sides of a rectangle are always congruent, so we also know that AB = DC
Example 2
Consider the rhombus ABCD given.
a Find AB
Create a strategy
Recall that the sides of a rhombus are equal in length.
Apply the idea
Since AD = AB, then AB = 5 cm
b Find the length of BD
Create a strategy
Recall that the diagonals of a rhombus bisect each other. This means, each diagonal cuts the other into two equal parts.
Apply the idea
Since is cut in half by , and DO = 4 cm, then it must be true that BO = 4 cm. We can find the entire length of by adding together the two equal halves.
BD = 4 cm + 4 cm
BD = 8 cm
Reflect and check
Since the diagonals of a rhombus bisect each other, another method we could have used is to double the given half of diagonal to find the entire diagonal length.
The properties of the side and diagonal lengths of quadrilaterals are:
Parallelogram Rectangle Rhombus Square Trapezoid Isosceles Trapezoid
All sides congruent
Opposite sides are congruent
Opposite sides parallel
Diagonals bisect each other
Diagonals are congruent
Diagonals are perpendicular
pair)
(one pair)
(one pair)
One thing that all quadrilaterals have in common is that they can always be split down the middle to make two triangles. Since the sum of the angle measures in a triangle is 180°, the angle sum of a quadrilateral is twice that: 360°. We can see that illustrated in this diagram. The angles from each of the triangles form a straight angle, and together they form a full revolution.
This fact, along with the other properties of quadrilaterals, can be applied to solve for unknown measures in quadrilaterals.
Opposite angles are congruent
All angles are right angle
Diagonals bisect opposite angles
Base angles are congruent
Parallelogram Rectangle Rhombus Square Trapezoid Isosceles Trapezoid
Solve for the value of x in the diagram shown.
Create a strategy
To find the value of x, add all the angles and equate them to 360 degrees.
Apply the idea
x + 104 + 127 + 61 = 360
x + 292 = 360
x + 292 292 = 360 – 292
x = 68
Consider the rhombus PQRS shown.
Add the angles and set equal to 360
Evaluate the addition
Subtract 292 from both sides
Evaluate the subtraction
What is the value of x?
Create a strategy
Remember, the diagonals of a rhombus bisect each other at right angles.
Apply the idea
Since the diagonals are perpendicular, they form 90° angles so: x = 90
Consider the rectangle ABCD below, find m∠C
Create a strategy
Remember, a rectangle has four right angles.
Apply the idea
Since ∠C is a right angle, it measures 90°.
The properties of angles of quadrilaterals are:
Parallelogram Rectangle Rhombus Square Trapezoid Isosceles Trapezoid
Opposite angles are congruent
All angles are right angle
Each diagonal bisect opposite angles
Base angles are congruent
1 Name the quadrilaterals that always have:
a Diagonals that are equal in length.
b Diagonals that bisect each other.
c Diagonals that are perpendicular.
d At least one diagonal that bisects the angles it passes through.
e Both diagonals that bisect the angles they pass through.
2 If all angles in a quadrilateral are equal, what is the measure of each angle?
3 Consider a parallelogram ABCD.
a Which side must be congruent to ?
b Which other angle must be congruent to ∠A?
c If the measure of ∠A is 30°, what is the measure of its consecutive angle?
4 In trapezoid ABCD, is parallel to and ∠A = ∠D. If side AB = 45 cm, what can we say about the length of side CD?
5 Consider the rhombus CDEF: Find the length of: a b c
6 Consider the rectangle ABCD: Suppose that AC = 16 ft. Find: a the length of b the measure of ∠C
7 Find the value of x in the following quadrilaterals: a b
8 Find the measurement indicated in each parallelogram.
Find unknown measures in quadrilaterals
9 Consider the rhombus FGHJ.
a If HF = 32, find the length of
b If the measure of ∠F = 55°, find the measure of ∠H
c If the measure of ∠G = 127°, find the measure of ∠H.
d Find the value of x. Justify your answer.
10 Given quadrilateral ABCD is a square, with AC = 14:
a Find the length of:
b Find the measure of:
11 Consider isosceles trapezoid ABCD
a If BD = 14 and CA = 16 x, what property of isosceles trapezoids could you use to help find the value of x?
b Find the value of x
12 Find the value of the variables in the following quadrilaterals:
e f
d
13 For each quadrilateral:
a Find the values of x and y
b Find the values of a, b and c
c Find the values of p and q
d Find the values of a, b, and c
e Find the values of a and b.
f Find the values of x and y.
14 Let AT = 4x 10 and BD = 5x + 20.
a Classify the quadrilateral.
b Solve for x
15 Given that ABCD is a square:
a Solve for x. Justify your solution.
b Solve for y. Justify your solution.
16 ABCD is a rhombus, solve for x. Justify your solution.
Let’s extend our thinking
17 Find the value of x if the perimeter of the following parallelogram is 48 yd.
18 Quadrilateral WXY Z is similar to quadrilateral LMNP.
What is the measure of ∠N ?
19 In the given diagram, the angle can be labeled ∠ABC. Write another way of labeling the same angle.
20 Use three letters to name the angles that are highlighted in the following diagrams:
21 Consider parallelogram ABCD
a Use three letters to name the angle congruent to ∠BAD
b Use three letters to name the angle supplementary to ∠BAD
22 If the size of the highlighted angle ∠KLN is 53°, find the size of ∠KLM.
23 Given quadrilateral ABCD is a rectangle, with ∠ABD = 58°, find the measure of: a ∠CBD b ∠BCD
•
Explore online to answer the questions
Use the interactive exploration in 7.01 to answer these questions.
1. What are the areas of each of the pairs of colored faces?
2. What is the total surface area of the prism?
3. What is the connection between the two? Test this with other dimensions. Does it hold true?
4. Write a formula for surface area of a rectangular prism. Use different dimensions to test your formula.
Rectangular prisms have three pairs of congruent faces. We can see below how we could break the rectangular prism above into three pairs of congruent rectangles. To find the total surface area, we must add up the area of all of the faces.
Surface area of a prism = Sum of areas of faces
We can also use a formula instead of adding up all 6 faces separately.
w l
A rectangular prism with length l, width w, and height h
We can see the rectangular prism has three pairs of congruent rectangles.
• The top and bottom which are both l w
• The left and right which are l h
• The front and back which are w h
Since there are two of each of these rectangles we get the formula below.
SA = 2lw + 2lh + 2wh
The 2D net of the same prism
Consider the following cube with a side length equal to 6 cm.
Find the total surface area.
Create a strategy
We can use the surface area of rectangular prism formula: SA = 2lw + 2lh + 2wh, where l = length, w = width, and h = height.
Apply the idea
Surface area = 2(6 6) + 2(6 6) + 2(6 6)
= 2(36) + 2(36) + 2(36)
= 72 + 72 + 72
Reflect and check
Substitute the values of l, w, and h
Evaluate the multiplication inside the brackets
Evaluate the multiplication = 216 cm2
Evaluate the addition
We can also use the surface area of cube formula: Surface area = 6 side2, where 6 = no. of faces.
Surface area = 6 (6)2
= 6 36
= 216 cm2
Substitute the values
Evaluate the square
Evaluate the multiplication
Consider the following rectangular prism with length, width and height equal to 12 m, 6 m and 4 m respectively.
Find the surface area of the prism.
Create a strategy
We can use the surface area of rectangular prism formula: SA
and h = height.
Apply the idea
Surface area = 2(12 6) + 2(12 4) + 2(6 4)
= 2(72) + 2(48) + 2(24)
Substitute the values of l, w, and h
Evaluate the multiplication inside the brackets = 144 + 96 + 48
Evaluate the multiplication = 288 m2
Evaluate the addition
Reflect and check
This calculation accounts for all faces of the prism by adding the area of the front and back, the left and right, and the top and bottom faces, then doubling the result. You could also calculate each face separately and then add them together to verify that you get the same total surface area.
1
Rectangle 1:
Area 1 = l w
= 12 ⋅ 6 = 72 m2
Rectangle 2:
Area 2 = l w
= 12 ⋅ 6 = 72 m2
Rectangle 3:
Area 3 = l ⋅ w = 12 6 = 72 m2
Rectangle 4:
Area 4 = l ⋅ w = 12 6 = 72 m2
After we calculate the area of each of the rectangles, we can find the total surface area of the rectangular prism by adding them together.
Total surface area = Area 1 + Area 2 + Area 3 + Area 4
= 72 + 72 + 72 + 72
= 288 m2
Surface area of a prism = Sum of areas of faces
Surface area of a prism is the sum of the areas of faces.
SA = 2lw + 2lh + 2wh
SA is the surface area of the prism. l is the length of the prism. w is the width of the prism. h is the height of the prism.
1 Find the area of these rectangles:
2 Consider the net of the rectangular prism:
a Calculate the area of each individual rectangle.
b Find the total area of the net.
3 Which net matches this rectangular prism? Justify your answer.
4 Consider the following cube with a side length of 6 cm:
a Sketch the net of the given cube.
b Find the surface area of the cube.
5 Find the surface area of a rectangular prism with the following net:
6 Consider the following rectangular prism:
a Sketch the net of the prism.
b Find the surface area of the rectangular prism.
7 Complete the table with the number of features of the shape.
3D shape Number of faces Number of vertices Number of edges
8 The formula for the surface area of a rectangular prism is SA = 2lw + 2lh + 2wh
Explain what each component of the formula represents.
Let’s practice
9 Find the surface area of the following cubes: a b c
10 Find the surface area of the following rectangular prisms:
11 Find the surface area of rectangular prism with dimensions: 4 in by 9 in by 8 in.
12 Laura is building a storage chest in the shape of a rectangular prism. The chest will be 55 in long, 41 in deep, and 39 in wide.
a Draw each piece that would be needed to construct the chest and label the dimensions of each piece.
b Laura is going to paint the outside of the chest. 1 can of paint covers 1000 in2. How many cans of paint will she need to buy?
13 John and Ryan are asked to determine the surface area of a rectangular prism with dimensions 8 units by 5 units by 3 units. Ryan argues that the surface area is 120 square units, while John believes it’s 158 square units. Who is correct and why?
14 The cost of the material to construct a container is $2 per square foot. Two types of containers have identical volumes. Determine the amount saved by a business if they opt to produce 100 units of Container B instead of 100 units of Container A.
15 A cube has surface area of 1032 in2
Find the length of one side.
16 Find the surface area of the following prism. Round your answer to two decimal places when necessary.
17 A birthday gift is placed inside the box shown:
a Find the minimum amount of wrapping paper needed to wrap this gift.
b Keisha uses another box of the same length and width for another gift. She uses 1176 cm2 wrapping paper. Find the height of the new box.
c Compare the height of the two boxes.
18 Use the diagrams below to develop a formula for calculating the Surface Area of the prisms.
To find the surface area of the whole cylinder, we need to add the area of the top and bottom circles to the area of the curved part.
Surface area of a cylinder = 2 (Area of circular base) + area of curved face = 2
Now that we have the area of all of the parts, we can put them together to get the total surface area.
r the radius of the cylinder h the height of the cylinder
1
Consider the following cylinder and it’s corresponding net:
a Find the area of one of the circular faces of the cylinder. Use 3.14 for π and round your answer to two decimal places.
Create a strategy
Remember that the area of a circle is A = πr 2
Apply the idea A = 3.14 ⋅ 32
Substitute the values = 28.26
Evaluate
The area of a circle of the cylinder is 28.26 m2
b Find the area of the curved face. Use 3.14 for π and round your answer to two decimal places.
Create a strategy
The area of the curved face of the cylinder will be the area of the middle rectangle, which makes up the side of the cylinder.
The area of the rectangle is equal to the product of its length and width.
The width of the rectangle is equal to the given height of the cylinder. What will the length of the rectangle be?
7.02 Surface area of right cylinders
Apply the idea
The length of the rectangle is equal to the circumference of the circular base which is 2πr. Therefore, the surface area of the curved face of a cylinder is 2πr h.
The cylinder has a height of 5 m, and a radius of 3 m.
Curved surface area = 2 3.14 3 5
= 94.20
The curved surface area is 94.20 m2
Reflect and check
Substitute the values
Evaluate
We may get slightly different values for surface area depending on the approximation we use for π. Common approximations for π include 3.14 and
If we had used , our calculation would have been:
Curved surface area = 2 3 5
= 94.29
Substitute the values
Evaluate
This is slightly larger than the number we got using 3.14 to approximate π. Depending on the context this may or may not matter. For the most accurate calculations you can use the π button on your calculator. This will keep more digits of π than any of the other approximations.
c Find the total surface area of the cylinder. Round your answer to two decimal places.
Create a strategy
The surface of a cylinder is made up of two circular faces on the top and bottom and a rectangular face that wraps around the curved surface of the cylinder.
Apply the idea
The surface area of the cylinder can be calculated by adding the areas of each part:
Surface area of a cylinder = Area of 2 circular bases + Area of rectangular piece
SA = 2 28.26 m2 + 94.20 m2
Substitute the values from parts (a) and (b) = 150.72 m2
Evaluate
The surface area of the cylinder is 150.72 m2
A cylinder is a 3D shape much like a prism with two identical circular bases and a curved surface that joins the two bases together.
The surface area of the cylinder can be calculated by totaling the area of the parts:
Surface area of a cylinder = Area of 2 circular ends + Area of rectangular piece
The formula for surface area of a cylinder is:
SAcylinder = 2πr 2 + 2πrh
r the radius of the cylinder
h the height of the cylinder
1 Find the area of the following figures. Use 3.14 for π and round your answers to one decimal place if necessary. a b c d
2 State whether each of the following is a right cylinder.
Surface area of right cylinders
3 Consider the following cylinder together with its net. Use 3.14 for π and round your answers to two decimal places.
a Find the circumference of the circular base.
b Now, find the lateral area of the cylinder.
4 For each of the following pair of cylinders and their nets, find the lateral area of the cylinder. Use 3.14 for π and round your answers to two decimal places.
b
5 Consider the following cylinders. Use 3.14 for π and round your answers to two decimal places.
i Find the circumference of one circular base. ii Find the lateral area of the cylinder.
iii Find the area of one circular face. iv Now find the total surface area of the cylinder.
6 In your own words, describe what each part of the formula represents:
7 For each of the following cylinders:
i Draw the net.
ii Find the total surface area of the cylinder. Use 3.14 for π and round your answers to two decimal places.
8 Find the surface area of the following cylinders: Use 3.14 for π and round your answers to two decimal places.
9 Describe and correct Jenny’s error in finding the surface area of the cylinder.
SA = 2πr 2 + lw
= 2π(10)2 + (10) (11.8)
= 200π + 118 ≈ 746 yd2
10 Amy and Vincent each have a cylinder. Amy’s cylinder has a diameter of 8 cm and a height of 9 cm. Vincent’s cylinder has a diameter of 9 cm and a height of 8 cm.
Which cylinder has a larger surface area?
11 A large propane storage tank is made of a cylindrical alloy steel plate. Determine the surface area of the propane tank to two decimal places.
12 Paul is using a toilet paper roll for crafts. He has measured the toilet paper roll to have a diameter 4 cm and a length 10 cm.
Find the surface area of the toilet paper roll to two decimal places.
13 Find the surface area of the figure, rounded to two decimal places.
14 This cylinder has a surface area of 16 173 in2:
Find the height of the cylinder. Round your answer to the nearest whole number.
15 The area of the circular face on a cylinder is 225π m2. The total surface area of the cylinder is 3210π m 2
a Find the radius of the cylinder.
b Find the height of the cylinder.
16 A paint roller is cylindrical in shape. It has a diameter of 6.8 cm and a width of 31.2 cm.
Find the area painted by the roller when it makes one revolution to two decimal places.
17 Is each statement true or false?
a The surface area of a cylinder includes the area of both bases and the curved surface.
b If you double the radius of a cylinder, the surface area will also double.
c A cylinder that is taller always has a larger surface area than a shorter one.
After this lesson, you will be able to...
• develop the formula for the volume of rectangular prisms.
• calculate the volume of rectangular prisms.
Volume
A measure of capacity of a 3-dimensional figure that is measured in cubic units.
The volume of a three-dimensional shape is the amount of space that is contained within that shape.
Explore online to answer the questions
Use the interactive exploration in 7.03 to answer these questions.
1. Create a base by moving the length and width sliders, and keeping the height slider at zero. What is the area of the base?
2. Slowly drag the height slider. What happens to the volume of the rectangular prism?
3. How does the volume of the prism change each time you make its height 1 unit bigger, and what does that have to do with the area of the base?
4. How can we find the volume of a rectangular prism if we already know how to calculate the area of its base using the area formula?
We can find the volume of a rectangular prism by first finding the area of the base and multiplying that by the height of the prism.
Notice that the figure has a rectangular base with side lengths of 5 units and 4 units. To find the area of the rectangular base, we multiply the length and width and get 20 square units.
Next, notice the prism is 2 layers high, so it has a height of 2 units. Now, we can multiply the area of the base by the height to calculate the volume.
Volume = area of base height
Volume = 20 2
Volume = 40
In the same way that the area of a two-dimensional shape is related to the product of two perpendicular lengths, the length and width, the volume of a rectangular prism is related to the product of three perpendicular lengths, the length, width, and height. Notice that each of the three lengths is perpendicular to the other two.
Example 1
Find the volume of the rectangular prism shown.
The volume of a rectangular prism is given by Volume = length width height, or V = l ⋅ w ⋅ h
Create a strategy
Use the volume of a rectangular prism formula.
Apply the idea
V = l w h Use the volume formula
= 14 ⋅ 6 ⋅ 4
Substitute l = 14, w = 6, and h = 4
= 336 cm3 Evaluate
Example 2
Find the volume of the rectangular prism shown.
Create a strategy
Even though we have a fractional edge length, we can use the same formula.
Apply the idea
Use the volume formula
Substitute l = 3, w = , and h = 6
Rewrite the whole numbers as fractions
Multiply
Simplify
A rectangular prism is a 3D shape with six rectangular faces.
The volume of a rectangular prism is given by:
V = l ⋅ w ⋅ h
V is the volume
l is the length
w is the width
h is the height
1 Consider this image:
a Identify the: i Length ii Width iii Height
b The volume of the rectangular prism is represented by:
V = (⬚ ⬚ ⬚) in3
2 Select the volume for this rectangular prism. A 455 ft B 455 ft2 C 455 ft3 D 455 ft4
3 In the following figures, 1 block = 1 in3. Find the volume of each solid figure. a b
4 We want to find the volume of the prism shown:
a Find the area of the base, b
b Explain how to use the value from part (a) to calculate the volume of the prism.
c Find the volume of the prism.
5 Find the volume of the following prisms:
6 Find the volume of the cube shown:
7 Find the volume of the following rectangular prisms: a
8 Find the volume of a cube with the following side lengths: a cm b 2.5 m c ft d in
9 A container has the shape of a rectangular prism, with the following dimensions: ft, ft, and 2.5 ft. Find its volume.
10 A tank has a length of yd, width of yd and depth of 4.25 yd. Find the volume of the tank.
11 Find the maximum volume of water the following aquarium can hold:
12 A box is 2 ft long, ft high and ft wide. What is the volume of the box in cubic feet?
13 A box of tissues is in the shape of a rectangular prism. It measures cm by cm by cm. Find the volume of the box.
14 Describe and correct the error in finding the volume of the prism.
Let’s extend our thinking
15 Find the volume of this composite solid.
16 A student claims that two rectangular prisms with the same volume will always have the same dimensions. Do you agree or disagree? Explain your reasoning.
17 How many different rectangular prisms can you find that have a volume of 72 m3, if all edges have integer lengths? What are the dimensions of each prism that you find?
18 A box of tissues is in the shape of a rectangular prism. It has a length of 39 cm, a width of 19 cm and a height of 11 cm.
a Find the volume of the box.
b If the shelf at the supermarket is 95 cm long and has a depth of 40 cm, find the maximum number of tissue boxes that can fit on the shelf.
19 A special refrigerator is used to store medical samples and has dimensions 18 cm by 70 cm by 12 cm. The samples are stored in small containers that have dimensions 20 mm ⋅ 50 mm ⋅ 20 mm.
Assuming both the refrigerator and the sample containers are rectangular prisms,
a Find the dimensions of the sample containers in centimeters.
b Find the volume of a sample container.
c Find the volume of the fridge.
d How many containers can be stored in the fridge?
20 An aquarium is in the shape of a rectangular prism with dimensions 120 cm in length, 60 cm in width, and 75 cm in height.
If the aquarium needs to be filled to 90% of its capacity, determine the amount of water needed in liters.
Find the volume of a cylinder correct to one decimal place if its radius is 5 cm and its height is 13 cm.
Create a strategy
Use the formula of the volume of a cylinder.
Apply the idea
We have been given values for r = 5 and h = 13 into the formula.
V = πr 2h
= (π 52) 13
= π 25 13
= 1021.0 cm3
Use the formula
Substitute the values
Evaluate the squares
Evaluate
Reflect and check
Our answer may vary if we use an approximation of 3.14 instead of π
V = πr 2h
= (3.14 52) 13
= 3.14 25 13
= 1020.5 cm3
Consider the half-pipe with a diameter of 7 cm and a height of 16 cm.
Use the formula
Substitute the values
Evaluate the squares
Evaluate
7 cm
16 cm
Find its volume, rounding to two decimal places.
Create a strategy
Use the fact that the volume of the half-pipe is half of the volume of the cylinder, and the radius is half of the diameter.
Apply the idea
We have been given the values for diameter of 7 cm and height of 16 cm.
Since the radius is half of the diameter, then r =
Multiply the cylinder formula by a half
Substitute the values
Evaluate the product
The volume of the cylinder is given by:
V = πr 2h
r is the radius of the cylinder h is the height of the cylinder
We can also think of the volume formula as
Volume = Area of Base Height
1 Calculate the area of each circle, rounded to two decimal places. a b
2 Label the following attributes on the cylinder: • Base • Height • Radius • Diameter
3 For each of the following cylinders, determine:
i The radius
ii The area of the base, rounded to two decimal places a b
4 Select the volume for the cylinder.
5 We want to find the volume of the cylinder shown.
a First, find the area of the base b, rounded to two decimal places.
b Which formula can be used to calculate the volume of this cylinder? Select all that apply.
6 The diameter and height of a cylinder are shown. Which of these represents the volume of the cylinder?
A π ⋅ 212 ⋅ 38
B π 422 38
C 2π 212 + 2π 21 38
D 2π 422 + 2π 42 38
7 Find the volume of the following solids, rounding your answers to one decimal place:
8 Find the volume of a cylinder with radius 7 ft and height 15 ft, correct to two decimal places.
9 Find the volume of the following cylinders. Round your answers to one decimal place.
a A cylinder with a radius of 6 in and height of 15 in.
b A cylinder with a radius of 7 ft and height of 15 ft.
c A cylinder with a diameter of 2 yd and height of 19 yd.
10 A tank on a road roller is filled with water to make the roller heavy. The tank is a cylinder that has a height of 9 feet and a radius of 7 feet. What is the volume of the water needed to fill in the tank?
11 There are two types of cylindrical soup cans available for Bob to purchase at his local store. The first has a diameter of 8 cm and a height of 12 cm, and the second has a diameter of 12 cm and a height of 8 cm.
State which type of can holds more soup, the first can or the second can.
12 Which of the following containers would be best to store 51 in3 of sand?
13 A container with a diameter of 9 in is filled with lemonade at the start of a dinner party.
The diagram shows the amount of lemonade in the container 30 minutes after the guests arrive.
How much lemonade has been removed from the container? Round your answer to the nearest whole number.
14 Jack’s mother told him to drink 3 large bottles of water each day. She gave him a cylindrical bottle with height 17 cm and radius 5 cm.
a Find the volume of the bottle. Use π = 3.14 and leave your answer to one decimal place.
b Assuming that he drinks 3 full bottles as his mother suggested, calculate the volume of water Jack drinks each day. Leave your answer to one decimal place.
15 Find the volume of the following solids, rounding your answers to one decimal place:
16 Consider the half-pipe with a diameter of 7 cm and a height of 16 cm. Find its volume, using π = 3.14 and rounding the answer to two decimal places.
17 Find the missing dimension of the cylinder. Round your answer to the nearest whole number.
18 A round swimming pool has a diameter of 33 ft and is 48 in deep. The pool is currently 75% full of water. Find the current volume of water in the pool.
19 A dumbbell is made of three cylindrical sections. The outer sections both have a diameter of 14 cm, and the inside section has a diameter of 2 cm. If each section is 11 cm long, calculate the total volume of the dumbbell. Round your answer to two decimal places.
After this lesson, you will be able to...
• determine whether volume or surface area is needed to solve a real-world problem.
• solve real-world problems involving volume and surface area of rectangular prisms and right cylinders.
Surface Area
The sum of the areas of all of the faces of a prism.
Volume
The measure of capacity and is measured in cubic units.
In construction, calculating surface area is a part of planning, for example, calculating the amount of materials to you need to buy, as well as determining costs for a project. Similar calculations are required in manufacturing and design based professions.
Surface area measures the outside of a three-dimensional figure and is measured in units2. Some examples of reallife scenarios that require calculating surface area are:
Determining much wrapping paper will be needed to wrap this package that is shaped like a rectangular prism.
Determining much paint is needed to paint the inside of a box.
Whether you want to find out the volume of a swimming pool so you know how much water it can hold or find out the available space that can be occupied by a van or a truck in a garage, the concept of volume is used often in daily life.
The volume of a three-dimensional shape is the amount of space that the shape takes up. Volume measures how much space is inside of a three-dimensional figure, or the capacity that the figure can hold and is measured in units3 Some examples of real-life scenarios that require calculating volume are:
Since this rectangular prism has dimensions of 55 cm, 41 cm and 39 cm, the pairs of dimensions for the faces of the net will be 55 cm × 39 cm, 41 cm × 39 cm and 55 cm × 41 cm.
Because he is not painting the bottom of the chest, the side with the dimension of 55 cm × 41 cm will only need to be added one time. The other two faces will be added twice.
Surface area = 2 (55 39) + 2 (41 39) + (55 41)
= 4290 + 3198 + 2255
= 9743 cm2
The surface area of the chest is 9743 cm2
Evaluate the multiplication
Evaluate the addition
This wild animal house is made out of plywood.
The nesting box has a depth of 29 cm, a height of 83 cm and front width of 54 cm.
If you wanted to fill the box so that it was 50% full of straw, how much straw would be required?
Create a strategy
Because we are looking to fill the nesting box, we must calculate the volume. Once we have the volume of the entire nesting box, we will calculate 50% of the volume to determine how much straw is required to fill the box 50% full.
Apply the idea
Volume = length width height
= 29 54 83
= 29 cm
The volume of the nesting box is 129 978 cm3.
Substitute the given dimensions
Evaluate the multiplication
Now, we will find 50% of the volume. 50% is half the capacity of the nesting box.
Volume = ⋅ 129 978
= 65 989
Substitute the volume
Evaluate the multiplication
The amount of straw needed is 65 989 cm3
Sabrina is making a candle in a cylindrical jar to give as a gift. She must first fill the jar with wax to make the candle and then wrap the candle in wrapping paper. The cylindrical jar has a radius of 3 in and a height of 4 in.
a How much wax will Sabrina need to fill the candle jar?
Create a strategy
Because Sabrina needs to fill the inside of the cylindrical container, she has to calculate the volume. We can use the formula for volume of a cylinder, V = πr 2h, to calculate this.
Apply the idea
Volume = πr 2h
V = π ⋅ 32 ⋅ 4
= π 9 4
= 113.1
Formula for volume of a cylinder
Substitute the given values
Evaluate the exponent
Evaluate the multiplication
Sabrina will need 113.1 in3 of wax to fill the candle jar.
b How much wrapping paper will Sabrina need to wrap the candle?
Create a strategy
Because Sabrina needs to wrap the outside of the candle, we need to calculate the surface area to determine the amount of wrapping paper needed. We can use the formula for surface area of a cylinder, SA = 2πr 2 + 2πrh, to find this.
Apply the idea
Surface area = 2πr 2 + 2πrh
= 2 ⋅ π ⋅ 32 + 2 ⋅ π ⋅ 3 ⋅ 4
= 2 π 9 + 2 π 3 4
= 56.6 + 37.7
= 94.3
Substitute the given values
Evaluate the exponents
Evaluate the multiplication
Evaluate the addition
The surface area of the candle is 94.3 in2. This means that Sabrina will need 94.3 in2 of wrapping paper.
We can use the concept of surface area and volume in real-world problems.
The surface area is the sum of the areas of all surfaces of a figure.
The volume of a three-dimensional figure is a measure of capacity and is measured in cubic units.
Problems involving calculations regarding the outside of figure require calculating surface area. Problems involving how much a figure can hold or the interior capacity of a figure require calculating volume.
1 Which formula should be used to find the volume of this cylinder?
2 Decide if each situation represents volume or surface area:
a Finding out how much wallpaper is needed to cover a box.
b Determining how much water a cylindrical water cooler can hold.
c Filling cake pans with batter.
d Determining how much wrapping paper is needed to wrap a rectangular box.
e Finding out how much water will fill a rectangular aquarium.
f Determining how much paint will be needed to paint the interior of a carboard box.
3 Calculate the surface area and volume for each cylinder. Use 3.14 for π. Round to two decimal places if necessary.
a b c d
4 Calculate the surface area and volume for each cylinder. Round to two decimal places if necessary.
a b
d
5 You have a toy box that is in the shape of a rectangular prism. The toybox is 3 ft wide, 2 ft tall, and 3 ft long.
a If you want to know how many toys it can hold, would you calculate volume or surface area? Explain your answer.
b Complete your calculation.
6 A box measures 5 cm by 3 cm by 2 cm.
a If you need to paint all the outer sides of the box, are you calculating for volume or surface area?
b Complete your calculation.
7 A cylindrical oil drum has a diameter of 10 cm and a height of 20 cm. Which of the following is closest to the amount of oil that will fill the drum?
A 500 cm3 B 1570 cm3 C 2500 cm3 D 3140 cm3
8 Three cylindrical cans each have a height of 10 cm.
• Cylinder 1 has a radius of 2 cm
• Cylinder 2 has a radius of 3 cm
• Cylinder 3 has a radius of 4 cm
Which cylindrical can will hold the most liquid?
9 Greta wants to cover a rectangular prism-shaped box with paper. Calculate the minimum amount of paper that Greta will need to cover the box.
10 A powdered drink mix is stored in a cylindrical container that has a radius of 4 cm and a height of 10 cm. Which is closest to the maximum number of cubic centimeters the container will hold?
100 cm3
250 cm3
502 cm3
1260 cm3
11 Natalie wrapped a cylindrical box with ribbon for a gift. The box is 24 cm tall and has a 7 cm radius. Which is closest to the minimum amount of ribbon Natalie needed to wrap the entire box?
352 cm2 B 871 cm2
1080 cm2
1654 cm2
12 Both of the following popcorn bags are designed to carry 1680 cm3 of popcorn. Assume there’s minimal wastage of space when the popcorn is packed into each bag.
a Find the height h of bag A.
b Find the height h of bag B.
c Find the surface area of bag A.
d Find the surface area of bag B.
e Which bag should be used to reduce the amount of paper needed?
13 A cake has two tiers. The top layer has a radius of 7 cm, and the bottom layer has a radius of 10 cm. Each layer is 6 cm high.
a Find the amount of light green icing needed to cover the top tier of the cake, rounded to two decimal places.
b Find the amount of dark green icing needed to cover the bottom layer of the cake, rounded to two decimal places.
c How much batter will be needed to fill each tier? Round your answer to two decimal places.
14 At a farm, animals are fed bales of hay and buckets of grain. Each bale of hay is in the shape of a rectangular prism. The base has side lengths of 2 ft and 3 ft, and a height is 5 ft. Each bucket of grain is a cylinder with diameter of 3 ft. The height of the bucket is 5 ft, the same as the height of the bale.
Which container will hold more feed, the bale or the bucket?
15 At a luxury hotel’s lobby, there’s an ornate chocolate fountain made from cylindrical block of solid chocolate. This block has been cut in half vertically to allow for a cascade of flowing chocolate. If the original chocolate cylinder had a height of 2.3 m and a diameter of 150 mm, how much chocolate surface is exposed after the cut?
16 A store pays $2 per pound for popcorn kernels. One cubic foot of kernels weighs about 45 pounds. What is the selling price of the container shown when the markup is 30%?
After this lesson, you will be able to...
• describe how the volume and surface area of a rectangular prism changes when one of its dimensions changes.
• solve real-world problems involving changing the dimensions of rectangular prisms.
Changing one dimension of a figure affects both the perimeter and the area of the shape.
×2
In this example, the width of the rectangle is scaled by a factor of 2.
• The area will be multiplied by a factor of 2.
• The perimeter will be increased, but not by a factor of 2.
Explore online to answer the questions
mathspace.co
Use the interactive exploration in 7.06 to answer these questions.
1. Create a prism with each dimension measuring 5 units or less and record the surface area and volume. Now, change the height of the prism so it is twice as high. Record the surface area and volume for the new prism. How does the surface area and volume of the second prism relate to the first prism?
2. Now, double the length of the prism. Record the surface area and volume for the new prism. How does the surface area and volume of this prism relate to the previous prism?
3. Now, double the width of the prism. Record the surface area and volume for the new prism. How does the surface area and volume of this prism relate to the previous prism?
4. Start over and create a 2 × 2 × 4 prism. Record the surface area and volume. Choose one of the dimensions and multiply it by a number of your choice to create a new prism. How does the surface area and volume change?
5. What is the relationship between the scale factor used to change one of the dimensions and the surface area and volume?
Adjusting one dimension of a solid by a scale factor of d will affect both the surface area and the volume of the solid. This means that:
• the volume will scale by a factor of d
• the surface area will change, but not by a scale by a factor of d
L = 4 W = 3 H = 4
SA: 80 units2
V: 48 units3
L = 4 W = 3 H = 2
SA: 52 units2
V: 24 units3
L = 4 W = 6 H = 2
SA: 88 units2
V: 48 units3
L = 8 W = 3 H = 3
SA: 92 units2
V: 48 units3
The rectangular prisms in the image show the effect of multiplying each dimension by a scale of 2. Regardless of which dimension changed, the volume was increased by a scale of 2. The surface area for each prism increased, but the amount that the surface area increase varied based on the dimension that was scaled by 2.
L = 4 W = 3 H = 2
SA: 52 units2
If we had scaled all 3 dimensions by the same factor d then the surface area would have scaled by d2 but the same is not true when only scaling one dimension.
For example, scaling all of the dimensions of the original prism by 2 gives a new surface area of 52 22 = 52 4 = 208 units2
L = 8 W = 6 H = 4
SA: 208 units2
A rectangular prism had a volume of 96 cubic centimeters. The height of this prism was changed from 9 centimeters to 3 centimeters to create a new rectangular prism. The other dimensions stayed the same. What is the volume of the new prism?
Create a strategy
First find the scale factor by dividing the new height by the original height. Since only one dimension was scaled, the volume will change by the same factor.
Apply the idea
First, we will find the scale factor: Scale factor = = =
Next, we will multiply the volume by the scale factor. 96 cm3 = 32 cm3
The volume of the new rectangular prism will be 32 cm3.
A gift box with a length of 10 cm, a width of 20 cm, and a height of 5 cm needs to be wrapped in paper. If the height of the box is increased by a factor of 2, how much additional wrapping paper is needed?
Create a strategy
First, we will need to calculate the surface area of both the original box and the box after the height is increased. We can use the formula SA = 2lw + 2lh + 2wh to calculate these. Then, we will find the difference in the areas to determine how much more paper will be needed.
Apply the idea
Find the surface area of the original box:
Surface Area = 2(10 20) + 2(10 5) + 2(20 5)
= 2(200) + 2(50) + 2(100)
= 400 + 100 + 200
= 700
The surface area of the original box is 700 cm2
Substitute the given values
Evaluate the multiplication in parentheses
Evaluate the multiplication
Evaluate the addition
Next, find the surface area of the new box. The height was increased by a factor of 2, so we will substitute 10 for the height instead of 5.
Surface Area = 2(10 20) + 2(10 10) + 2(20 10)
= 2(200) + 2(100) + 2(200)
= 400 + 200 + 400
Substitute the given values
Evaluate the multiplication in parentheses
Evaluate the multiplication = 1000
Evaluate the addition
The surface area of the new box is 1000 cm2.
Last, we need to find the difference between the two surface areas to determine how much more paper will be needed for the new box.
1000 700 = 300
The new box will require 300 cm2 more paper than the original box.
Adjusting one dimension of a rectangular prism by a scale factor of d will affect both the surface area and the volume of the solid. This means that:
• the volume will scale by a factor of d
• the surface area will change, but not by a scale by a factor of d
1 Consider the following rectangular prism:
a Find the volume.
b Find the surface area.
2 If a two dimensional shape is dilated by a factor of , will the new shape be larger or smaller than the original? Draw a picture to support your answer.
3 On a plan of the design, a garden bed has a length of 6 cm. The landscaper dilates the design so that the actual bed is 3 m long. Determine the scale factor used when creating the garden bed based on the design.
4 If a square is dilated by a factor of 2, determine what happens to its area.
A The area will be doubled.
C The area will be tripled.
B The area will be halved.
D The area will stay the same.
5 Julian is knitting a blanket. So far, the blanket measures 1.5 m × 1.5 m. If Julian wants to make his little sister a blanket that is the length, how many times smaller will the area of the finished blanket be?
6 If only one dimension of a rectangular prism is reduced by a scale factor of , determine what will happen to the volume.
A The volume will be of the original.
C The volume will be 3 times the original.
7 Consider the following objects:
B The volume will be of the original.
D The volume will be 27 times the original.
a Calculate the volume of the smaller rectangular prism.
b Describe how the volume in the smaller prism changed from the original.
c Calculate the surface area of the smaller rectangular prism.
d Describe how the surface area of the smaller prism changed from the original.
8 The height of a rectangular prism was doubled while the length and width remained unchanged, as shown in the diagram.
a Calculate the volume of the larger rectangular prism.
b Describe how the volume in the larger prism changed from the original.
9 For the rectangular prism shown:
a Complete the table: Original surface area Scale factor New surface area
Length →
Width → 2
b Describe the changes from the original surface area to the new surface area.
10 A rectangular prism has a height of 4 feet and a volume of 32 cubic feet. The height of this prism is changed to 1 foot, and the other dimensions stay the same. What is the volume of the prism with change?
A 8 cubic feet B 36 cubic feet C 64 cubic feet D 128 cubic feet
11 A rectangular prism had a volume of 255 cubic centimeters. The height of this prism was changed from 7 centimeters to 14 centimeters to create a new rectangular prism. The other dimensions stayed the same. What is the volume of the new prism?
12 The height of a rectangular prism is decreased by a factor of . The other dimensions are unchanged. Which statement is true?
A The volume is decreased by a factor of B The volume is decreased by a factor of
C The volume is decreased by a factor of . D The volume is decreased by a factor of .
13 Consider the following rectangular prism:
a Describe how multiplying the length by will affect the volume.
b Calculate the volume of the new rectangular prism.
14 A rectangular prism has a length of 16, a width of 8, and a height of 24.
Describe how multiplying the height by will affect the volume. Justify your answer.
15 Complete the following statement about the following pair of prisms: “The volume of the second prism will be ⬚ times larger than the volume of the first prism.”
16 The two rectangular prisms shown have bases with the same area. The volume of Prism A can be found by multiplying the volume of Prism B by what factor?
A 3 B 7
C 14 D 21
17 A company offers two different sized boxes of cereals. The first cereal box has a height of 4 in, a width of 2 in and a length of 12 in. The second cereal box has a height of 8 in, a width of 2 in and a length of 12 in.
a Calculate the surface area for both cereal boxes.
b Describe the relationship between the two surface areas.
18 Bluewave Aquatic Center has a swimming pool that is 25 yd by 55 yd, and 2.5 yd deep. Neptune Aquatic Center has a swimming pool with a volume of 10 312.5 yd3. Both pools have the same depth, but their lengths and widths are different. If the length of one pool is double the length of the other, what is scale factor between the widths of the two pools?
19 A cereal company sells their Crunch Munch cereal in a rectangular box with dimensions 12 in × 10 in × 2.5 in. In order to reduce their environmental impact, the company wants to reduce the surface area of their boxes.
a The company wants to reduce the total surface area to somewhere between 100 in2 and 130 in2. Would changing one dimension by a scale factor of achieve this goal? Explain.
b Give the dimensions for a Crunch Munch box that satisfies the required reduction in surface area, where only one dimension has changed from the original. What scale factor did you use for the changed side?
20 A garden bed is 5 ft in length, ft in width and ft in height.
a Find the volume of the farmer’s original garden size.
b Find the new dimensions if the farmer wanted to triple the size of his garden.
c Find the volume of soil that will be needed to fill up the new size of the garden bed.
d Is the volume of soil in the new size garden bed triple the volume of the original garden bed? Explain.
21 There are two types of cylindrical juice cans available for Colbie to purchase at her local store. The first has a diameter of 16 cm and a height of 18 cm, and the second has a diameter of 16 cm and a height of 9 cm.
How does changing the height of the can affect the amount of juice the can holds?