MARIYA LUPANDINA
PORTFOLIO 2018-2025 | PROFESSIONAL & ACADEMIC WORK


PORTFOLIO 2018-2025 | PROFESSIONAL & ACADEMIC WORK
UNIVERSITY OF PENNSYLVANIA, LANDSCAPE ARCHITECTURE 2021-2025


Delaware River urban park
academic - 2023
UPenn, Weitzman School of Design project scale: S M L XL individual project skills: rhino, grasshopper, illustrator, Photoshop, hand drawing
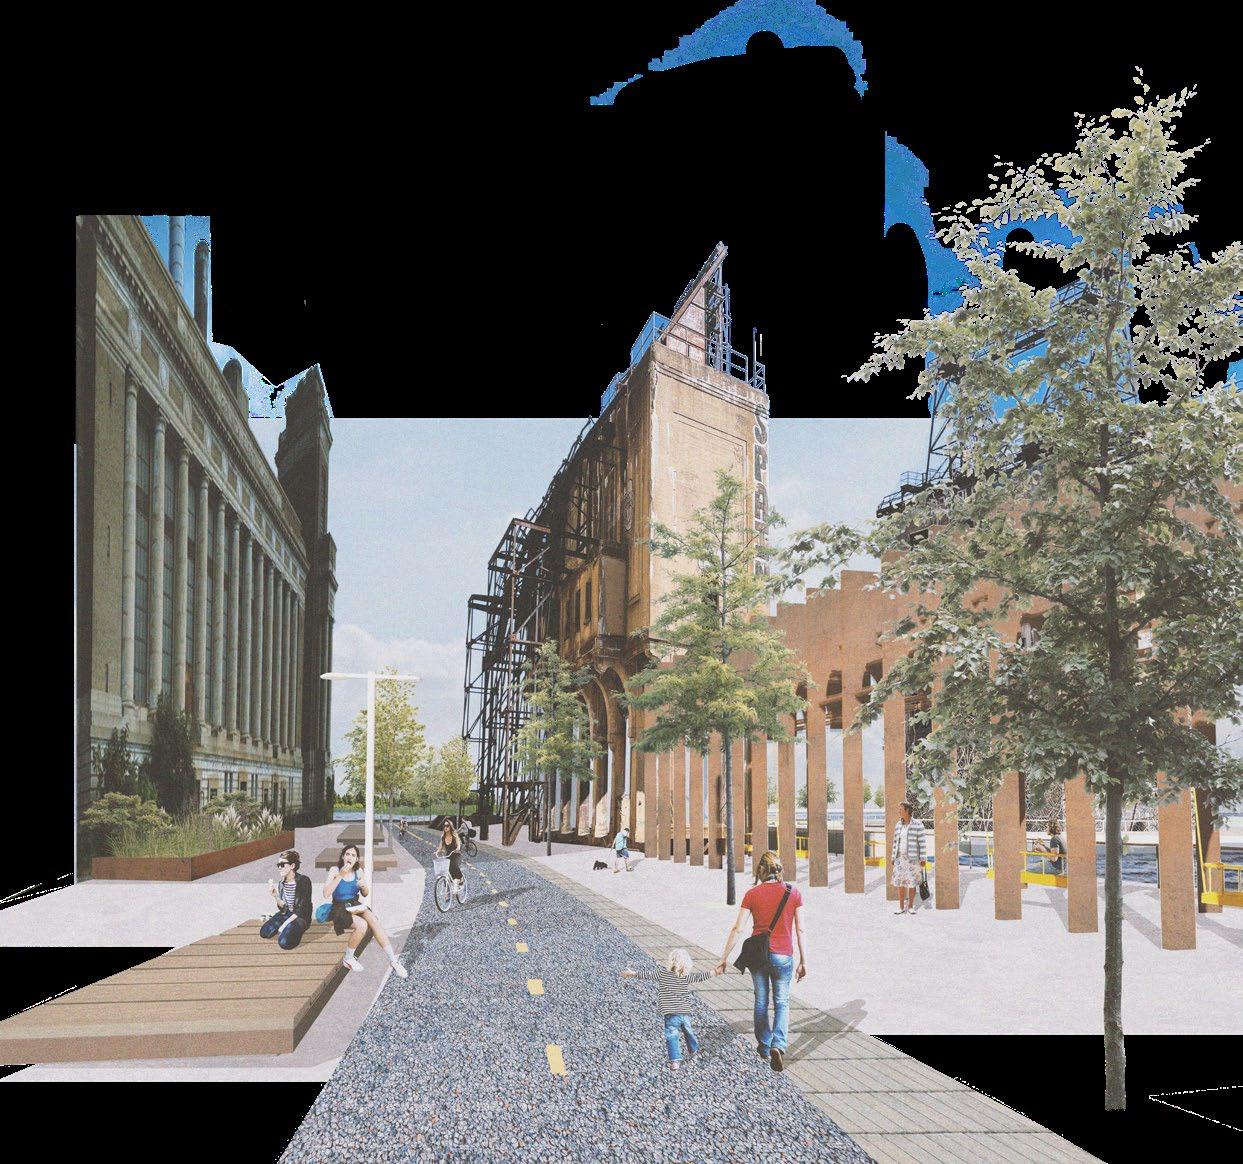
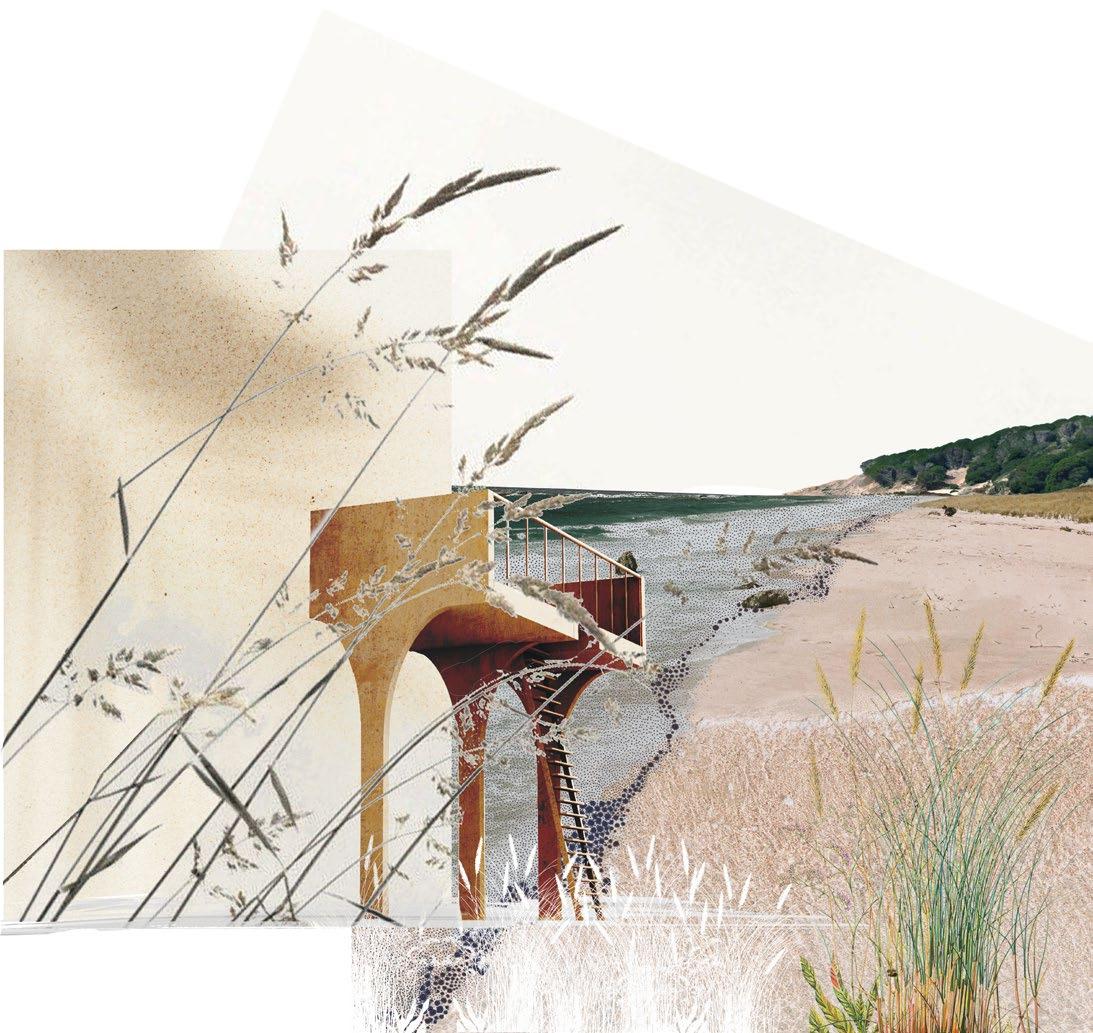
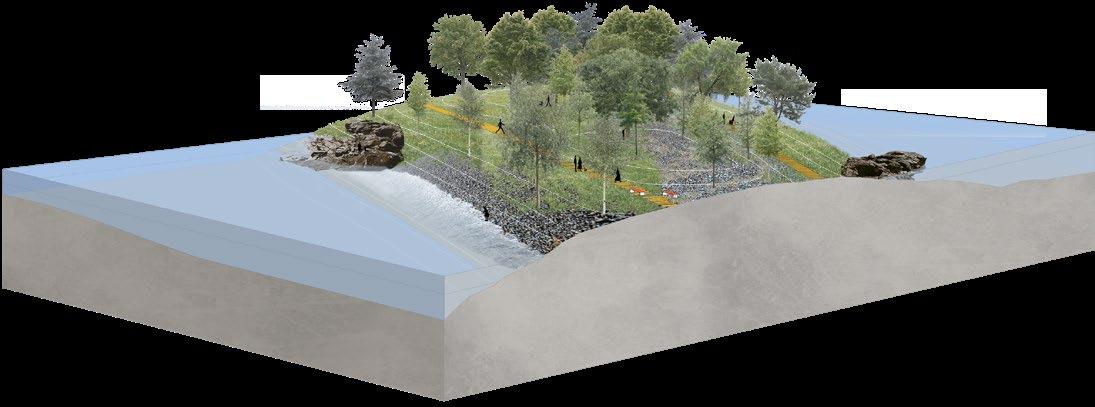
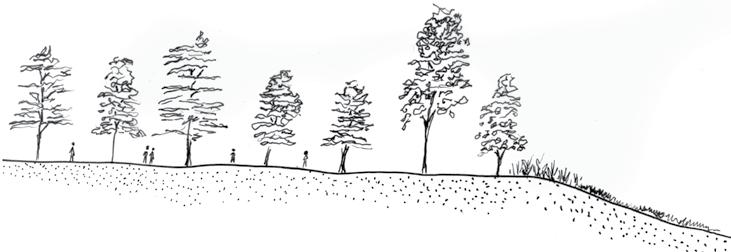
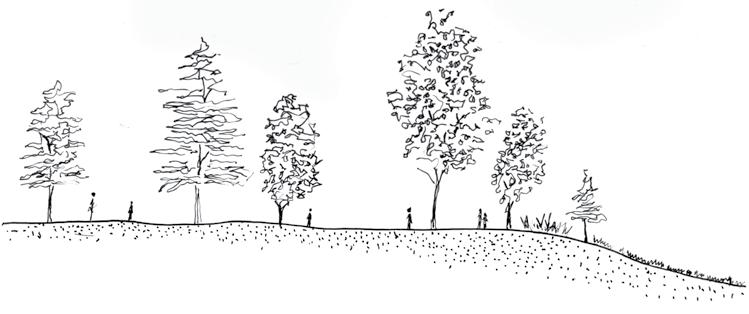
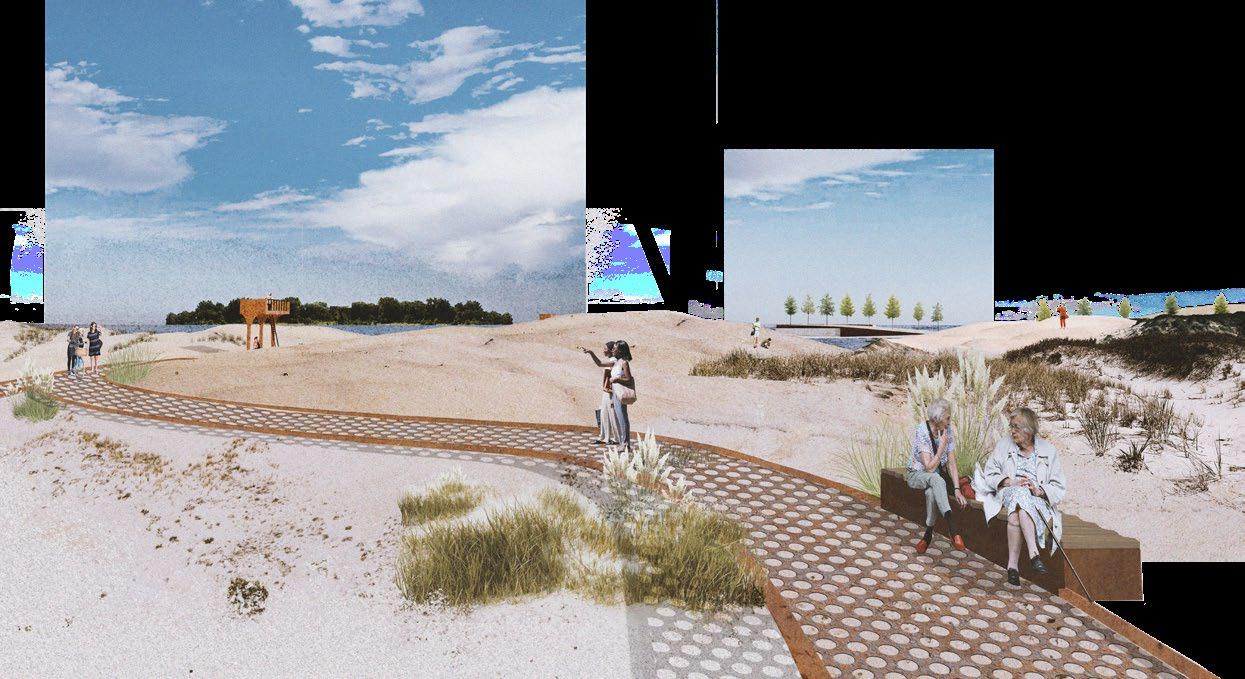
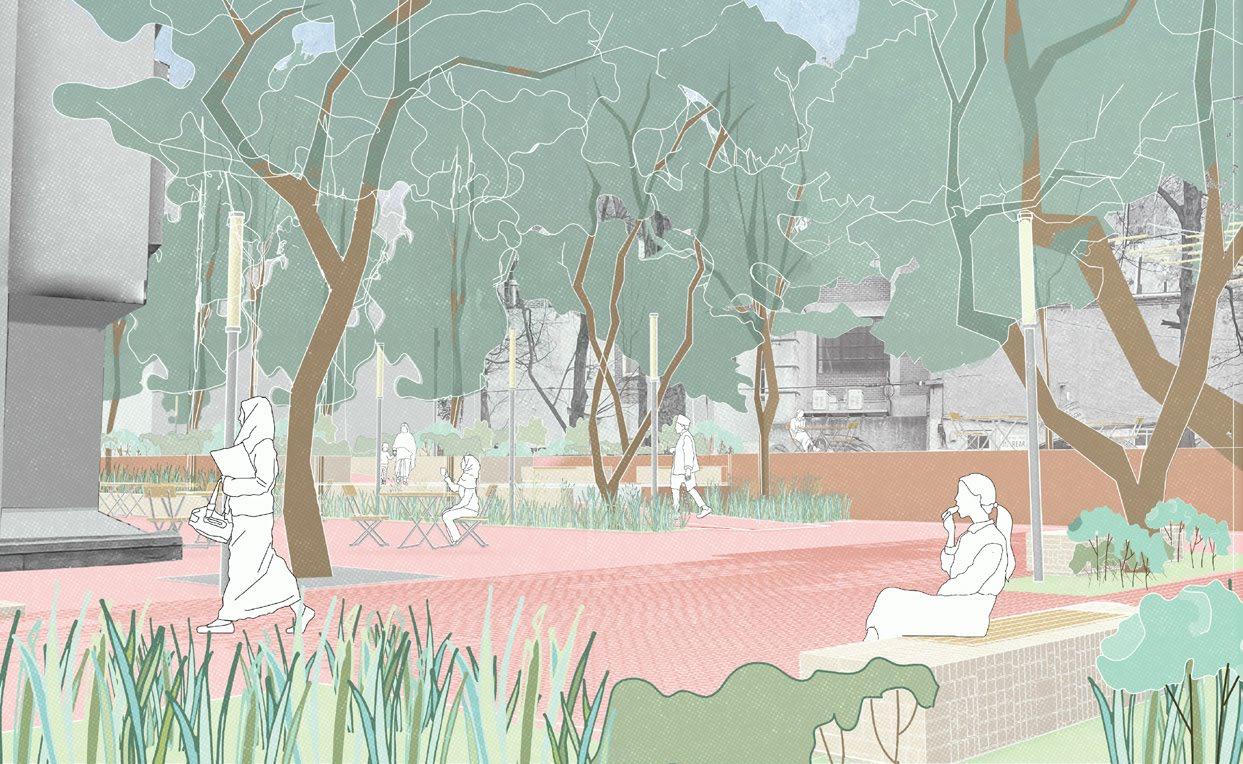
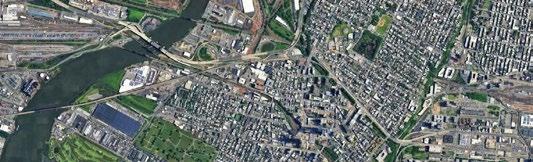
Since European settlement, the Fishtown section of the Delaware River served a mainly industrial function. This project proposes to redevelop the site into a city park – reconnecting adjacent neighborhoods with the waterfront. The site’s long-standing industries – represented in the project through four characteristic materials – inform the type, location and form of the park’s programming. The four industries are metal casting, shipbuilding, construction material distribution, and glassworks. The four representative materials are iron, trees, concrete, and sand. In turn, these materials manifest on the site as an urban square, pine-oak forest, pocket scapes, and dunes.
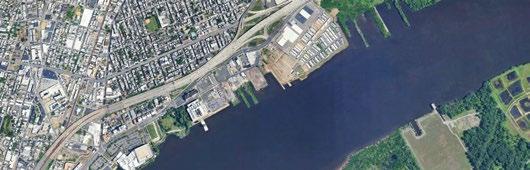
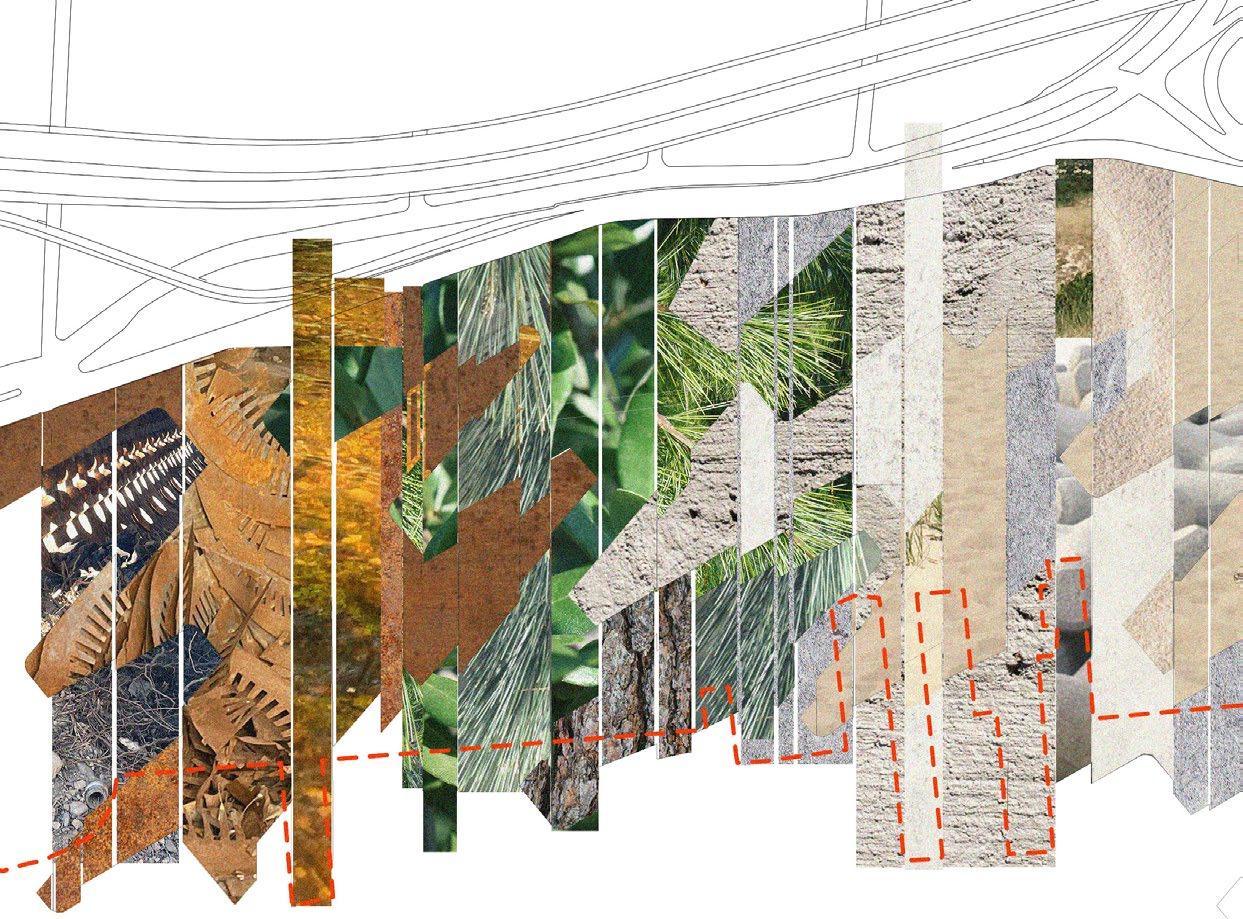
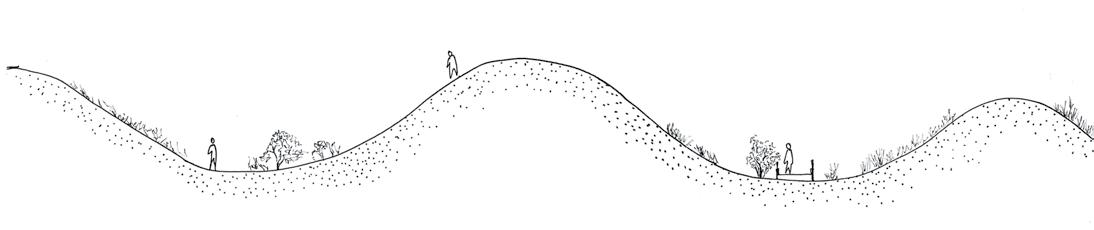
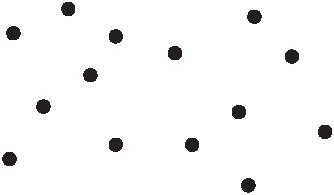
The location of the long-standing industries informs the organization of programming on the site. A field condition study from the beginning of the semester eliminates the strict boundary between the four zones, allowing the materials to bleed into each other and giving form to the new shoreline. This field condition study is adjusted from the original graphic based on the site’s historic shorelines.
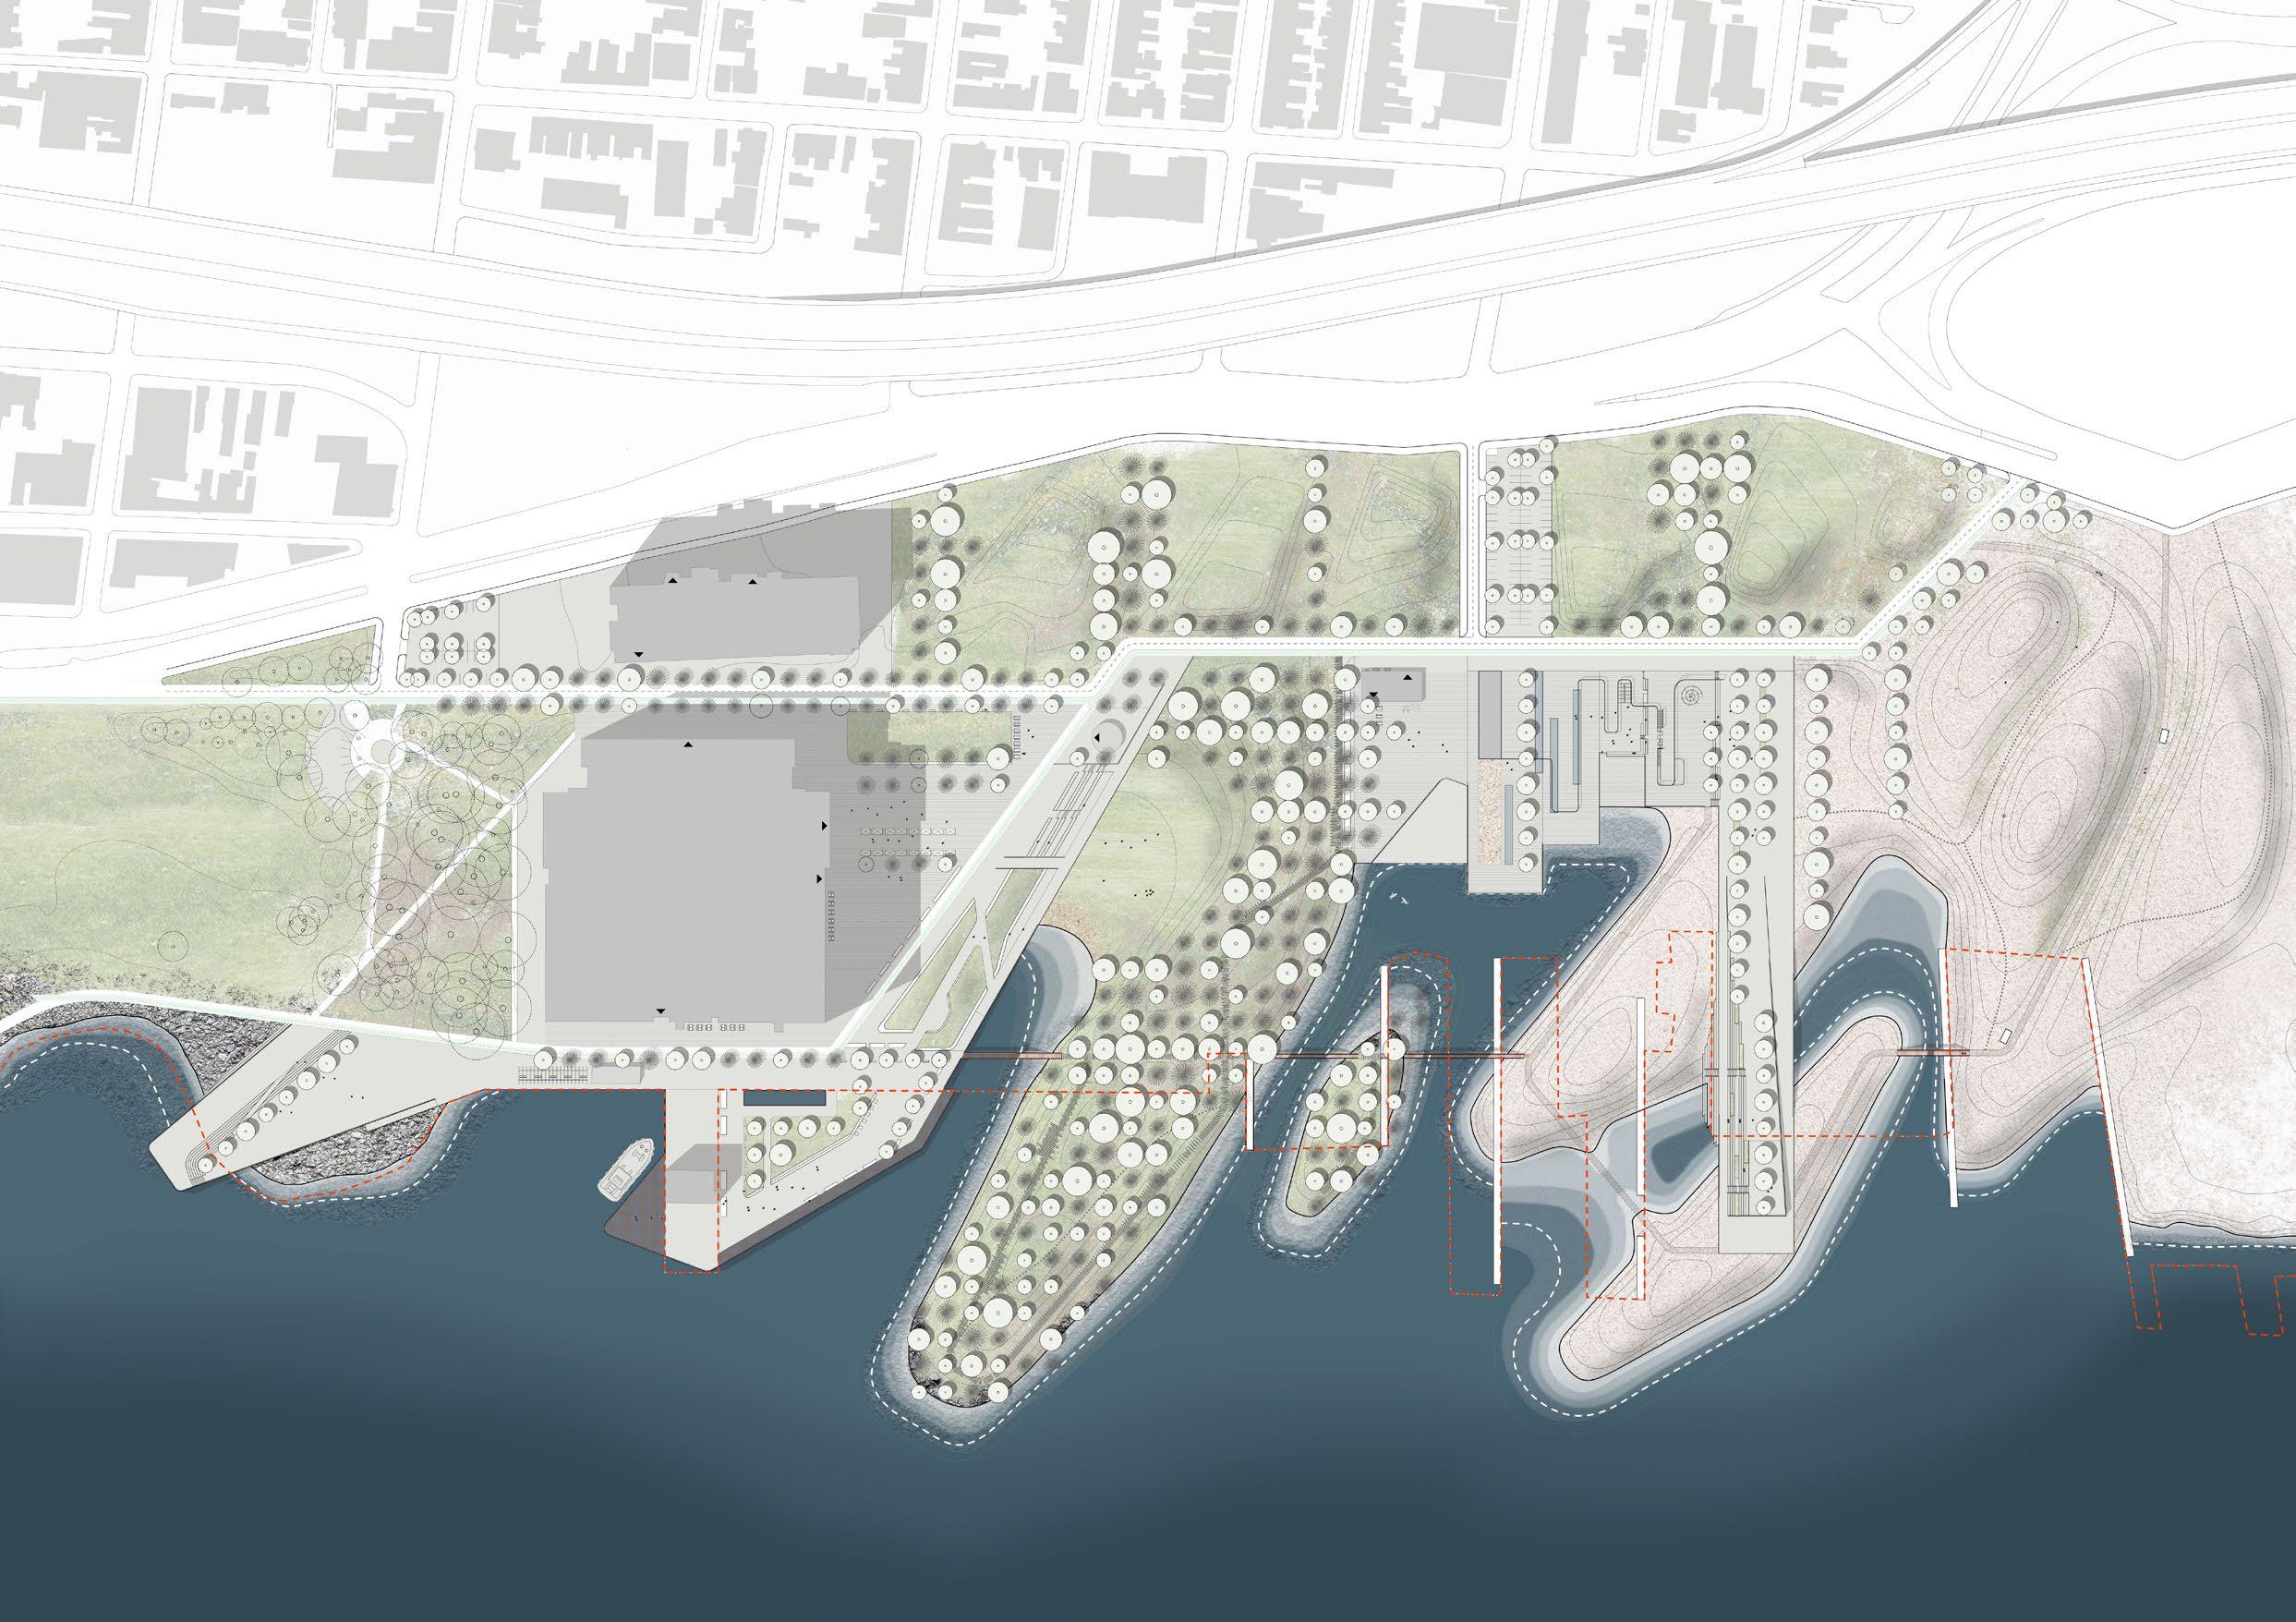
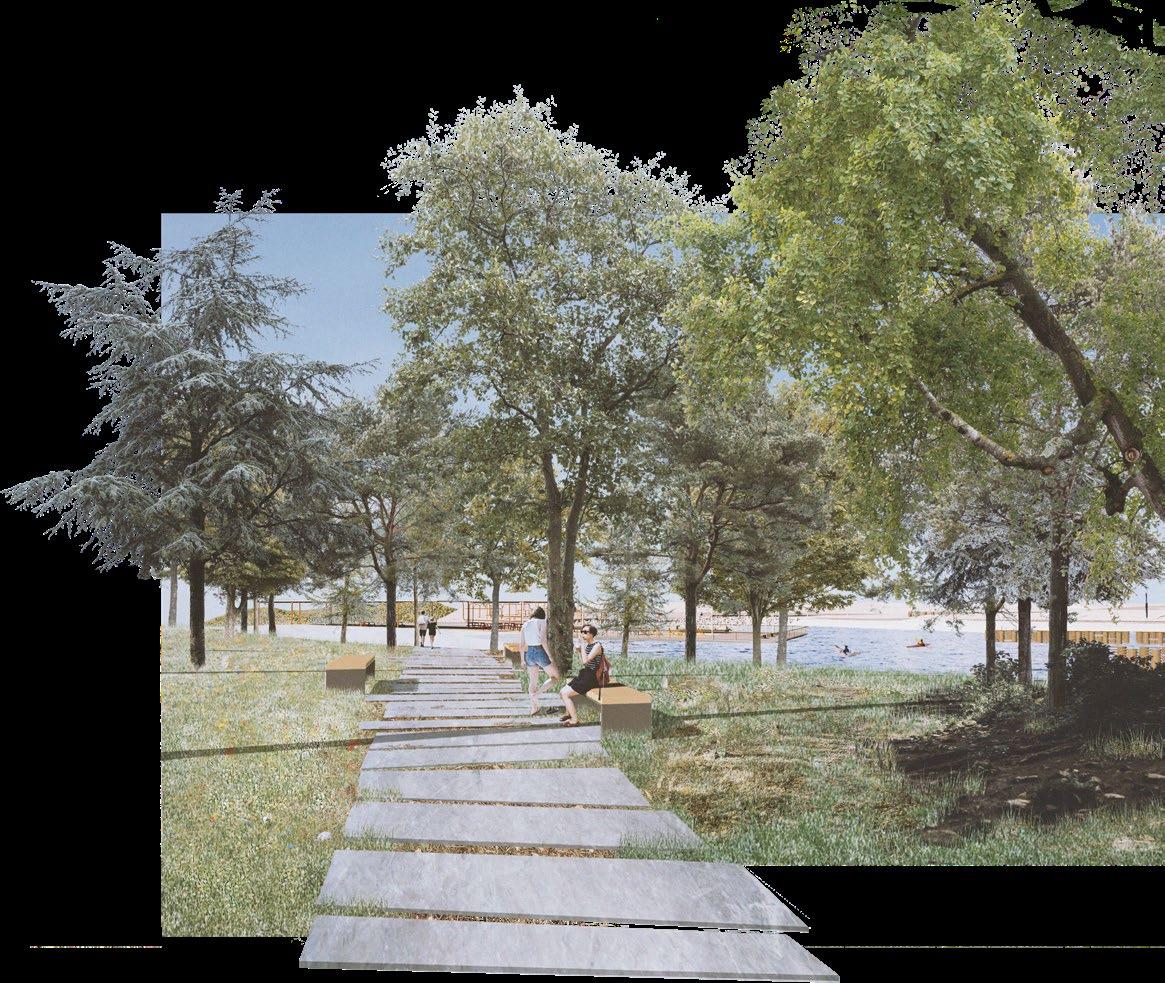

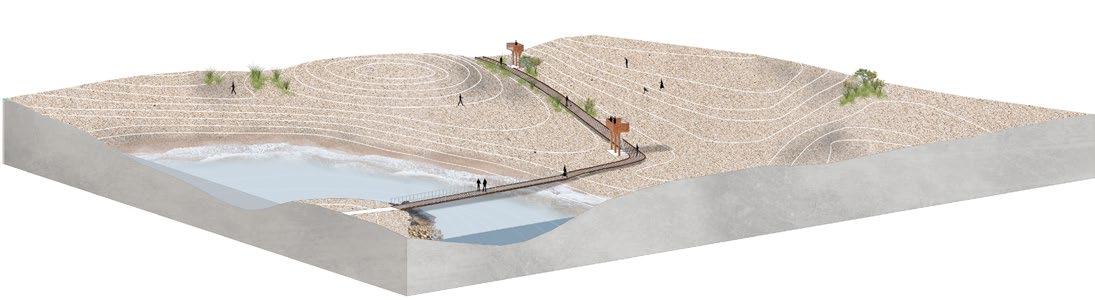
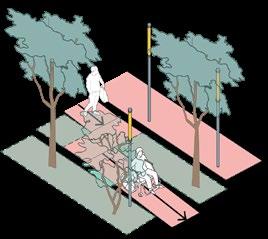
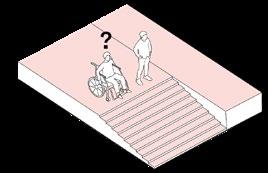
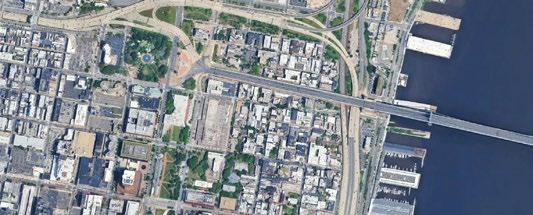
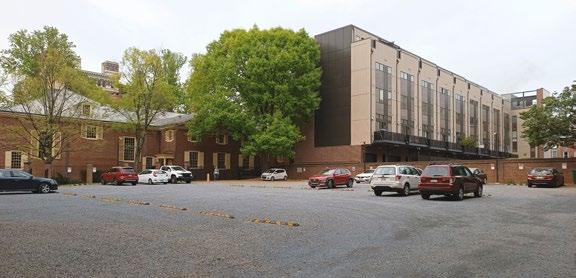
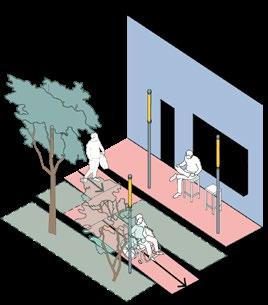

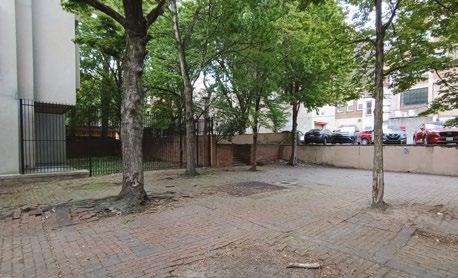
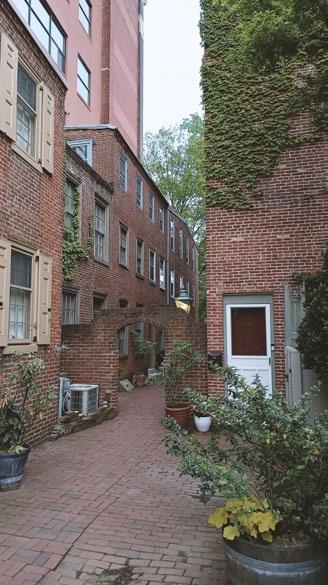
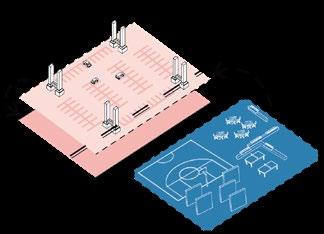

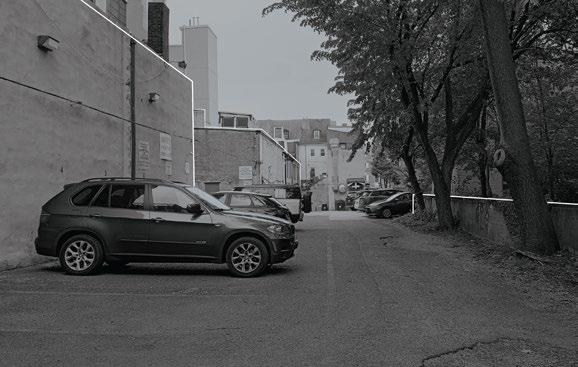
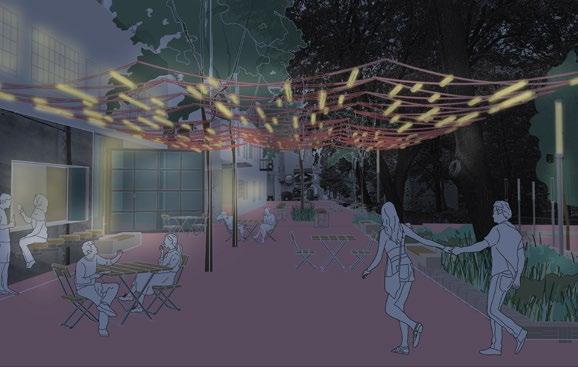
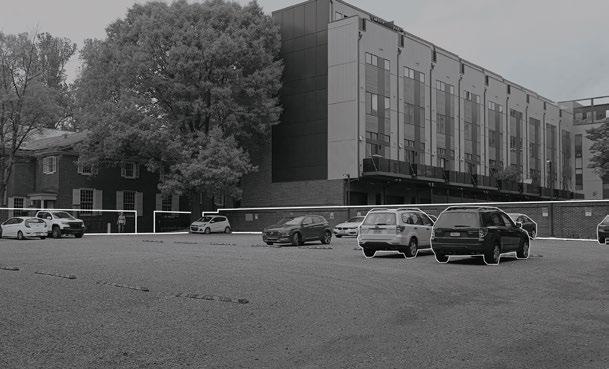
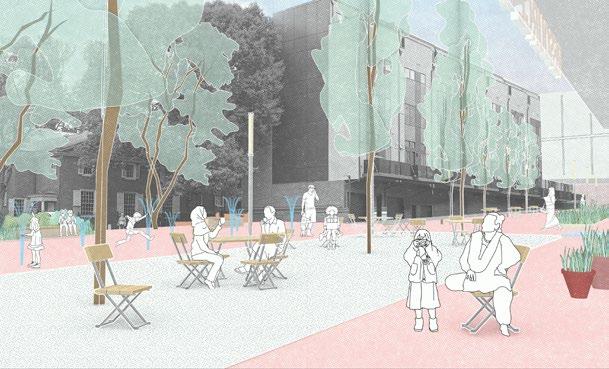
At the heart of the intervention is a proposed pedestrian meander that strengthens the site’s north-south connection, threading through mid-block spaces between 3rd and 4th Streets. By connecting alleys and pathways, removing or re-purposing barriers, and adding lighting, planting, signature paving, and urban furniture, the design creates a universally accessible and expressive public realm.
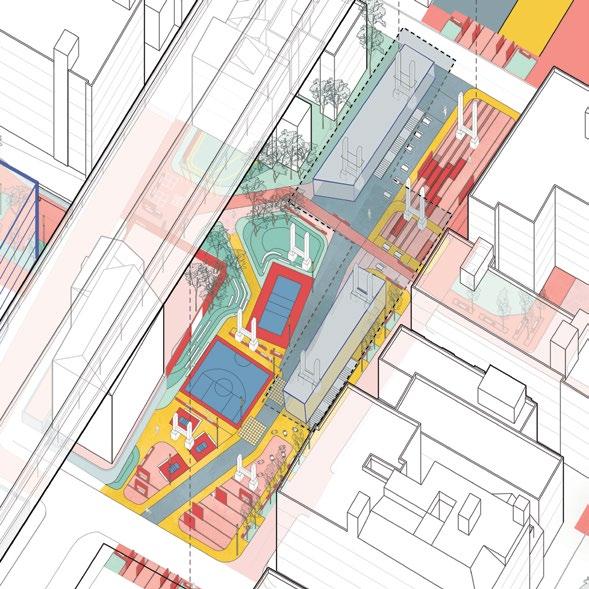
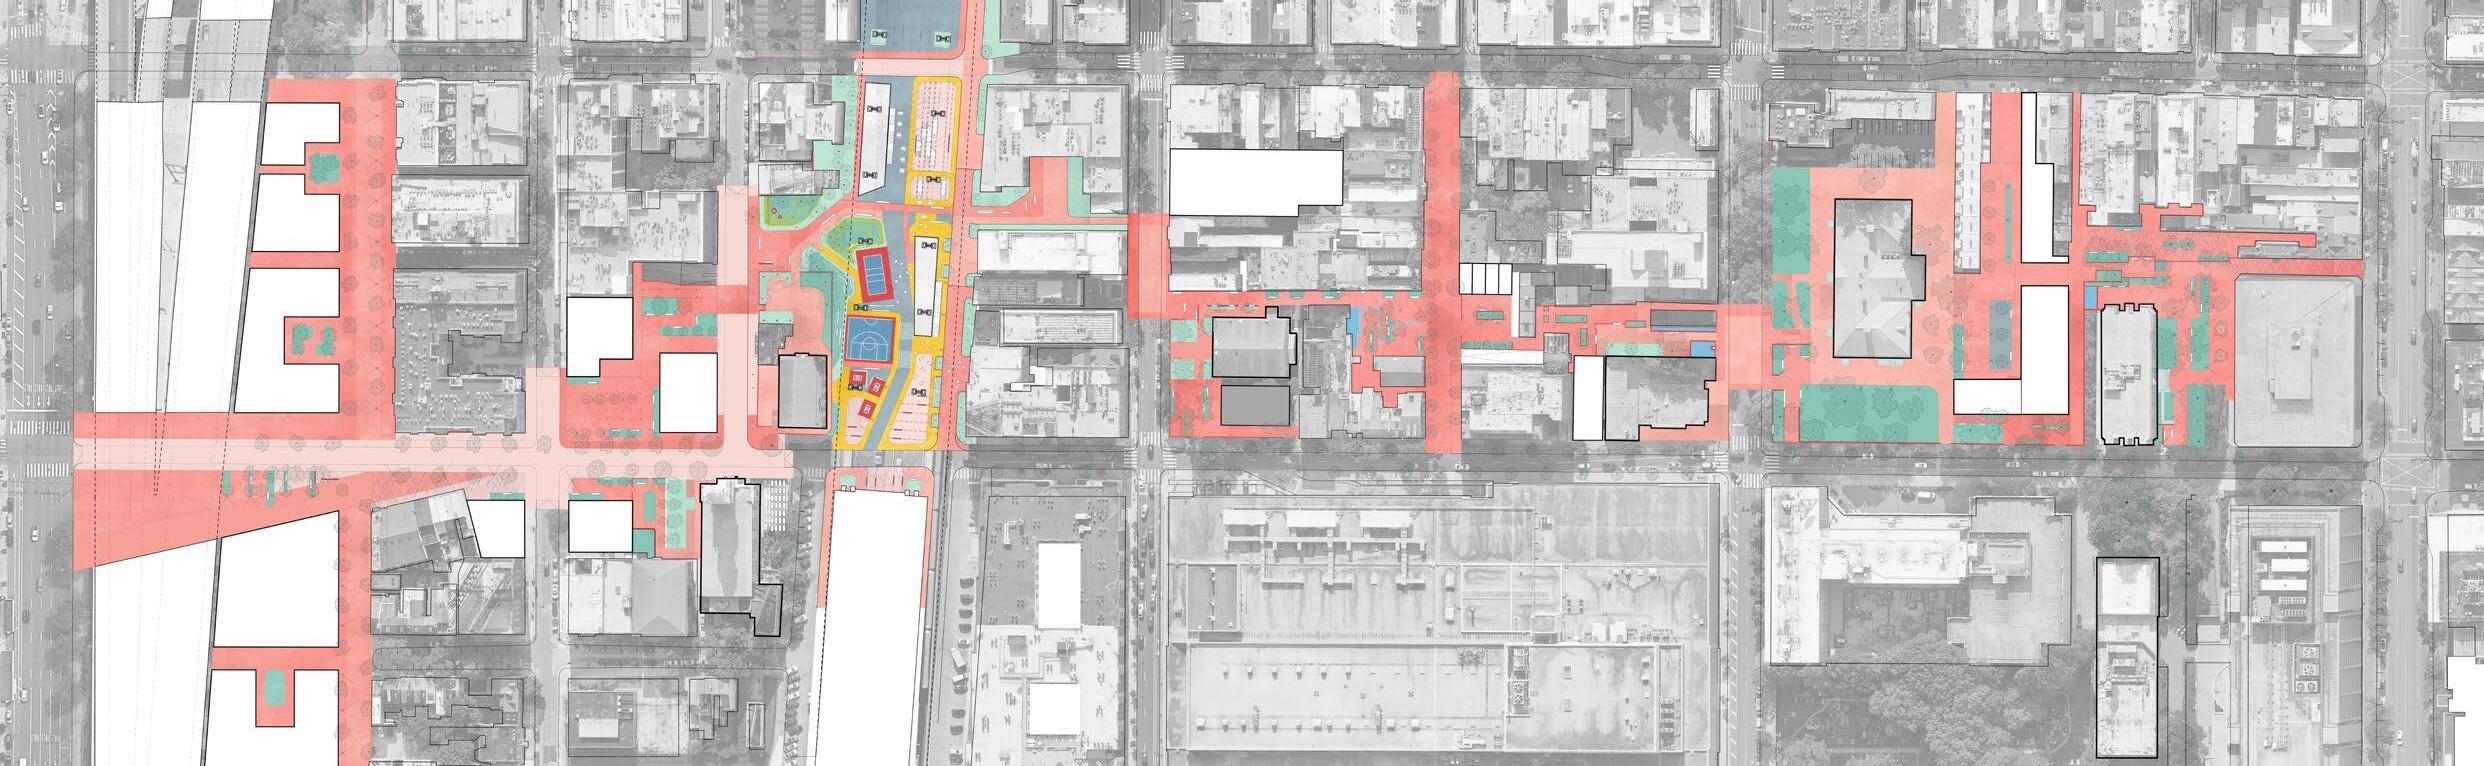


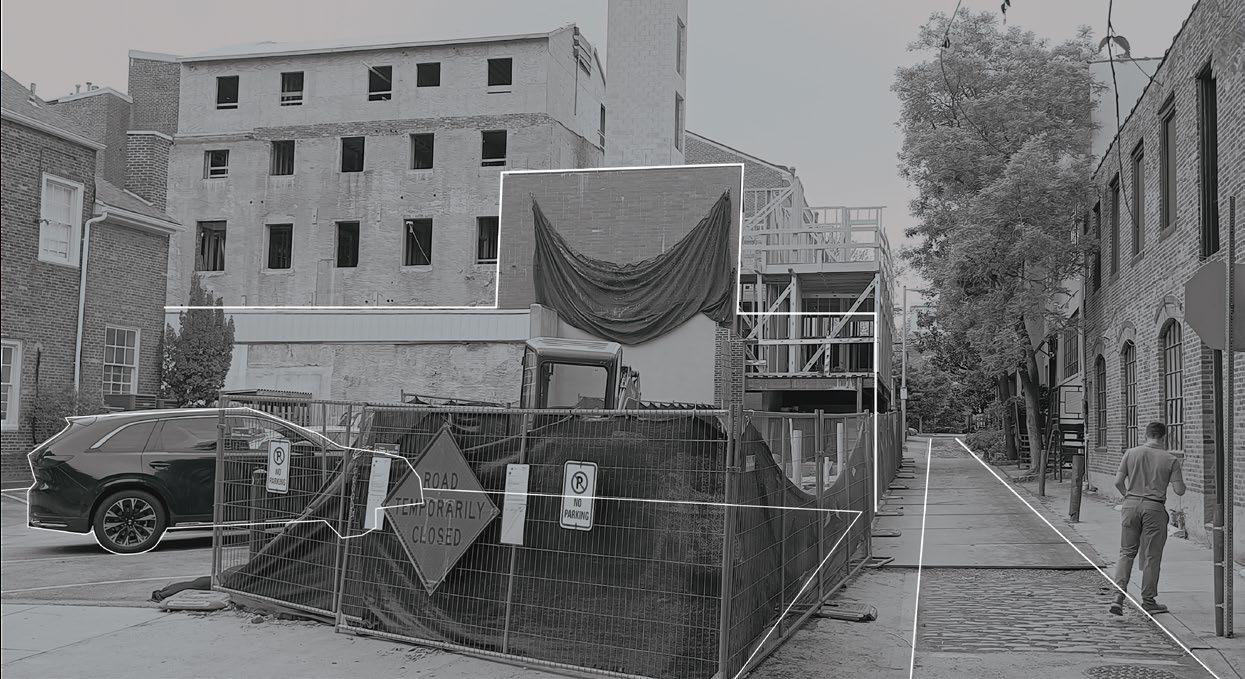
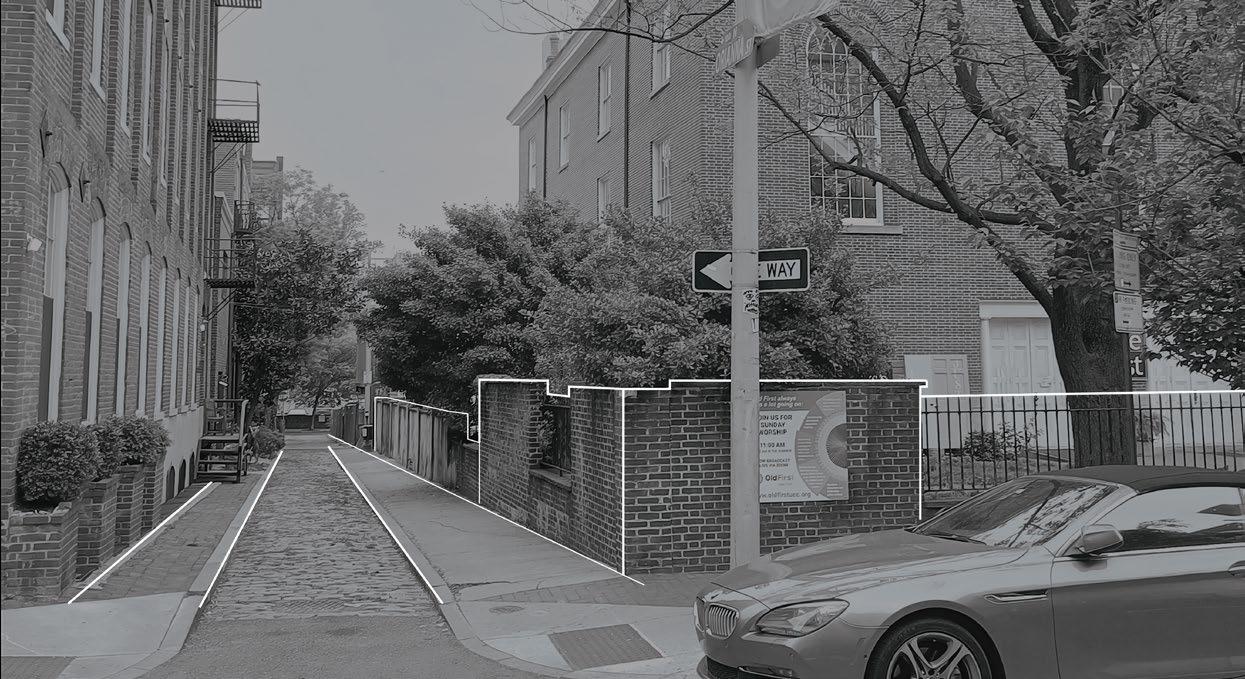
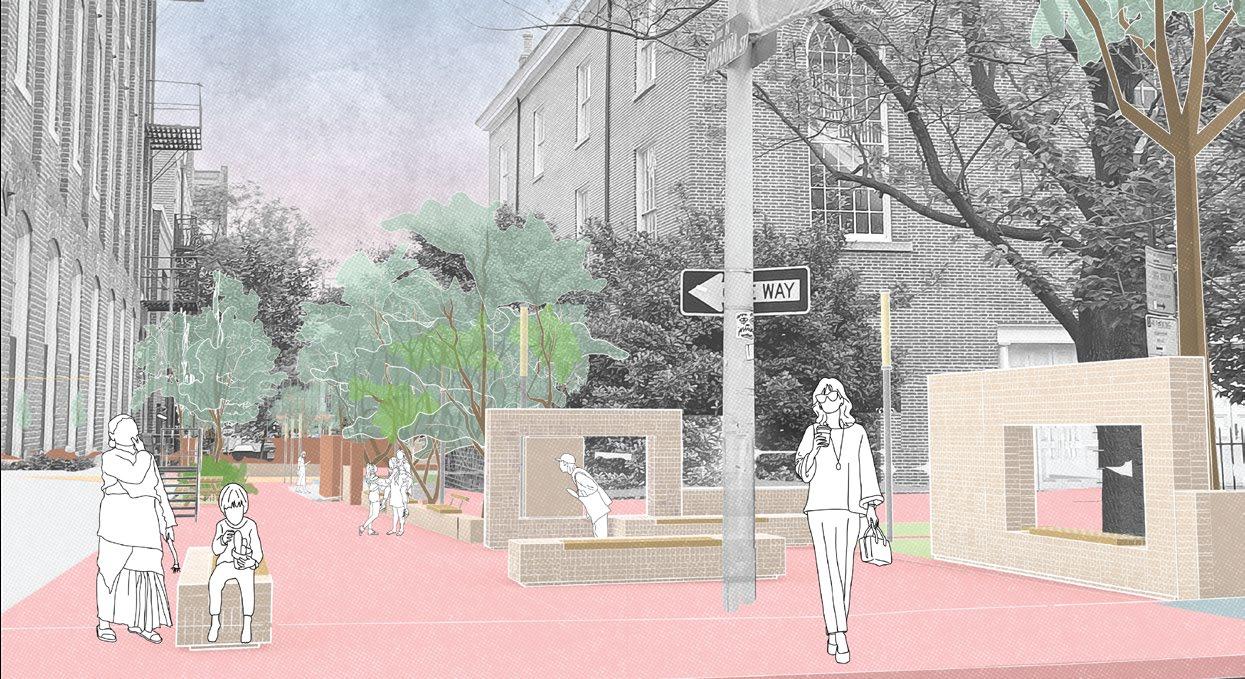
Underutilized lots adjacent to the path are reimagined as spaces for play, rest, and cultural expression—encouraging surrounding businesses to face inward and engage the new corridor.
academic - 2023
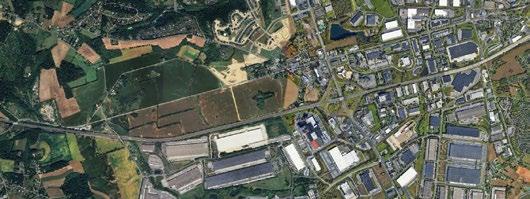
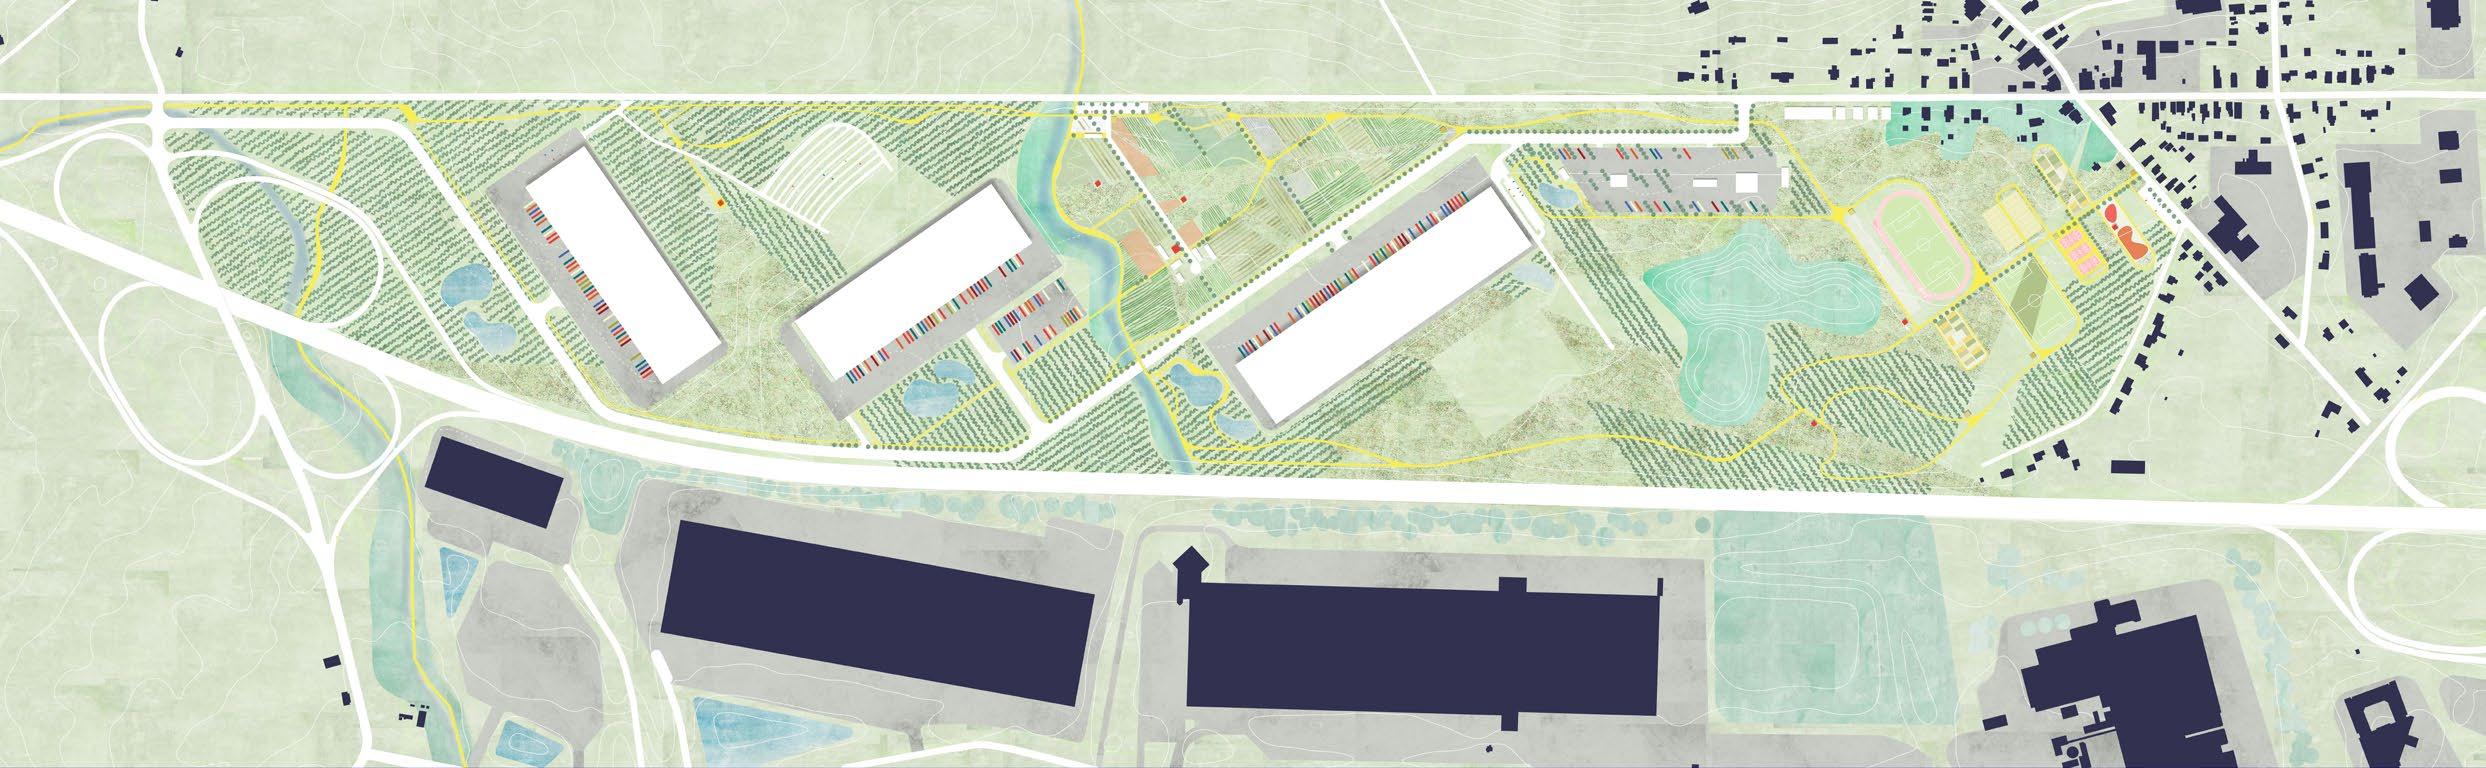
UPenn, Weitzman School of Design project scale: S M L XL individual project skills: rhino, illustrator, Photoshop, InDesign logistics warehouse campus in the Lehigh Valley, Pennsylvania
Assuming current trends persist—continued population growth in the Northeast, reliance on the Lehigh Valley for distribution, and rising e-commerce demands—Pennsylvania’s existing land use practices will lead to increased truck traffic and the steady conversion of agricultural land into residential and warehousing developments. This proposal responds by concentrating future growth along Route 22, a major freight corridor already acting as a development vector, in order to relieve pressure on surrounding landscapes. While it accepts the likely redevelopment of land along Route 22 for warehousing, it challenges the conventional notion that these facilities are incompatible with other land uses. Instead, the project reimagines warehouses as part of a new pastoral vernacular—one where infrastructure, industry, and technology are integrated into the agrarian landscape rather than imposed upon it.
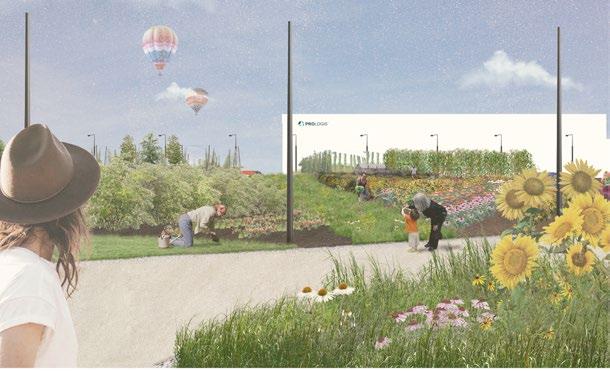
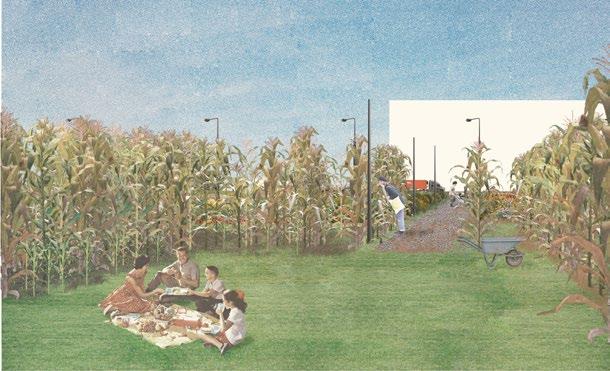
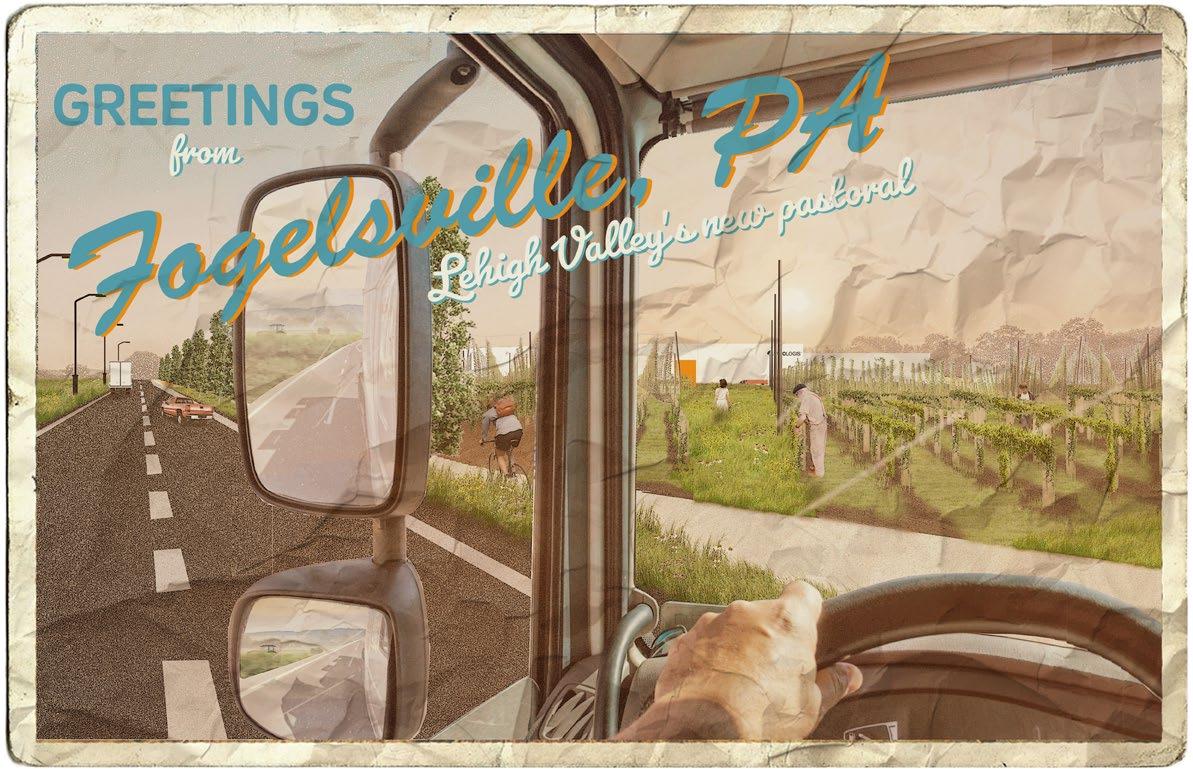
Recognizing the burdens warehouses place on local communities— from pollution to infrastructure strain—the proposal calls for developers to provide greater public benefit. By treating the entire site as a park, and embedding warehouse boxes and supporting programs within a layered, multifunctional landscape, the design creates shared value for both the surrounding community and the nomadic trucking population.
garden design in Philly’s Wissahickon park
academic - 2022
UPenn, Weitzman School of Design
project scale: S M L XL individual project
skills: Rhino, Illustrator, Photoshop, hand drawing
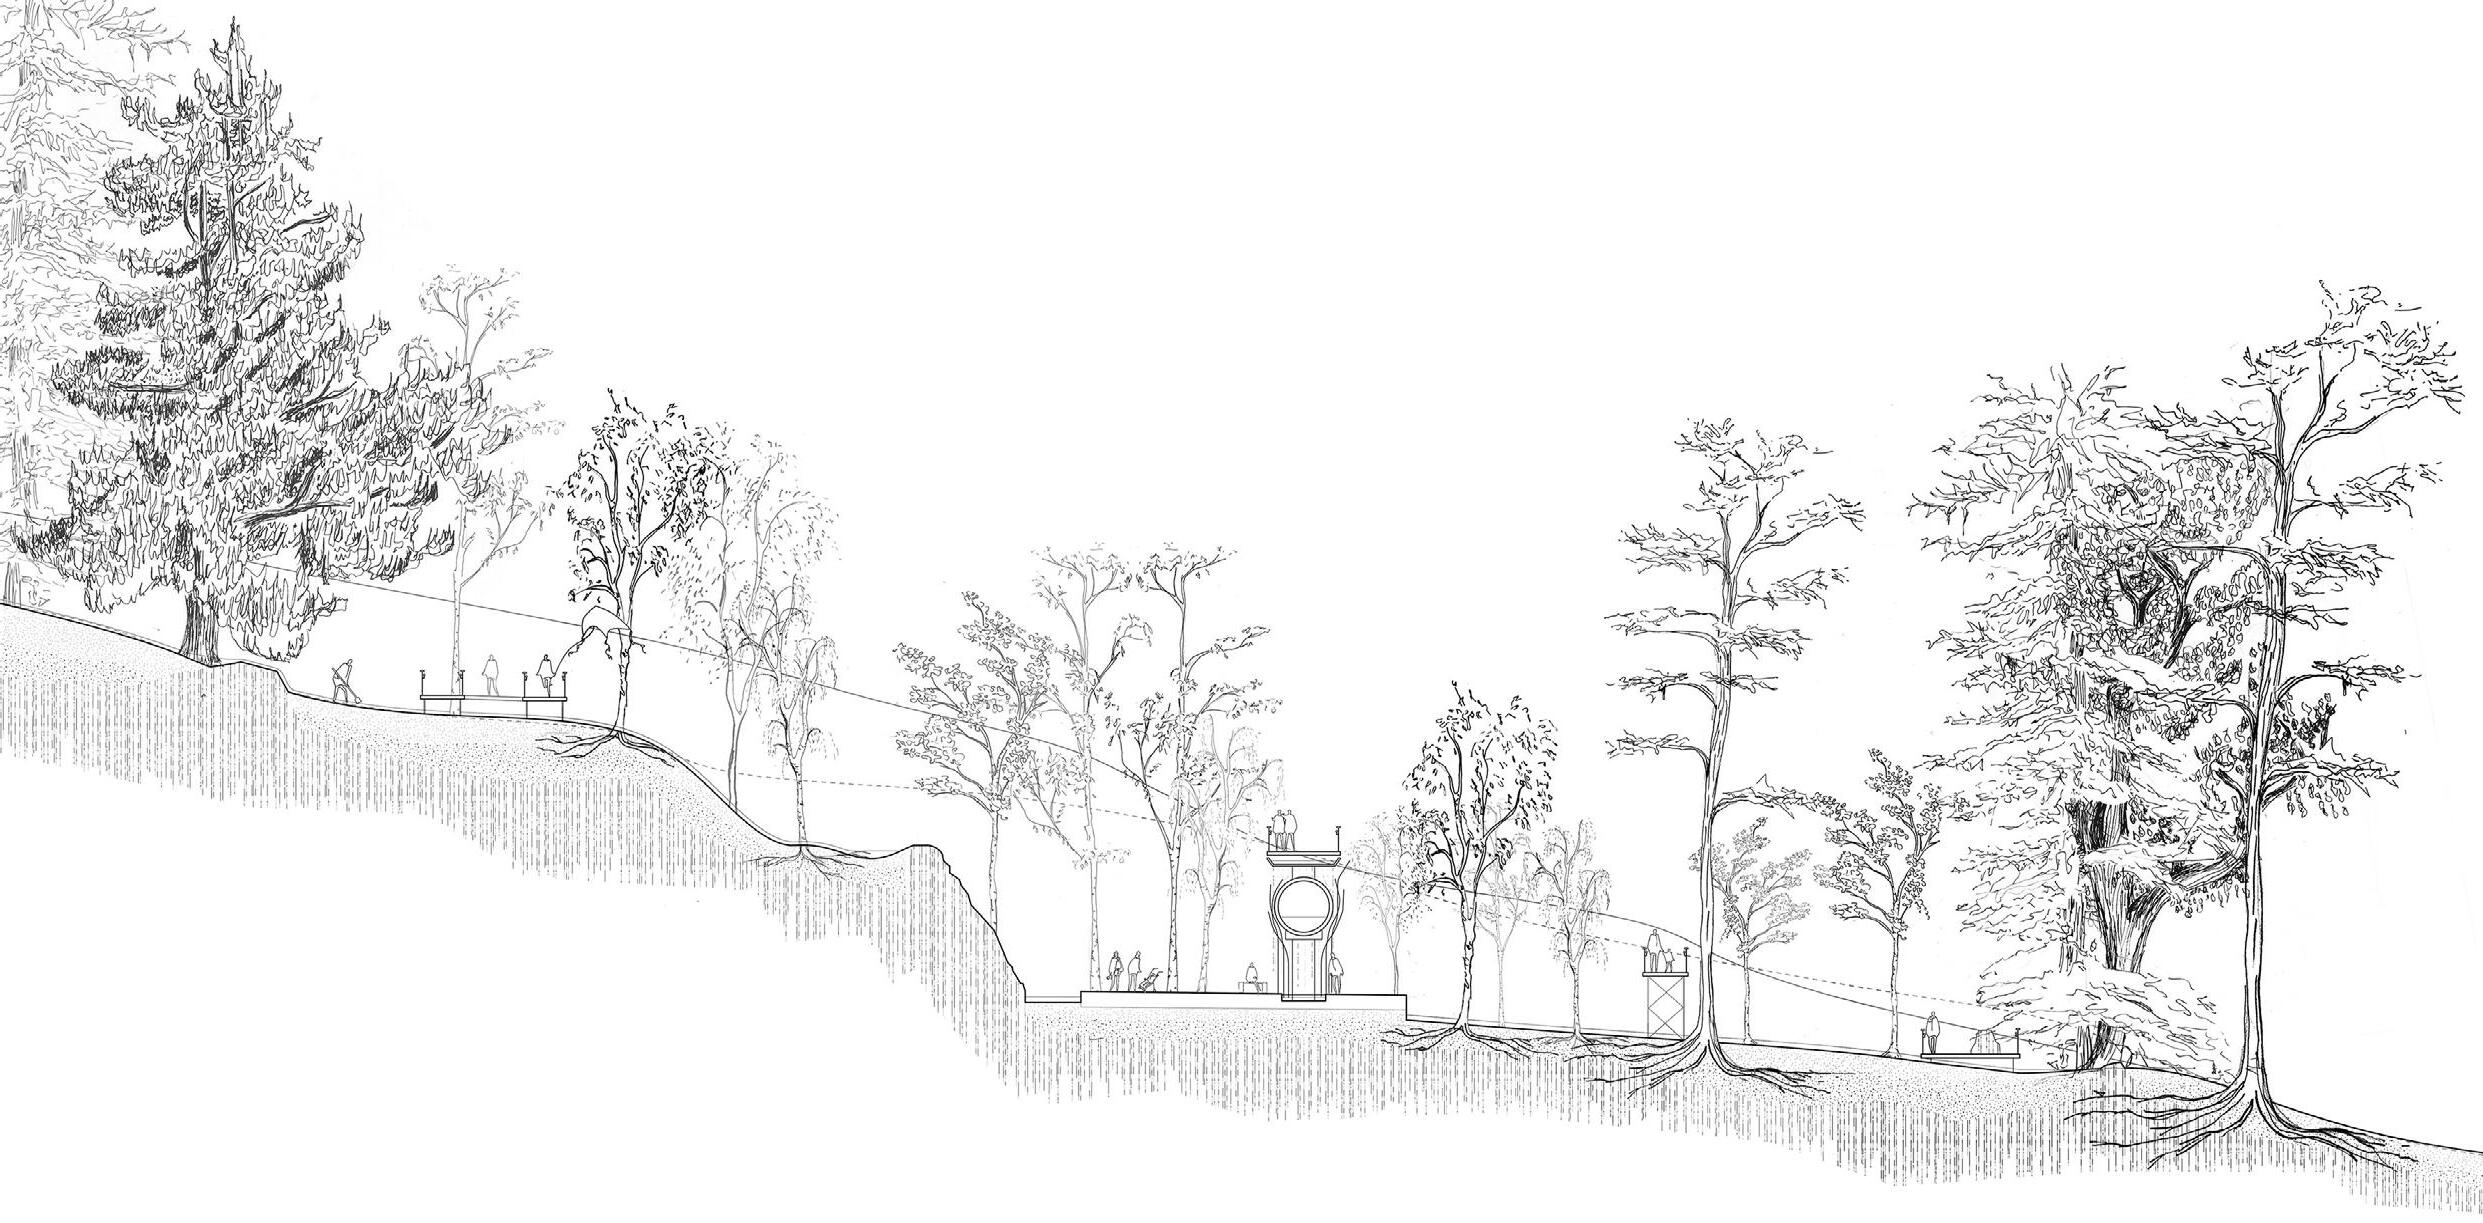
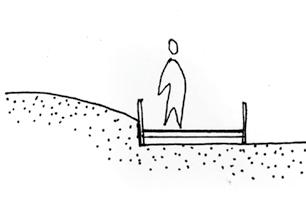
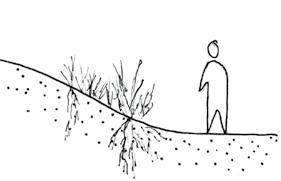
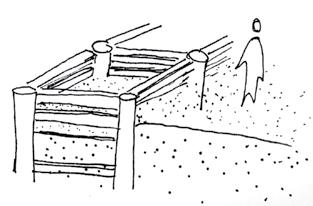
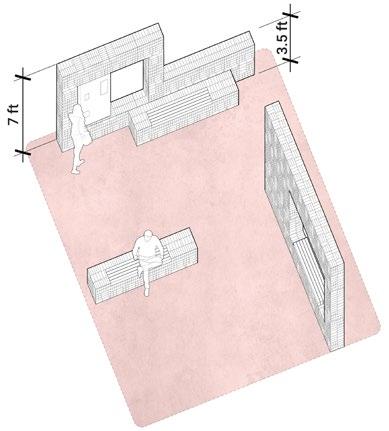
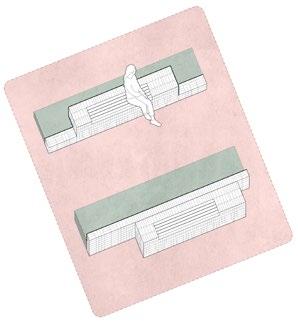
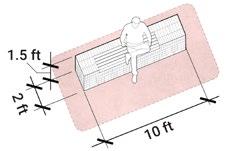
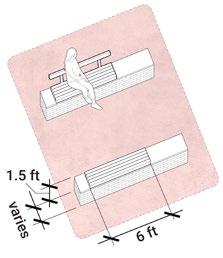
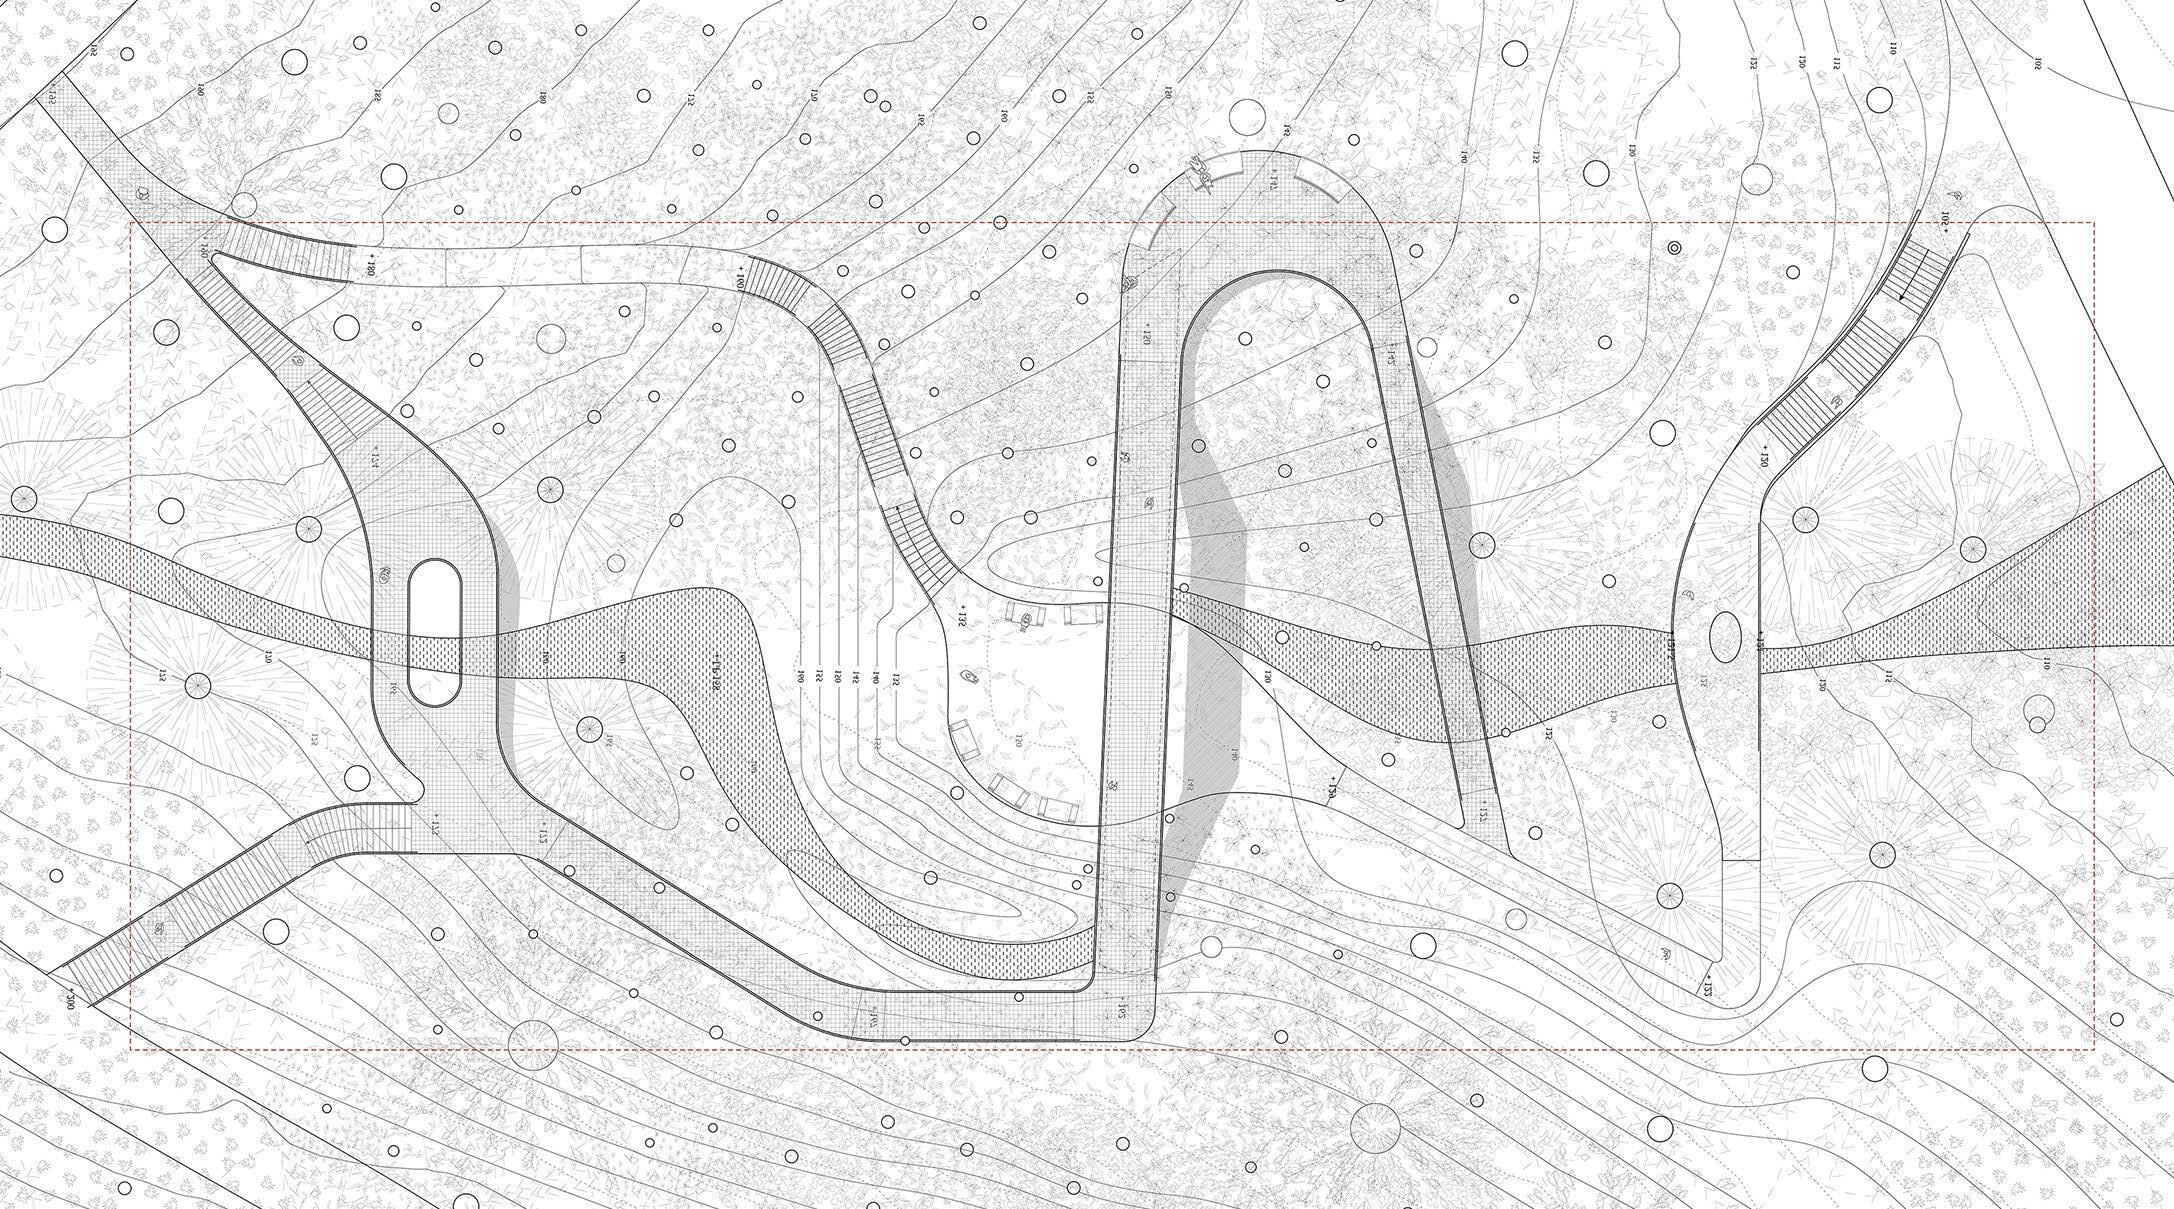
Nestled in Wissahickon Park between a central thoroughfare and a trail, the Garden of Disrupted Expectations challenges preconceived notions of non-human nature by exposing underlying infrastructure and incorporating industrial materials. The proposed design also disrupts environmental processes by redirecting water flow and altering tree growth – taking cue from the existing site conditions. The contrast between dense planting at the edges and white-trunked birches at the center amplifies the experience of the sublime within the new landscape.
CENTRAL GARDEN SPACE SPOT TO LOOK BELOW pool at base of schist rock face depression to hold water
SPOT TO LOOK IN
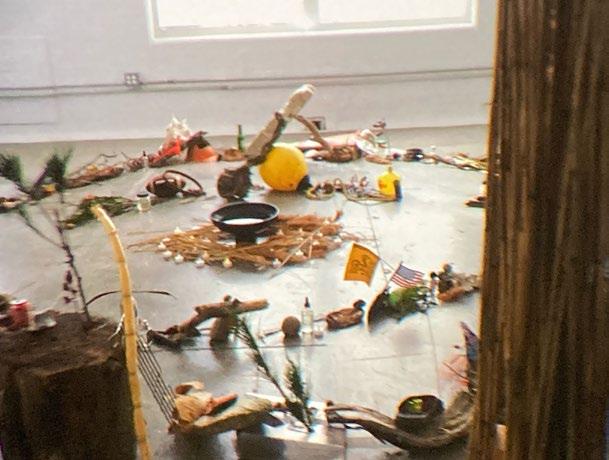
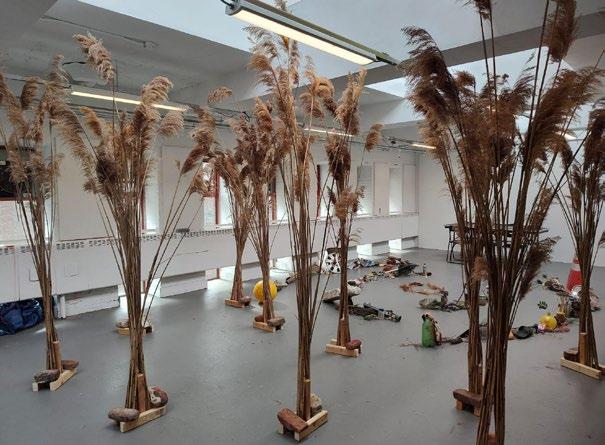
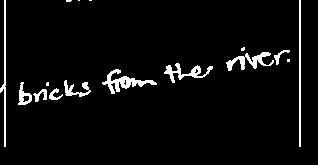
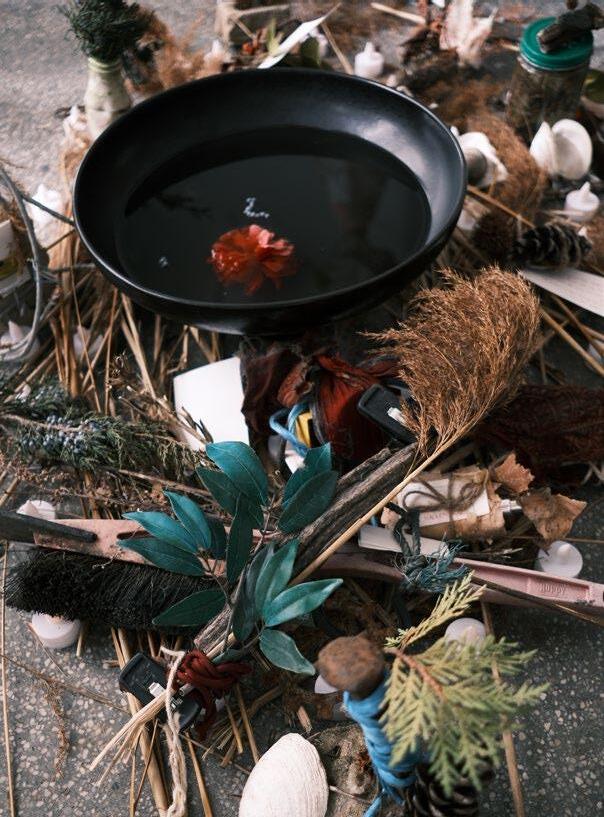
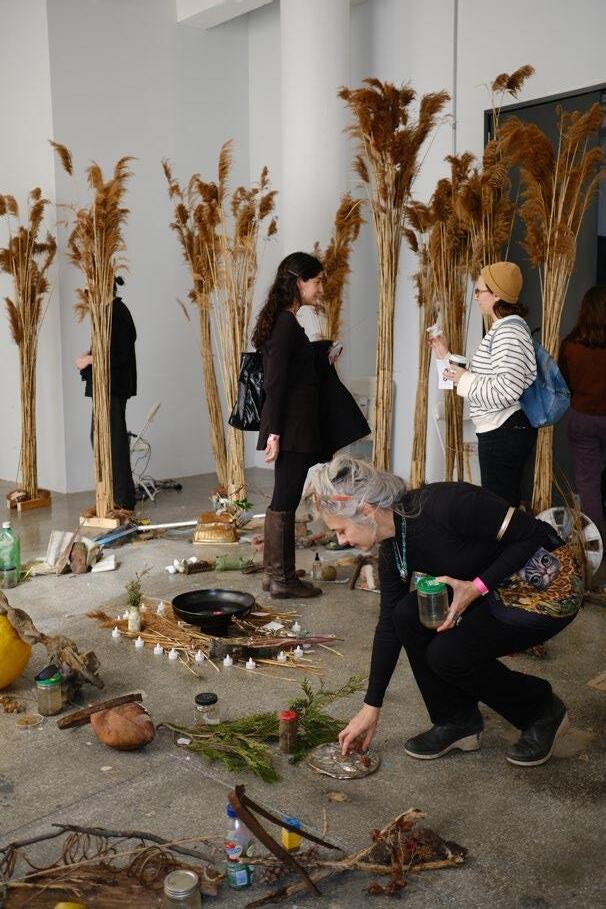
workshop as scaffolding for communicating with the Hackensack River. Jersey Art Book Fair, Jersey City, New Jersey.
academic - 2025
UPenn, Weitzman School of Design project scale: S M L XL group project skills: workshop planning, Premiere, Garage Band
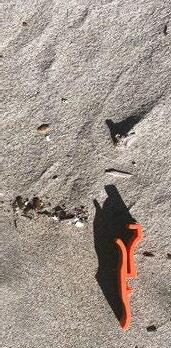
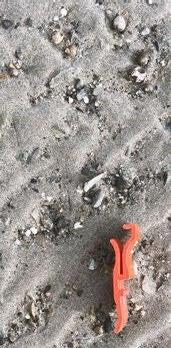
During the course of one week, we explored the Hackensack River and collected artifacts from its waters and shores. Then, without placing judgment on their value, we arranged the found objects for a workshop at the Jersey Art Book Fair. We invited visitors to enter this space of reflection and craft a tribute to the river. As they moved through the phragmites and engaged with these artifacts, we hoped they formed a deeper connection to the river through touch and creation. Finally, we asked participants to place their creation on the altar at the center of the room. Through the workshop, we created time to reflect on perceptions of the river and its materials.
The tributes will be preserved and will become part of a body of work that is generating attention and directing energy towards imagining new futures for the river.
Photos: Mariya Lupandina, Noa Manchover & Shuyuan (Sebastian) Zhang


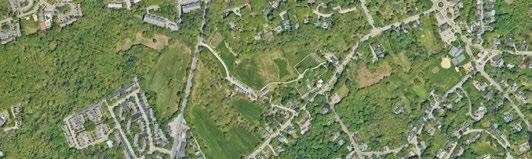
Stevens-Coolidge Place, North Andover, MA
professional - 2019-2021
Mikyoung Kim Design, The Trustees of Reservations project scale: S M L XL with Yufan Gao skills: Rhino, AutoCAD, Illustrator, Photoshop, Concept Design, Design Development, sketch models
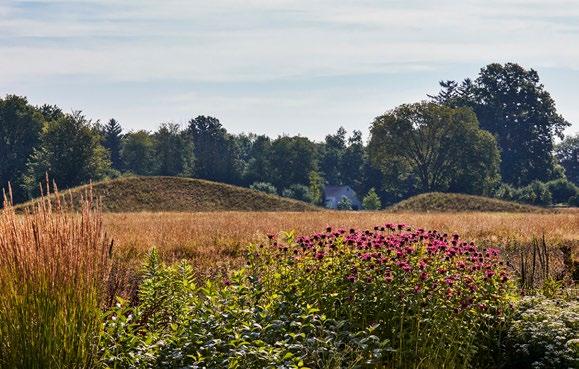
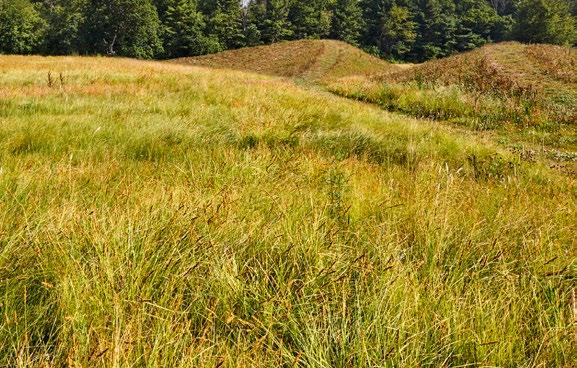
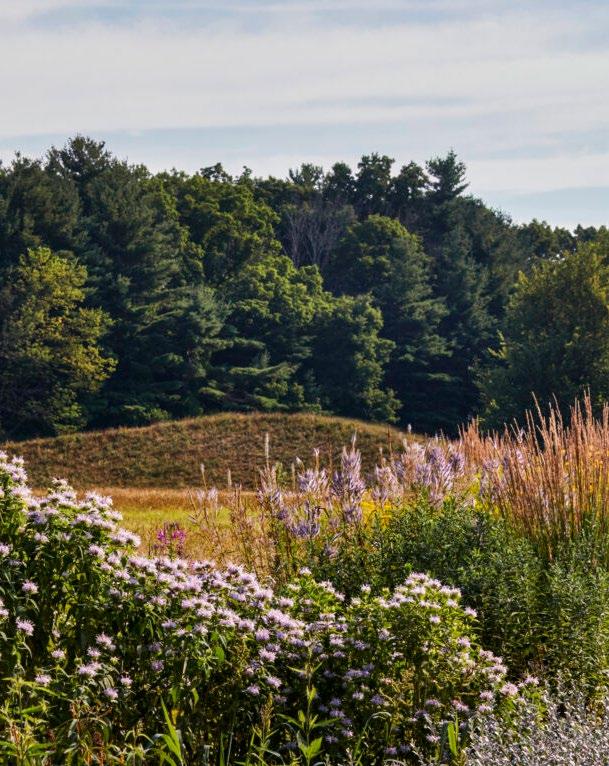
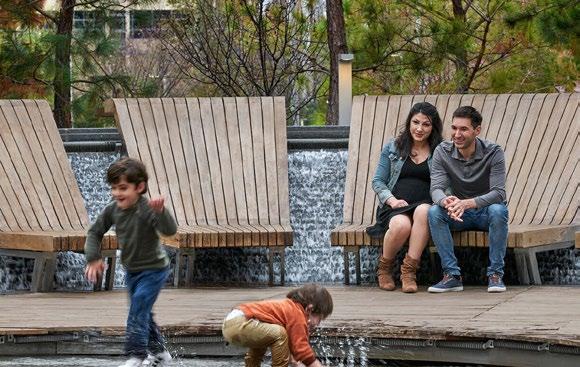
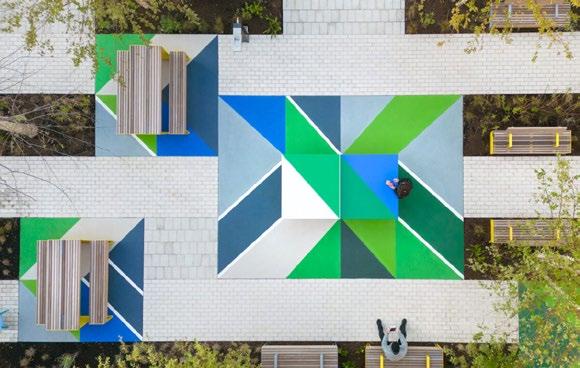
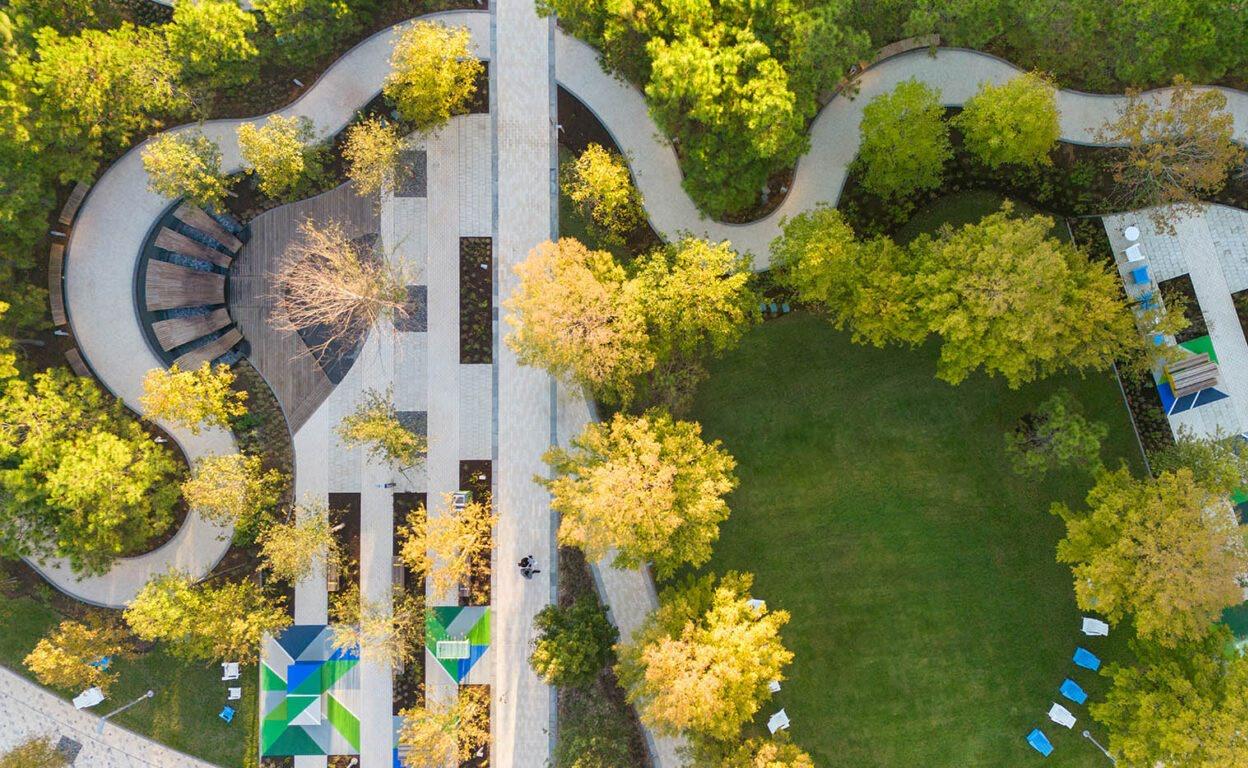
Landscape Rooms reimagines an early 20th-century estate landscape as a dynamic place for ecological education and immersive seasonal experience. The project introduces a series of contemporary “ecology rooms”—garden spaces designed to interpret and showcase the diverse ecologies of New England. These new garden rooms complement and extend the site’s historic formal gardens, offering visitors a layered experience that merges cultural heritage with ecological awareness.
Located on the site of a former farm, the Stevens-Coolidge House and Gardens carries a rich agricultural and horticultural legacy. In collaboration with The Trustees of Reservations, we developed a phased master plan to expand and diversify the botanic collections while preserving the estate’s historical integrity.
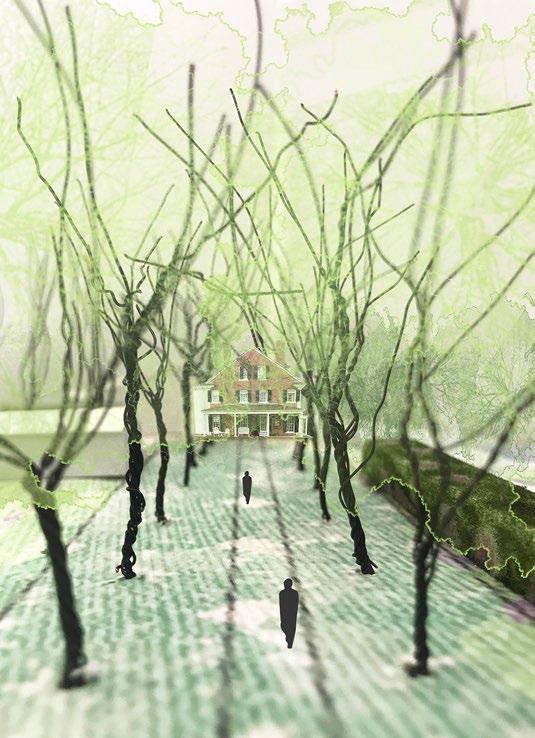
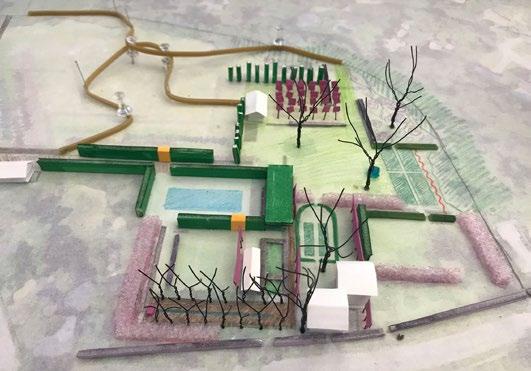
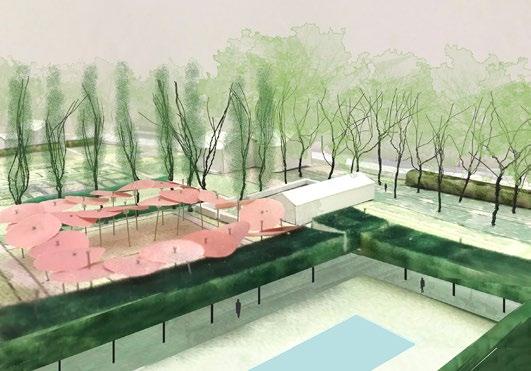


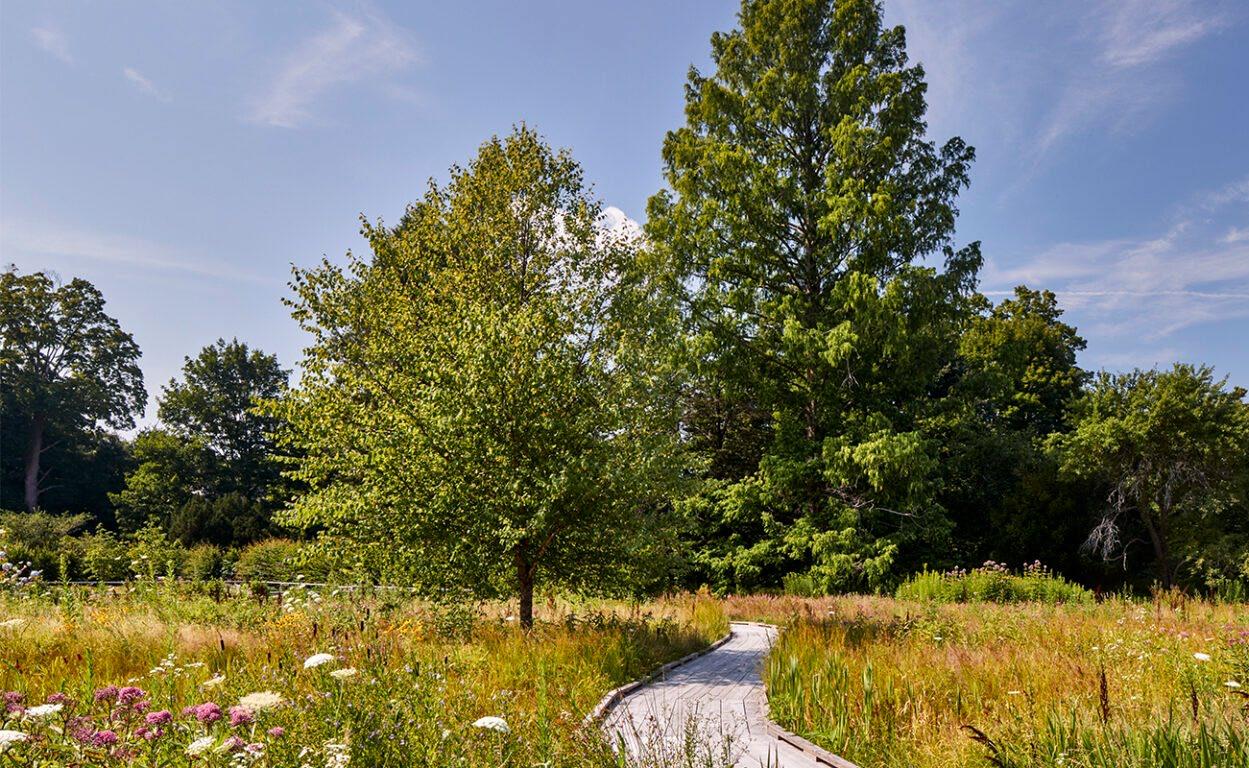
Each new room has its own distinct identity and function—ranging from a vibrant native meadow supporting pollinators, to a perennial garden that emphasizes texture and seasonal change, to a cut flower garden that invites sensory interaction. Together, these gardens create a rhythm of discovery as visitors move through the site, deepening their connection to both place and landscape process.
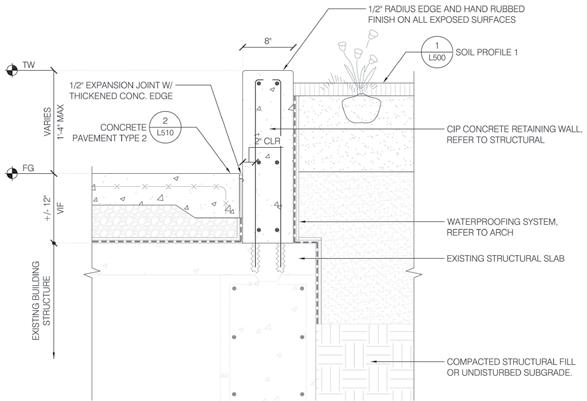
Texas Medical Center - Houston, Texas
professional - 2019-2021
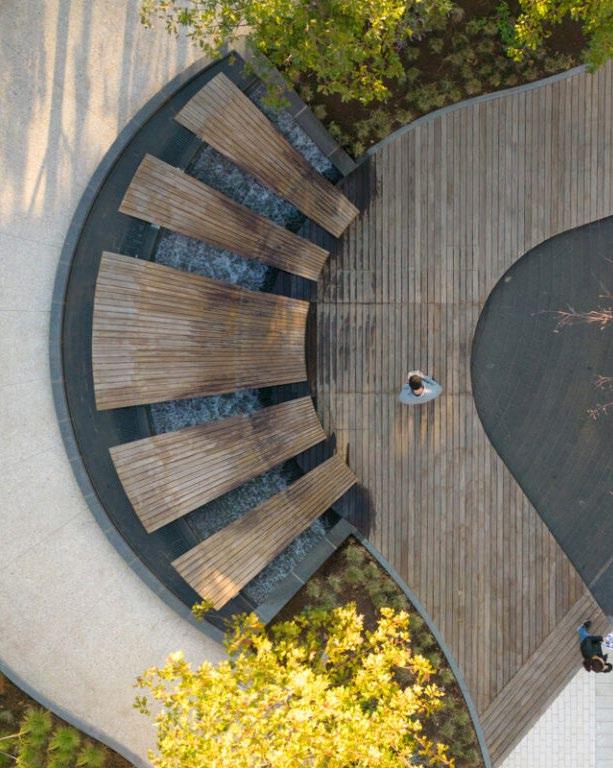
Mikyoung Kim Design with Conner Cunningham, Jess Hamilton project scale: S M L XL skills: Rhino, AutoCAD, Design Development, construction details, grading, water feature design, specification writing, material selection
Located within the Brays Bayou floodplain, the Texas Medical Center’s research campus is situated in an area highly vulnerable to flooding. In response, the landscape is designed not just to withstand water— but to embrace it. A continous sequence of gardens weaves through the campus, functioning both as a vibrant public realm and as a performative landscape that accommodate water during major storms. The accompanying pages illustrate the grading plan and construction details for one of the central gardens.
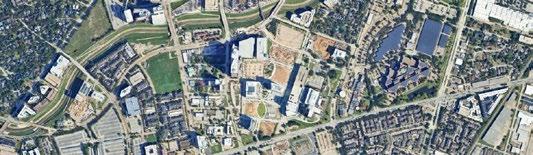
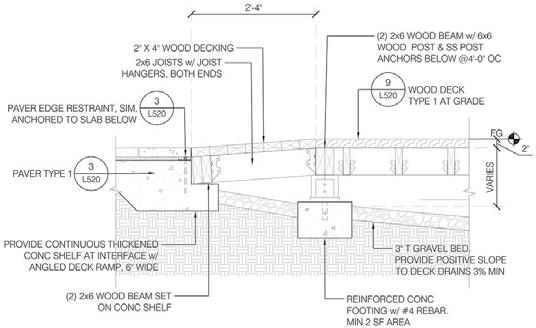
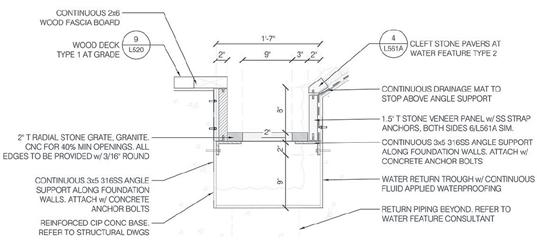
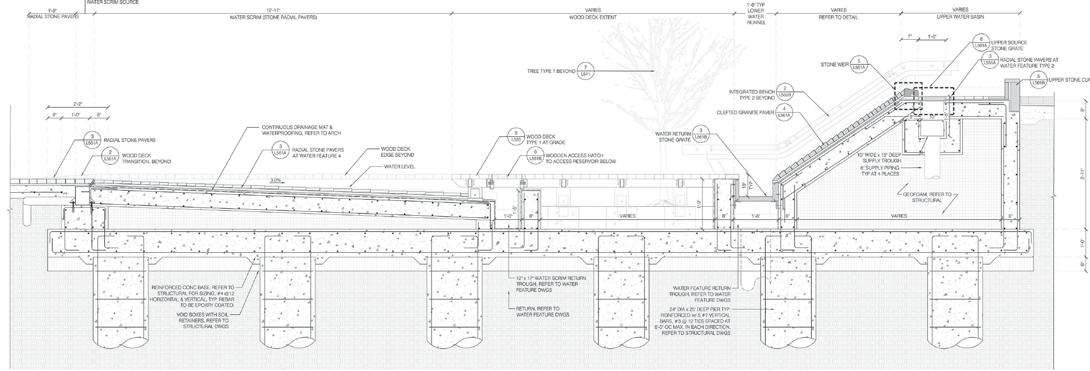
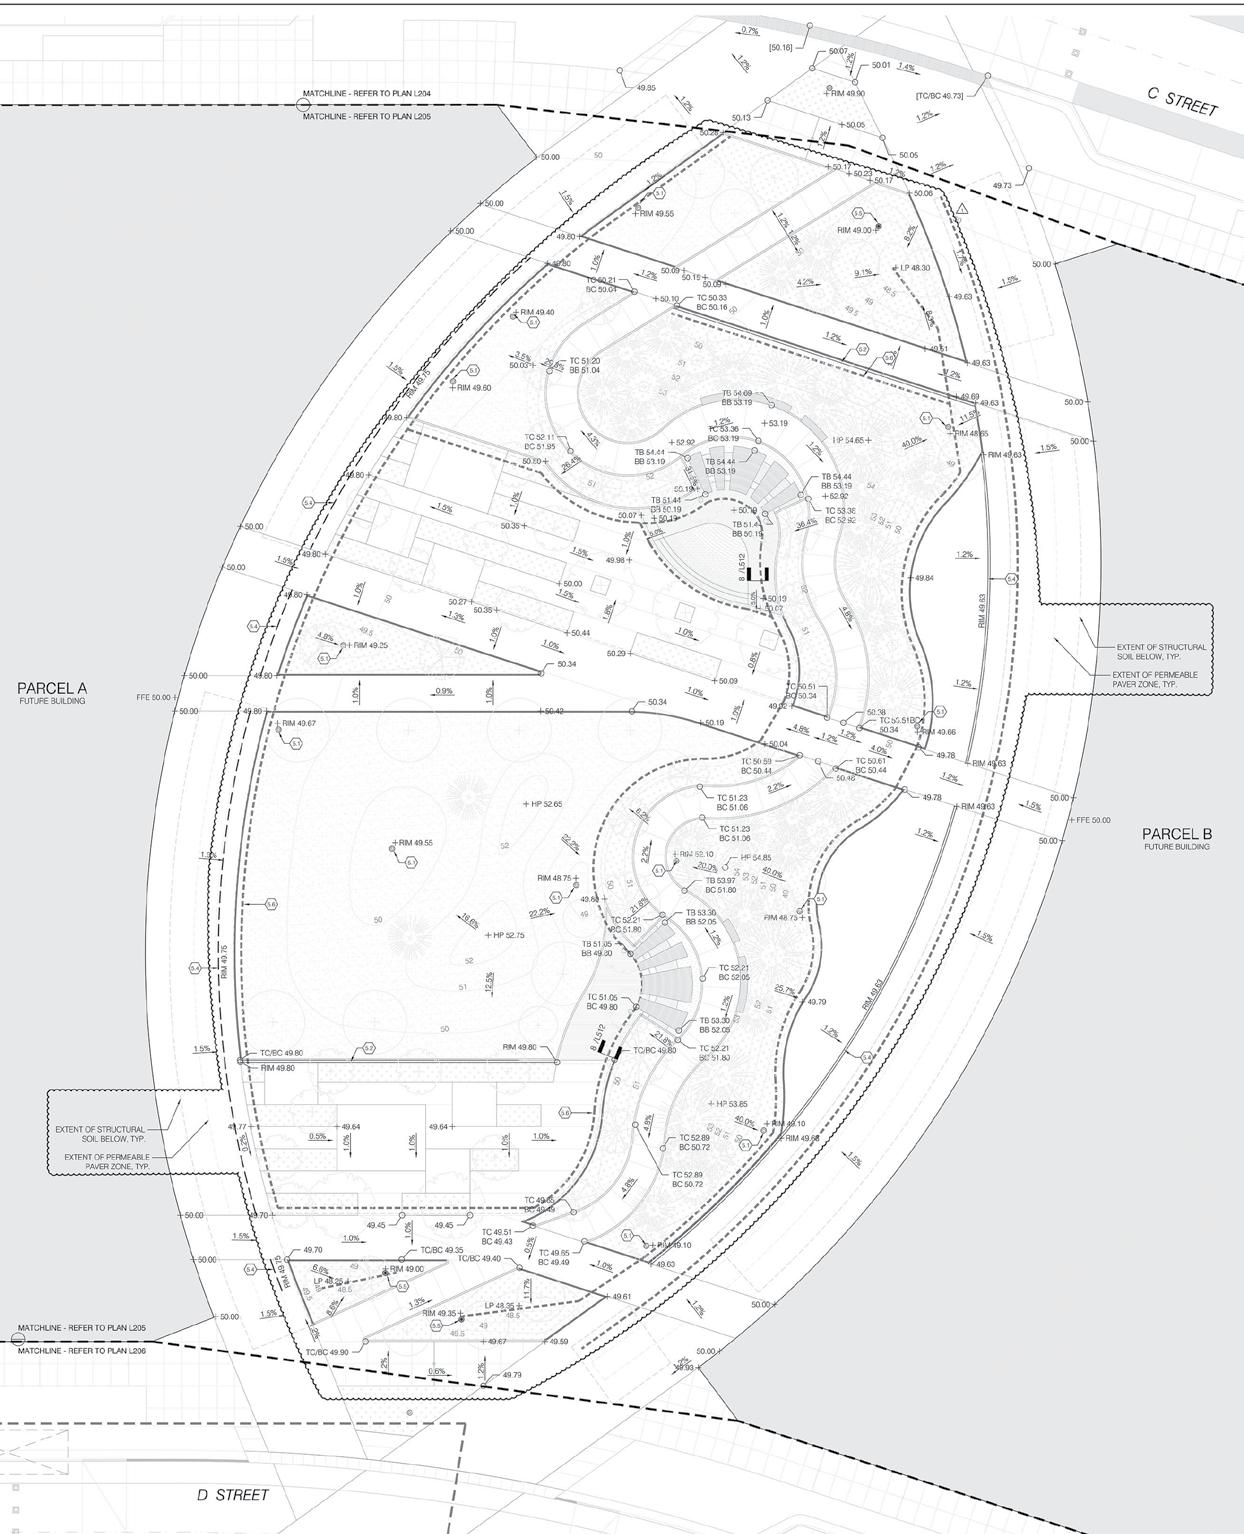

The design elevates the gardens approximately five feet above the base flood elevation, allowing them to manage runoff from a 200year storm while maintaining accessibility and visual continuity with the surrounding campus. This strategy enables the landscape to act as both infrastructure and amenity, protecting research investments while offering a lush, immersive environment for daily use. Realizing the project required careful grading and coordinating the water feature functionality.
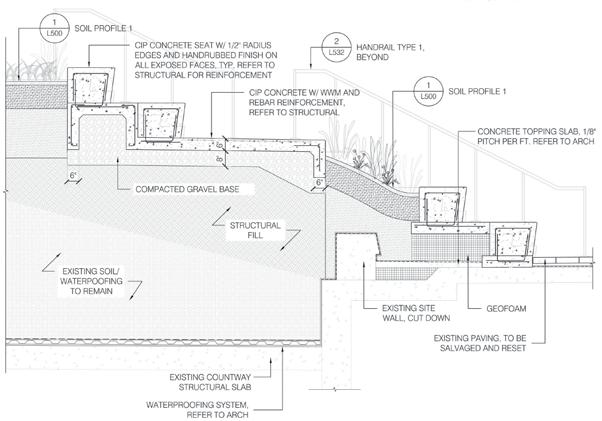
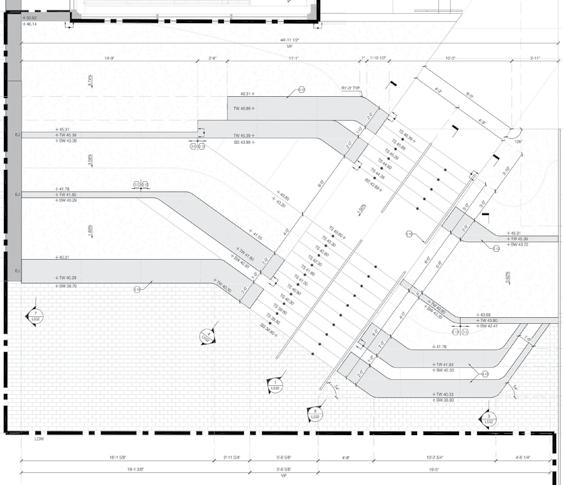
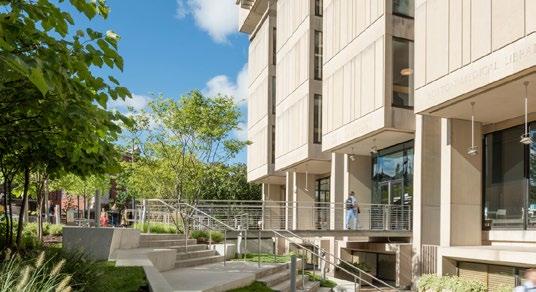
professional - 2019-2021
Mikyoung Kim Design project scale: S M L XL skills: Rhino, AutoCAD, Illustrator, design development, construction administration, project management
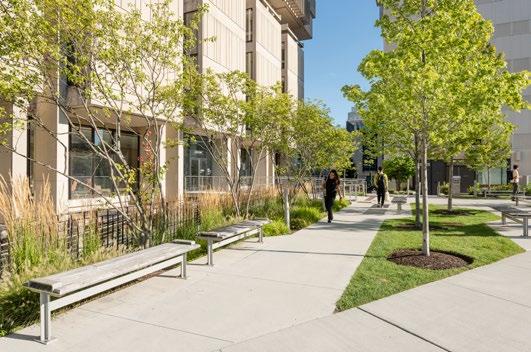
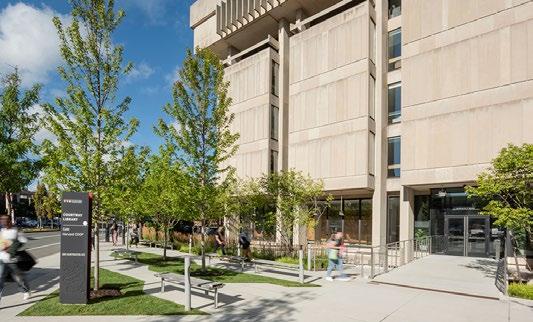
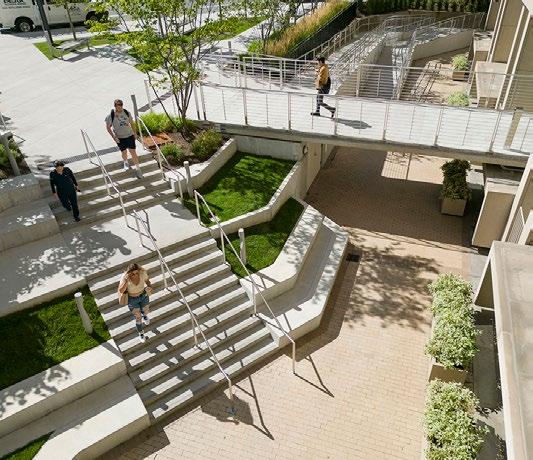
The Harvard Medical School Countway Library was my first project with full day-to-day responsibility as a project designer, from Schematic Design through Construction Administration. This smallscale intervention creates an accessible connection between a sunken Brutalist-era plaza and the street, 10 feet above, while transforming a street-level back-of-house space into a public plaza. Navigating complex elevation changes, irregular site conditions, and a tight budget tested our problem-solving skills.

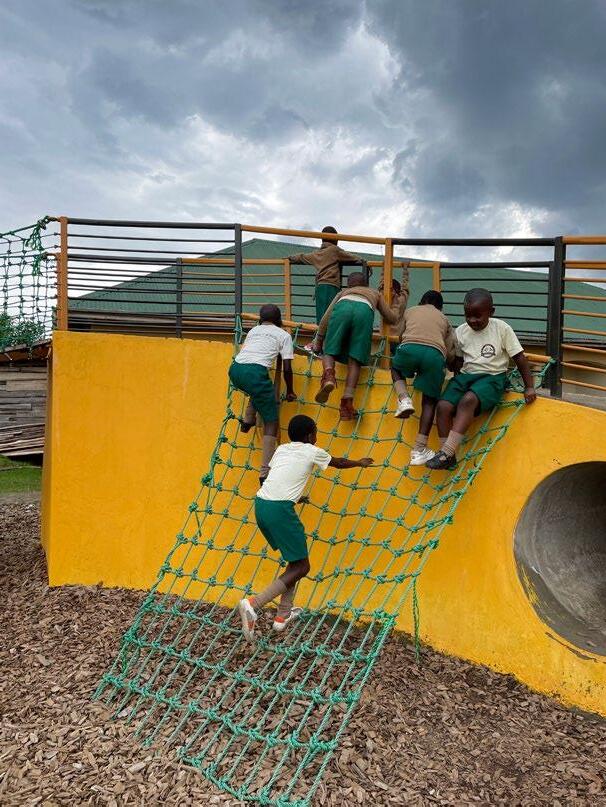
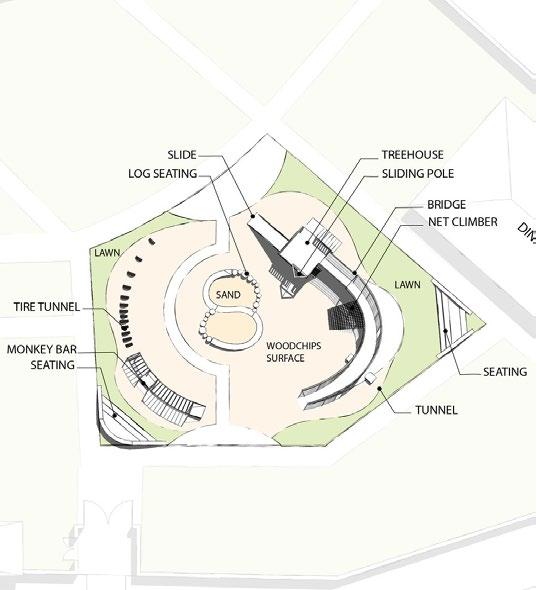
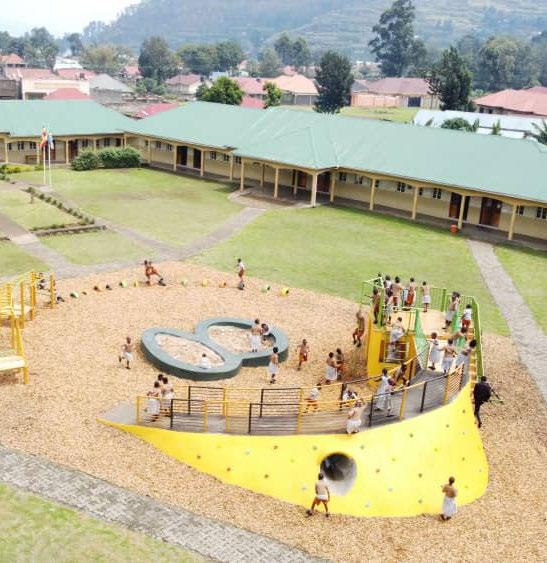
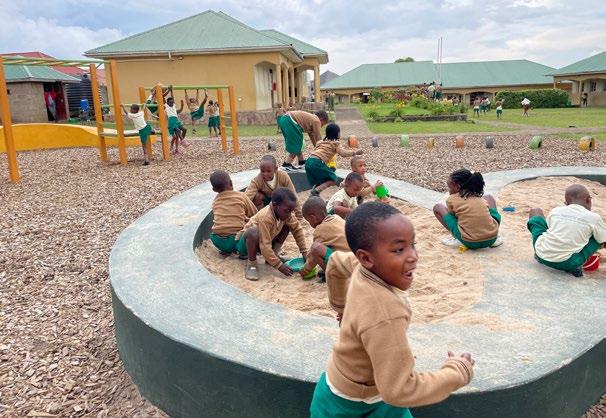
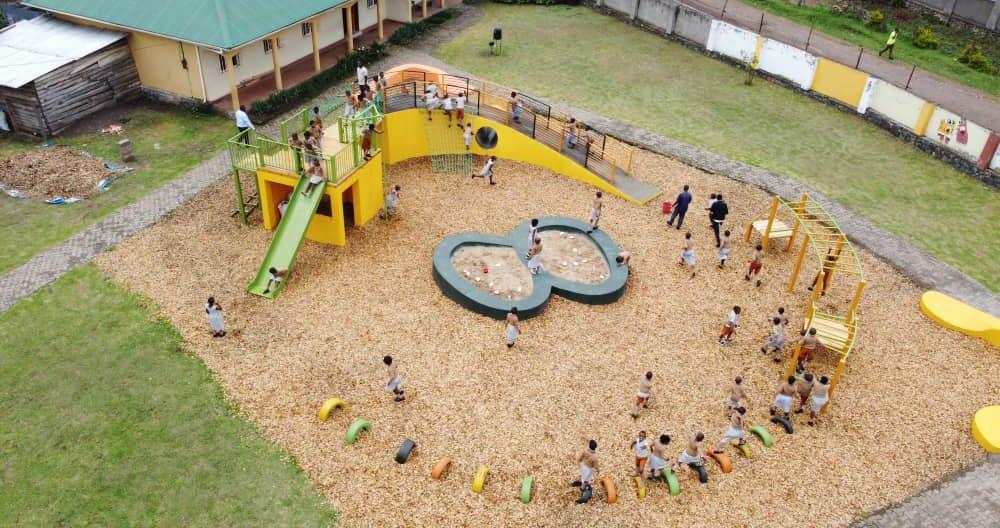
playground design for the Ineza Children’s Center, Kisoro, Uganda
professional - 2020-2022
Global Design Initiative for Refugee Children project scale: S M L XL volunteer designer on group project skills: community design, working with local builders, Rhino, Sketch up, Illustrator, Photoshop, hand drawing
The Ineza Children’s Centre is a non-profit that provides education and health services for local youth, with a focus on young girls. GDIRC was brought on after the original playground design exceeded the donor’s budget. With no local precedent for playgrounds and limited construction expertise, the project required close collaboration with the school principal and Foundation director. Together, we developed a cost-effective solution that met the school’s needs. The initial wooden playhouse—featuring a slide, fire pole, bridge, and ladder—was reimagined in steel and concrete to reduce costs and align with local building practices.
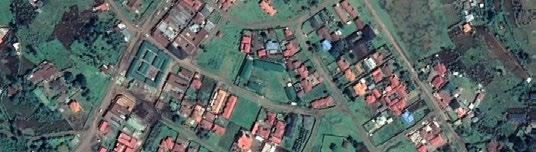
The project began at the very beginning of the COVID-19 pandemic. It was a challenge to remotely identify materials and construction techniques that would ensure safety while also providing an engaging and challenging play environment for the students.
Photos courtesy of GDIRC


GEOSPATIAL
academic - 2022
UPenn, Weitzman School of Design project scale: S M L XL group project skills: ArcGIS, R Studio predictive modeling
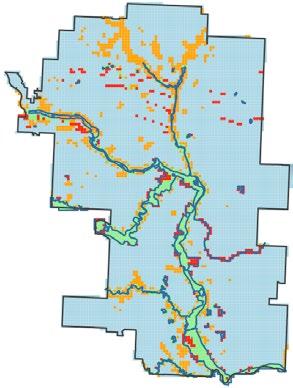
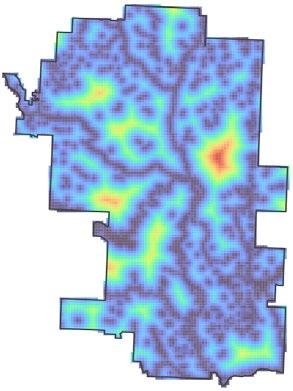
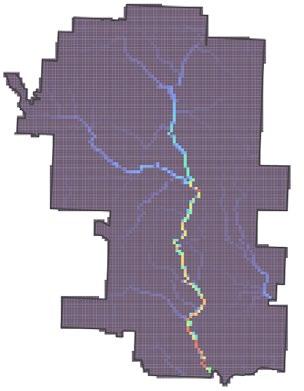
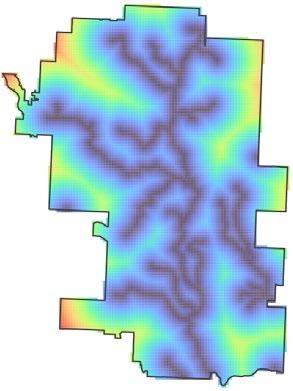
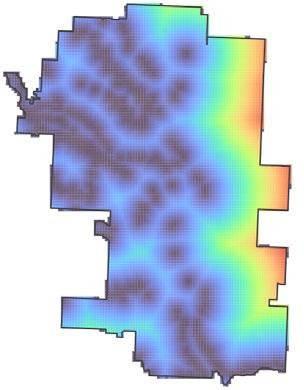
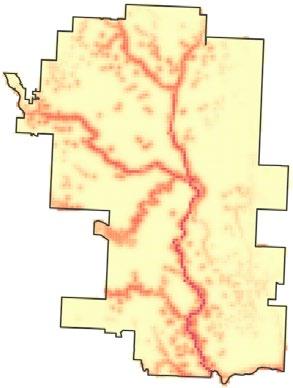
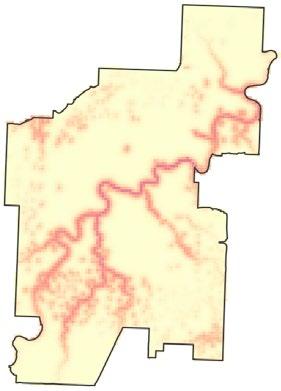
With climate change intensifying, the average 100-year floodplain in Canadian river cities is projected to expand by 45% by 2100. In 2013, Calgary experienced its worst flood since 1932, primarily due to heavy rainfall. For this project, we developed a binomial logistic regression model using data from the 2013 Calgary flood to predict inundation in comparable river cities. We tested the model’s accuracy using Edmonton as a case study.
To build the model, we used ArcGIS to convert raster data into fishnet grid cells and included six variables: (1) distance to all water bodies, (2) distance to stream network, (3) flow accumulation per cell, (4) distance to steep slopes, (5) slope classification (flat to very steep), and (6) percent impervious surface. The four most statistically significant features are shown to the right. We trained and validated the model in R, comparing predicted inundation with actual 2013 flood data. The model performed strongly, with an ROC curve area close to 1 and prediction scores clustering around 0.9—indicating high accuracy.
View the full code on my GitHub
# Building the Inundation Model calgary <calgary %>% select(-geometry) %>% mutate(slope_cat = as.factor(slope_cat))
set.seed(3456) #random set of numbers to replicate sample trainIndex <- createDataPartition(calgary$slope_cat, p = .70, list = FALSE, times = 1) #include all categorical variables as first arguments calgaryTrain <- calgary[ trainIndex,] calgaryTest <- calgary[-trainIndex,]
calgaryModel <- glm(inundation ~ ., family=“binomial”(link=“logit”), data = calgaryTrain %>% as.data.frame() %>% select(-geometry))
# Testing the Model classProbs <- predict(calgaryModel, calgaryTest, type=”response”) testProbs <- data.frame(obs = as.numeric(calgaryTest$inundation), pred = classProbs)
testProbs$predClass = ifelse(testProbs$pred > .25,1,0)
caret::confusionMatrix(reference = as.factor(testProbs$obs), data = as.factor(testProbs$predClass), positive = “1”)
# Training the Model auc(testProbs$obs, testProbs$pred)
ctrl <- trainControl(method = “cv”, number = 100, savePredictions = TRUE) cvFit <- train(as.factor(inundation) ~ ., data = calgary %>% as.data.frame() %>% select(-geometry, -slope_cat), #remove categorical variables method=”glm”, family=”binomial”, trControl = ctrl)
cvFit
allPredictions <predict(cvFit, calgary, type=”prob”)[,2] calgary <cbind(calgary,allPredictions) %>% mutate(allPredictions = round(allPredictions * 100))
#Plot Map with Inundation Predictions for Calgary calgary %>% ggplot()+ geom_sf(aes(fill = allPredictions), color = “transparent”, apha = 0.75)+ geom_sf(data=calgary_boundary, fill = “transparent”,

smart sensor installation prototype
academic - 2021
UPenn, Weitzman School of Design project scale: S M L XL group project skills: Arduino microcontroller, Illustrator, model making, prototyping
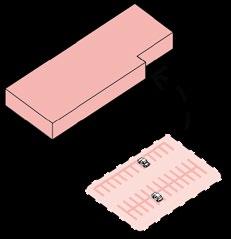
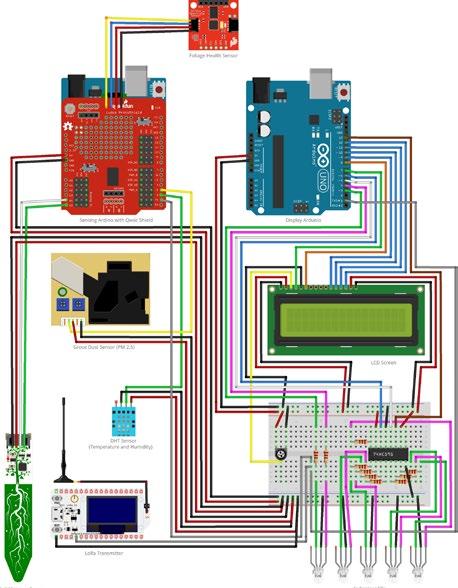
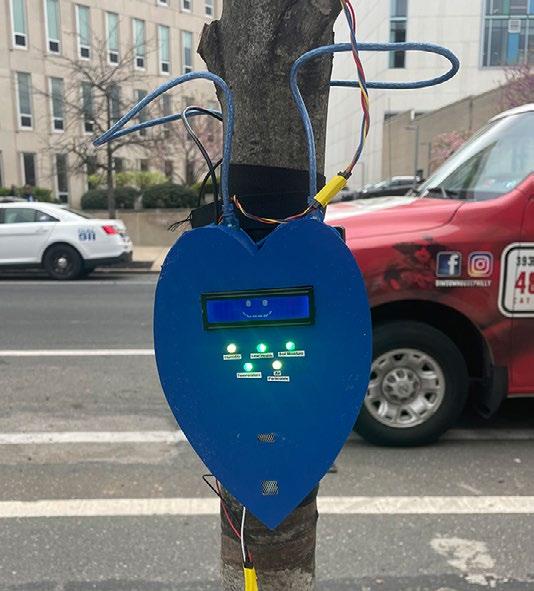
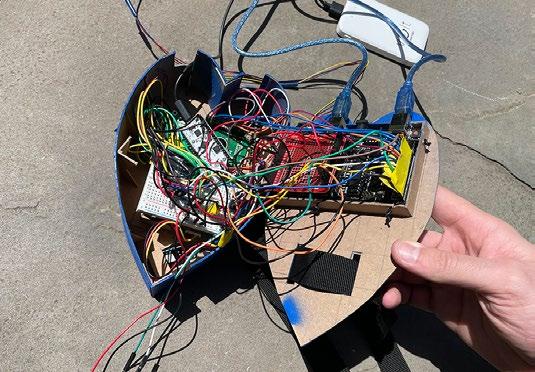
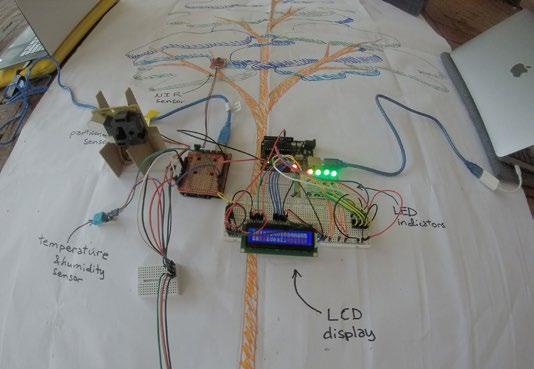
Improving street tree health often requires addressing systemic, city-wide issues, making localized action challenging. Yet public awareness, supported by detailed data, can help drive broader change. The Vitalitree Street Tree Health Monitor was developed to support this goal. The prototype uses an Arduino microcontroller and sensors to measure four of seven key health factors—such as heat stress and PM2.5 accumulation. These readings are aggregated into a weighted health score, transmitted via a LoRa network, and displayed on the monitor to communicate the tree’s condition in real time.
I assessed foliage health using a near-infrared sensor and NDVI (Normalized Difference Vegetation Index) analysis, designed the monitor’s physical form, and created the project graphics. In the adjacent diagram, icons shown at full opacity represent components included in the prototype.
To learn more about the project and see a video of the sensor in operation, click here. To follow a tutorial of how to use a near infrared sensor to determine foliage health, click here

void loop() { ndvi_sensor.takeMeasurements(); if (ndvi_sensor.getVersion() == SENSORTYPE_AS7263) { NDVI_est = NDVI_eq(sensor.getCalibratedV(), sensor.getCalibratedS()); //run NDVI equation function with S (680 nm) & V (810 nm) wavelength readings if (( NDVI_est > 0.2) && (NDVI_est < 0.8)) { Serial.println(“HEALTHY”); digitalWrite(GREEN, HIGH); //turn on green LED } else { Serial.println(“UNHEALTHY”); digitalWrite(RED, HIGH); //turn on red LED }
capread = constrain(capread, 0, 999);
Serial.print(“<”);
Serial.print(DHT.temperature);
Serial.print(“,”);
Serial.print(DHT.humidity);
Serial.print(“,”); Serial.print(concentration);
Serial.print(“,”);
Serial.print(capread); Serial.print(“,”);
Serial.print(NDVI_est); Serial.print(“>”);
delay(5000); //create 5 second delay between readings }
float NDVI_eq(float a, float b) { //create function for NDVI equation float result; result = (a-b)/(a+b); return result;
code sample operational diagram

professional - 2023-2024
freelance project scale: S M L XL
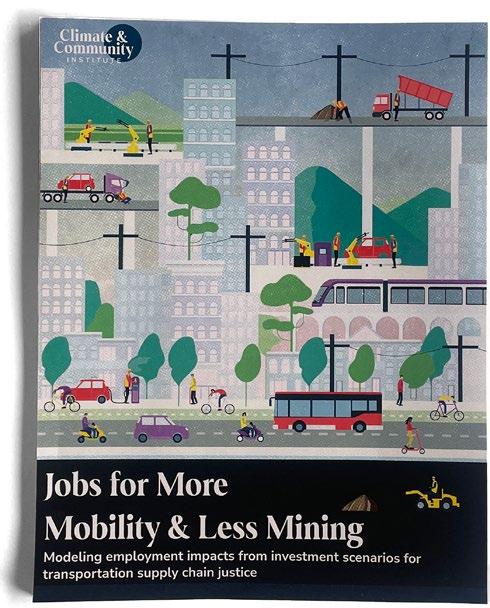
skills: Illustrator, Photoshop, InDesign, graphic design, copy editing graphic design to amplify climate action and social advocacy
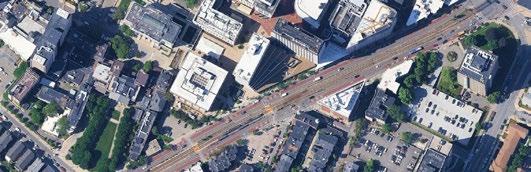
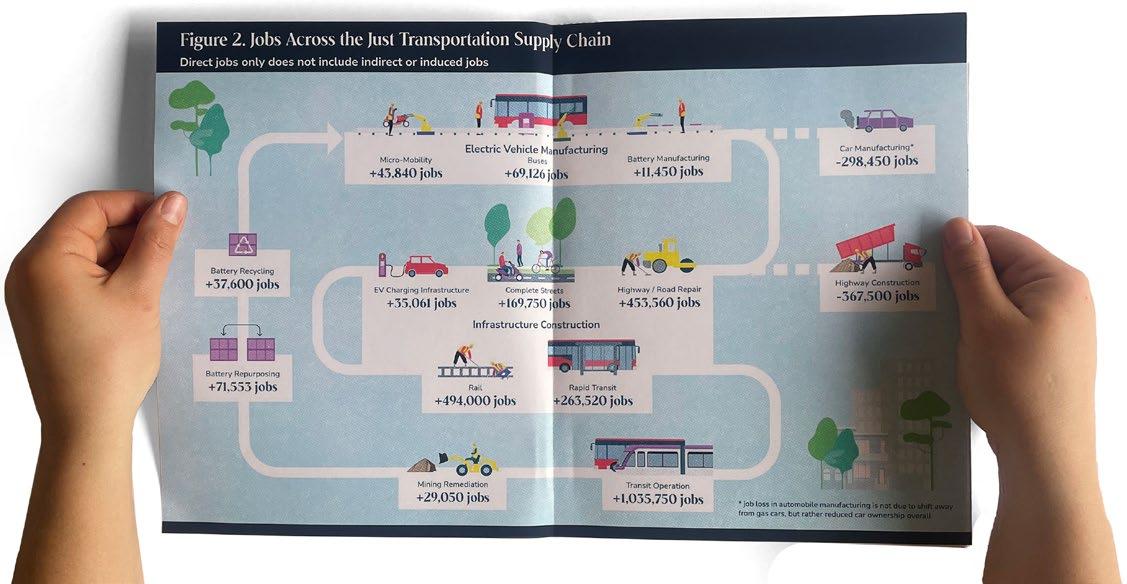
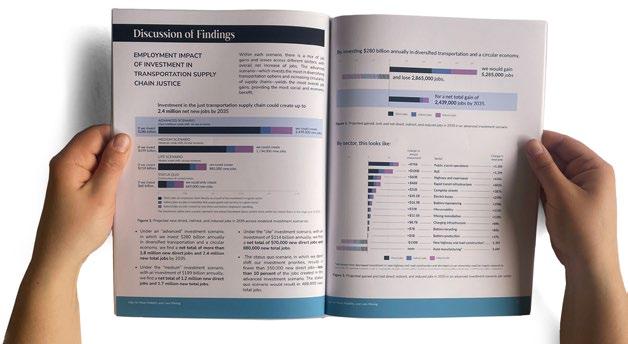
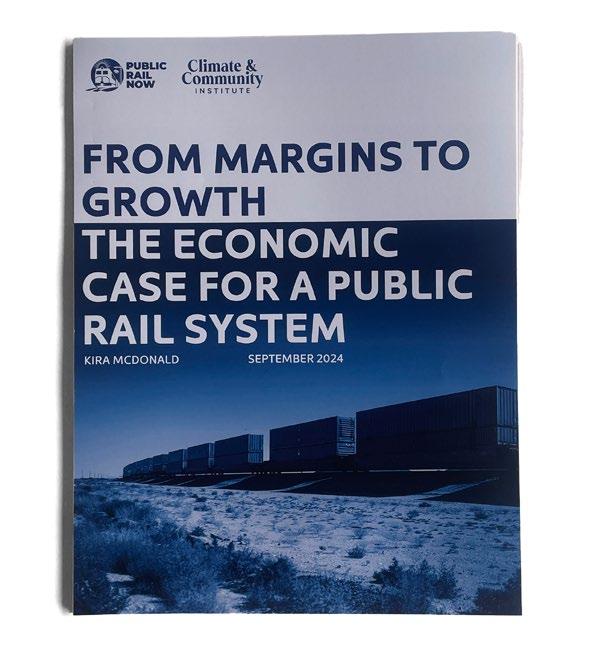
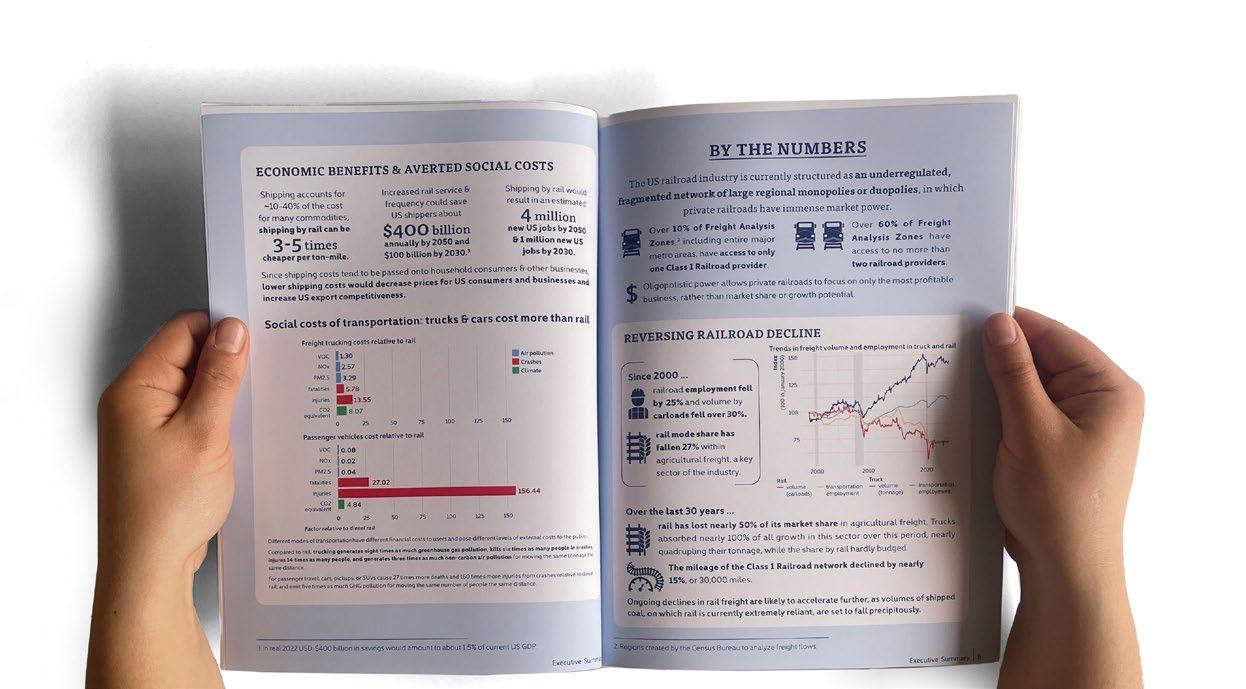
Clear and engaging visual communication is essential for translating complex data into accessible narratives that resonate with the public and influence policymakers. The two reports featured here focus on advancing a transportation system within the US that supports both economic resilience and climate stability. The first report models how a diversified, pro-worker, pro-community transportation system could generate jobs across the supply chain—revealing the broader economic and social gains of transitioning away from a car-dominated, electricvehicle-only future. The second, in partnership with Rail Workers United, examined the economic advantages of transitioning rail network ownership from private corporations to public hands.
In both cases, I developed a clear and accessible visual language to communicate complex economic modeling outputs. The graphics support the white papers’ detailed content by making technical insights more digestible. Through this work I am able to apply my design skillset to meaningful climate policy work that aligns with my values and commitment to environmental justice.
Read the reports on the Climate & Community Institute’s website, here and here
Natural Infrastructure Innovation Project (NIIP)
professional - 2024-present EMLab
project scale: S M L XL
skills: Illustrator, Photoshop, InDesign, graphic design, copy editing
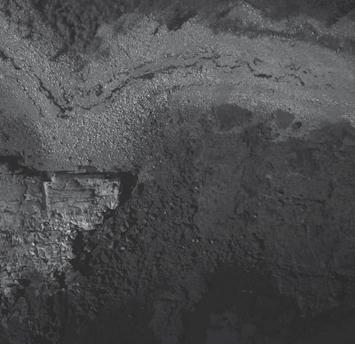
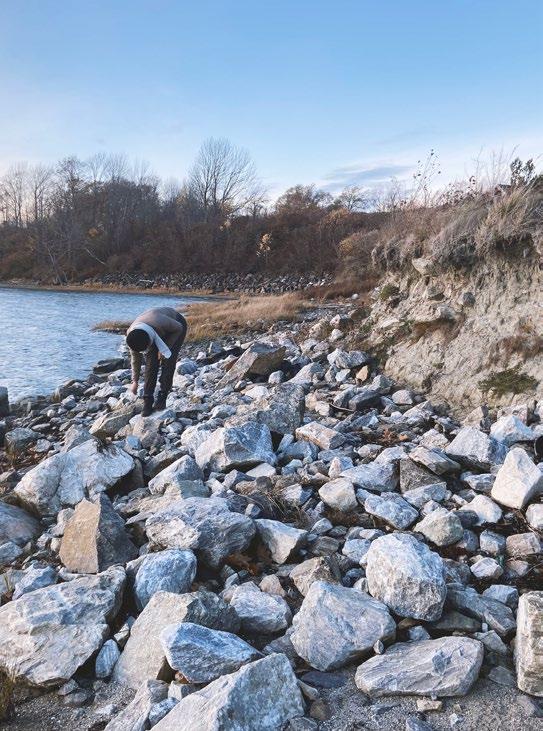
In collaboration with NIL at the University of Virginia and LIDL at Auburn University, we are developing place-specific natural infrastructure designs to enhance coastal resilience along the Atlantic Coast. Our approach draws from the analysis of successful, well-performing coastal landforms to create innovative strategies for sites experiencing or vulnerable to climate impacts.
The process begins by identifying both exemplary and at-risk coastal locations.. To determine these locations, we employ a combination of spatial suitability analysis and detailed site assessments. Spatial suitability involves evaluating factors such as (1) hazard exposure, (2) biodiversity value, and (3) public accessibility to identify areas with the highest potential for effective intervention based on the triple bottom line. Our suitability metrics are informed by a cross-disciplinary literature review, including ecology, hazard risk management, environmental engineering and geo-spatial analytics. In parallel, we are conducting site visits to understand on-the-ground conditions, understand the landscape’s texture and engage with local experts. This approach aim to meet the triple bottom line of economic, environmental, and social benefits. Learn more about the project here
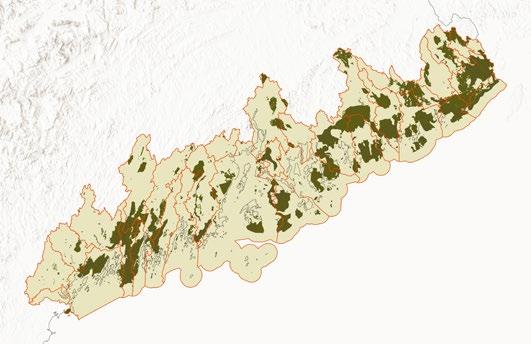
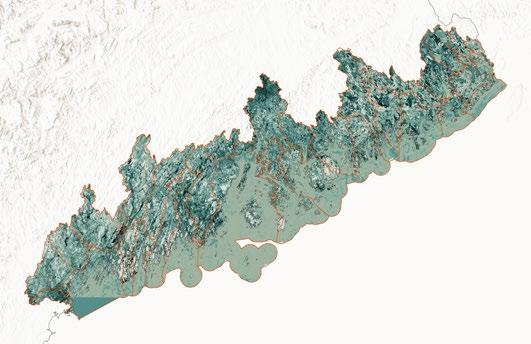

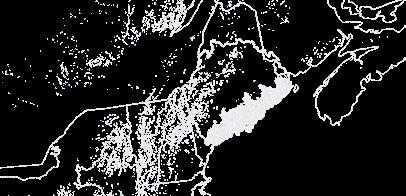
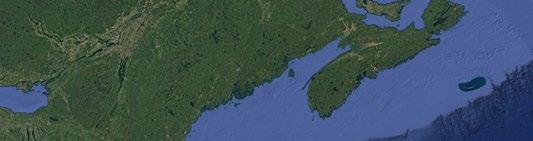
watershed suitability analysis for the Maine Drowned River


professional - 2023-present EMLab
project scale: S M L XL
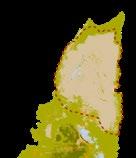
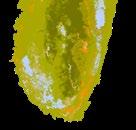
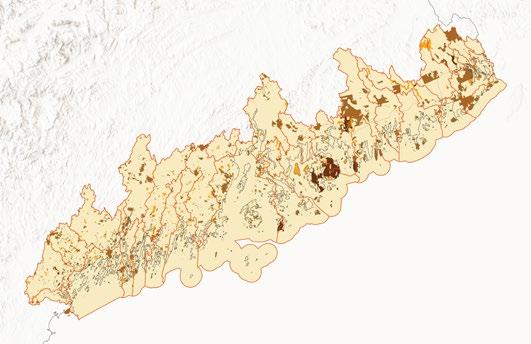
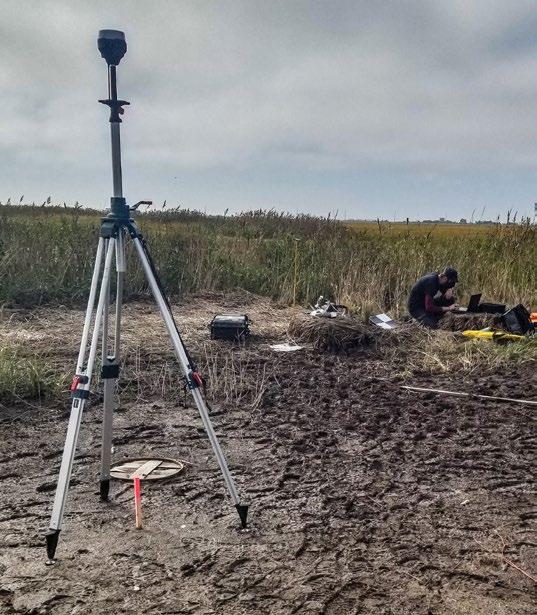
skills: ArcGIS, modelbuilder, python, UAV monitoring, ground truthing, land surveying wetland land cover change monitoring
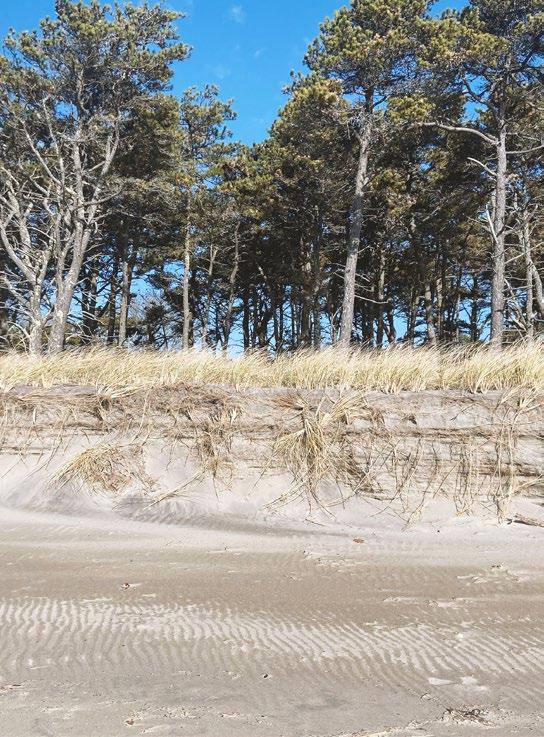
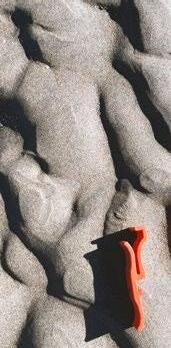
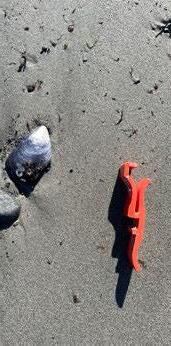
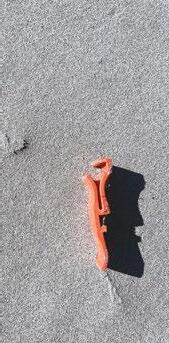
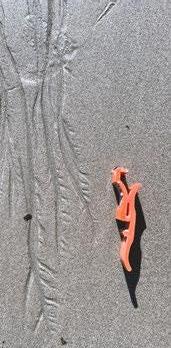
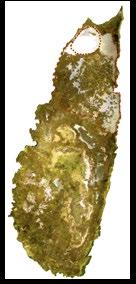
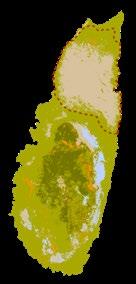
Coastlines are retreating upland faster than at any time in recorded history. As dunes erode and coastal marshes vanish, the urgency for adaptive strategies along the littoral edge grows. In response, the U.S. Army Corps of Engineers (USACE) has placed increasing emphasis on experimental sediment placement techniques to restore and stabilize these vulnerable wetlands. The success of these interventions depends on careful monitoring and analysis.
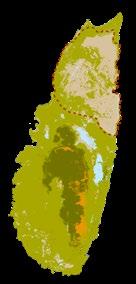
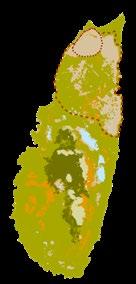
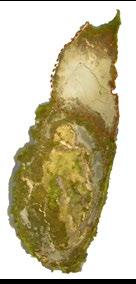
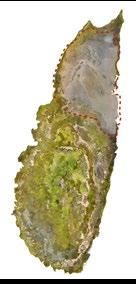
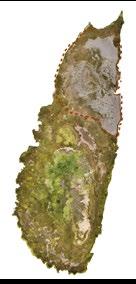
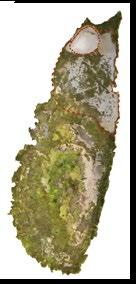
To support this effort, the EMLab is partnering with The Wetlands Institute and USACE to monitor an active sediment placement site on Sturgeon Island, located in New Jersey’s Great Sound Bay. As an experimental marsh nourishment project, Sturgeon Island serves as a testing ground for understanding the long-term impacts of sediment addition. Our team is using a fleet of unmanned aerial vehicles (UAVs) to collect high-resolution multispectral imagery and LiDAR data. We process this data using a custom land cover classification system, developed in collaboration with The Wetlands Institute, and analyze it to calculate landscape metrics that reveal how the island’s ecology and form are shifting over time and in response to the sediment placement.
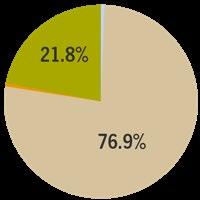
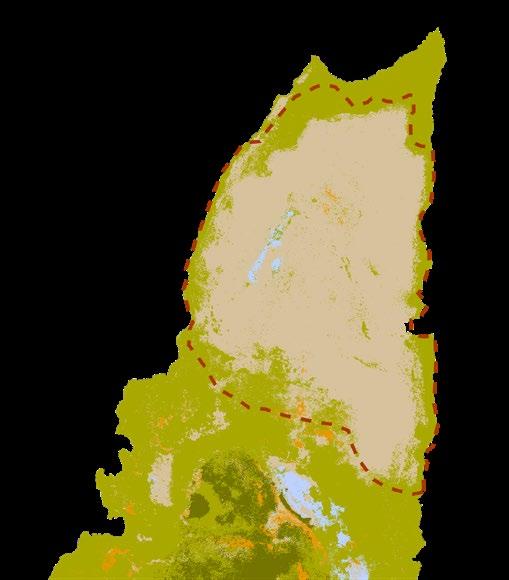
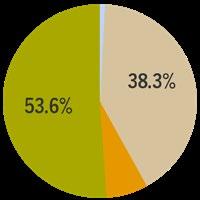
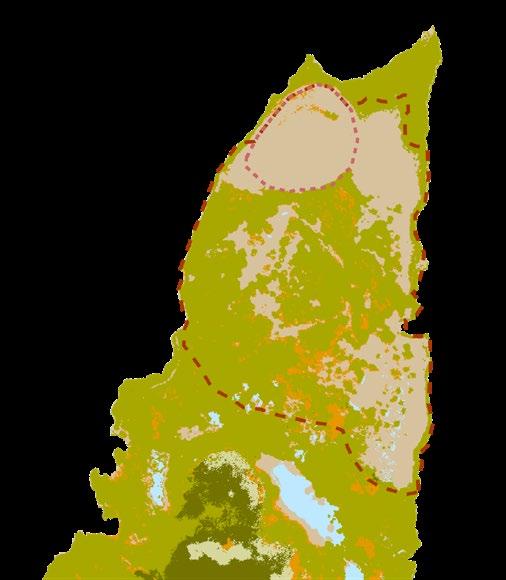
custom land cover classification generated from UAV-collected imagery
area of focus