May 2023


May 2023
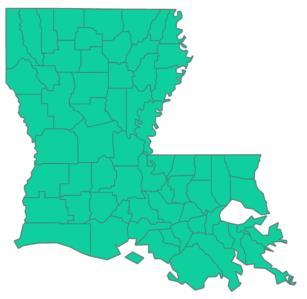
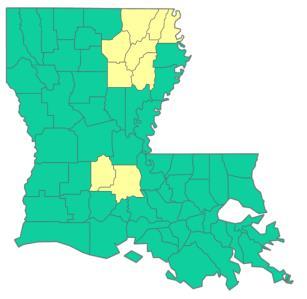
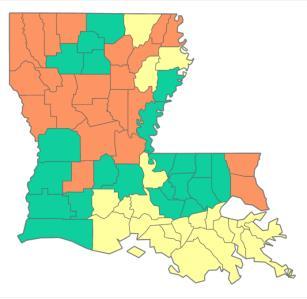
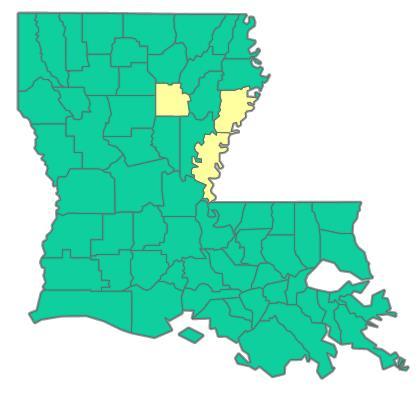
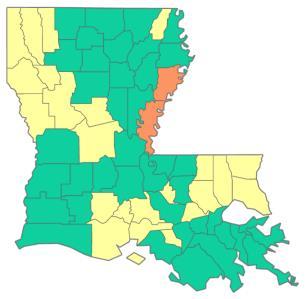
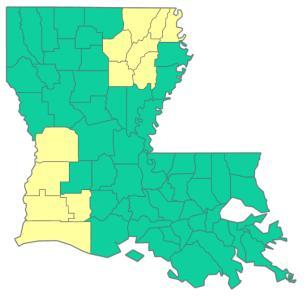
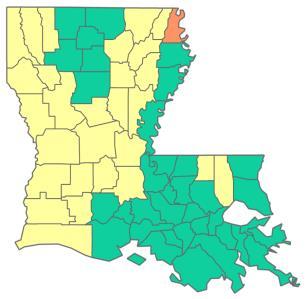
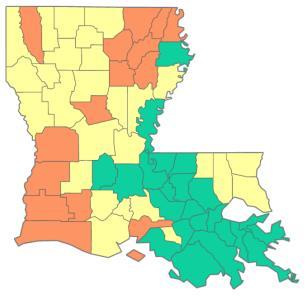
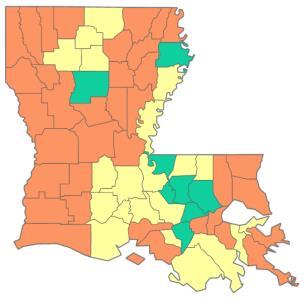
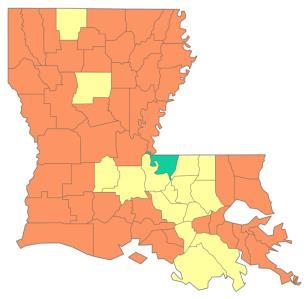
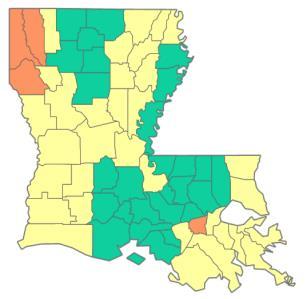
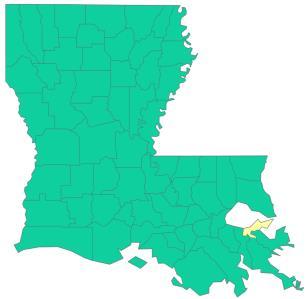
With the World Health Organization’s declaration of the end of the Covid-19 global public emergency, the CENLA Economic Dashboard will no longer provide Covid updates.As shown in the final update, all sections of the state are at the lowest level of risk.
According to preliminary data, employment remains robust in central Louisiana. Employment in the Alexandria labor market in March rose for the second straight month, rising to 63,532 or 1,164 above January’s level.

Employment in Natchitoches reached a post-pandemic high at 16,439. The unemployment rate fell to 3.0% in the Alexandria MSA and 3.7% in Natchitoches. Baton Rouge now has the lowest unemployment rate in the state, a position held byAlexandria throughout the pandemic. The unemployment rate for central Louisiana in March was 3.5%, compared to the state unemployment rate of 3.3%. The rate in Grant andAvoyelles was 3.1% and 3.8%, respectively, with LaSalle having the lowest in the region at 2.6%.
The labor market in theAlexandria MSA remains the tightest in the state with three job postings for each unemployed. The state ratio was 0.53 in March, meaning there were two posting for every unemployed.
Both initial and continued unemployment claims are higher than a year ago. Initial claims are up 3% from April 2022, while continued claims are up 11%.
Permit valuation data has been reorganized into a single page to provide a better overview of permits in Cenla. In the first four months of 2023, valuation of construction permits in Central Louisiana are down -31%. Permits year-to-date are down in all reporting jurisdictions except the City of Natchitoches with a 4% increase. Decreases range for -7% in Rapides to -54% inAvoyelles.
In March, consumer spending in central Louisiana remained strong as measured by sales tax revenue collected in April. On a month-over-month basis, every jurisdiction in central Louisiana saw increased sales in March with increases ranging from 20% in Evangeline to 103% in LaSalle. Likewise, consumer spending in every jurisdiction is ahead on a year-to-date basis, except Avoyelles and Evangeline.
Vehicle sales were up substantially in March compared to February in every parish reporting. The increase ranged from a low of 26-27% inAvoyelles, Evangeline, and Vernon to a high of 36-39% in Rapides and St. Landry. Natchitoches reported an increase of 43%. However, data for Natchitoches runs a month behind the rest of central Louisiana. So it reflects sales in February, not March.
Online consumer spending in central Louisiana slowed in March, according to collections inApril.Although spending was up 6% from the previous month, it fell -2% below last year’s level. Year-to-date, however, online spending continues to increase. In the first four months of 2023, online sales tax revenues were $7.2 million, compared to $6.1 million in 2022 and $5.5 million in 2021.
May 2023
Higher mortgage rates continue to put pressure on the housing market, but the prospect of even higher rates has spurred buying in some areas. The 30 year fixed mortgage rate remained elevated in March andApril, reaching a peak of 6.73% on March 9th. The weakness in the housing market continues to impact lumber prices. The US Lumber Price Index fell one percent in March andApril, and now stands -32% below last year’s level.
Home prices remain robust, despite rising interest rates. The median listing price in Natchitoches reached $310,000 in April, while the number of days on the market fell from 95 to 59. The median and average listing prices were up inApril in all local metro areas.
Gasoline prices in the Gulf Coast region were up 9% inApril compared to March, but remain -14% below a year ago. All four parishes reporting hotel occupancy data were up inApril compared to March. For the year, Natchitoches and Vernon were up 24% and 27%, respectively.
New business applications in Louisiana inApril fell -11% compared toApril 2022 and are down -6% so far this year compared to 2022. In Rapides, new business applications are down -3% compared toApril 2022 and -1% year-to-date compared to last year.
 Central Louisiana Economic Dashboard
COVID-19 statewide risk captured mid-month by parish from April 2022 – May 2023.
 Central Louisiana Economic Dashboard
Employed persons in the Alexandria MSA from 2020 – 2023.
Employed Persons in Alexandria, LA MSA 2020 -
2023
64,000
63,000
62,000
61,000
60,000
59,000
58,000
✓Employment in March rose for the second straight month, rising to 63,532 or 1,164 above January’s level. ✓March 2023 employment was up 0.5% above a year ago. 56,000
65,000 2020-02-012020-05-012020-08-012020-11-012021-02-012021-05-012021-08-012021-11-012022-02-012022-05-012022-08-012022-11-012023-02-01
57,000
Employed persons in Natchitoches parish from 2020 – 2023.
✓In March 2023, 16,439 were employed in Natchitoches parish, according to preliminary data. ✓Employment set a postCovid high in March, topping the previous record of 16,315 in May 2022.
The unemployment rate in Natchitoches parish in March was 3.7%, falling from 4.2% in January.
Source: Louisiana Workforce Commission, May 8, 2023
The table below shows March 2023 unemployment rate, labor force, and employment data for Metropolitan Statistical Areas in the state.
✓At 2.9%, the Baton Rouge MSAhad the lowest unemployment rate in the state in March. ▪ Alexandria, HoumaThibodaux, and Lake Charles tied for second with a 3.0% unemployment rate.
✓Louisiana’s unemployment rate in March was 3.3%, down from 3.6% in January.
Data Source: Louisiana Workforce Commission, May 8, 2023.
March 2023
The table below shows March 2023 unemployment rate, labor force, and employment data for central Louisiana parishes.
2023
In March 2023, the parishes in central Louisiana had an unemployment rate of 3.5%, down from 4.0% in January 2023 and above the state unemployment rate of 3.3%
Data Source: Louisiana Workforce Commission, May 8, 2023.
Initial and continued unemployment claims in Louisiana from January 2022 to April 2023.


✓Initial unemployment claims fell -2% in March, but rose 6% inApril.
✓Continued unemployment fell -6% in March and -1% in April.
▪ Both initial and continued unemployment claims are higher than a year ago. Initial claims are up 3% fromApril 2022 while continued claims are up 11%.
Source: Louisiana Workforce Commission, May 8, 2023
Unemployment Claims in Louisiana 2022 - 2023
The table below shows the number of unemployed, number of advertised jobs online, and the ratio of unemployed to advertised job openings online for Metropolitan Statistical Areas in Louisiana in March 2023.
In March 2023, the Alexandria MSAlabor market had a job posting ratio of 0.33. The ratio shows there were three postings for each unemployed.
Alexandria remains the tightest labor market in the state. However, Lafayette is not far behind.
The state ratio was 0.53 in March, meaning there were two posting for every unemployed.
March 2023
Central Louisiana Economic Dashboard
An overview of sales, vehicle sales, and hotel occupancy taxes collected in the April 2023 reflecting sales activity in the previous month, unless otherwise noted.
Notes: Current month tax revenue collection reflects sales activity in the previous month.
N/a = Not available
Data Source noted in detailed reports.
*Current month data are not available. Represents prior month.
An overview of sales tax revenue collected in Ball and Woodworth from 2021 - 2023.
Note: Current tax revenue reflects sales activity in prior month.
Data Source: Rapides Parish Police Jury Treasurer’s Reports, May 2023.

(TR) Alexandria total sales tax revenue collected in the most recent month with previous month, year, and YTD comparisons.
(BR) Alexandria total monthly sales tax revenue from 2021 to present.
Note: Current month sales tax revenue reflects sales activity in previous month.
Data Source: Rapides Parish Police Jury Treasurer’s Reports, May 2023.
Avoyelles Parish total sales tax revenue collected in the most recent month with previous month, year, and year-todate comparisons. Vehicle and hotel tax revenues are excluded.
Note: Current sales tax revenue reflects sales activity in the prior month.
Data Source: Avoyelles Parish School Board. May 2023.
Avoyelles Parish vehicle sales tax revenue collected in the most recent month with previous month, year, and year-to-date comparisons.
Note: Current sales tax revenue reflects sales activity in the prior month.
Data Source: Avoyelles Parish School Board. May 2023
Catahoula Parish total sales tax revenue collected in the most recent month with previous month, year, and year-to-date comparisons.
Note: Current month sales tax revenue reflects sales activity in the prior month.
Data Source: Catahoula Parish Tax Administrator, May 2023
Concordia Parish total sales tax revenue collected in the most recent month with previous month, year, and year-to-date comparisons.
Note: Current month sales tax revenue reflects sales activity in the prior month.
Data Source: Concordia Parish Tax Administrator. May 2023
Evangeline Parish total sales tax revenue collected in the most recent month with previous month, year and YTD comparisons.
Note: Current sales tax revenue reflects sales activity in prior month. Evangeline implemented a 1% sales tax increase July 1, 2021.
Data Source: Evangeline Parish Sales Tax Commissioner. May 2023
Evangeline Parish vehicle sales tax revenue collected in the most recent month with previous month, year and YTD comparisons.
Note: Current sales tax revenue reflects sales activity in prior month. Evangeline implemented a 1% sales tax increase July 1, 2021.
Data Source: Evangeline Parish Sales Tax Commissioner. May 2023
(TR) Grant sales tax revenue collected in the most recent month with previous month, year, and YTD comparisons.
(BR) Grant monthly sales tax revenue from 2021 to present.
Note: Current sales tax revenue reflects sales activity in prior month.
Data Source: Grant Parish Sheriff’s Office, May 2023.
La Salle Parish total sales tax revenue collected in the most recent month with previous month, year, and year-to-date comparisons.
Note: Current month sales tax revenue reflects sales activity in the previous month.
Data Source: La Salle Parish Tax Administrator, May 2023
(TR) Natchitoches sales tax revenue collected in the most recent month with previous month, year, and YTD comparisons.
(BR) Natchitoches monthly sales tax revenue from 2021 to present.
Note: Current month sales tax revenue collections reflects sales activity in the prior month.
Data Source: Natchitoches Parish Tax Commission, May 2023.
(TR) Natchitoches vehicle sales tax revenue collected in February and March with previous month, year, and YTD comparisons.
(BR) Natchitoches monthly vehicle sales tax revenue from 2021 to present.
Note: Current sales tax revenue collections reflects sales activity in the prior month. *April 2023 vehicle sales tax revenue was not available at time of publication.
Data Source: Natchitoches Parish Tax Commission, May 2023.
(TR) Pineville sales tax revenue collected in the most recent month with previous month, year, and YTD comparisons.
(BR) Pineville monthly sales tax revenue from 2021 to present.
Note: Current month sales tax revenue reflects sales activity in the prior month.
Data Source: Rapides Parish Police Jury Treasurer’s Reports, May 2023.
(TR) Rapides Parish sales tax revenue collected in the most recent month with previous month, year, and YTD comparisons.
(BR) Rapides monthly sales tax revenue from 2021 to present.
Note: Current sales tax revenue reflects sales activity in the prior month.
Data Source: Rapides Parish Police Jury Treasurer’s Reports, May 2023.
Rapides Parish vehicle sales tax revenue collected in the most recent month with previous month, year, and YTD comparisons.
Note: Current sales tax revenue reflects sales activity in the prior month.
Data Source: Rapides Parish Police Jury Treasurer’s Reports, May 2023.
St. Landry Parish sales tax revenue collected in the most recent month with previous month, year, and YTD comparisons.
Note: Current sales tax revenue collection reflects sales activity in prior month.
Data Source: Tax revenue data from St. Landry Parish School Board. May 2023
St. Landry Parish vehicle sales tax revenue collected in the most recent month with previous month, year, and YTD comparisons.
Note: Current sales tax revenue reflects sales activity in prior month.
Data Source: Tax revenue data from St. Landry Parish School Board. May 2023
Vernon Parish sales tax revenue collected in the most recent month with previous month, year, and year-to-date comparisons.
Data Source: Vernon Parish Sales Tax Department. May 2023.
Vernon Parish vehicle tax revenue collected in the most recent month with previous month, year, and year-to-date comparisons.
Data Source: Vernon Parish Sales Tax Department. May 2023.
Remote sellers tax revenue by parish with month-over-month, year-over-year, and year-to-date comparisons.
Total online sales tax revenue in Cenla in April 2023 was up 6% from March, but down -2% fromApril 2022. ✓Online sales in Cenla during the first four months of 2023 were up 17% compared to the same period in 2022.
Note: Sales tax revenue collected in the current month reflects sales activity in the prior month.
Data Source: Louisiana Sales and Use Tax Commission for Remote Sellers.August 2020 –April 2023

Remote seller tax revenue is tax revenue from online sales by location of the seller at the time of purchase.
SinceAugust 2020 when remote sellers tax revenue collection started, $50 million in sales tax revenue have been collected from online sales in central Louisiana.
Since the start of the remote sellers collections, Rapides has collected $15.3 million in tax revenues, Vernon $5.8 million, Natchitoches $3.9 million, Evangeline $3.7 million, andAvoyelles $3.4 million.
Note: Sales tax revenue collected in the current month reflects sales activity in the prior month.
Data Source: Louisiana Sales and Use Tax Commission for Remote Sellers.August 2020 –April 2023
Remote sellers tax revenue from online sales in Evangeline Parish from August 2020 – April 2023.
Note: Sales tax revenue collected in the current month reflects sales activity in the prior month.
Data Source: Louisiana Sales and Use Tax Commission for Remote Sellers.August 2020 –April 2023

Remote sellers tax revenue from online sales in Natchitoches Parish from August 2020 – April 2023.
Note: Sales tax revenue collected in the current month reflects sales activity in the prior month.
Data Source: Louisiana Sales and Use Tax Commission for Remote Sellers.August 2020 –April 2023

Remote sellers tax revenue from online sales in Rapides Parish from August 2020 – April 2023.
Note: Sales tax revenue collected in the current month reflects sales activity in the prior month.
Data Source: Louisiana Sales and Use Tax Commission for Remote Sellers.August 2020 –April 2023
 Central Louisiana Economic Dashboard
This table shows the valuation of permits issued in March and April 2023 for select jurisdictions of Rapides Area Planning Commission, the City of Alexandria, the City of Natchitoches, and Natchitoches Parish with month-tomonth, year-to-year, and year-to-date comparisons. April
Note: N/A= not available.
Data Source: RapidesArea Planning Commission, City ofAlexandria, Natchitoches, Natchitoches Parish, May 2023.
30-Year Fixed Rate Mortgage Average in the United States from 1971 – 2023 and from 2021 – 2023.
▪ 30 year fixed mortgage rates on May 18, 2023 was 6.39%.
Data Source: Fed Reserve Economic Database, St. Louis Federal Reserve Bank, May 20, 2023.
The chart represents the Lumber Price Index in the U.S. from January 2020 – April 2023.
Monthly Price Index of Lumber 2020-2023
450
400
500 Price Index (1982=100)
▪ InApril 2023, the US Lumber Price Index fell -1% from March. 250
Currently, the Lumber Index stands -32% below a year ago when it stood at 385. 300
350
The count of active single-family and condo/townhome listings from January 2020- April 2023 for Alexandria, Fort Polk (Leesville), Natchitoches, and Opelousas.
The median number of days property listings spend on the market from January 2020 – April 2023 for Alexandria, Fort Polk (Leesville), Natchitoches, and Opelousas.
The median listing price of houses from January 2020 - April 2023 for Alexandria, Fort Polk (Leesville), Natchitoches, and Opelousas.
The average listing price of houses from January 2020 - April 2023 for Alexandria, Fort Polk (Leesville), Natchitoches, and Opelousas.
Central Louisiana Economic Dashboard
Avoyelles Parish hotel occupancy tax revenue with previous month, year, and year-to-date comparisons.
Note: Current tax revenue reflects hotel occupancy activity in the prior month. Hotel occupancy tax revenue is used as a proxy for hotel occupancy rate.
Data Source: Avoyelles Parish School Board. May 2023.
Natchitoches Parish hotel occupancy tax revenue with previous month, year, and YTD comparisons.
Note: Current tax revenue reflects hotel occupancy activity in the prior month. Hotel occupancy tax revenue is used as a proxy for hotel occupancy rate.
Data Source: Natchitoches Parish Tax Administrator, May 2023.
Rapides Parish hotel occupancy tax revenue for March and April with previous month, year, and YTD comparisons.
Note: Current tax revenue reflects hotel occupancy activity in the prior month. Hotel occupancy tax revenue is used as a proxy for hotel occupancy rate.
Data Source: Rapides Parish Police Jury Treasurer’s Reports, May 2023.
Vernon Parish hotel, motel, and RV occupancy tax revenue for March and April with previous month, year, and year-to-date comparisons.
Note: Current tax revenue collection reflects hotel occupancy activity in the prior month. Hotel occupancy tax revenue is used as a proxy for hotel occupancy rate.
Data Source: Vernon Parish Sales Tax Department. May 2023.
Weekly retail price of gasoline in the Gulf Coast region for all formulations from 2020 – 2023. Data Source: U.S. Energy Information Administration, Prices,

April 2023 average retail gasoline price in Gulf Coast region was $3.24/gal., up $0.26 from March, but down $0.53 fromApril 2022.
Central Louisiana Economic Dashboard
The chart below represents the monthly number of new businesses applications in Louisiana from 2021-2023 (seasonally adjusted).
Note: Data reflects businesses applications, not necessarily business formations.
Data Source: U.S. Census Bureau, Business Formation Statistics, Retrieved May 17, 2023.
The chart below represent the number of new businesses established each month in Rapides from January 2021 through April 2023.

The number of new businesses established in Rapides inApril 2023 decreased -14% from March and was -3% lower than a year ago.
Year-to-date, 164 new businesses have been created in Rapides in 2023, compared to 165 last year.
Note: Data reflects businesses established in the current month.
Data Source: Rapides Parish Sales and Use Tax Department, May 2023.
The Coincident Economic Activity Index for Louisiana is set to match the trend in the gross state product and includes four indicators: nonfarm payroll employment, the unemployment rate, average hours worked in manufacturing and wages and salaries. The column graph below represents the percentage change in the index. A positive percentage represents an expanding statewide economy.
In March and April 2023, the Index rose 0.35% and 0.26% respectively. The Federal Reserve Bank of Philadelphia recalibrated the index recently.
The Index is up 1.9% since March 2022.
Represents the number of drilling rigs actively exploring for or developing oil or natural gas in Louisiana and the U.S. in 2020-2023.


Average rig count in Louisiana in April was down one rig from March but up 4 rigs from a year ago, an increase of 7%.
Nationwide, the rig count rose from 690 a year ago to 752 inApril 2023, an increase of 9%.
Source: Baker Hughes, https://rigcount.bakerhughes.com/na-rig-count, May 17, 2023
Gaming revenue in Louisiana for April 2023 with previous month and year comparisons.
April 2023
* Note: Year-to-Date percentage reflects calendar year.
Data Source: Louisiana Gaming Control Board, May 19, 2023. http://lgcb.dps.louisiana.gov/revenue_reports.html
The data presented throughout the CENLA Economic Dashboard reflects contributions from the following local organizations.
Also, special thanks to the following partners for distributing the dashboard.
• Rapides Parish Policy Jury Treasurer
• Rapides Sales TaxAdministrator
• Avoyelles Parish School Board
• Alexandria International Airport
• Alexandria / Pineville Area CVB
• RapidesArea Planning Commission
• City ofAlexandria Planning Division
• Evangeline Parish Sales Tax Commissioner
• Concordia, Catahoula, & La Salle TaxAdministrator
• Louisiana Office of Public Health
• St. Landry Parish School Board
• Grant Parish Sheriff’s Office
• Natchitoches Parish Tax Commission
• Natchitoches Parish Planning and Zoning
• City of Natchitoches Planning
• Vernon Parish Sales Tax Department
• LSUAFoundation
• Central Louisiana Regional Chamber of Commerce
• Marksville Chamber of Commerce
• Bunkie Chamber of Commerce
• Evangeline Chamber of Commerce
• Concordia Chamber of Commerce
• Greater Vernon Chamber of Commerce
• Natchitoches Chamber of Commerce
• Next Issue: Week of July 24, 2023
To subscribe to new releases, email rdupont@lsua.edu.
Current and past issues of the CENLAEconomic Dashboard can be found at http://www.lsua.edu/coronavirus/cenla-economic-dashboard/