March 2023


March 2023
March 2023
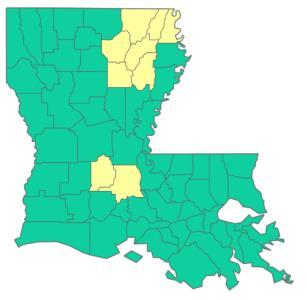
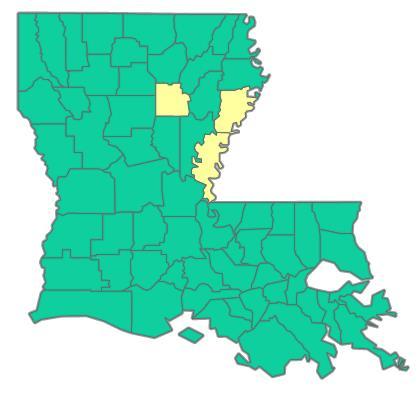
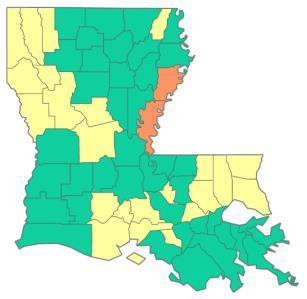
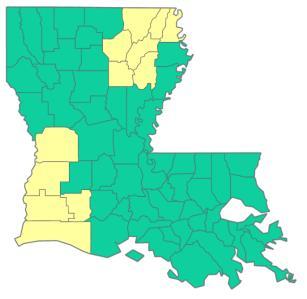
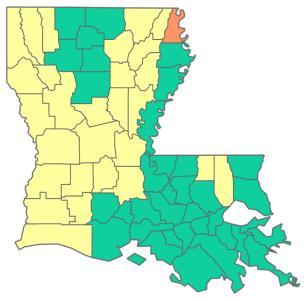
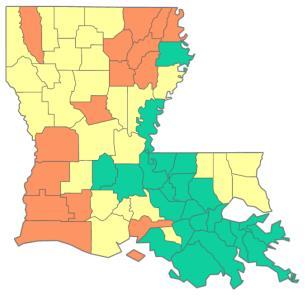
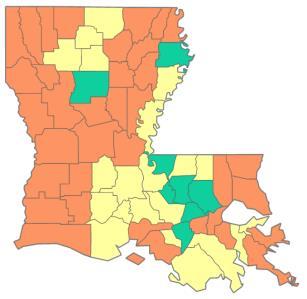
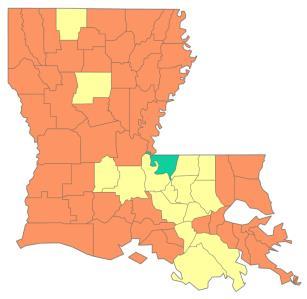
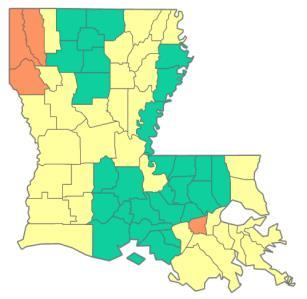
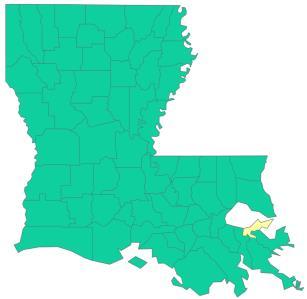
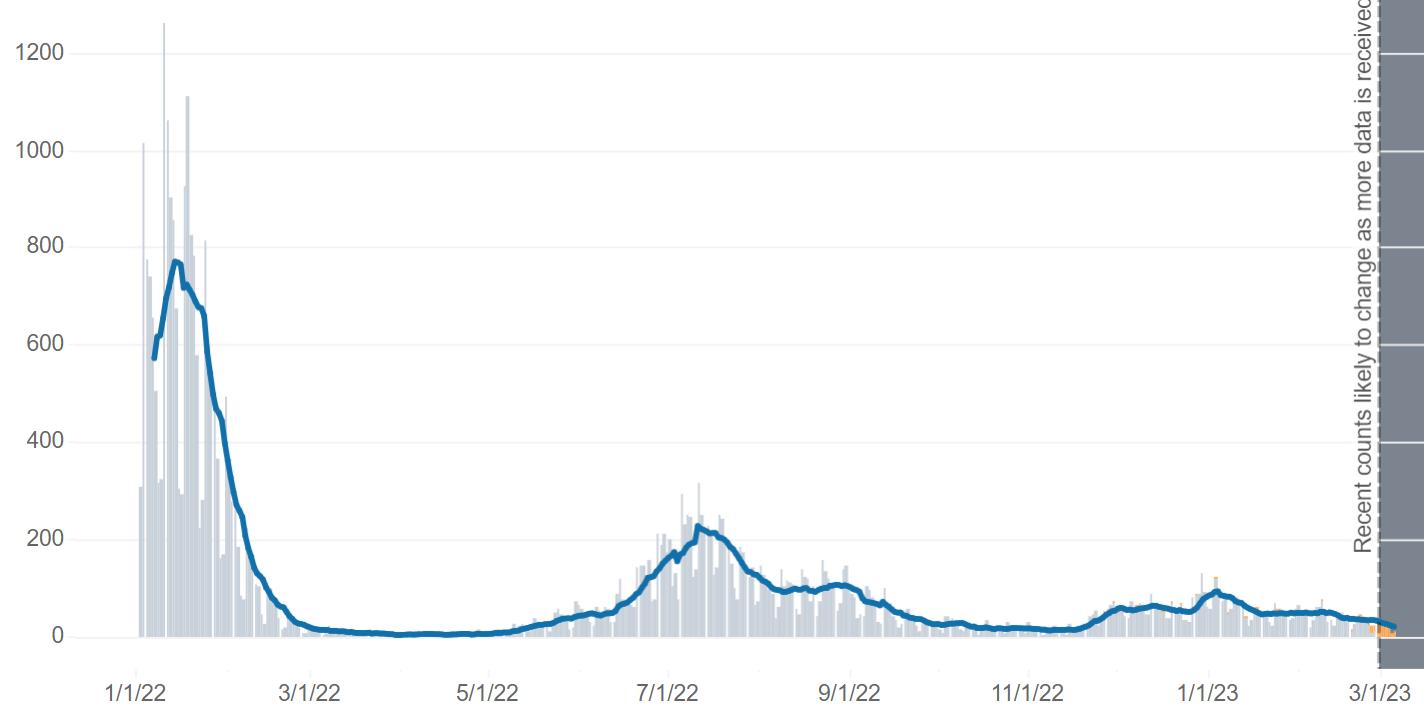
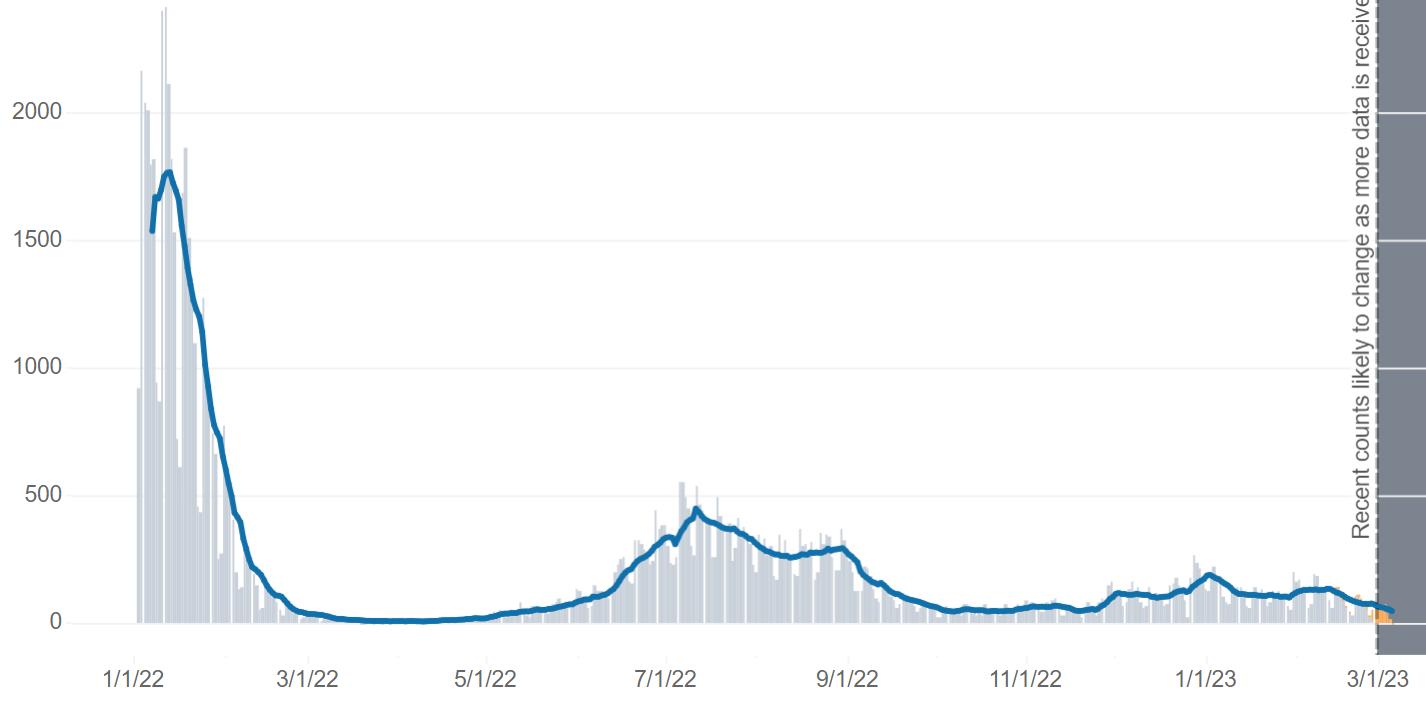
Louisiana’s risk of Covid is low as indicated on the statewide map. Covid cases in Regions 6 & 7 continue to decline from a slight rise in late December and early January.
The strong labor market experienced in theAlexandria MSA in 2022 softened in January. January’s employment level was 1,817 below November 2022 and 2,184 below the July 2022 peak. Several other factors indicate a weakening in the labor market such as a rising unemployment rate, fewer job postings per unemployed, and a negative statewide economic index.
For the first time since the start of the pandemic in March 2020Alexandria did not have the lowest unemployment rate among state’s metro areas. Baton Rouge took top honor at 3.2%, while the unemployment rate in theAlexandria MSArose to 3.4% in January from 3.0% in December, and 2.5% in November. Lafayette tied Alexandria at 3.4% while the Houma-Thibodaux and Lake Charles MSAs were at 3.5%.Alexandria remains below the statewide unemployment rate of 3.6%. However, the gap is narrowing as employment in other regions of the state have improved quickly. Employment in Natchitoches fell by 196 while the unemployment rate rose to 4.2% in January from 3.6% in December.
The labor market in theAlexandria MSA remains the tightest in the state, despite rising the unemployment rate. The ratio of job postings to unemployed fell from 4:1 to 3:1.

March 2023
For the first time since September 2021, the Coincident Economic Activity Index for Louisiana turned negative in December. The Index is set to match the trend in the gross state product and includes four indicators: nonfarm payroll employment, the unemployment rate, average hours worked in manufacturing and wages and salaries. In December 2022, the Index fell to 110.39, from 110.42 in November. Although the decline was small, it was first decline in nearly a year and half and may represent a slowing of the economy if the trend continues. Nevertheless, the Index ended 2022 up 3.4%
Consumer spending remains strong in central Louisiana as measured by sales tax revenue, despite weakening employment. Strong sales activity in December made for robust sales tax collections in January. Month-over-month declines in sales tax collections in February are typical when compared to January. February’s collections exceeded the previous year in all reporting jurisdictions and nearly every jurisdiction was up on a year-to-date basis.
Vehicle sales were up in five of the six reporting jurisdictions on a year-over-year basis with Evangeline leading with a 32% increase. Natchitoches and Rapides had increases of 18% and 15%, respectively.
Cenla consumers continue to accelerate online purchasing.According to the Louisiana Remote Sellers Commission, online sales in central Louisiana were up 27% in January and February compared to the same period in 2022. Since August 2020 when remote sellers tax revenue collection started, $46.8 million in sales tax revenue have been collected from online sales in central Louisiana. In that time, Rapides has collected $14.3 million in tax revenues, Vernon $5.4 million, Natchitoches $3.7 million, Evangeline $3.5 million, andAvoyelles $3.2 million.
Permit valuation data has been reorganized into a single page. This provides a better overview of permits in Cenla. So far in 2023, the valuation of construction permits are down -61% in the seven Cenla jurisdictions reporting compared to the first two months of 2022.
Higher mortgage rates continue to put pressure on the housing market. The 30 year fixed mortgage rate remained elevated in January and February, adversely impacting home sales in central Louisiana. The fixed rate stood at 6.73% on March 9th. The weakness in the housing market continues to impact lumber prices. The US Lumber Price Index remained unchanged in January from December, standing at -35% below last year’s level. Homes are staying on the market longer compared to a year ago. For example, homes in Alexandria and Natchitoches spent 21-22% more days on the market than a year ago.
Gasoline prices in the Gulf Coast region are up 14% from the December 19th low of $2.64/gallon. Year-to-date hotel occupancy is up 32% in Vernon, and 25% in Natchitoches andAvoyelles. Rapides saw a -6% decline in occupancy compared to the first two months of 2022.
New business applications in Louisiana in January and February fell -10% compared to 2022. However, 82 new businesses were created in Rapides year-to-date in 2023, compared to 83 during the same period last year.
 Central Louisiana Economic Dashboard
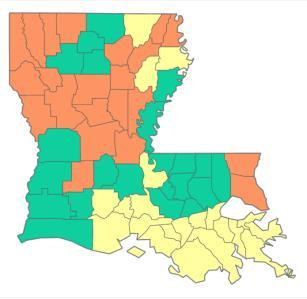
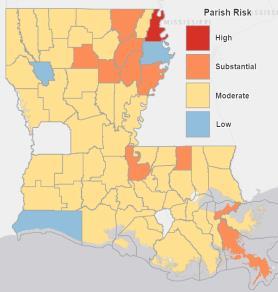
COVID-19 statewide risk captured mid-month by parish from March 2022 – March 2023.
COVID-19 cases by collection date from January 2022 – March 2023 in Region 6 (Cenla).
Source: Louisiana Department of Health, COVID-19 Dashboard, https://ldh.la.gov/coronavirus, March 13, 2023.
COVID-19 cases by collection date from January 2022 – March 2023 in Region 7 (Natchitoches).
Source: Louisiana Department of Health, COVID-19 Dashboard, https://ldh.la.gov/coronavirus, March 13, 2023.
 Central Louisiana Economic Dashboard
Employed persons in the Alexandria MSA from 2020 – 2023.
Employed Persons in Alexandria, LA MSA 2020 -
✓Employment in January decreased 1,817 from November to January
✓Employment in January is down 57 from a year ago.
✓Unemployment rate in theAlexandria MSAin January was 3.4%, up from 3.0% in December and 2.5% in November.
Source: Louisiana Workforce Commission, March 19, 2023.
Employed persons in Natchitoches parish from 2020 – 2023.
In January 2023, 15,899 were employed in Natchitoches parish, down from 16,095 in December, a decrease of -196.
The unemployment rate in Natchitoches parish in January rose to 4.2% from 3.6% in December.
Source: Louisiana Workforce Commission, March 19, 2023
The table below shows December 2022 and January 2023 unemployment rate, labor force, and employment data for Metropolitan Statistical Areas in the state.
At 3.2%, the Baton Rouge MSAhad the unemployment rate in the state in January.
▪ January 2023 marked the first time since the start of the pandemic nearly three years ago that the Alexandria MSAdid not have the lowest unemployment rate in the state
✓Louisiana’s unemployment rate in January was 3.6%.
Data Source: Louisiana Workforce Commission, March 19, 2023.
January 2023
The table below shows December 2022 and January 2023 unemployment rate, labor force, and employment data for central Louisiana parishes.
✓In January 2023, parishes in central Louisiana had an unemployment rate of 4.0%, up from 3.0% in November 2022.
Data Source: Louisiana Workforce Commission, March 19, 2023.
The graphs below shows the unemployment rate in Rapides from 1990 –2023 and 2016 – 2023.
In January 2023, Rapides had an unemployment rate of 3.4%, up from 3.0% in December 2022, representing the second consecutive monthly increase.
Data Source: Louisiana Workforce Commission, March 19, 2023.
Initial and continued unemployment claims in Louisiana from January 2022 to February 2023.
✓Initial unemployment claims rose 4% following the Christmas season, but fell -18% in February.
✓Continued unemployment followed suit, rising 8% in January before falling -4% in February.
Both initial and continued unemployment claims are trending down.
Source: Louisiana Workforce Commission, March 19, 2023
Unemployment Claims in Louisiana 2022 - 2023
Continuing Initial


The table below shows the number of unemployed, number of advertised jobs online, and the ratio of unemployed to advertised job openings online for Metropolitan Statistical Areas in Louisiana in February 2023.
February 2023
In January 2023, the Alexandria MSAlabor market had a job opening ratio of 0.36, up from 0.26 in November 2022, meaning the area went from four postings per unemployed to three.
The state ratio was 0.62 in January.
Central Louisiana Economic Dashboard
An overview of sales, vehicle sales, and hotel occupancy taxes collected in the January and February 2023 reflecting sales activity in the previous month, unless otherwise noted.
Notes: December tax revenue collection reflects sales activity in November. *Current month data are not available. Represents prior month. N/a = Not available
Data Source noted in detailed reports.
An overview of sales tax revenue collected in Ball and Woodworth in January and February 2023.
Note: Current tax revenue reflects sales activity in prior month.
Data Source: Rapides Parish Police Jury Treasurer’s Reports, March 2023.

(TR) Alexandria total sales tax revenue collected in January and February with previous month, year, and YTD comparisons.
(BR) Alexandria total monthly sales tax revenue from 2021 to present.
Note: Current month sales tax revenue reflects sales activity in previous month.
Data Source: Rapides Parish Police Jury Treasurer’s Reports, March 2023.
Avoyelles Parish total sales tax revenue collected in January and February with previous month, year, and year-to-date comparisons. Vehicle and hotel tax revenues are excluded.
Note: Current sales tax revenue reflects sales activity in the prior month.
Data Source: Avoyelles Parish School Board. March 2023.
Avoyelles Parish vehicle sales tax revenue collected in January and February with previous month, year, and year-to-date comparisons.
Note: Current sales tax revenue reflects sales activity in the prior month.
Data Source: Avoyelles Parish School Board. March 2023
Catahoula Parish total sales tax revenue collected in January and February with previous month, year, and year-to-date comparisons.
Note: Current month sales tax revenue reflects sales activity in the prior month.
Data Source: Catahoula Parish Tax Administrator, March 2023
Concordia Parish total sales tax revenue collected in January and February with previous month, year, and year-to-date comparisons.
Note: Current month sales tax revenue reflects sales activity in the prior month.
Data Source: Concordia Parish Tax Administrator. March 2023
Evangeline Parish total sales tax revenue collected in January and February with previous month, year and YTD comparisons.
Note: Current sales tax revenue reflects sales activity in prior month. Evangeline implemented a 1% sales tax increase
Data Source: Evangeline Parish Sales Tax Commissioner. March 2023
Evangeline Parish vehicle sales tax revenue collected in January and February with previous month, year and YTD comparisons.
Note: Current sales tax revenue reflects sales activity in prior month. Evangeline implemented a 1% sales tax increase July 1, 2021.
Data Source: Evangeline Parish Sales Tax Commissioner. March 2023
(TR) Grant sales tax revenue collected in January and February with previous month, year, and YTD comparisons.
(BR) Grant monthly sales tax revenue from 2021 to present.
Note: Current sales tax revenue reflects sales activity in prior month. Data Source: Grant Parish Sheriff’s Office, March 2023.
La Salle Parish total sales tax revenue collected in January and February with previous month, year, and year-to-date comparisons.
Note: Current month sales tax revenue reflects sales activity in the previous month.
Data Source: La Salle Parish Tax Administrator, March 2023
(TR) Natchitoches sales tax revenue collected in January and February with previous month, year, and YTD comparisons.
(BR) Natchitoches monthly sales tax revenue from 2021 to present.
Note: Current month sales tax revenue collections reflects sales activity in the prior month.
Data Source: Natchitoches Parish Tax Commission, March 2023.
(TR) Natchitoches vehicle sales tax revenue collected in December ‘22 and January ‘23 with previous month, year, and YTD comparisons.
(BR) Natchitoches monthly vehicle sales tax revenue from 2021 to present.
Note: Current sales tax revenue collections reflects sales activity in the prior month.
Data Source: Natchitoches Parish Tax Commission, March 2023.
*February 2023 vehicle sales tax revenue was not available at time of publication.
(TR) Pineville sales tax revenue collected in January and February with previous month, year, and YTD comparisons.
(BR) Pineville monthly sales tax revenue from 2021 to present.
Note: Current month sales tax revenue reflects sales activity in the prior month.
Data Source: Rapides Parish Police Jury Treasurer’s Reports, March 2023.
(TR) Rapides Parish sales tax revenue collected in January and February with previous month, year, and YTD comparisons.
(BR) Rapides monthly sales tax revenue from 2021 to present.
Note: Current sales tax revenue reflects sales activity in the prior month.
Data Source: Rapides Parish Police Jury Treasurer’s Reports, March 2023.
Rapides Parish vehicle sales tax revenue collected in January and February with previous month, year, and YTD comparisons.
Note: Current sales tax revenue reflects sales activity in the prior month.
Data Source: Rapides Parish Police Jury Treasurer’s Reports, March 2023.
St. Landry Parish sales tax revenue collected in January and February with previous month, year, and YTD comparisons.
Note: Current sales tax revenue collection reflects sales activity in prior month.
Data Source: Tax revenue data from St. Landry Parish School Board. March 2023
St. Landry Parish vehicle sales tax revenue collected in January and February with previous month, year, and YTD comparisons.
Note: Current sales tax revenue reflects sales activity in prior month.
Data Source: Tax revenue data from St. Landry Parish School Board. March 2023
Vernon Parish sales tax revenue collected in January and February with previous month, year, and year-to-date comparisons.
Data Source: Vernon Parish Sales Tax Department. March 2023.
Vernon Parish vehicle tax revenue collected in January and February with previous month, year, and year-to-date comparisons.
Data Source: Vernon Parish Sales Tax Department. March 2023.
Remote sellers tax revenue by parish with month-over-month, year-over-year, and year-to-date comparisons.
Total online sales tax revenue in Cenla in January and February 2023 was up 27% from the first two months last year.
✓Online sales in Cenla during the Christmas season (November and December) were up 12% in 2022 compared to 2021.
Note: Sales tax revenue collected in the current month reflects sales activity in the prior month.
Data Source: Louisiana Sales and Use Tax Commission for Remote Sellers.August 2020 – February 2023
Remote seller tax revenue is tax revenue from online sales by location of the seller at the time of purchase.
August 2020 - February 2023
SinceAugust 2020 when remote sellers tax revenue collection started, $46.8 million in sales tax revenue have been collected from online sales in central Louisiana.
Since the start of the remote sellers collections, Rapides has collected $14.3 million in tax revenues, Vernon $5.4 million, Natchitoches $3.7 million, Evangeline $3.5 million, andAvoyelles $3.2 million.
Note: Sales tax revenue collected in the current month reflects sales activity in the prior month.
Data Source: Louisiana Sales and Use Tax Commission for Remote Sellers.August 2020 – February 2023
Remote sellers tax revenue from online sales in Evangeline Parish from August 2020 – February 2023.
Note: Sales tax revenue collected in the current month reflects sales activity in the prior month.
Data Source: Louisiana Sales and Use Tax Commission for Remote Sellers.August 2020 – February 2023

Remote sellers tax revenue from online sales in Natchitoches Parish from August 2020 – February 2023.
Note: Sales tax revenue collected in the current month reflects sales activity in the prior month.
Data Source: Louisiana Sales and Use Tax Commission for Remote Sellers.August 2020 – February 2023

Remote sellers tax revenue from online sales in Rapides Parish from August 2020 – February 2023.
Rapides Parish 2020 - 2023
Note: Sales tax revenue collected in the current month reflects sales activity in the prior month.
Data Source: Louisiana Sales and Use Tax Commission for Remote Sellers.August 2020 – February 2023
 Central Louisiana Economic Dashboard
This table shows the valuation of permits issued in January and February 2023 for select jurisdictions of Rapides Area Planning Commission, the City of Alexandria, the City of Natchitoches, and Natchitoches Parish with month-tomonth, year-to-year, and year-to-date comparisons.
Note: n/a = not available.
Data Source: RapidesArea Planning Commission, City of Alexandria, Natchitoches, Natchitoches Parish, March 2023.
30-Year Fixed Rate Mortgage Average in the United States from 1971 – 2023 and from 2019 – 2023.
▪ 30 year fixed mortgage rates on March 9, 2023 was 6.73%.
Data Source: Fed Reserve Economic Database, St. Louis Federal Reserve Bank, March 14, 2023.
The chart represents the Lumber Price Index in the U.S. from January 2020 – January 2023.
Monthly Price Index of Lumber 2020-2023
▪ In January 2023, the US Lumber Price Index remained unchanged from December 2022.
▪ Currently, the Lumber Index stands -35% below a year ago when it stood at 406.
Data Source: Fed Reserve Economic Database, St. Louis Federal Reserve Bank, March 14, 2023.
The count of active single-family and condo/townhome listings from January 2019- February 2023 for Alexandria, Fort Polk (Leesville), Natchitoches, and Opelousas.
The median number of days property listings spend on the market from January 2019 – February 2023 for Alexandria, Fort Polk (Leesville), Natchitoches, and Opelousas.
The median listing price of houses from January 2019 - February 2023 for Alexandria, Fort Polk (Leesville), Natchitoches, and Opelousas.
The average listing price of houses from January 2019 - February 2023 for Alexandria, Fort Polk (Leesville), Natchitoches, and Opelousas.
Average Listing Price 2019-2023
Central Louisiana Economic Dashboard
Avoyelles Parish hotel occupancy tax revenue in January and February with previous month, year, and year-to-date comparisons.
Note: Current tax revenue reflects hotel occupancy activity in the prior month. Hotel occupancy tax revenue is used as a proxy for hotel occupancy rate.
Data Source: Avoyelles Parish School Board. March 2023.
Natchitoches Parish hotel occupancy tax revenue for January and February with previous month, year, and YTD comparisons.
Note: Current tax revenue reflects hotel occupancy activity in the prior month. Hotel occupancy tax revenue is used as a proxy for hotel occupancy rate.
Data Source: Natchitoches Parish Tax Administrator, March 2023.
Rapides Parish hotel occupancy tax revenue for January and February with previous month, year, and YTD comparisons.
Note: Current tax revenue reflects hotel occupancy activity in the prior month. Hotel occupancy tax revenue is used as a proxy for hotel occupancy rate.
Data Source: Rapides Parish Police Jury Treasurer’s Reports, March 2023.
Vernon Parish hotel, motel, and RV occupancy tax revenue for January and February with previous month, year, and year-todate comparisons.
Note: Current tax revenue collection reflects hotel occupancy activity in the prior month. Hotel occupancy tax revenue is used as a proxy for hotel occupancy rate.
Data Source: Vernon Parish Sales Tax Department. March 2023.
Weekly retail price of gasoline in the Gulf Coast region for all formulations from 2020 – 2023.

February 0% Feb
▪ Gasoline peaked on June 13, 2022 at $4.63 a gallon. The low of 2022 was December 19 at $2.64. Prices are up 14% from the December low.
▪ February 2023 average retail gasoline price in Gulf Coast region was $3.01/gal., relatively unchanged from January’s 3.00/gal.
Weekly Retail Gasoline Price All Formulations in Gulf Coast Region 2020-2023
Data Source: U.S. Energy Information Administration, Prices, Sales Volumes & Stocks by State, March 13, 2023
Central Louisiana Economic Dashboard
The chart below represents the monthly number of new businesses applications in Louisiana from 2021-2023 (seasonally adjusted).
Note: Data reflects businesses applications, not necessarily business formations.
Data Source: U.S. Census Bureau, Business Formation Statistics, Retrieved March 13, 2023.
The chart below represent the number of new businesses established each month in Rapides from January 2021 through February 2023.

The number of new businesses established in Rapides in February 2023 decreased -48% from January and was -15% lower than a year ago.
Year-to-date, 82 new businesses have been created in Rapides in 2023, compared to 83 last year.
Note: Data reflects businesses established in the current month.
Data Source: Rapides Parish Sales and Use Tax Department, March 2023.
The Coincident Economic Activity Index for Louisiana is set to match the trend in the gross state product and includes four indicators: nonfarm payroll employment, the unemployment rate, average hours worked in manufacturing and wages and salaries. The column graph below represents the percentage change in the index. A positive percentage represents an expanding statewide economy.
In December 2022, the Index fell to 110.39, from 110.42 in November 2022. The decline was the first since September 2021 and may represent a slowing of the economy if the trend continues
The Index is up 3.4% since December 2021.
Represents the number of drilling rigs actively exploring for or developing oil or natural gas in Louisiana and the U.S. in 2020-2023.


Average rig count in Louisiana in February was down one rig from January and up 10 rigs from a year ago, an increase of 19%.
Nationwide, the rig count rose from 636 a year ago to 772 in February, an increase of 21%.
Source: Baker Hughes, https://rigcount.bakerhughes.com/na-rig-count, March 13, 2023
Gaming revenue in Louisiana for January 2023 with previous month and year comparisons.
January
January 2023
* Note: Year-to-Date percentage reflects calendar year.
Data Source: Louisiana Gaming Control Board, March 13, 2023. http://lgcb.dps.louisiana.gov/revenue_reports.html
The data presented throughout the CENLA Economic Dashboard reflects contributions from the following local organizations.
Also, special thanks to the following partners for distributing the dashboard.
• Rapides Parish Policy Jury Treasurer
• Rapides Sales TaxAdministrator
• Avoyelles Parish School Board
• Alexandria International Airport
• Alexandria / Pineville Area CVB
• RapidesArea Planning Commission
• City ofAlexandria Planning Division
• Evangeline Parish Sales Tax Commissioner
• Concordia, Catahoula, & La Salle Tax Administrator
• Louisiana Office of Public Health
• St. Landry Parish School Board
• Grant Parish Sheriff’s Office
• Natchitoches Parish Tax Commission
• Natchitoches Parish Planning and Zoning
• City of Natchitoches Planning
• Vernon Parish Sales Tax Department
• LSUAFoundation
• Central Louisiana Regional Chamber of Commerce
• Marksville Chamber of Commerce
• Bunkie Chamber of Commerce
• Evangeline Chamber of Commerce
• Concordia Chamber of Commerce
• Greater Vernon Chamber of Commerce
• Natchitoches Chamber of Commerce
• Next Issue: Week of May 22, 2023
To subscribe to new releases, email rdupont@lsua.edu.
Current and past issues of the CENLAEconomic Dashboard can be found at http://www.lsua.edu/coronavirus/cenla-economic-dashboard/