


LJ Hooker Newsletter and Blogs
• Letter from Principal (Brent Worthington) – Update
• Rent Exchange
Reports, Surveys & Commentaries
• REINZ Property Report July 24 (June Data) withlink
• REINZ Press Release 15 July 24 (Jen Baird, CEO)
o Market Snap Shot
o Annual Median Price Changes
• REINZ House Price Index Report (HPI) July 24 (June Data) withlink
• CoreLogic
o Raft of Policy Changes unlikely to shift subdued market (withInteractiveLink)
• OneRoof Property Report – July 24
o Good news for cashed up first time buyers (more options, lower prices)
• RealEstate.CoNZ –
o Significant 18-month stretch of price stability: Will new regulation changes shake things up? The National average asking price holds steady for another month.
• TradeMe
Finance & Lending
•
Our People
• Venita Attrill
• Paul Cox
• KJ Klavens
• Steve Reilly
• Anu Jay
• Lina Roban
• Brent Worthington
• Debbie
• Johnny
(Apollo Auctions)
• Robert Tulp (Apollo Auctions)
•


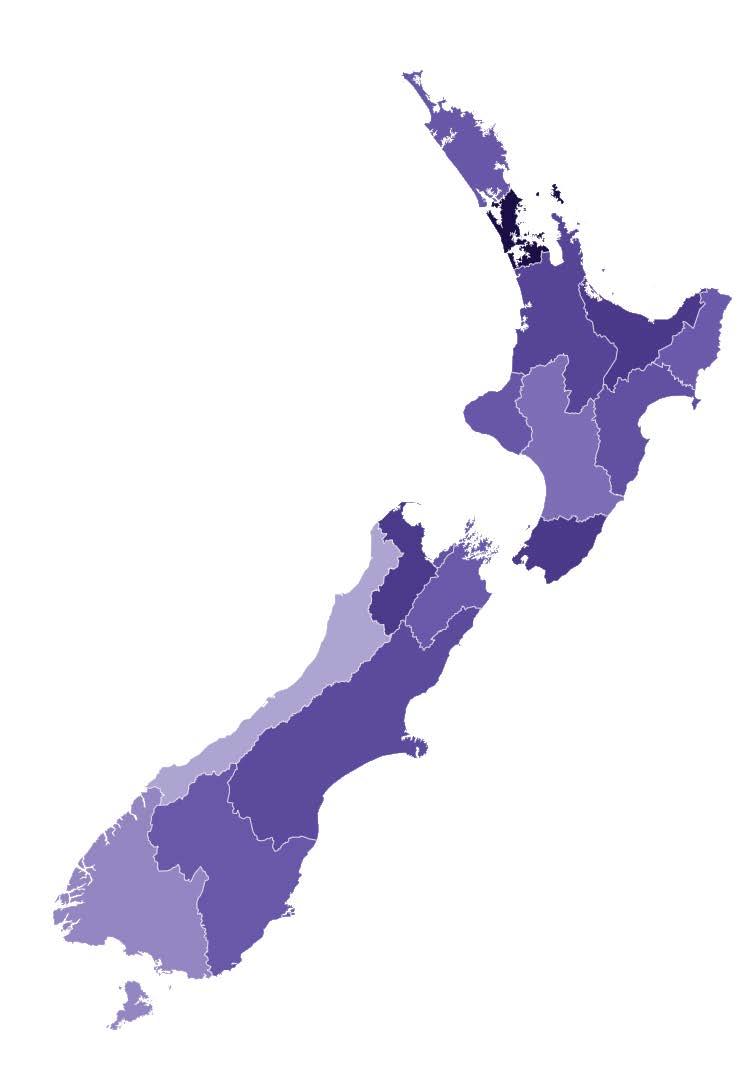
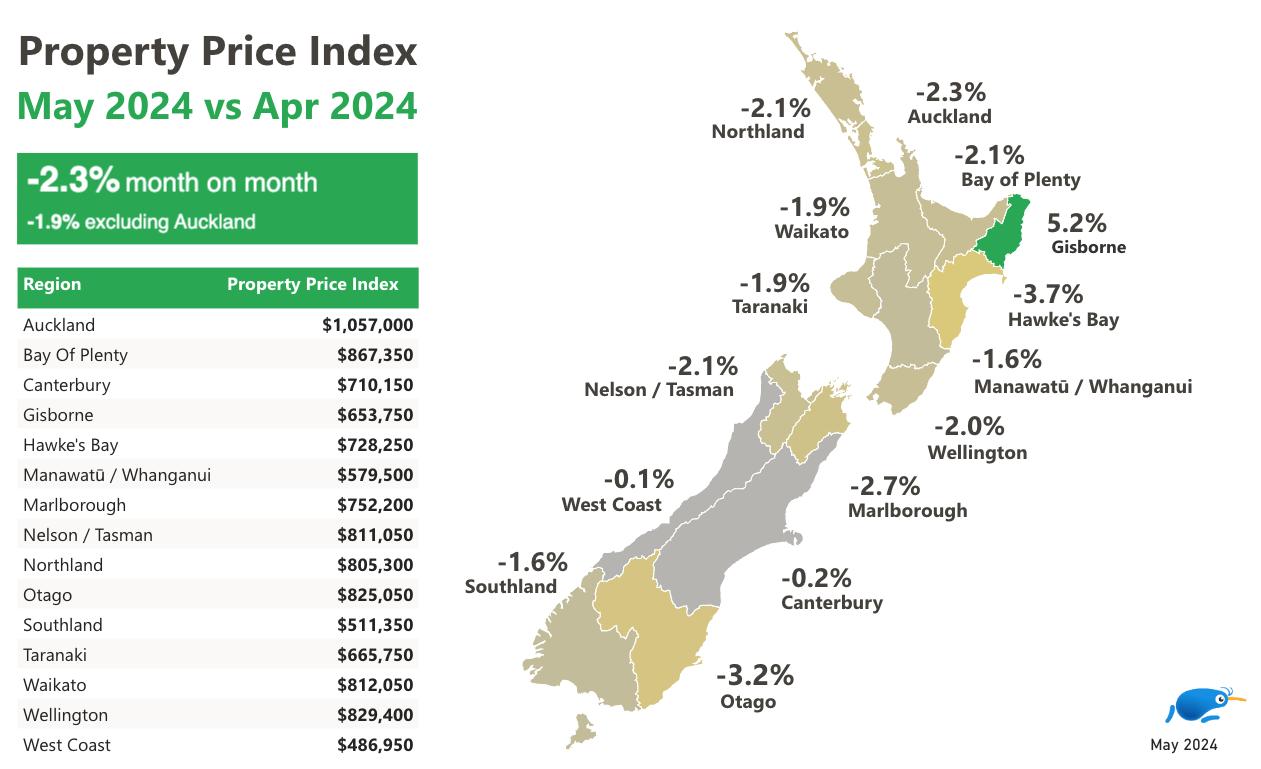
The winter bite is starting earlier, as the property market slows in June, with slower sales and mixed sales prices across New Zealand.
According to the Real Estate Institute of New Zealand (REINZ), the total number of properties sold in New Zealand decreased by 25.6 percent year-on-year, from 5,854 to 4,356, and by 32.6 percent compared to May 2024. Northland was the only region to see an increase in sales, up by 11.9 percent year-on-year.
REINZ Chief Executive Jen Baird noted that the property market in June is reflecting the wider economic climate in New Zealand.
"The typical winter lull, compounded by current economic conditions, has contributed to lower levels of activity in the market. This sentiment is reinforced by seasonally adjusted figures, which reveal a national sales decrease of 11.1 percent compared to May 2024."
Median prices for June were mixed, with Taranaki and Gisborne standing out with notable increases. The national median price, however, decreased by 1.3 percent year-on-year, from $780,000 to $770,000, and saw no change compared to May 2024. For New Zealand, excluding Auckland, the median price was up slightly by 0.4 percent year-on-year, from $682,500 to $685,000.
In contrast, LJ Hooker Group Head of Network NZ Campbell Dunoon, highlighted some optimism in the market despite the overall slowdown.
"Winter is typically a quieter season for the property market, but the bite has hit earlier this season as economic pressures and regulatory changes have buyers and sellers taking precautions," Dunoon said.
He noted that despite the slower market, auctions have remained a competitive avenue for property transactions. In June, 26 percent of LJ Hooker and Harveys sales were achieved through auction.
"The success of auctions in our national network shows there is still competition in the market. When property sellers meet the market and price their property appropriately, the right marketing campaign can still drive interest."
The beginning of July brought significant regulatory changes that could impact the property market, including a reduction in the bright-line rules to two years, easing loan-to-value ratio measures, and the introduction of debt-toincome ratio caps. Dunoon noted the impact of these changes on the market will be seen in the coming months, particularly for investors who may feel the pinch of interest rates.
“The comings months will reveal if there is an increase in property stock from investors, particularly from mum and dad investors who might be feeling the pinch of interest rates now the bright-line rules have changes.”
Adding to the market dynamics, the government has introduced the "Going for Housing Growth" policy, announced by Housing and Resource Management Act Reform Minister Chris Bishop on July 4. This policy aims to free up land for development and encourage growth in key urban areas.
"It is great to see new measures being introduced with the intention to increase housing opportunities in New Zealand, but there is concern as to whether the infrastructure needed will keep up," said Dunoon.
He emphasised the importance of creating communities with access to all necessary services, ensuring a high quality of life for residents.
Looking ahead, there is cautious optimism that financial pressures could ease sooner than expected. Recent comments from the Reserve Bank's Monetary Policy Committee suggest a potential softening in interest rates later this year, with Kiwi Bank anticipating a possible cut as soon as October.
"With all these policy changes and market factors to consider, the property market we are seeing at the moment is likely to be more active as we head into spring and summer.
As always we hope you enjoy this publication.
Kind regards
Brent
Brent Worthington Principal and Licensee Agent
LJ Hooker Town & Country & Property Management
1/233 Great South road, Drury 0292 965 362


Town&Country

Please don't hesitate to contact our team who can ably assist you with any property management matters you may have or if you have any questions about anything in the newsletter or property management in general.

Fromsolarpanelstosmartthermostats,green innovationsaresoughtafterbyhomebuyersand rentersalike.Addingsuchfeaturestoaninvestment propertycanbroadenthepoolofpotentialtenants, reducevacancyrates,andevenattracthigheryields. Demandforeco-efficientlivingisexpectedtorise,so investinginsustainablepropertiescanalsohavea positiveimpactonportfolios,too.
Inadditiontomitigatingclimatechange,sustainable featuresalsohelptopreservenaturalresourcesfor futuregenerationsbyreducingenergyconsumption, conservingwater,andminimisingwaste.Sustainable livingcanbringahostofbenefitsbeyondhelpingthe environment.Belowwedelveintowhygoinggreencan giveinvestorsanadvantage.
1.Lowerutilitybills
Eco-friendlypropertiesaredesignedtobemore energy-efficient,whichnaturallytranslatesintolower utilitybillsforbothhomeownersandtenants.Solar panels,energy-efficientappliancesandsmart thermostatscanreducemonthlyelectricitybills.Thisis likelytomakeyourinvestmenthighlydesirableto tenants.
2.Attractandretainqualitytenants
Thesedays,moreandmoretenantsarelookingfor energy-efficienthomes.Eco-friendlyrentalscanattract abroaderpoolofpotentialtenantsandbuyers, reducingvacancyratesandincreasingdemand.Green propertiesarealsolikelytoattractresponsibletenants whowilllookafterthepropertyminimising maintenance.
3. Higher yields
As the demand for sustainable living spaces grows, so does the value of eco-friendly properties. Eco-friendly design, technology and appliances could attract higher rent. When considering any updates for your investment property, be sure to look at the latest green innovations.
4. Being green adds market value
There's a clear uptrend in the demand for sustainable properties due to increased environmental awareness and concerns about climate change. Eco-friendly features can increase your property's value over time, offering a solid return on investment. Sustainable features are likely to become more important in years to come.
5. Tax benefits
You may be eligible for tax credits, deductions, or other financial incentives, further increasing your savings and returns.
6. Positive impact on the environment
By supporting green building practices, investors can play a role in creating healthier, more liveable communities while addressing pressing environmental challenges. By reducing energy consumption, conserving water, and minimising waste, eco-friendly properties help mitigate climate change and preserve natural resources for future generations.
Getafreepropertymanagementappraisalandlearn howourexpertstrategiescansimplifyyourportfolio managementforgreaterefficiencyandprofit.


Landlords must provide one or more fixed heaters that can directly heat the main living room. The heater(s) must be acceptable types and must meet the minimum heating capacity required for your main living room.
The World Health Organization (WHO) recommends a minimum indoor temperature of 18˚C. By installing heating that can reach this temperature on the coldest days of the year, tenants will be able to keep warm all year round.
To find out when your property needs to comply with the healthy homes standards use the compliance timeframes decision tool.
Compliance timeframes decision tool
Landlords that don't meet their obligations under the healthy homes standards are in breach of the Residential Tenancies Act 1986. They may be liable for exemplary damages of up to $7,200.
On this page
• Whatistheheatingstandard?
• Ifyouhaveexistingheating
• Extendedcompliancetimeframeforsomeproperties
• Exemptionstotheheatingstandard
• Landlordsmanagingasbestosrelatedrisks
• Furtherinformation
What is the heating standard?
There must be one or more fixed heaters that can directly heat the main living room.
The main living room is the largest room that is used for general, everyday living – for example a lounge, family room or dining room.
Heater(s) must be fixed (not portable) and must be at least 1.5 kW in heating capacity and meet the minimum heating capacity needed for the main living room. There are several options to calculate the heating capacity required for the main living room.
Options include:
• Using the heating assessment tool
• Using the formula in the regulations
• Using a professional to assess the required heating capacity to meet the heating standard
Find out more about the options to calculate the required heating capacity
Acceptable heaters
Heater(s) must not be an open fire or an unflued combustion heater, for example, a portable LPG bottle heater. If you use a heat pump or an electric heater as part of your solution to meet the healthy homes heating standard, it must have a thermostat. You can’t use an electric heater (except a heat pump) if the required heating capacity for the
main living room is over 2.4 kW, unless you are ‘topping up’ existing qualifying heating that was installed before 1 July 2019.
In most cases, the acceptable types of heater(s) will be a larger fixed heating device like a heat pump, wood burner, pellet burner or flued gas heater. In some cases, such as small apartments, a smaller fixed electric heater may be enough.
Some properties can meet the heating standard by using geothermal heating, if the geothermal heating meets certain requirements.
Geothermal heating requirements
Visit the Gen Less website for more information about different heating options:
Heat & cool efficiently — Gen Less
Download the heating guidance document for more details on how to meet the heating standards:
Healthy homes standards heating guidance [PDF, 1.9 MB]
If you have existing heating
You don't need to add more heating if you have 1 or more existing heaters that:
• were installed before 1 July 2019
• each have a heating capacity greater than 2.4kW
• meet the requirements in the standards (for example, not an open fire or an unflued combustion heater)
• are not electric heaters (heat pumps are acceptable) if the required heating capacity for the main living room is over 2.4 kW, and
• have a total heating capacity that's at least 80% of what you need to meet the required heating capacity.
If the existing heater is a woodburner, it will likely have a label stating the heat output. Landlords can also check the manufacturer's information or council records for information on the heat output of their woodburner.
Central heating will meet the heating standard as long as:
• it provides heat directly to the main living room (for example, through vents, ducts or radiators); and
• it meets the required heating capacity.
Top up existing heating
If your existing heating doesn't meet the required heating capacity and you're adding a new heater or heaters to the main living room, each heater must meet the requirements in the healthy homes standards, with one exception. You can add a smaller fixed electric heater to ‘top up’ your heating if you meet all these conditions:
• you installed your existing heating before 1 July 2019
• the required heating capacity is more than 2.4 kW
• the ‘top up’ you need is 2.4 kW or less.
For example, if you have a heat pump with a heating capacity of 3.6 kW that was installed before 1 July 2019, but you need a total heating capacity of 6.0 kW, you can add a fixed 2.4 kW electric heater with a thermostat to meet the standard.
Once the heat pump needs to be replaced due to wear and tear, you will need to install a qualifying heater/s that meets the required heating capacity under the healthy homes heating standard.
If you have geothermal heating
Some properties (mainly in Rotorua) can meet the heating standard by using geothermal heating, if the heater:
• is powered by geothermal energy;
• provides direct heat to the main living room; and
• doesn’t have a stated heating capacity and for which it is not possible to state its heating capacity.
Extended compliance timeframe for some properties
Landlords who use the new heating formula may get extra time to comply with the heating standard.
Find out if your property meets the criteria for the new heating formula
If all the following applies, the compliance date for the heating standard is 12 February 2023:
• It is a private tenancy (not a boarding house, a Kāinga Ora or registered Community Housing tenancy).
• The new heating formula is applicable to the rental property and the landlord chooses to use it to calculate the minimum required heating capacity.
• The end of the compliance timeframe is on or after 12 May 2022 and before 12 February 2023.
Landlords of these properties must continue to comply with the other healthy homes standards within 90 or 120 days of any new, or renewed, tenancy.
Use the compliance timeframes decision tool to find out when your property needs to comply
If a landlord has already completed the healthy homes compliance statement with the tenancy agreement and is choosing to now use the new heating formula, they will need to provide updated information to tenants.
Find out more about updating the heating standard information in the compliance statement.
Exemptions to the heating standard
There are specific exemptions to the heating standard. The exemptions are:
• where it is not reasonably practicable to install one or more qualifying heating devices.
• where the rental property is a certified passive building.
It is not reasonably practicable to install heating devices if a professional installer can’t access the area without:
• carrying out substantial building work, or
• causing substantial damage to the property, or
• creating greater risks to a person’s health and safety than is normally acceptable, or
• it is otherwise not reasonably practicable for a professional installer to carry out the work.
These heating specific exemptions are in addition to the general exemptions. One of the general exemptions has specific requirements that relate to the heating standard.
General exemptions to the healthy homes standards
Partial exemption for landlords who do not own the entire building
Landlords managing asbestos related risks
Landlords must manage any asbestos-related risks when work is being done at their property.
This is to protect the health and safety of tenants, neighbours, contractors and anyone else who may be affected.
Find out more about managing asbestos related risks
Further information
The heating standard is one of five healthy homes standards. Find out about the other healthy homes standards:
• Insulationstandard
• Ventilationstandard
• Moistureingressanddrainagestandard
• Draughtstoppingstandard

WhetheryouareoverseasorbasedinNew Zealand,you'llwanttomakethemostoutofyour realestateinvestment.
Youmay haveplans topurchaseaninvestmentproperty, oralready owna homeorapartment torentouttotenants.
Eitherway,LJHookerRentExchangecanhelpyoumaximiseyourreturnsofferingamix ofinvestmentandproperty management toaddressevery possiblecircumstanceonyourbehalf.
Many landlordsand investorsarefinancially-savvy,butsomecanbeleftin thedark whenitcomestofindingtenants, dealingwithday-to-day property issuesorlegaljargon.
TheteamatLJHookerRentExchangetakeallthehassleoutofmanaging andmaintainingyourproperty.Ourfirststepwillbetoensureyougetthe right tenants - the LJ Hooker brand naturally attracts a significant volume of prospective tenants and our detailed processes for checking applicationswillensureyourrentalincomeissecure.
We'llalsokeepontopofthemaintenanceatyourproperty andwillcontact youimmediately intheeventanissuearises.
You'llalsofindthatlandlordswhoenlistthehelpofaproperty manager may beeligiblefor morecomprehensiveinsurancecoverandother advantages.
AtLJHookerRentExchange, you'llfindourknowledgeof localmarketsand currentindustry legislationisaninvaluableresource.
Whetheryouarelookingforanewinvestmentproperty topurchaseor requirelegalassistance, wecanhelpyouknowexactly whereyoustand andprovidethevaluedsupportyouneedforyourinvestment.
Ourteamcanmake sureyoureceiveareliableincomestream, excellent capitalgrowthandthebestreturnspossible-aswellasaguaranteeof exceptionalcustomerservice.
YoucancountonLJHookerRentExchange toproduceregularand thoroughproperty inspectionreports, ensureyoureceivecopiesofall importantdocumentsandregularly review rentratesandthelocalmarket tohelp youachievethebestoutcome.
Wetakethehassleoutofeverythingfromtheday-to-day financialsto maintenance-and allthedetailsinbetween.
FindouthowLJHookerRentExchangecanhelpyoumaximiseyour investmentwithafreerentalappraisal.Sowhynotcontactourteamtoday
Investorsknowtheycancountonustogetthejobdone correctly.


AtRentExchange,weprovidecomprehensiveproperty managementservicestailoredtoyourneeds.Beyondour full-serviceprofessionalmanagement,weofferavarietyof additionalservicestoensureallyourpropertyrequirements aremet:
InspectionsOnly
CommercialLeasing/Management
AirbnbCasual/ShortStayLetting
ConsiderRentExchangeasyouron-demandproperty managementconsultants.Heretohelpyoumanageall aspectsofyourportfolio!
Brent Worthington
Principal / Licensee Agent
T : 0292 965 362
E : brent.worthington@ljhooker.co.nz
Debbie Harrison
Property Manager
T : 021 303 864
E : debbie.harrison@ljhooker.co.nz


Town&Country
Wheretheonlyresultthatmattersisyours!

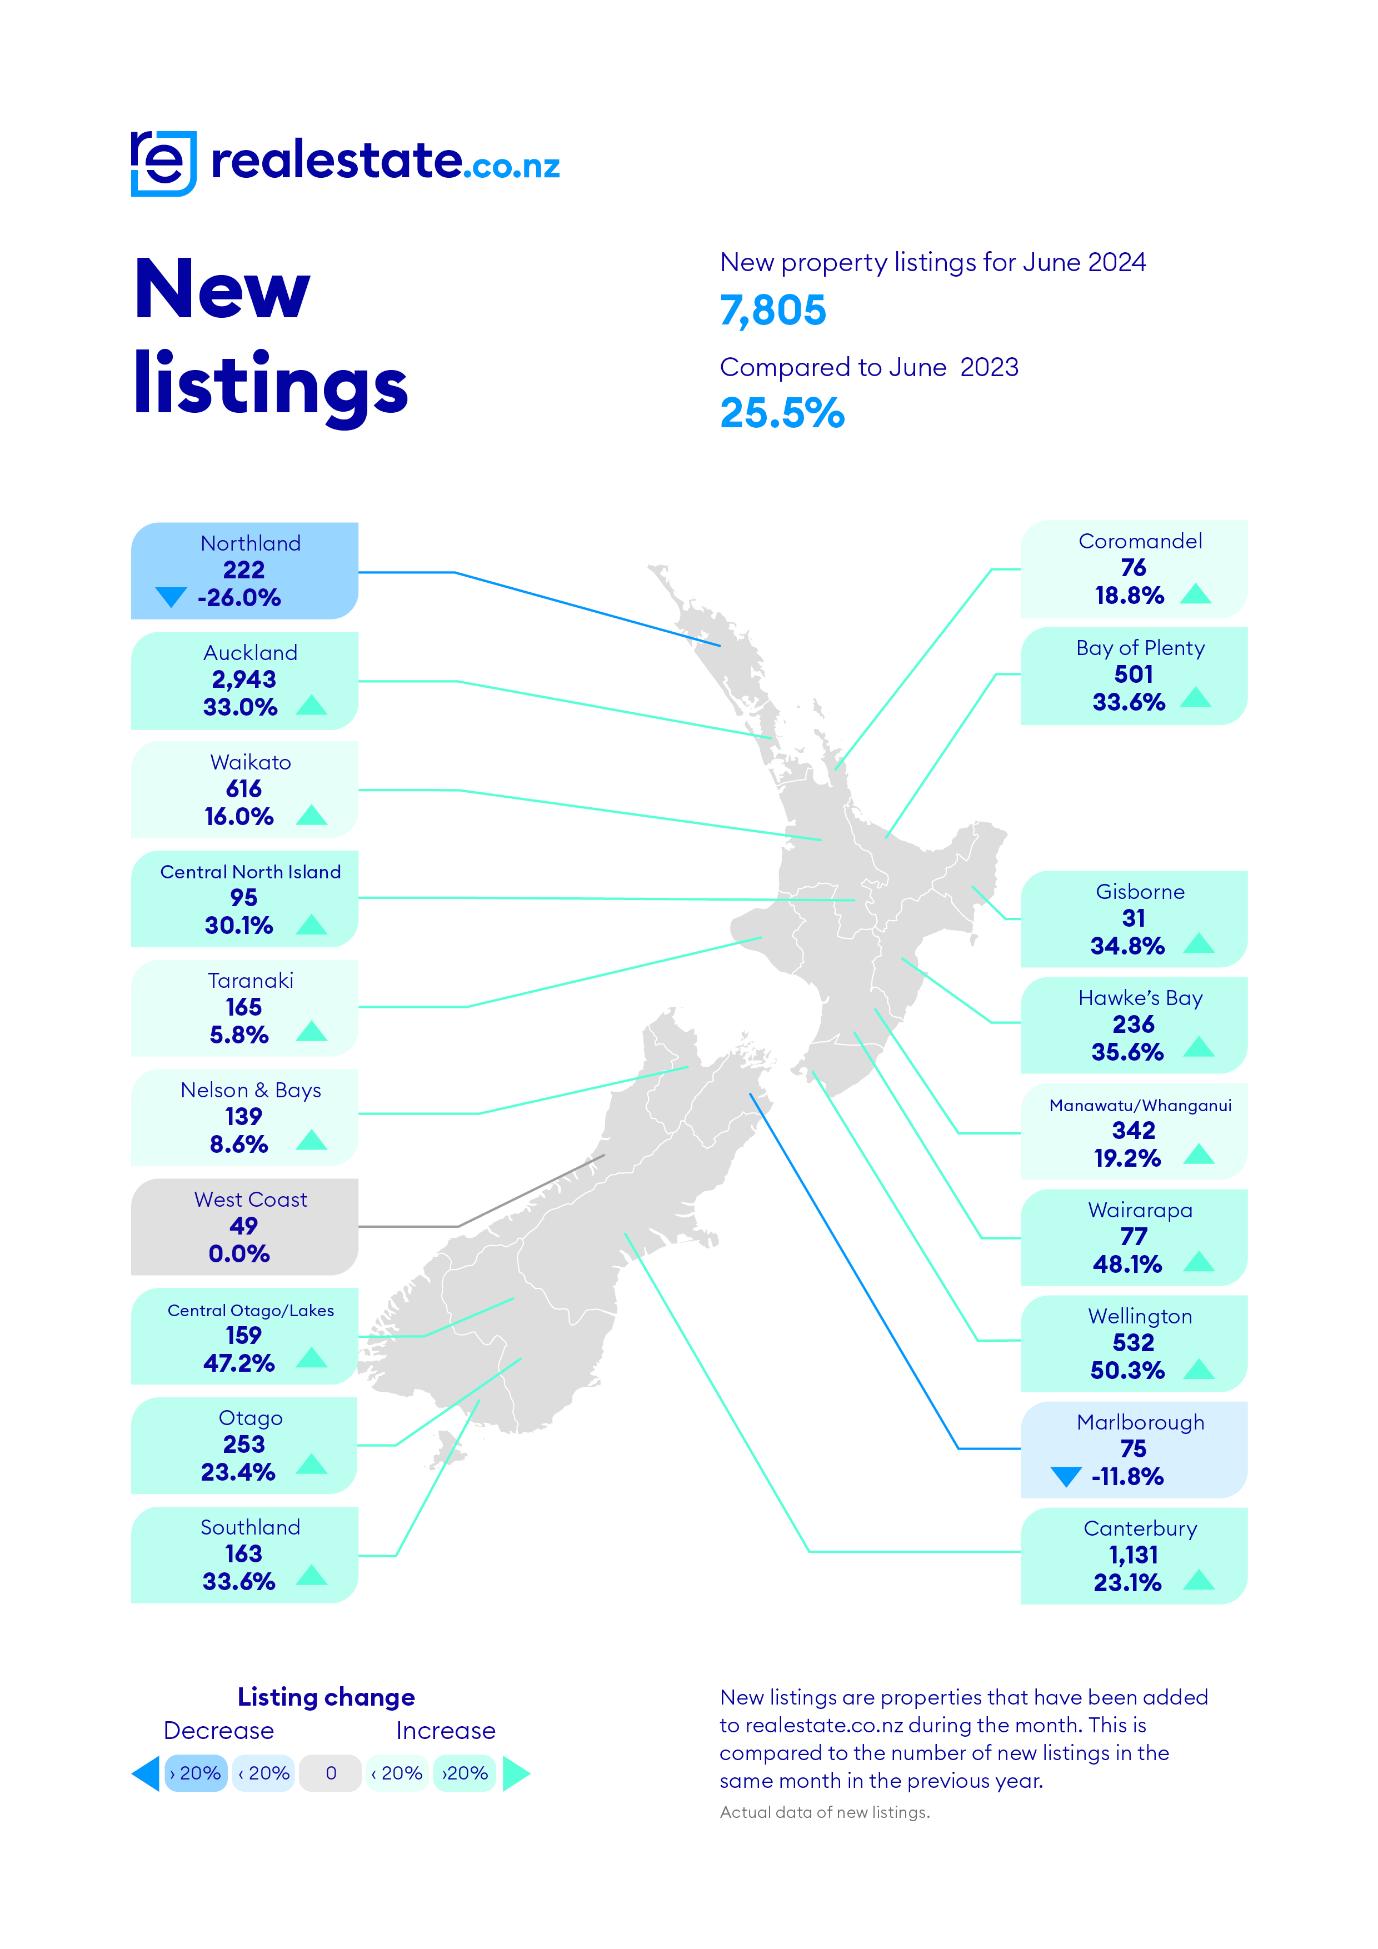
The Real Estate Institute of New Zealand (REINZ) released its June 2024 data today, showing a decrease in sales and median prices nationwide while listings continue to rise.
REINZ Chief Executive Jen Baird says that the property market in June is reflecting the wider economic climate in New Zealand. New listings have risen, continuing a trend seen in 2024, yet this increase contrasts with a noticeable decline in buyer activity, reflected in lower national sales figures.
The total number of properties sold in New Zealand decreased by 25.6% year-on-year, from 5,854 to 4,356, and by 32.6% compared to May 2024, from 6,461 to 4,356. Northland saw the only increase in sales, up by 11.9% year-on-year. The most significant decreases year-on-year were West Coast (-51.2%), Tasman (-41.7%), Gisborne (-39.4%) and Auckland (-35.1%). All regions reported a decrease in sales compared to May 2024.
“ The typical winter lull, compounded by current economic conditions, has contributed to lower levels of activity in the market. This sentiment is reinforced by seasonally adjusted figures, which reveal a national sales decrease of 11.1% compared to May 2024, reflecting a market performance below expected levels. ” says Baird.
Median prices for June were mixed, with six of the sixteen regions increasing year-on-year. Taranaki and Gisborne stood out, with Taranaki’s median price increasing by 10.7% yearon-year ($570,000 to $631,000) and Gisborne up by 7.0% ($575,000 to $615,000). Five regions saw an increase monthon-month (Taranaki +9.7% to $631,000; Gisborne +3.4% to $615,000; Auckland +2.7% to $1,048,000, Canterbury +1.5% to $690,000; Tasman +0.4% to $777,000).
The national median price decreased by 1.3% year-on-year, from $780,000 to $770,000, and saw no change compared with May 2024. For NZ, excluding Auckland, the median price was up slightly by 0.4% year-on-year, from $682,500 to $685,000, but decreased 0.6% compared to May 2024, from $689,000 to $685,000.
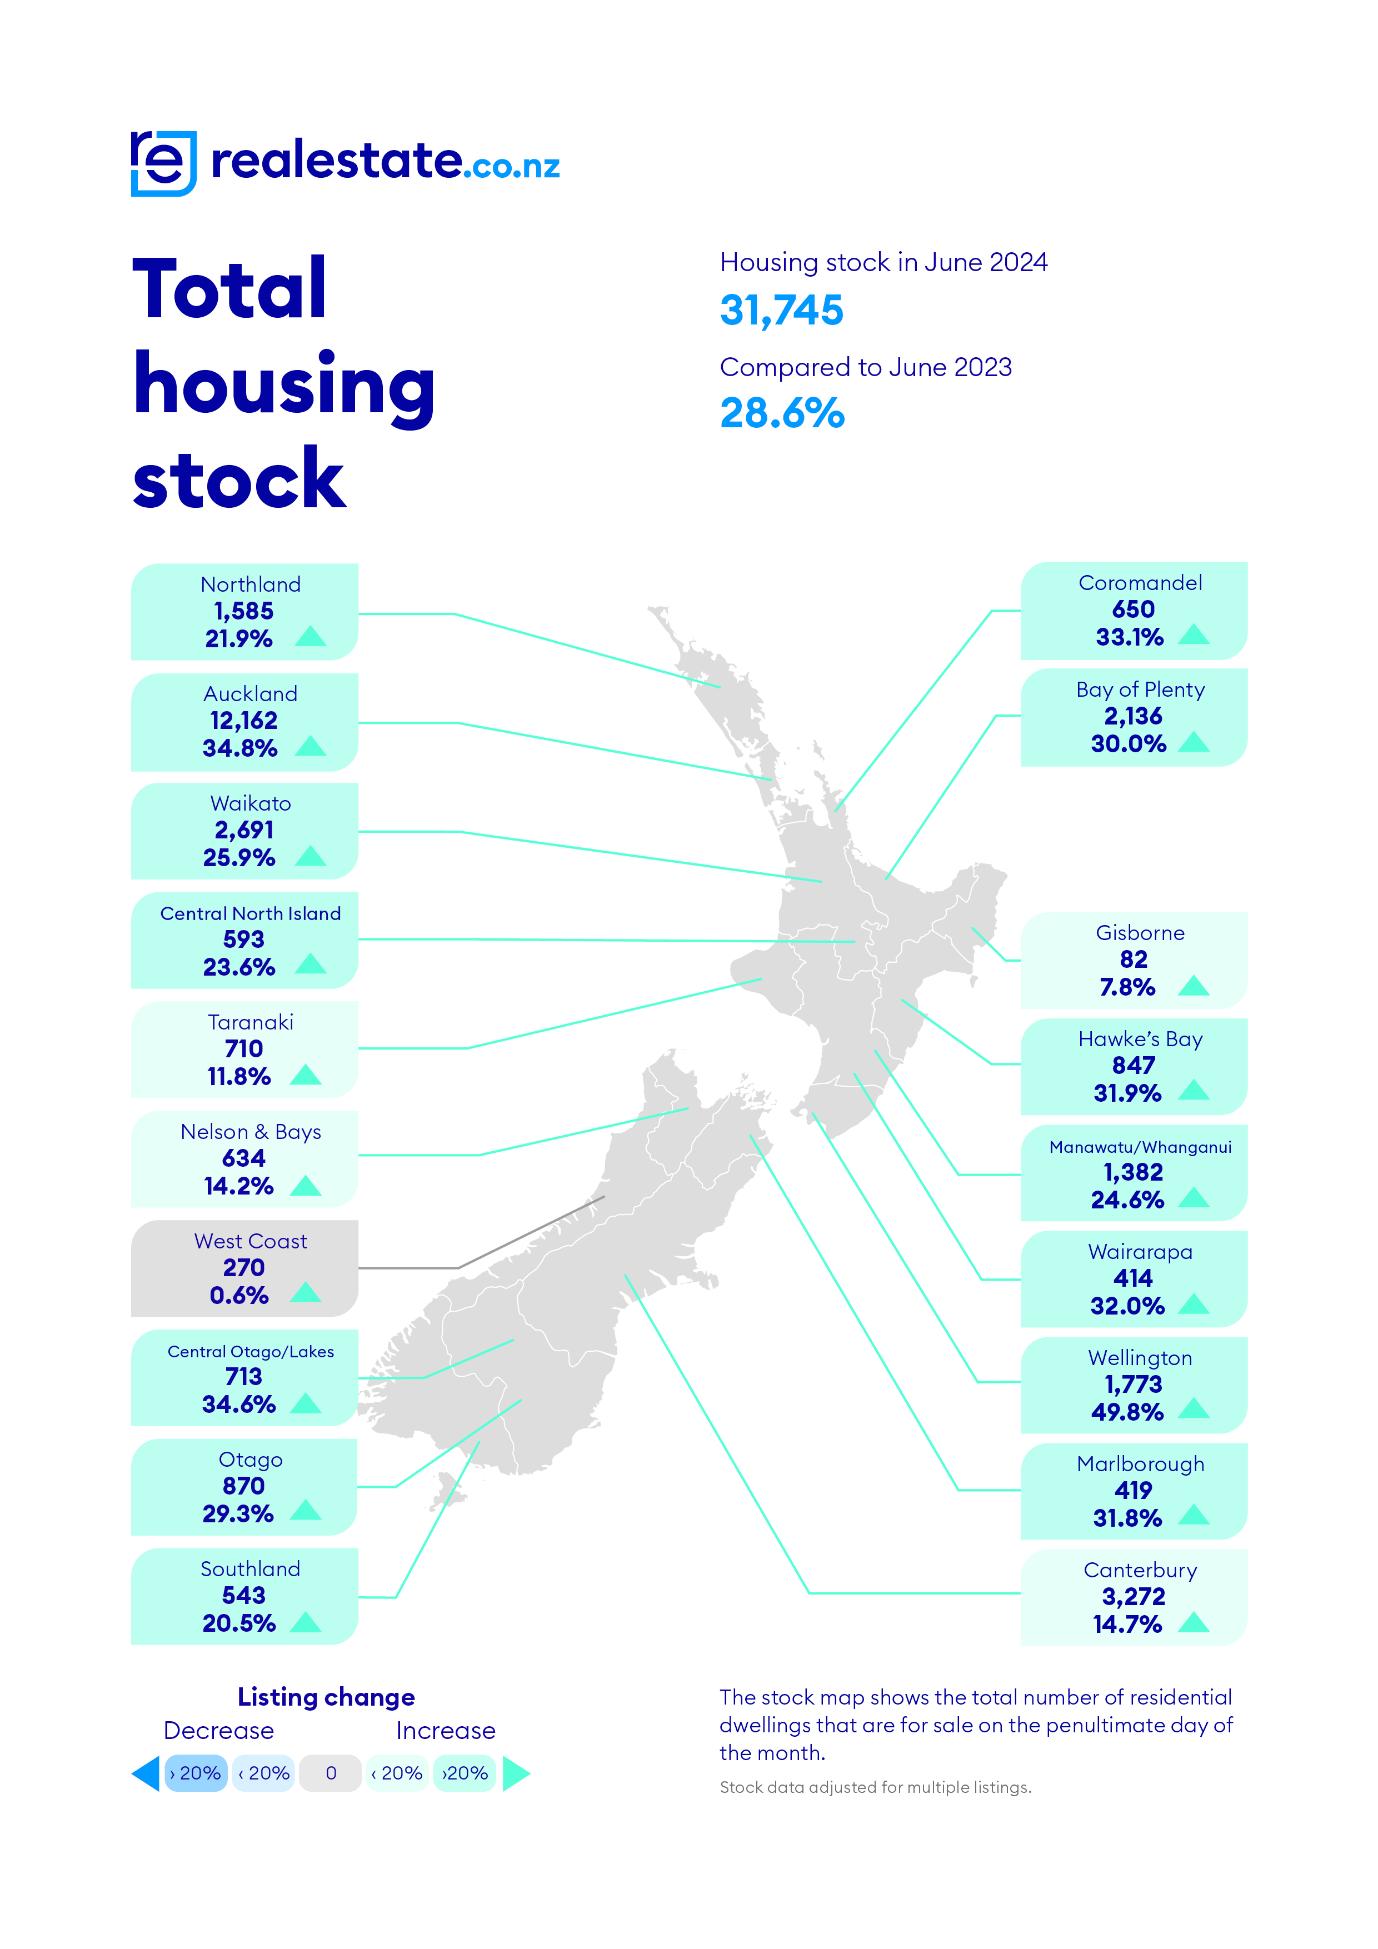
At the end of June, the national inventory level had increased 28.6% (+7,069) from 24,676 to 31,745 year-on-year and decreased 2.6% from 32,598 month-on-month. For New Zealand ex Auckland, inventory levels increased 25.1% (+3,929) year-onyear from 15,655 to 19,583 and decreased 3.2% compared to May 2024 (-647).
Nationally, listings increased by 25.5% year-on-year from 6,218 to 7,805. Twelve of the fifteen regions have seen a rise in new listings year-on-year, with significant increases in Wellington (+50.3%), Hawke’s Bay (+35.6%), Gisborne (+34.8%), Bay of Plenty and Canterbury (+33.6%), Auckland (+33.0%) and Otago (+23.4%).
Jen Baird CEO, REINZ

Only two regions saw a decrease in new listings year-on-year: Northland (-26.0%) and Marlborough (-11.8%). West Coast saw no change compared to June 2023 (49 new listings).
“The increased number of listings coming to market continues the trend we have seen all year, with high levels of choice for buyers nationwide. The winter months do tend to see fewer people choosing to sell, and this year is no different. Yet, regardless of the economic conditions, people’s lives change, they grow families and retire and need to make a property decision alongside those changes.”
“Salespeople are seeing some properties come to market due to high interest rates, cost of living pressures and changing employment circumstances.”
Across NZ, there were 489 auctions in June 2024, which was 11.2% of all sales compared to 551 auctions (or 9.4% of all sales) in June 2023. The Auckland region called over half of the auction sales completed nationally in June, at 264 auctions (20.5% of all Auckland sales).
Nationally, median Days to Sell decreased by one day, from 48 to 47 days, compared to a year ago. For New Zealand, excluding Auckland, median Days to Sell decreased by two days year-onyear, from 49 to 47 days. In 11 of the 16 regions, median Days to Sell were lower compared with June 2023. Northland had the highest days to sell at 71 days compared to 69 in May 2024 and 56 compared to this time last year.
The HPI for New Zealand stood at 3,573 in June 2024, down 0.7% from May 2024 and up by 1.3% year-on-year. The average annual growth in the New Zealand HPI over the past five years has been 5.4% per annum, and it is currently 16.4% below the market peak reached in 2021.
“There was a notable decrease in buyer activity in June and a reduced sense of urgency. As more listings come to a wellstocked market, those who are in the position to buy are taking their time to carefully select their ideal home. While winter has set in, we have just seen a slight change in tone coming from the Reserve Bank suggesting that this cycle of interest rate pain may have an end in sight. This is a key factor in both buying and selling decisions but also has an impact on overall sentiment within the industry.” adds Baird.
The Real Estate Institute of New Zealand (REINZ) has the latest and most accurate real estate data in New Zealand.
Media contact: Laura Wilmot Head of Communications and Engagement, REINZ
Mobile: 021 953 308
Amidstaraftofpolicychanges,therenewedweaknessin homevaluescontinuedinJune.
CoreLogic's House Price Index fell 0.5% in June, taking the quarterly change to -0.8%. The month-on-month decline was the largest drop in prices since June 2023, and continues a trend of minor falls seen in recent months.
Over the past 12 months to June, NZ house prices are up 1.8%, equating to a $16,000 boost in home owner wealth. The annual rise reflects the earlier but temporary 3.2% rise in prices between September 2023 and March 2024. That previous momentum stalled as high mortgage interest rates continue to restrict housing credit demand.
Each of the main centres recorded flat to falling prices over the month, with both Christchurch and Dunedin experiencing no change in June, the best performers.
CoreLogic NZ Head of Research, Nick Goodall said the last twelve months could be described as a dead cat bounce, with confidence perhaps misjudging the trajectory for mortgage interest rates.
"Inflation has remained sticky, particularly domestically, as the RBNZ has stayed true to their commitment of using monetary policy to bring consumer prices under control. It looks although interest rates could stay higher for longer, restricting borrower numbers and lending amounts."
Mr Goodall noted the latest lending figures from RBNZ showed a further evolution in the mix of lending for different purposes.
"In May, 24% of new residential mortgage lending was from borrowers changing bank loan providers. This is the second largest share on record, below only March 2023, when 26% of new mortgage lending was associated with refinancers switching banks. The two-year average is 20% and in December 2023 the share was as low as 18%.
"This change illustrates the persistent low levels of real estate transactions as a source of new mortgages for banks. With such a competitive lending environment, it's no surprise to see borrowers seeking out the best deal as lenders work hard to retain borrowers and attract new customers away from their competitors," he said.
CoreLogicHousePriceIndex
Click here for interactive version
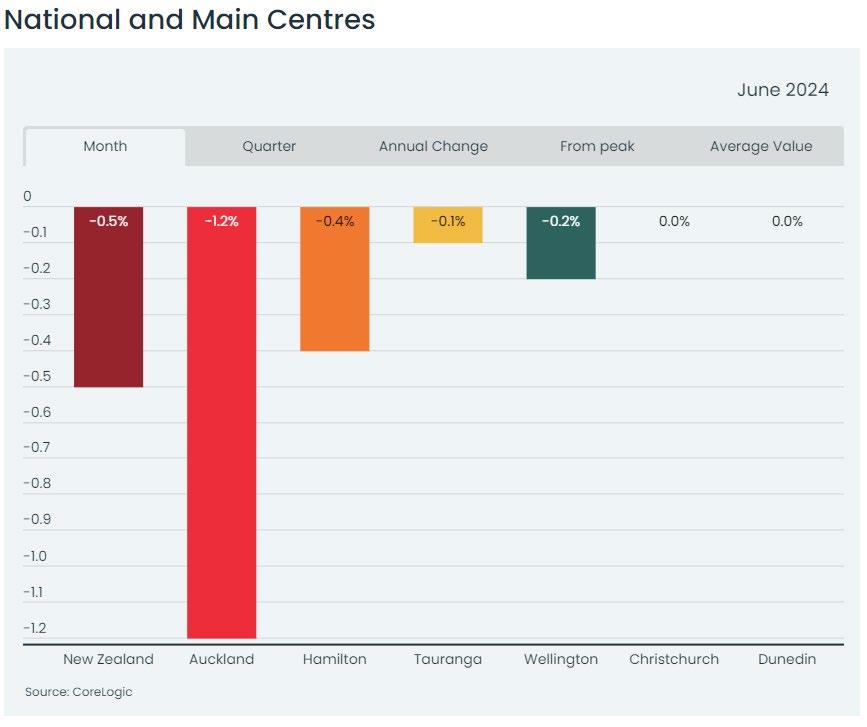
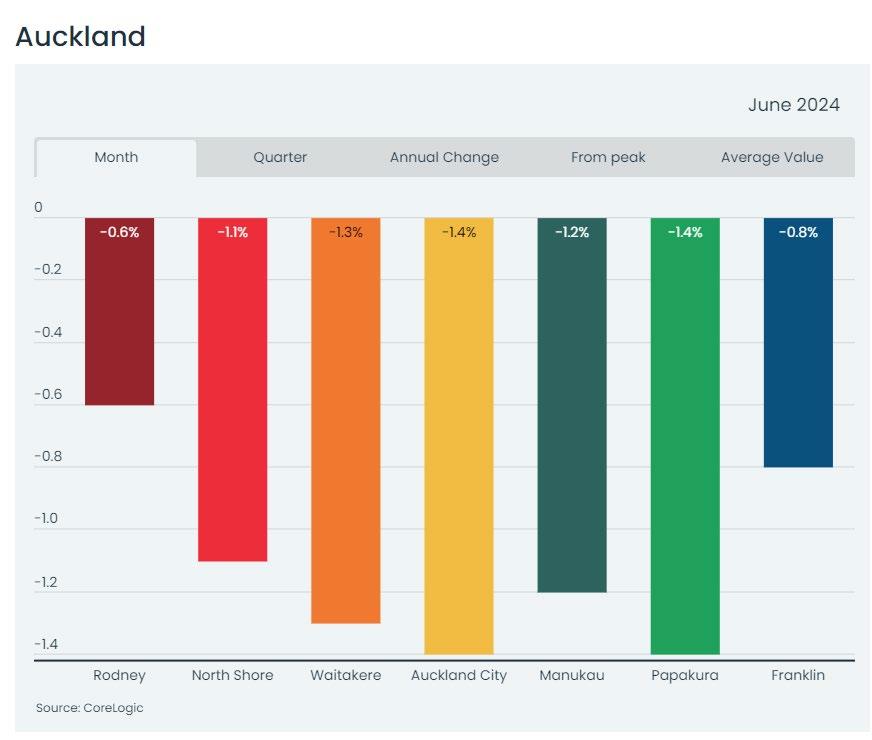
In June, Auckland's negative turn was prolonged, down -1.2% over the month, and takes the quarterly fall to -2.6%. This Is the largest quarterly drop in prices since August 2023.
Mr Goodall said Auckland's weakness was somewhat of a surprise but likely a reflection of affordability challenges, considering the share of average income required to service a typical new mortgage in the largest city of the country is 55%, compared to 43% in Dunedin.
The rate of value falls across Auckland's sub-markets was relatively consistent.
Rodney and Franklin, sub-regions further from the CBD, experienced slightly lower rates of fall over the month, while the more populous areas saw values fall by at least 1.1% in June.
“Its clear affordability remains an issue across the Super City, with the average value ranging from the high $800k's in both Papakura and Franklin to over $1.44m in both North Shore and Auckland City" Mr Goodall said.
"Despite strong population growth, due to high net migration, Auckland property values are going through a renewed period of weakness as a long-term improvement in supply, following strong new dwelling growth and an uplift in properties listed for sale suppresses vendor power when matched with cautious and composed buyers."
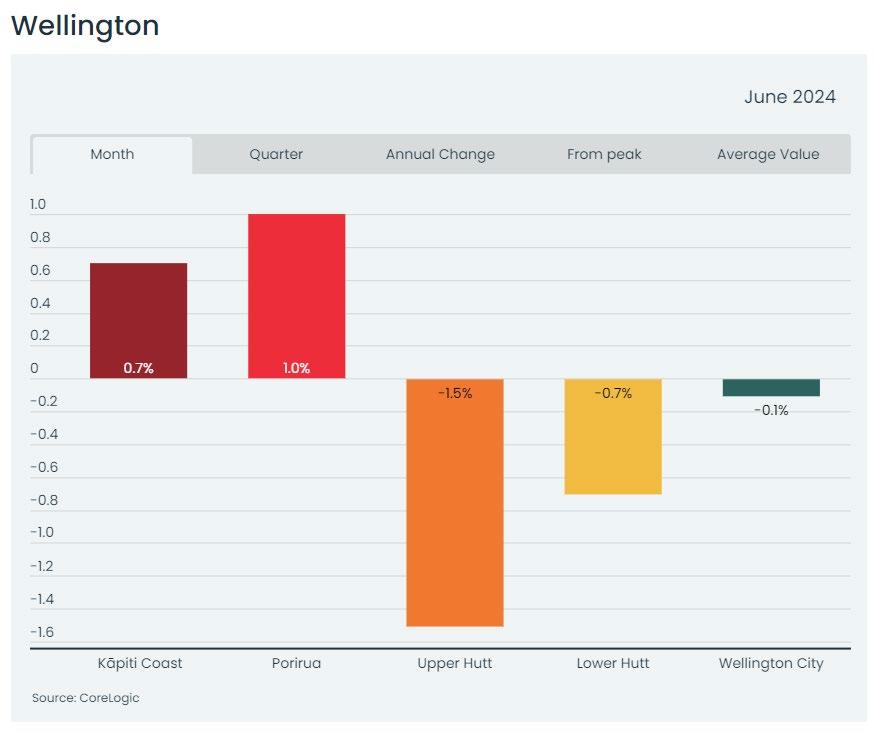
The Wellington area is defined by mixed results, with a weakness emerging in Wellington City and the Hutt region, in contrast to value growth in both Porirua and the Kāpiti Coast.
The 1.5% decline over June in Upper Hutt appears to be the beginning of a trend, while values in Lower Hutt have been effectively tracking sideways since the start of the year.
Mr Goodall said while nervousness remains around the capital as further details of public sector job cuts emerge, large scale job losses have yet to materialise, so this uncertainty is unlikely to have a major impact on recent property price movement.
"There's also caution among both owners and prospective buyers when it comes to making a significant financial commitment such as buying a first home, upgrading their current house, or purchasing a rental property, and so that will translate to reduced demand," he said.
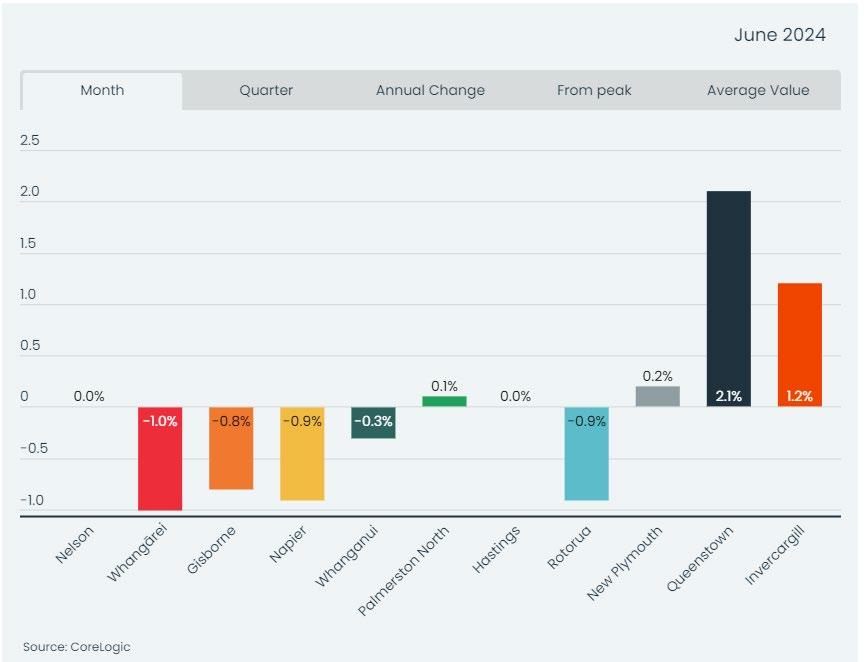
Across the main urban areas there aren't many experiencing any real growth, with the likes of Invercargill (2.1%) and Queenstown (1.2%) bucking the broad trend of flat or declining values.
"The variability of the market is seen with Invercargill as the most affordable urban area with an average value of $483,000, while Queenstown is the priciest at $1,820,000."
"Affordability challenges exist all around the country, while some of the smaller centres may also suffer from net-negative migration swings as young people head offshore for the promise of greater opportunities or simply an overseas experience," added Mr Goodall.
Looking ahead, Mr Goodall said there have been a number of changes attracting the attention of homeowners.
"While the 1st of July signals a raft of regulatory changes, they're unlikely to have a significant impact on the market either way. The shortening of the Brightline test to two years could see a further lift in already high listings levels, while the loosening of LVR policies is unlikely to see a flood of now-eligible buyers emerge. Meanwhile the formalised debt-to-income ratio limits are effectively non-binding while overall lending is contained by high interest rates.
"For that reason, a firm focus remains on the Reserve Bank's next meeting in mid-July. Recent adjustments to inflation expectations easing is promising, but the Bank is likely wanting to see firm evidence before truly debating a cut to the OCR.
"On the flipside, there's little to suggest the OCR could be increased, with the economy barely recovering from the recent double-dip recession. The decision should be a quick and easy one from the RBNZ to keep the cash rate on hold.
"Mortgage holders should continue to prepare for similar levels of interest rates for the rest of the year, and homeowners for the market upturn to underwhelm, especially with job security now declining," he concluded.


Goodnewsforcashed-upfirst-timebuyers,whoarebenefitingfrommorechoiceandlowerprices.

TheaveragepropertyvalueinKelvinHeights,Queenstown-Lakes,hasdroppedto$2.717minthelast threemonths.Photo/GettyImages
OneRoof research has identified the "biggest loser" suburbs, where value drops are delivering buyers discounts of up to $120,000.
The average property value in just over 500 suburbs has fallen in the three months to the end of June, according to the latest data from the OneRoof-Valocity House Value Index.
That's up from 322 suburbs in the three months to the end of May.
The analysis found that the size of the discount is also on the increase, with the average quarterly value drop for June $17,990, compared to $14,398 at the end of May.
The numbers are good news for cashed-up first-time buyers, who have benefited from more choice and lower prices.
OneRoof found 20 suburbs where the average property value dropped more than $50,000 in the last three months.

Click here for interactive link
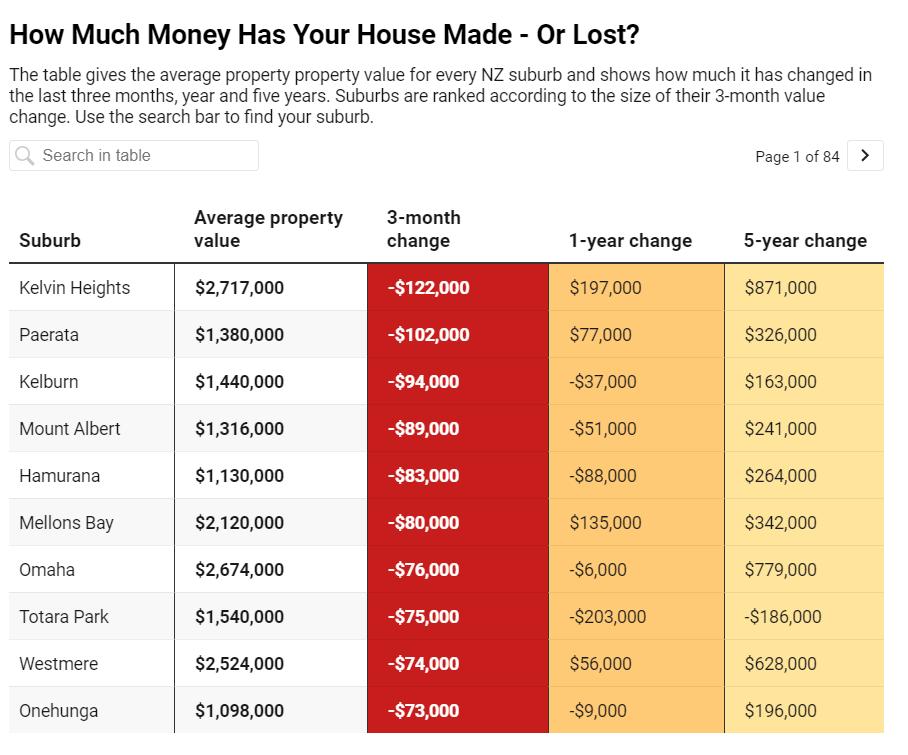
Most were in Auckland, but wealthy buyers in Kelvin Heights enjoyed the biggest benefits, with the average property value in the QueenstownLakes suburb down $122,000 to $2.717m.
Because the OneRoof research concentrated on the dollar size of the value drop, wealthier suburbs tended to be over-represented at the top of the rankings.
The list suggests where cashed-up buyers should concentrate their efforts before interest rates eventually come down and property start to rise again.
In percentage terms, Kelvin Heights' average property value dropped only 4.3%, but because of the values involved even small percentage shifts in the suburb can translate to big dollar discounts (it's 7.8% year-on-year rise meant it was up $197,000 on June 2023).
Bigger percentage drops in lower-value suburbs tended to deliver smaller dollar savings. Greymouth's average property value was down 5.5% over the quarter but that meant it fell just $26,000 to $447,000.
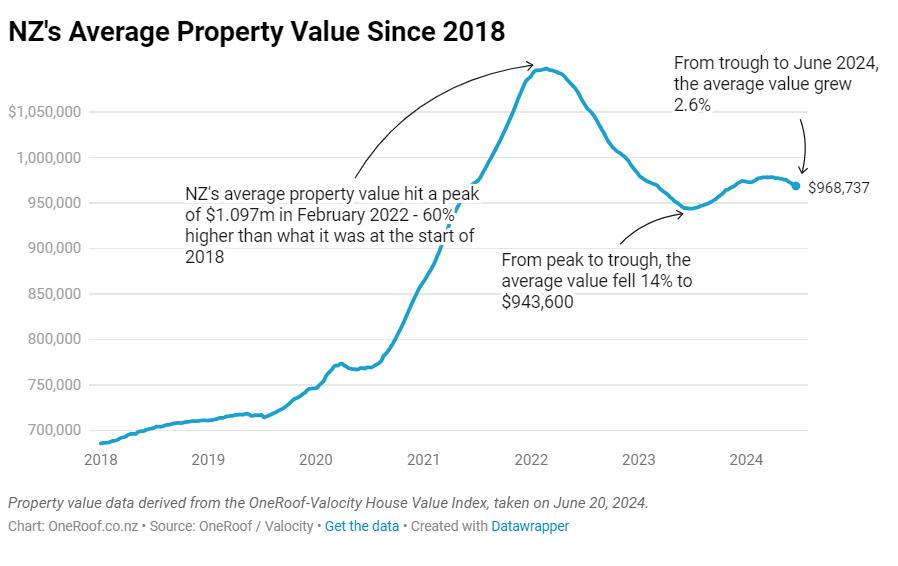
The latest OneRoof figures also show post-slump recovery is losing momentum, with the nationwide average property value down 0.9% to $969,000 in the last three months.
The OneRoof-Valocity figures showed quarterly value drops in 10 regions – up from the three recorded in last month’s house price report.
The downturn has accelerated in Auckland, with the region’s average value down 2.1% in the three months to the end of June, compared to -1.1% in the three months to the end of May.
Values also fell hard over the quarter in Hawke’s Bay (-2.1%), Wellington (-1.3%), and Nelson (-1%), while the average property value in West Coast went from quarterly growth of 4% to -0.2% within the space of a month.
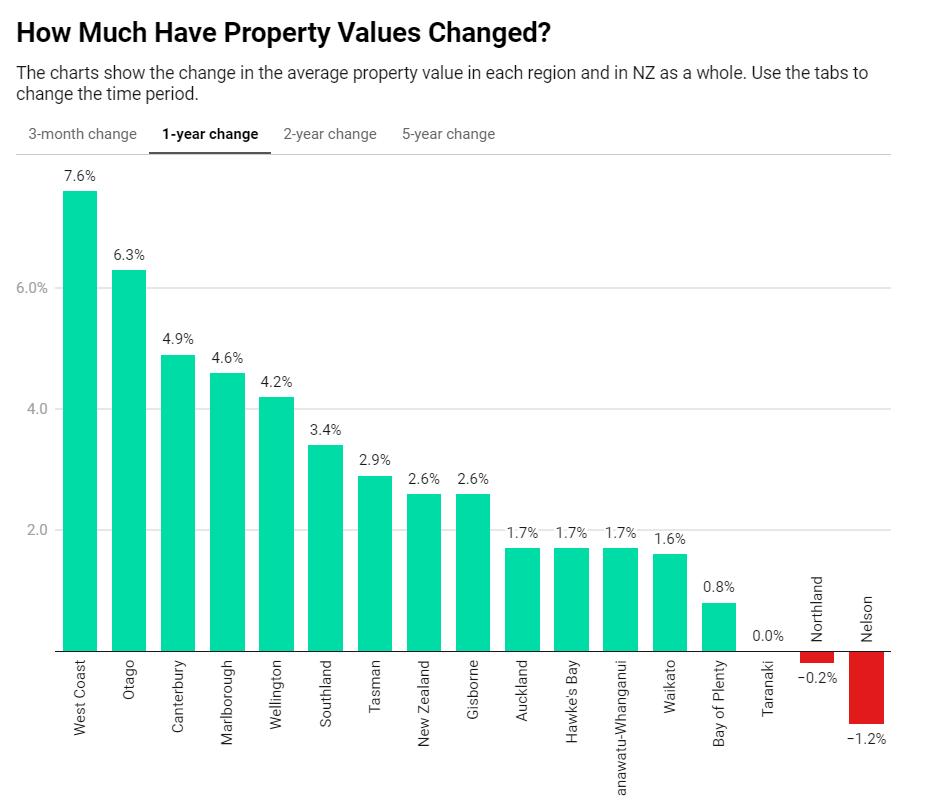
Thechartsshowthechangeintheaveragepropertyvalueineachregionandin NZasawhole.Usethetabstochangethetimeperiod.
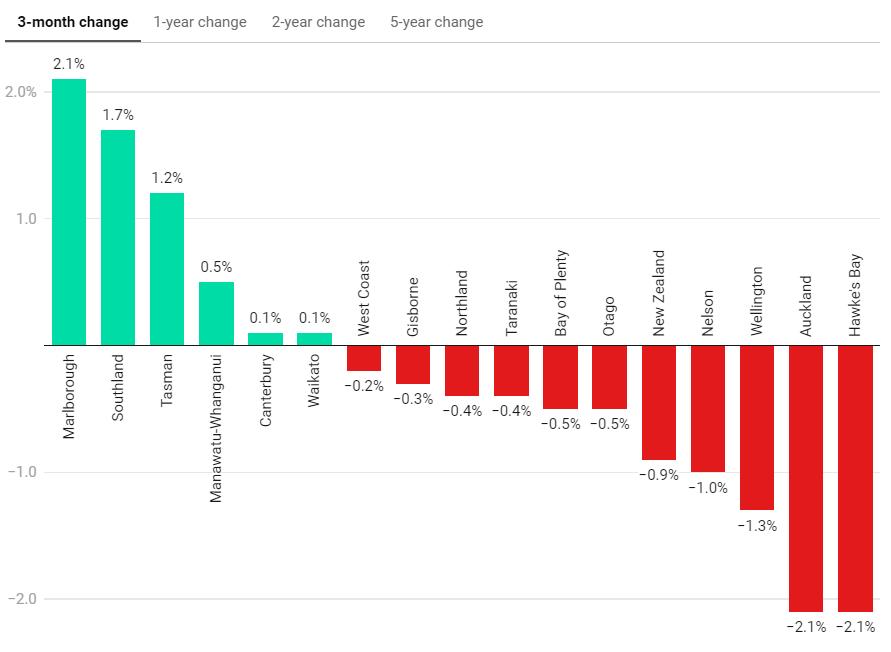
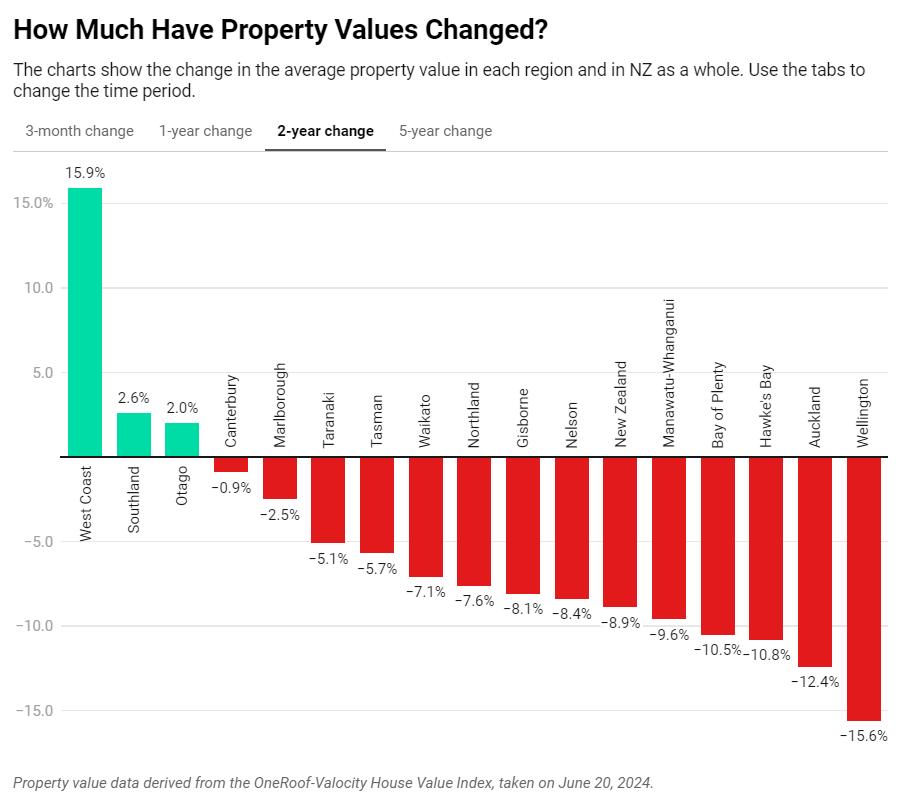
The sudden change in fortunes is noticeable in the other regions and reflects choppiness in the market.
Canterbury appears to be the country’s most stable region, with the slowdown in value growth in the last three months more a product of seasonality than other external pressures.
No major metro saw property value growth in the last three months. Outside Auckland, the downturn was strongest in Wellington City (-1.9%) and Hamilton (-1.8%).
Values in Dunedin and Christchurch dipped, but the cities appear to be weathering the switch to a buyer’s market better than the others. In Auckland, the biggest drops were in Manukau and Papakura. While house values in most regions are still above June 2023 levels, when the post-Covid slump reached its endpoint, growing economic uncertainty, the ongoing cost of living crisis and higher interest rates have eroded the strong gains homeowners made in the second half of last year.
However, other indicators suggest the market is rolling with the punches. New listings for the 30 days to June 20 were up 23% annually while sales for May were 10% higher than in May 2023 and May 2022 (although 10% below the 30-year average).
First-home buyers still dominate the market, but their share of new mortgage registrations has dropped over the last six months. Changes to tax and lending rules from July 1 could lead to extra competition from investors


national average asking price holds steady for another month.
The latest real-time data from realestate.co.nz shows that average asking prices were again stable during June, marking a full year and a half of unchanged prices nationally.
• New regulations on debt-to-income ratios, loan-to-value ratios, interest deductibility and the new bright-line rule are now in effect
• Price stability reigns, but West Coast returns to the bottom of the table
• Choices aplenty for renters, prices yet to catch up
• Expert advice essential in changing times
Total stock was up in all regions, increasing nationally by 28.6% year-on-year in June. Although stock was down by 2.6% compared to May, the total number of homes has remained above 30,000 for five consecutive months. New listings also rose by 25.5% year-on-year during June. However, this is a return to normal after low listing levels in 2023.
Sarah Wood, CEO of realestate.co.nz, says this is a significant period of price stability. But suggests that this week's new regulatory changes, including new debt-to-income ratios (DTIs), loosened loan-to-value ratios (LVRs), a more relaxed bright-line test, and earlier changes to interest deductibility, could impact the market:
“Anecdotally, real estate agents have reported a backlog of properties waiting to be listed until the new bright-line rules took effect on 1 July; as more landlords struggle to sustain their rental properties with such high interest rates.”
She adds, however, that the new regulations, paired with current market conditions, make it even more critical for those transacting to research their local market:
“Stable prices could benefit those looking to buy an investment property. However, with a large supply of rental properties currently available, new investment buyers will need to really understand rental demand in their area.”
“Those choosing to sell following the shortening of the bright-line test also need to price realistically. Some may struggle to get their desired price, especially if they bought at the peak of the market and potentially face selling for less than they purchased.”
Price stability reigns, but West Coast returns to the bottom of the table Southland saw the largest increase in its average asking price of any region, up 12.1% year-onyear. After holding the title of the most affordable region for three consecutive months, Southland was overtaken by the usually low-cost West Coast in June. The West Coast's average asking prices dropped 13.6% month-on-month to $476,892 after staying above $500,000 for three consecutive months.
Region Jun•23
Aud:loricl
B,ayofPktnty
CorrtffllUry
$1.()&l,72'
$936,140
$d.94.3S3
CoflltalNorthblo!XI '779.690
iS:IJic:1
Mol'IOWOlU/Wongo"""I
$438,454
HQrlbol'OU'l)h $110,619
N�klfl&BoyJ
$890.946
Nonhlol'ld se10.sn O,ogo SS,83,103
Southbnd
$470,998
Toro.no\:! '668,273
Wo!lcato
Apr•24
Sl.()68,216
S898.016 sno,996 UW,191
$1.576.905
$1))02,663
$617.149
$720.768
$626,.084
Si'eQ.041 ......733
$601.4$8.
SS97,ffl
$533,542
S703,la9
Moy•24 Jun•24 YoY MoM s,,ose,ois $1,042,203 _,_,,. • •LS" •
$&94,979 S89S.199 •4.4""- • "·""
Sn4.ls.t $699.036 "'"" -2.1% • sno.122 $784,567 ..... l1% --Sl,•M0,97� $1,412.262 ......
SJ,084.S9l
$670,156 $62&,333 ·- • ·6,2% • -
$76-3,583
$61$,r.38
$763,451 l.l� .....
$611.003 .......• ..,,,.•
$1$9',511 S"3.)$1 ..... ,...
$&33A29 $901.263 '·"" ..,,.
$621,710 $&46,143 •2.6� • ,_
$5-97,671
$6'9,132 ..,,. .....
$53'3,ffl .$528.139 12-"' ...... • S670,OM ........ .,... • ·l.1% •
$716.520
$818,�S Woirnropo
$737,6S3 .....,,.
U.53.587
SS39,7AS
$865,796
$814,641 $808,113 .,... • ..,...•
S7•11,.6\S $741,534 3.5"'- ......
5736.,033 s.&18.352 •t5"" • 10.9%
&552,179 $.476.892 •tf>% • ·13.6%,,
S8H,ffl SU1i260 ......... • 0.3%
Theo�rogeask.ingpric:oisc:.olc:ulotedbytoklng everyJMidentiollisting'siOOicotedaskingpriceond di�ingitbythetotalnumberofp,openies. A,l..,gp...:t>,forf>(J!ltl!1•ngcok\11Qk'l101 iov..l"O)fod..,1M p1.c•iul-1"'9X13,,!�!MA..,,o:�
In Wellington, average asking prices returned to normal, rising 10.9% month-on-month to $818,352. This increase brought the capital's average asking price back above $800,000 after an unusual dip in May.
Nationally, and in the Bay of Plenty, Manawatu/Whanganui, Waikato, and Wairarapa, prices remained static between May and June, with changes of less than 1.0%.
“Prices have fluctuated between $860,000 and $890,000 since November 2022. That’s a year and a half of buyers and sellers facing some level of certainty around prices, which is a silver lining in an uncertain economic environment.”
In the meantime, Wood advises sellers to ensure their property is well marketed, work with a real estate agent experienced in selling their type of property and take the time to understand market insights and local price expectations:
“Understanding your local market will be more important than ever now that DTI ratios will cap how much a buyer can spend at six times their income.”
Choices aplenty for renters, but prices are yet to catch up
People looking for a rental property had plenty of choice last month. Compared to June 2023, new rental listings were up nationally by 26.9%. Despite a 10.4% decrease from May’s unseasonal new listings jump, this is the second consecutive month of high new rental listings.
Wood suggests that financial pressures on investors could be driving the surge in new rental listings, perhaps leading them to convert short-term rentals and Airbnbs into longer-term rentals.
"Additionally, some landlords may have planned to sell with the new bright-line rules in July but have reconsidered after evaluating average asking prices, opting instead to place their properties back on the rental market."
Up 5.9% to $653, the average weekly rental price increased nationally and in all regions year-on-year, except Wairarapa, where it decreased by 1.2%.
Month-on-month, the national average rental price remained relatively unchanged, down just 0.9% from the all-time high of $660 recorded in May. Notably, Waikato reached an all-time rent high of $572, marking record rental prices for the region in three of the last four months. Wood observes that the increase in new rental listings has not yet impacted average rental prices:
“Landlords report a challenging environment. Even after lowering prices, some have found interest from potential tenants remains low, indicating a softening rental market.”
Northland 46weeks LTA:73
Auckland 33weeks LTA:22
Waikato 27weeks LTA:29
Central North Island 32weeks LTA:52
Taranaki 24weeks LTA:22
Nelson & Bays 22weeks LTA:21
West Coast 25weeks LTA:108
Central Otago/Lakes 28weeks LTA:53
Otago 22weeks LTA:20
Southland 18weeks LTA:25

NZ Inventory of listings for June 2024 26 weeks
Compared to Long Term Average (LTA) 26 weeks

Rate of sale Decrease Increase
Coromandel 52weeks LTA:102
Bay of Plenty 28weeks LTA:33 Gisborne 7weeks LTA:28
Hawke's Bay 22weeks LTA:25
Manawatu/Whanganui 24weeks LTA:27
Wairarapa 31weeks LTA:53
Wellington 15weeks LTA:15
Marlborough 29weeks LTA:33

Canterbury 15weeks LTA:21
Rate of sale means if no new listings were to come onto the market, all the existing properties in each region would be sold within the number of weeks stated, based on historical trends.
The inventory levels reflect the projected number of weeks to clear existing inventory of unsoldhomeson themarket matchedtothe Long Term Average (LTA) for the region basedon 17years of seasonally adjusted data.
Northland 46weeks LTA:73
Auckland 33weeks LTA:22
Waikato 27weeks LTA:29
Central North Island 32weeks LTA:52
Taranaki 24weeks LTA:22
Nelson & Bays 22weeks LTA:21
West Coast 25weeks LTA:108
Central Otago/Lakes 28weeks LTA:53
Otago 22weeks LTA:20
Southland 18weeks LTA:25
NZ Inventory of listings for June 2024 26 weeks
Compared to Long Term Average (LTA) 26 weeks
Rate of sale Decrease Increase
Coromandel 52weeks LTA:102
Bay of Plenty 28weeks LTA:33 Gisborne 7weeks LTA:28
Hawke's Bay 22weeks LTA:25
Manawatu/Whanganui 24weeks LTA:27
Wairarapa 31weeks LTA:53
Wellington 15weeks LTA:15
Marlborough 29weeks LTA:33
Canterbury 15weeks LTA:21
Rate of sale means if no new listings were to come onto the market, all the existing properties in each region would be sold within the number of weeks stated, based on historical trends.
The inventory levels reflect the projected number of weeks to clear existing inventory of unsoldhomeson themarket matchedtothe Long Term Average (LTA) for the region basedon 17years of seasonally adjusted data.
Wood predicts that buyers and sellers are likely experiencing confusion. She expects that some will be watching and waiting to see the impacts of new regulations on the market before transacting:
"Typically, Kiwis don't like to transact during uncertain times. Right now, there's a lot of economic uncertainty, acronyms to decode, and property market regulations to process."
“The good news is that the slower pace of the current market allows buyers and sellers more time to conduct due diligence and seek expert advice.”
She adds that the most common method of sale during June was ‘display price’, which makes the negotiation process more transparent.
For media enquiries, please contact:
Liz Studholme | liz@realestate.co.nz
Written by Liz Studholme

Gavin Lloyd talks through the latest numbers

The cautious optimism about a halt in sliding property values across Aotearoa post election has well and truly vanished. The month-on-month gains seen across many regions earlier in 2024 have been replaced by little movement and in some regions, declines. The driving force behind recent trends is the shift towards a real buyers market with no “FOMO” (fear of missing out) impacting buyers’ decision making. The recent introduction of regulatory changes by the government, along with the upcoming easing of LVRs (loan to value ratios) are yet to have any meaningful impact on the market. When combined with high interest rates and enhanced buyer choice due to the high volume of new listings, it is no surprise that we have seen subdued average asking prices.
The South Island is the standout when looking at regions where we have seen year-on-year growth. This is underpinned by a consistent Canterbury market that continues to show resilience post earthquake but the other three regions which have shown growth through a challenging market have been Marlborough, Southland and Otago. Certainly, this is in contrast to most of the North Island, where most regions have fallen behind where they were 12 months ago.
Marlborough has been a standout for the past 24 months with average asking prices pushing through the $700k barrier and continuing to climb to a record high of $781,000 back in March this year. This is up significantly from the $532k average asking price four years ago, in March 2020. It would appear that Marlborough has certainly been a location that has benefited from the regional shift we have seen post Covid. This is evident in the job market in the region with both the number of roles advertised and the salary increases being some of the highest we have seen on Trade Me Jobs.
The deep south has also been particularly resilient. Southland’s average asking price is up 4.9% on May 2023, predominantly driven by Invercargill where its recovery has been rapid through both the spring and summer selling seasons. Otago is another market that has remained strong; Dunedin has been stable compared to areas across Aotearoa of a similar size but the Queenstown Lakes continues to buck the national trend with record average asking prices set through this summer period, although this does now seem to be trending down.
As mentioned at the start, the current setup with high interest rates and plenty of choice for buyers is set to continue for the winter period. If anything, we might even see more listings come to Trade Me Property during July as the shortening of the Brightline Test comes into play. Given these circumstances it is safe to assume that any growth in average asking prices will be subdued. That said, as we have seen there will always be exceptions and some regions and suburbs could continue to see growth.
Author

Gavin Lloyd Sales Director, Property - trademe.co.nz
Town&Country
Wheretheonlyresultthatmattersisyours!

ISSN: 2703-2825 4 July 2024
Sign up for free at www.tonyalexander.nz
The main thing worth noting about releases of economic data over the past week was in the ANZ’s Business Outlook Survey released on Thursday.
You may recall that last week I wrote about monetary policy in terms of four boxes representing interest rates going up, household spending being crunched, business pricing behaviour changing, and then inflation falling. The data are relevant to box number 3.
The net proportion of businesses saying that they plan raising their selling prices over the coming year has just fallen to 35% from 42% in May and 47% in April.
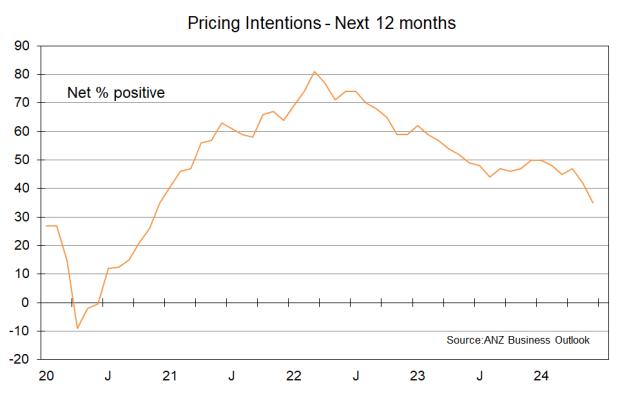
This measure has averaged 25% during the period since 1992 when inflation has averaged about 2.3% a year. So, to be consistent with that desired low inflation rate it seems reasonable to believe that the Reserve Bank won’t have any interest in sending a signal of monetary policy easing soon unless the measure is at least down at 25%.
However, don’t get optimistic about interest rates falling sharply soon (though when they move, I think the initial decline will be rapid). The average rate of growth in our economy over the past three decades has been about 2.7% a year. So, the equilibrium situation is one where inflation is just over 2%, growth above 2.5%, and the net proportion of businesses saying they will raise their prices in the coming year is about 25%.
But our economy has flat-lined. You would expect that in the absence ofany growth and witha sharp decline underway in per capita output, that the business pricing measure would be appreciably below 25%.
The Reserve Bank is not going to hint at a smile on their face regarding the inflation fight until the business pricing gauge is well below 25% and we are probably many months still away from that.
Until then we can expect the number of stories in the media about struggling businesses to grow. More restaurants will close - and the issue there is not just high interest rates but the food cost nowadays outweighing the desire to celebrate one’s special occasion.
House construction will decline further and getting a tradesman will be a lot easier. But willingness and ability to do so will be compromised by soaring household expenses for insurance and rates with promises of rates bills becoming unaffordable for many in just a few years.

More retailers will close down and restructure and for those with the capital to spare some good opportunities will open up for locations and perhaps securing franchises on offer.
The ANZ survey shows that the net proportion of businesses having a positive outlook for the coming year has fallen to just 6% from a recent peak of 37% in January. Again we see a variable which has fallen sharply in the first half of this year.
This type of deterioration would not have been anticipated by the Reserve Bank when setting monetary policy and given the slowness with which they tend to realise the ground is shifting under them they may not understand the economy is tanking until very late this year. That is when they will likely ease quickly with permission to do so delivered by the low pricing intentions measure come the December quarter.
The net proportion of businesses planning to hire more people recovered to 0% in June from -7% in May. But like all these monthly measures the actual outcome can vary quite a bit around
whatever the trend is – which in this case is downwards.
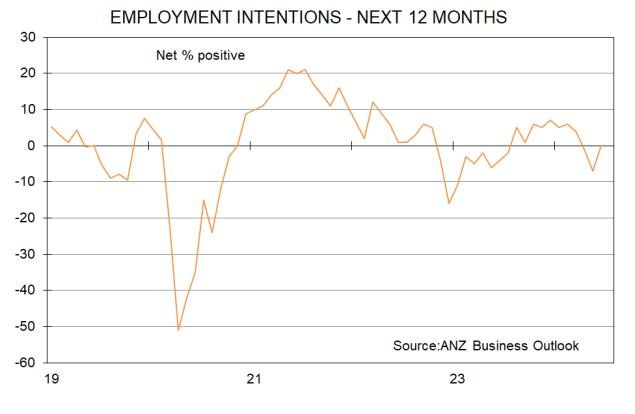
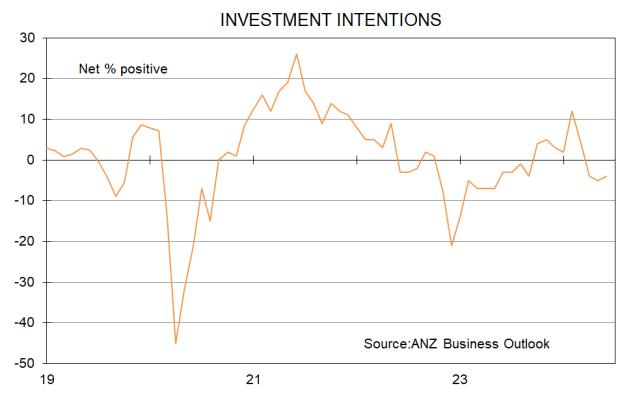
Net investment intentions came in at -4% from5% in May. Businesses plan spending less on boostingtheircapacityand/orproductivityand this is a result which comes through in my own monthly survey also.
This next graph shows the extent to which expectations of one’s own levels of activity in the coming year are above or below average. I like it because it allows us to place some perspective around commentary coming out of particular sectors.
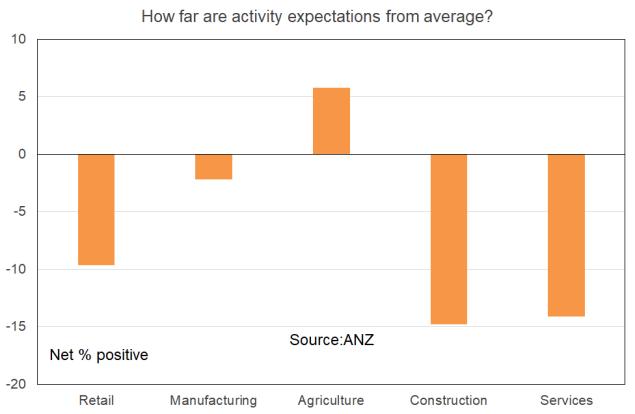
Thingsare genuinely on the very weakside for the construction and services sector and weak for retailing. But manufacturing is not expected by operators in the sector to be all that different from average in the coming year. In farming things are expected to be better than average.
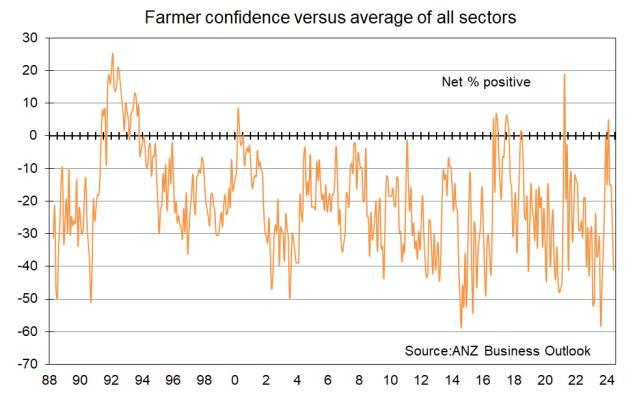
Farmers are very good at painting a negative outlook for their still subsidized sector in the media, even when the exchange rate is well in comfortable territory, and they are not experiencing the customer collapse hitting the retailing, hospitality, and home building sectors. Costs are rising, as they are in all sectors.
This final graph compares the confidence level of farmers with confidence across all sectors in the ANZ survey from 1988. It is extremely rare for farmers to be more confident that other businesspeople. In fact, on average since 1988 a net 15% of them have had a bad outlook versus average 10% positive outlooks for operators in construction and services, 7% in retail, and 4% in manufacturing.
Assisted by some weaker than expected data in the United States raising expectations of rate cuts there from September, from good pricing intention measures here in NZ, wholesale interest rates have edged lower this week at the shorter end of the yield curve.
But the movements have been small as the markets await the next review of monetary policy by the Reserve Bank on July 10. No change in the 5.5% official cash rate is expected and no hint of bringing forward their planned timing for the first rate cut from the third quarter of next year is envisaged.
If I were borrowing at the moment, I would take a mix of 6 and 12 month fixed rates and expect to make a similar decision in 6-12 months time.
Nothing I write here or anywhere else in this publication is intended to be personal advice. You should discuss your financing options with a professional.
Feel free to pass on to friends and clients wanting independent economic commentary
ISSN: 2703-2825
Sign up for free at www.tonyalexander.nz
Most people when considering the currently weak and depressed state of the New Zealand economy will blame the Reserve Bank. I have come across a lot of enmity directed towards the current Governor and myself have delivered criticism of the bank’s failure to recognise the strength of the economy through 2021.
They kept pumping money into the economy and held interest rates too low for too long despite having the largest group of economists in the country who should have seen the economy did not need that sugar any longer. If you are losing your business this year then you can rightly blame the Reserve Bank’s2021 incompetence to a great degree.
But there is more in play than just their change in rolefromastabilisingto adestabilisingforce in the economy.
There has been a lot of special assistance provided to our economy over the past quarter of a century and we have had our own version of what the Americans used to call the “Greenspan put”. This was a reference to the way that the Federal Reserve would quickly step in to cut
20 June 2024
interest rates and boost growth if the US economy started to look unusually weak. It was notably associated with the cuttingof their overnight funds rate to 1% in 2002.
When the Asian Financial Crisis struck New Zealand over 1997/98 at the same time as there was an extended drought we saw a quick easing of monetary policy. The yield on 90-day bank bills (the current cash rate was not introduced until March 1999) fell from over 9% early in 1998 to 4.5% by the end of the year. Note that. When our central bank acknowledges policy needs to be eased they act quickly and interest rates lose height at a fast pace.
When the dot-com sharemarket crash happened in 2000 the NZ economy eventually weakened and the official cash rate was quickly cut from 6.5% early in 2001 to 4.75%. The assisting factor back then was ham-fisted policy implementation by the new Clark-Cullen Labour government and the ”winter of discontent” in the business sector.
When our economy entered recession in 2008 and shortly after the GFC happened the cash rate was slashed from 8.25% to 2.5% within ten months from mid-2008.
Then we went down the rabbit hole in the latter years of the2010sdecade. Inflationfailed tospark following the GFC ending and deflation worries gripped the Western world from around 2018. As a result, despite the unemployment rate ending 2018 at 4.3% and the economy recording 3.5% growth that year the Reserve Bank cut the cash rate to a record low of 1% through 2019.
Then whenthepandemicstruck and theyhad little ammunition left for the cash rate weapon they embarked on their huge money printing and cheap bank funding exercises.
The upshot and the point I wish to make is this. In the past when the crap has hit the fan the Reserve Bank have jumped in to save the day with large policy easing. That is not happening now.
We are back deep in the excrement with the economy recording barely any growth for a year and a half. Jobs growth stopped in the middle of last year, retail spending volumes per capita are down almost 11% from two years ago, government debt levels have blownout these past six years for zero reward to our society, house construction is falling rapidly and we Kiwis are doing what we’ve always done when this dystopia comes along. We’re leaving. The net Kiwi migration loss has hit a record 56,500 in the past year.
So now the kicker. Despite all of this woe the Reserve Bank are not riding to the rescue. We know they want to because they are cut from the same woke cloth as the previous government. But they can’t because inflation is 4% and forward measures of where inflation is going remain much too high for even us RB-bashing private sector economics to demand they cut rates now. I wouldn’t.
My view is that by the December quarter of this year the extent of weakness in the economy will be great enough that the Reserve Bank’s anticipation of extra lagged decline in inflation because of that will overwhelm potentially still worrying forward pricing measures to encourage policy easing.
But before we get there the pain is going to get a lot worse. The media will be filled with many more stories of woe across a lot of sectors and especially the three I’ve been highlighting for a long time. They are retailing, residential construction (the cream is rising to the top in that sector), and hospitality.
So, what do I mean by the title of this article –when the tide goes out?
It is a reference to the very well known comment made by Warren Buffett.
“Only when the tide goes out do you learn who has been swimming naked.” (I couldn’t find when he first said it. Maybe 1994.)
It means when the tide is rising all boats are lifting, businesses and households are doing well, mistakes get quickly covered up, risk taking does not seem risky at all, and almost any fool can do okay. But take away the extraordinarily generous economic conditions and those with insufficient ability and capital will be left naked and exposed, their inadequacies on show for all to see.
That is what is happening now. Without the Reserve Bank’s sugar and without their quick throwing of such sugar on the economic fire when times are tough the undercapitalised, over-optimistic, least experienced operators across all sectors are being exposed. This year is about many of them getting weeded out. That also means this year will prove to be the best for those who have ridden the tides over the years because they will pick up discounted assets.
This year therefore presents the best opportunity for a productivity boost that we have seen for a long time. Capitalism needs periods when low yielding assets get reallocated to better yielding activities, and ineffective managers of assets and capital get trimmed away. It is painful but it is also necessary. The unfortunate thing is that the pain will hit many people who have no experience of fending for themselves without special central government or Reserve Bank assistance. They can’t find the “safe space”.
They are the ones I feel sorry for. This is new to them, whereas older folk who have lived through the reform years have seen worse.
The weeding out can’t be stopped. But as noted here previously, it would be a good idea to keep an especially close eye on your friends and relatives who may be struggling. They may have been raised in a schooling environment where risky play was discouraged and they haven’t built the resilience yet to handle falls and knockbacks by themselves. They won’t understand what is going on and that may be where the personal attacks against high ranking people come from.
The state of the economy, housing market, and general feelings of people will get worse before things improve through 2025.
This week I released results of the monthly survey of mortgage advisers which I run with mortgages.co.nz.
The main themes to come through from the statistical and anecdotal responses include these.
• First home buyers are backing away from the housing market.
• Investors are showing some new yet still mild interest in buying while the market is weak.
There have been some decent declines in wholesale fixed interest rates over the past few weeks, mainly in response to falls in US rates. But poor economic data here have helped as well.
The one year swap rate has declined to near 5.35% from 5.5% just under a month ago. The three year rate has fallen to near 4.6% from 4.9%, and the five year rate to near 4.34% from 4.7%.
But before anyone gets too excited, it pays to note that this is just an unwinding of an earlier selloff in these rates. The two graphs here show us that one cannot say yet that downward trends are in place.
This means that if the recent slight widening encourages some banks to cut their fixed mortgage rates, the declines are likely to be quite small – as they were earlier this year.
Looking ahead the next review of the Reserve Bank’s official cash rate happens on July 10 and no change is likely as we await more data relevant to inflation.
If I were a borrower, what would I do?
If I were borrowing at the moment, I would take a mix of 6 and 12 month fixed rates and expect to make a similar decision in 6-12 months time.
Nothing I write here or anywhere else in this publication is intended to be personal advice. You should discuss your financing options with a professional.
Commentary by CoreLogic NZ Chief Property Economist, Kelvin Davidson

Today’s decision (Wednesday 10th July 24) by the Reserve Bank of New Zealand (RBNZ) to leave the official cash rate (OCR) unchanged at 5.5% was fully expected, because, after all, inflation itself remains above the 1-3% target, with domestic price pressures such as council rates and general insurance still problematic. However, their (short) written statement that accompanied the decision arguably had a softer tone, with perhaps the first hints of OCR cuts down the line.
The key phrase seems to be the last paragraph of their statement: “The Committee agreed that monetary policy will need to remain restrictive. The extent of this restraint will be tempered over time consistent with the expected decline in inflation pressures.” In other words, although they envisage the OCR remaining above ‘normal’ for a while yet, it can still fall, so long as inflation moves downwards in line with their expectations.
The focus will now quickly shift to the next, full Monetary Policy Statement on 14th August. That decision will be accompanied by detailed forecasts, including projections for inflation and the OCR itself. Given the continued weakness of the economy in recent months, there is a chance August’s statement could be the one where the RBNZ more markedly softens their tone, and perhaps starts to lay the groundwork for an OCR cut as early as November.
Of course, we can’t forget that inflation is back to being the sole target of monetary policy, and the RBNZ will be hugely wary of cutting too early. But February (which is a broad consensus at present for the first rate cut) is still seven months away, that’s a long time for already-struggling firms and households to be stuck with interest rates where they are.
Today’s decision doesn’t really mean too much for housing, and market conditions look set to stay in favour of buyers for a reasonable period of time, or at least those that can afford and secure the finance. Indeed, the shortening of the Brightline Test could simply add to the already high level of available property listings on the market, given that some cash-strapped investors are likely to sell a bit earlier than they originally anticipated.
However, there could now just be some light emerging at the end of the mortgage rate tunnel, and although they might not necessarily fall straightaway or particularly quickly, any drops would no doubt be welcomed by borrowers. To be fair, there’s already been a drift lower for rates in the past few months, but OCR cuts would clearly add some impetus.


Town&Country


48ASinclair Road,Ararimu
§S b3 �-
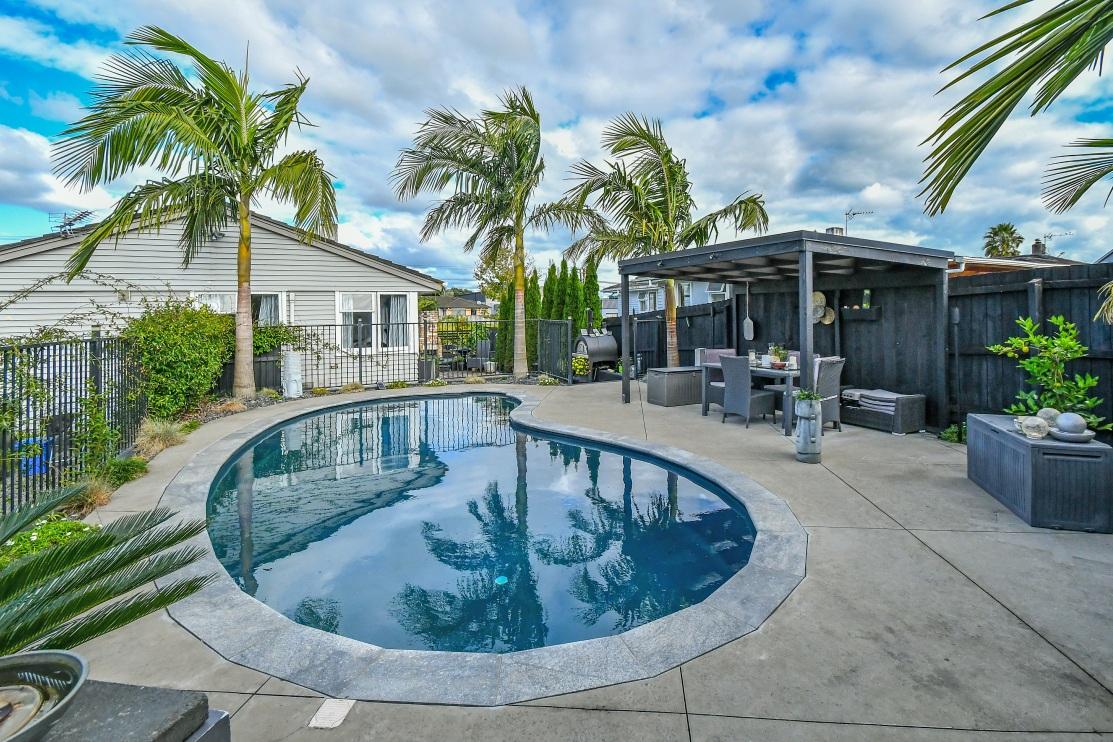
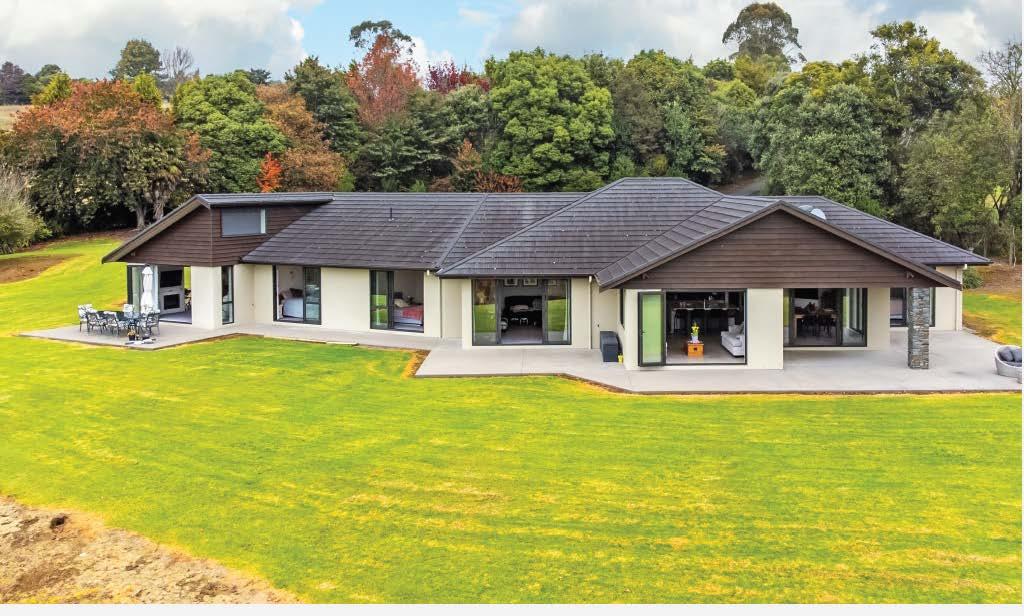
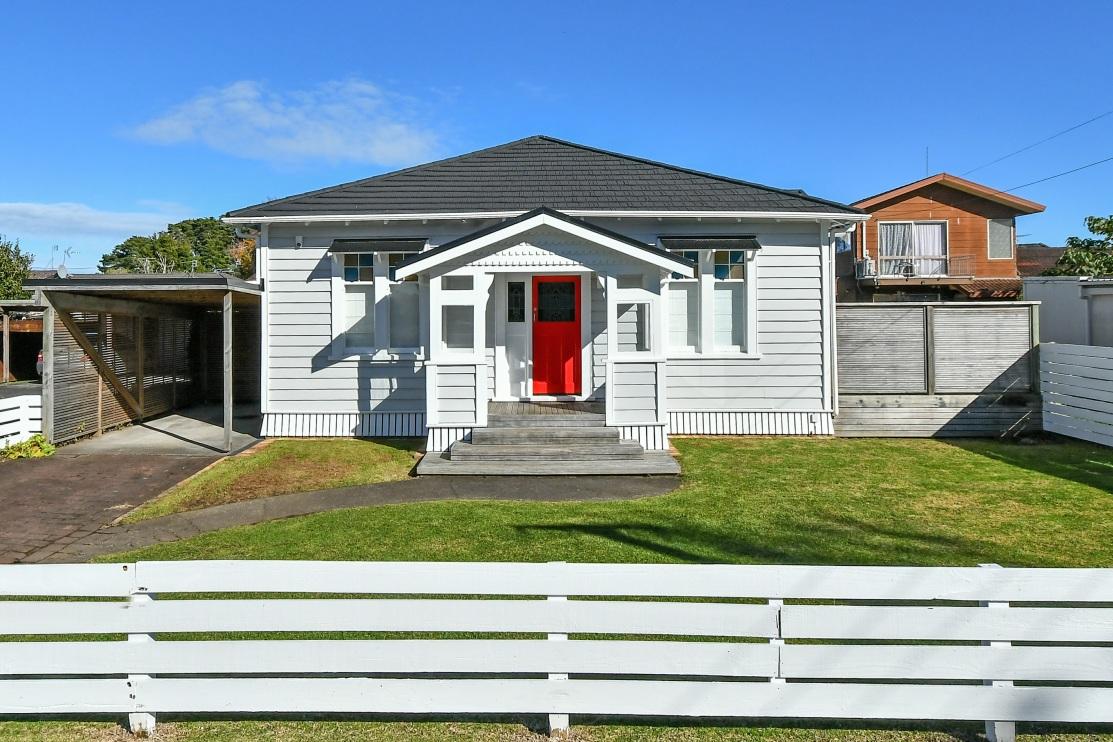
Private Tranquil Hideaway Nestledinatranquilsettingjustashortdrivefromthe motorwayliesanexceptionalpropertywait...
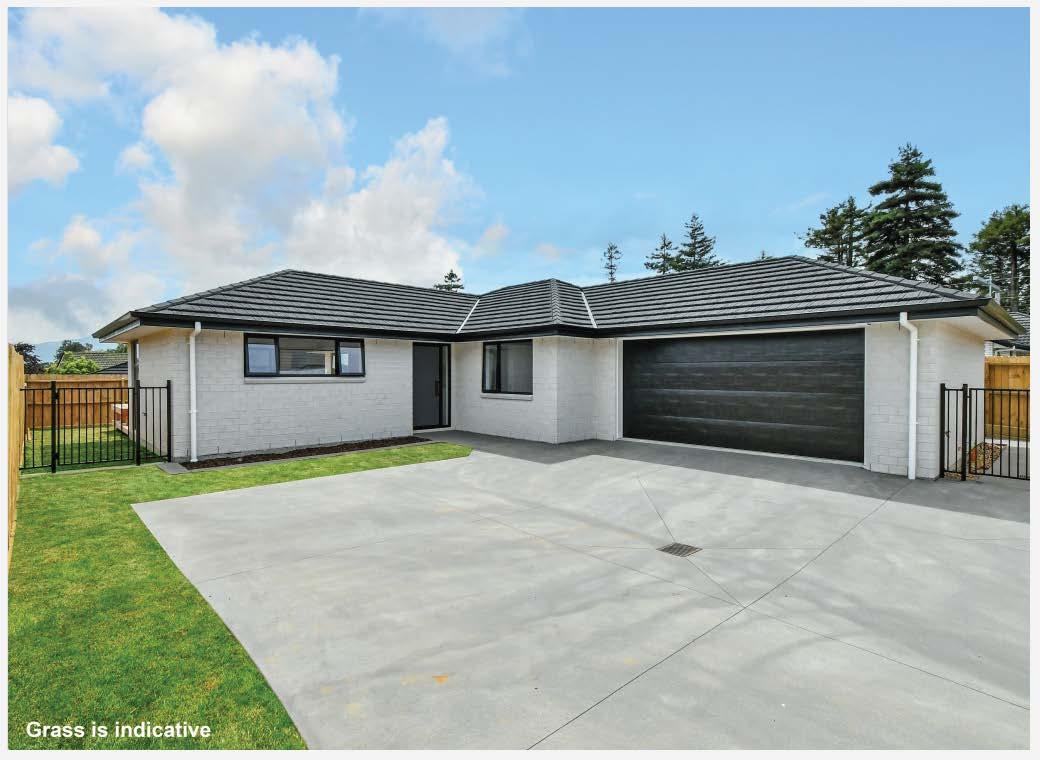
20B ReidyPlace,Pukekohe
§4 b2 �2
Brand new, close to town, available now! Introducingabrand-new4-bedroomhaventhat seamlesslycombinesstyle,functionality,andcomfort.
For Sale PriceonApplication View SundayJuly21st,0l:30PM -02:30PM VenitaAttrill021286 7792 venita.attrill@ljhooker.co.nz
For Sale FixedPrice $949,000 View SaturdayJuly13th,01:00PM02:00PM,SundayJuly14th,01:00PM02:00PM,SundayJuly21st,12:00PM12:30PM
VenitaAttrill021286 7792 venita.attrill@ljhooker.co.nz


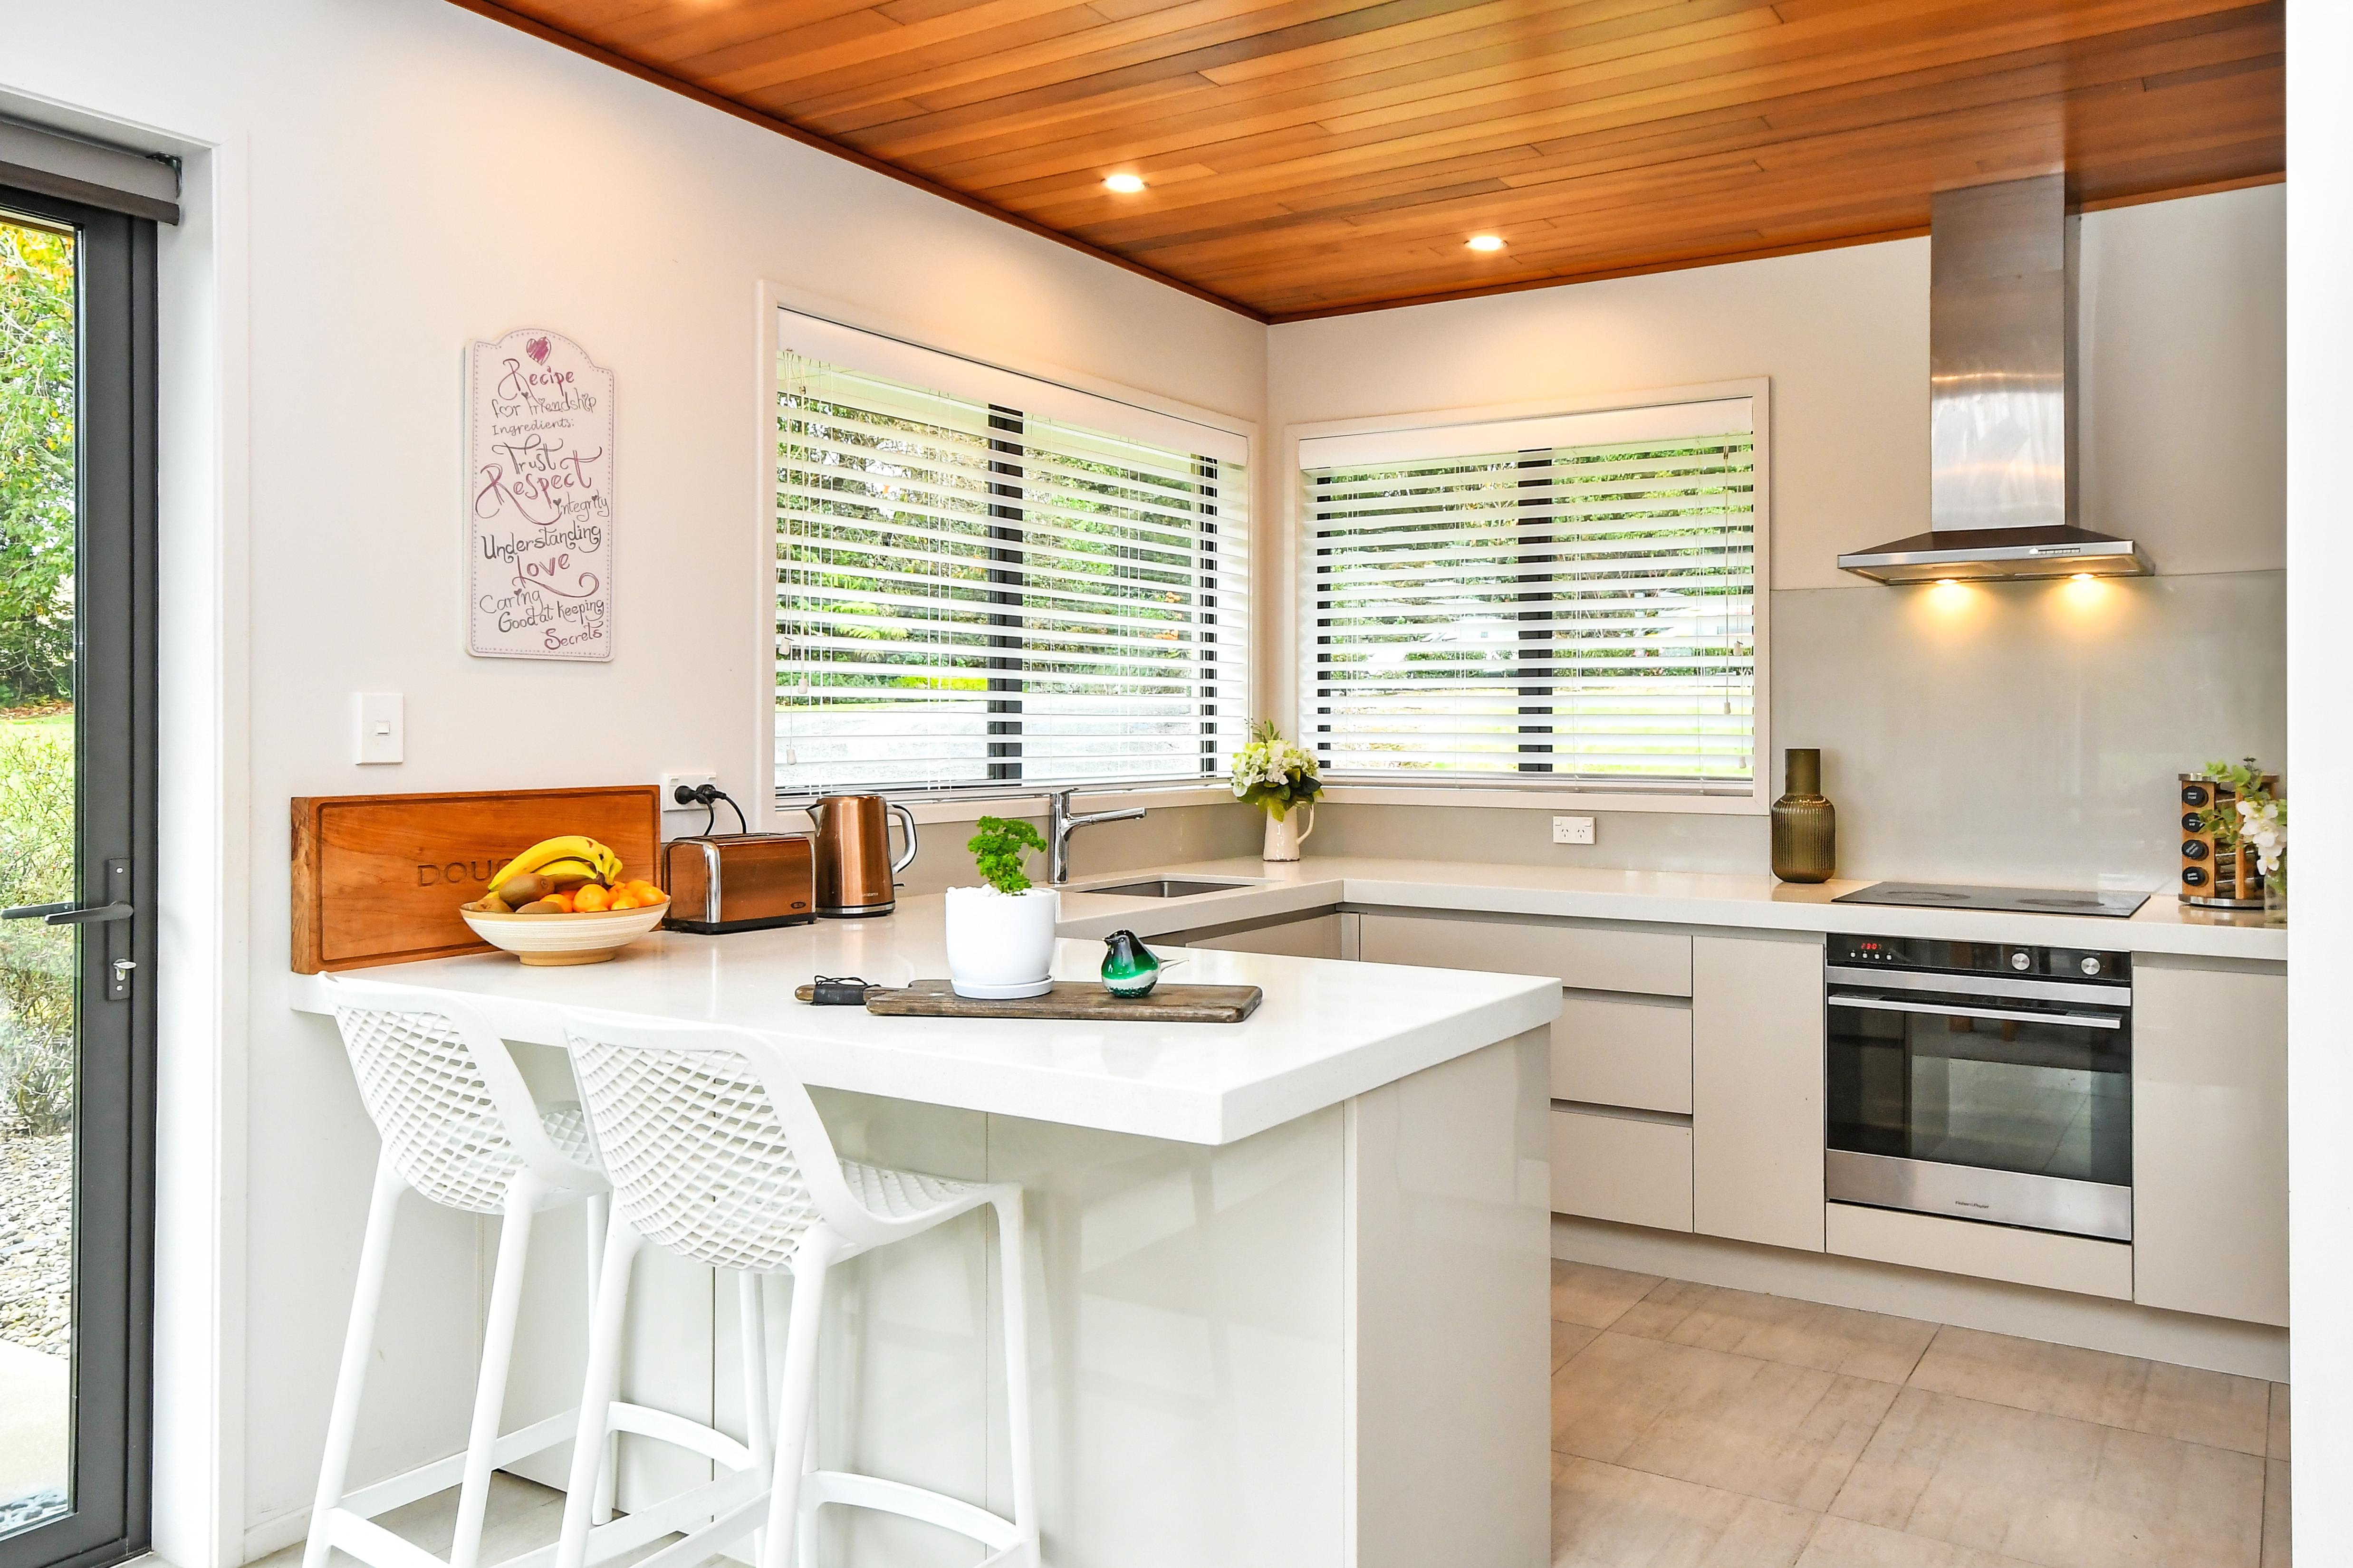
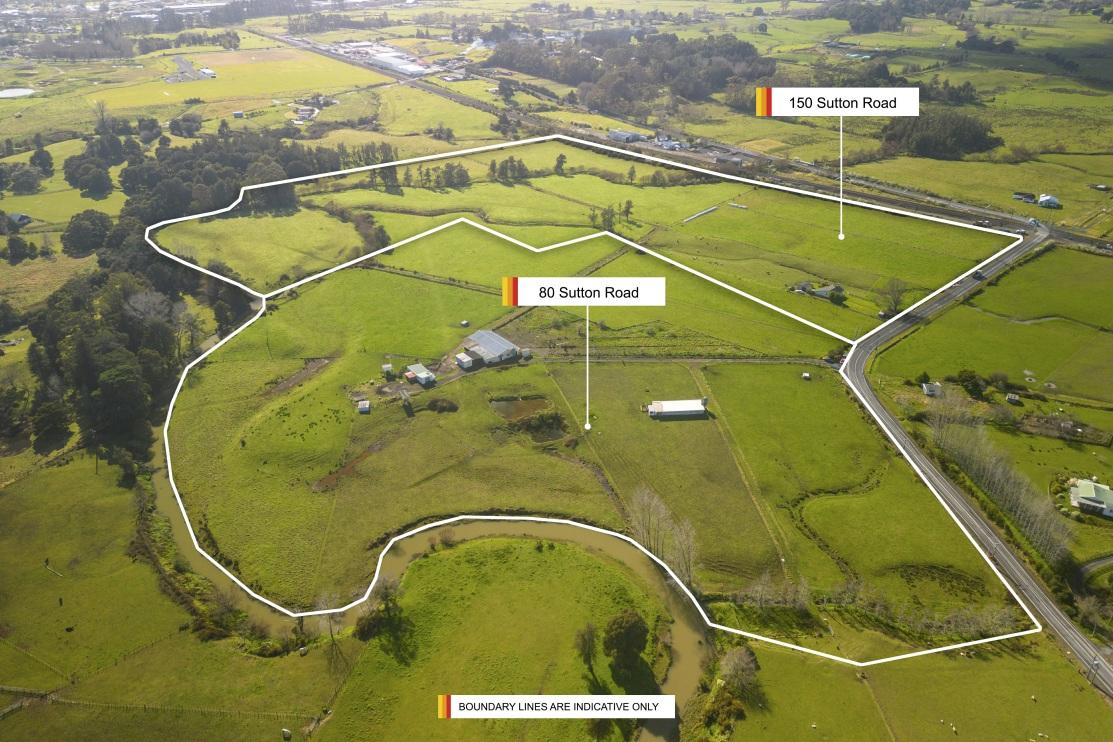
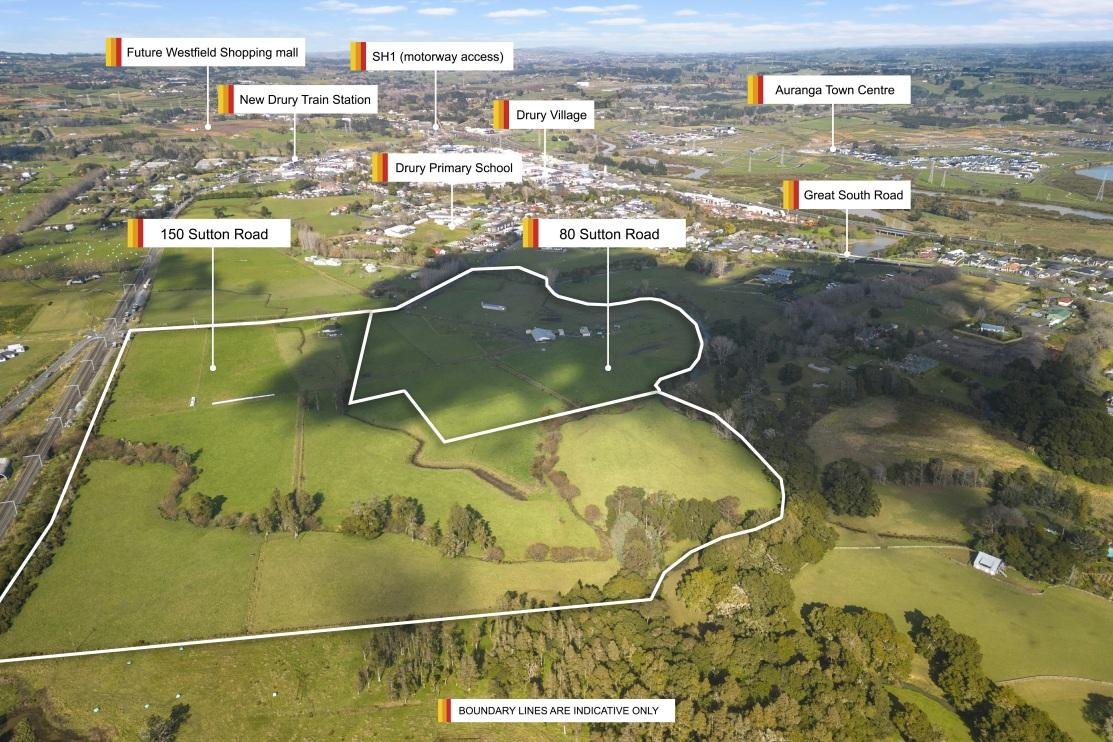
Nestledinatranquilsettingjustashortdrivefromthemotorwaylies anexceptionalpropertywaitingtobediscovered.Accessedviaa private,treelineddriveway,thisexecutivehomespanning336m2,is atestamenttofinecraftmanshipandthoughtfuldesign.
BuiltbytheawardwinningVanDerPuttenConstructionand designedwithextendedfamilylivinginmind,theresidenceboasts dualkitchens,5bedrooms,anoffice,and3bathrooms,providing ample spaceforeveryonetoenjoytheirprivacywhilestillfostering togetherness.
Vaultedceilingsandhighstudthroughoutaddsatouchofelegance andspaciousnesstoeveryroom,creatingasenseofluxury. Soakin thebreathtakingviewsofthesurroundingbushandcountryside, offeringapicturesquebackdropforeverydayliving.With6.8 Hectaresofusableland,thereisvastpotentialtofurtherenhance thispropertytosuityourlifestyle.
Convenientlylocatedjustminutesfromthemotorway,yetsecluded enoughtoenjoypeaceandtranquility,thispropertyoffersthebestof bothworlds.


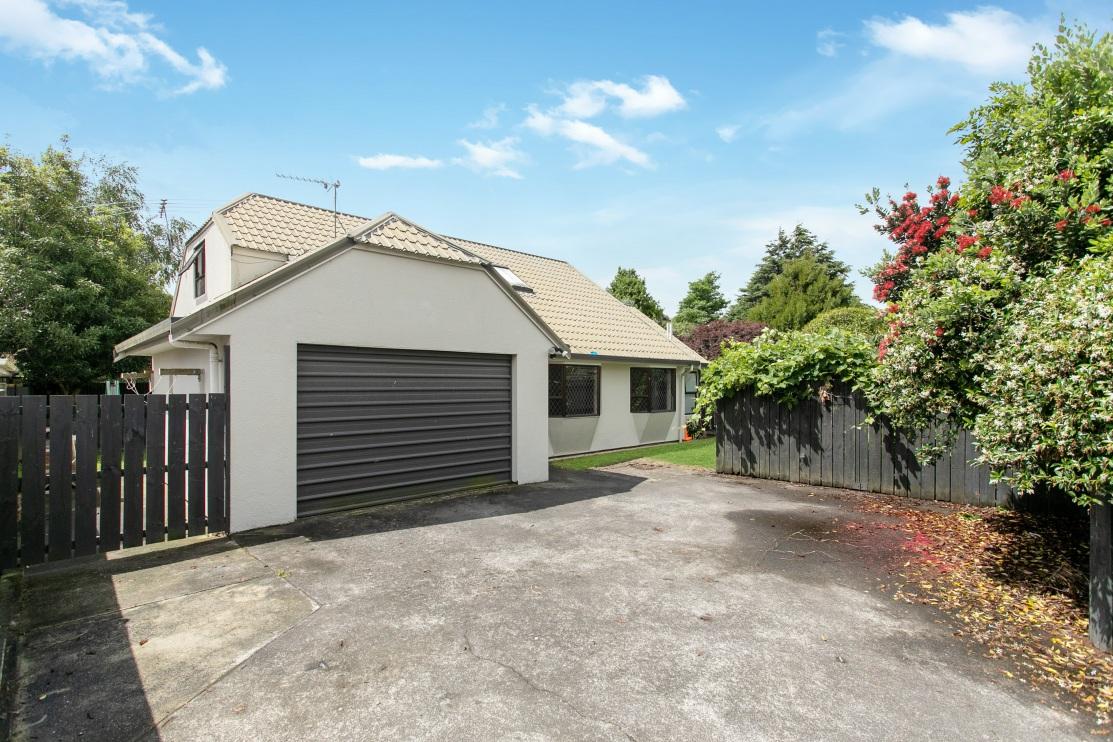
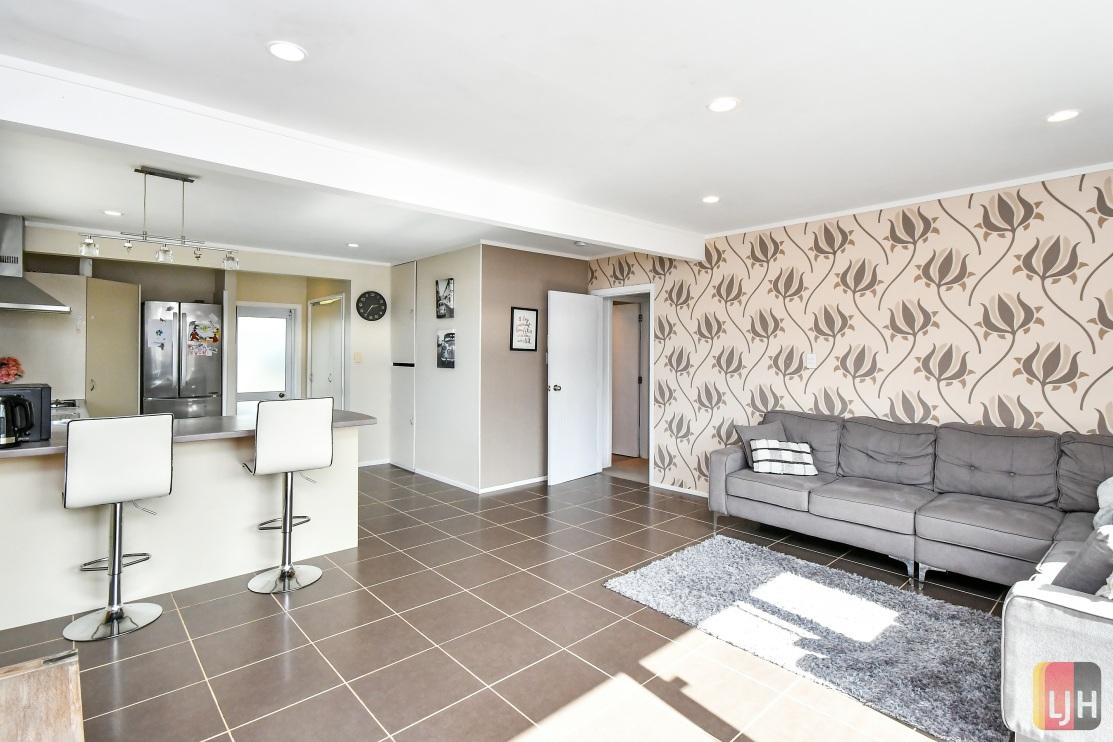
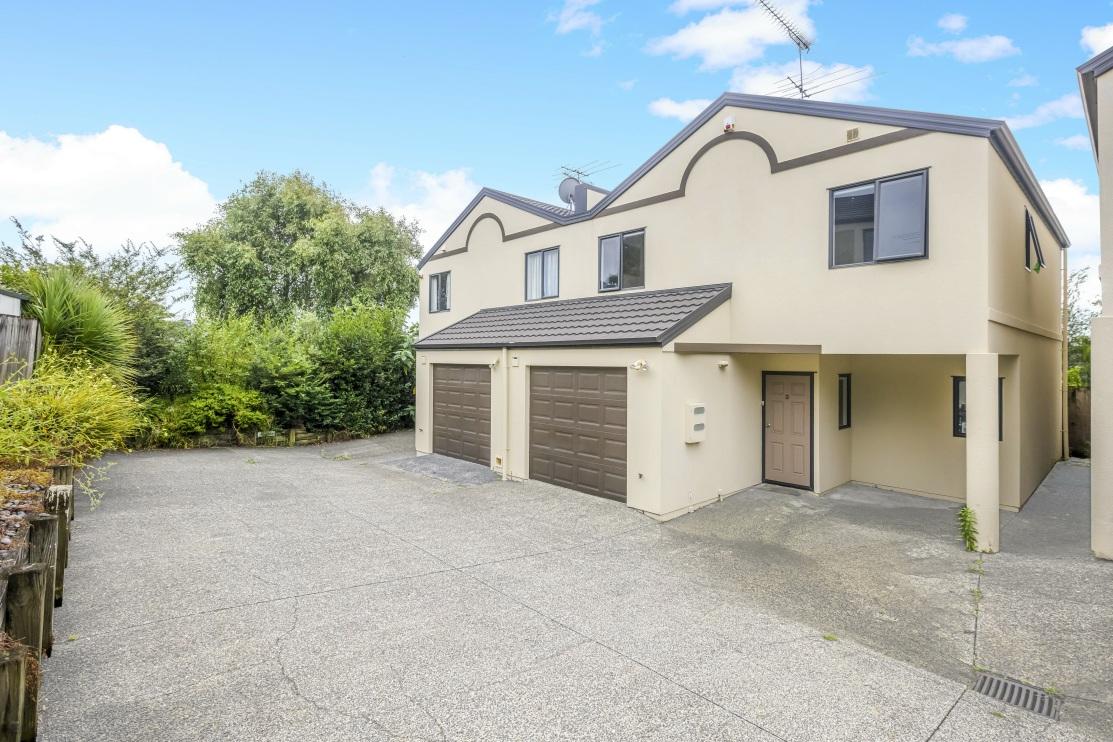
Thisspacious,140m2 3doublebedroomfamily homesupremelylocatedclosetoallamenities onecouldwishforboastsanin-groundpool,a carportandloadsofoffstreetparking.
Thehomesitsproudlyona708m2 (mol)section andiszonedforverypopularschools.Prepareto livelifeonanotherlevel,phonetoview.

Town & Country
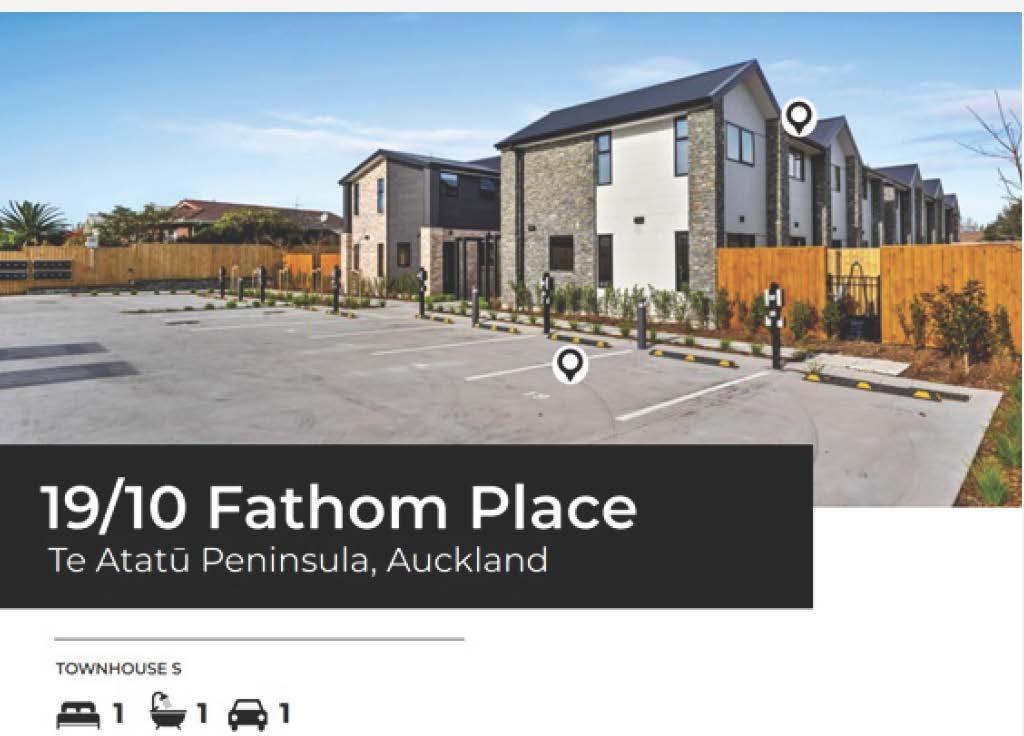

19/10 Fathom Place, Te Atatu Peninsula
§1 bl �1
Discover Modern Luxury at Fathom Place, Auckland
Step into the epitome of modern living in the vibrant city of Auckland with a newly built one-bedroo...
For Sale$ 685,700 View By Appointment
Anu Jay 022 3577 554 anu.jay@ljhooker.co.nz
Unit E/23 Awaroa Road, Sunnyvale
§2 bl �1
Stunning FunctionalTownhouse
Located at 23 Awaroa Road, these studios and townhouses areperfectlypositionedfor access to train...
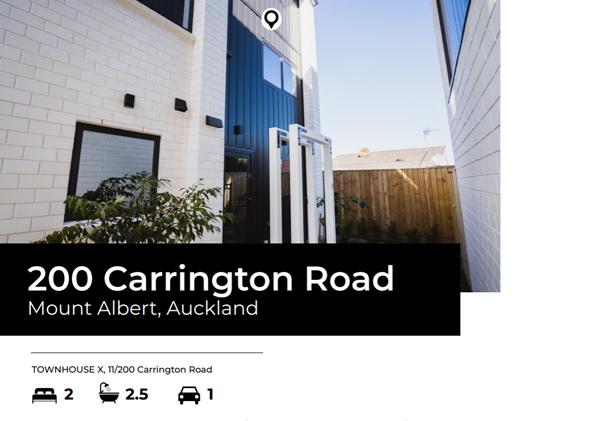
Unit 28/200 Carrington Road, Mt Albert
§3 b3 �-
Welcome to Convenient Living
In the Premium suburb of MountAlbert this development features two and three bedroom townhouses. Un...
Unit 22/200 Carrington Road, Mt Albert §3 b3 �-
Welcome to Convenient Living
Beyond the stylish facade, indulge in the convenience of the Mount Albert location. Explore nearby p...
For Sale $740,700 View By Appointment
Anu Jay 022 3577 554 anu.jay@ljhooker.co.nz
For Sale$ 1,050,700 View By Appointment
Anu Jay 022 3577 554 anu.jay@ljhooker.co.nz
For Sale$ 1,050,700 View By Appointment
Anu Jay 022 3577 554 anu.jay@ljhooker.co.nz


Town&Country
VenitaAttrill SalesConsultant
0212867792
venita.attrill@ljhooker.co.nz
MeetVenita-YourTrustedRealEstateExpertSince1996!

With an impressive career spanning over three decades, Venita began her journey in Real Estate sales in 1996 with the esteemed LJ Hooker/Harveys Group. Throughout her tenure, Venita has been recognized with numerous national awards, a testament toher unwavering dedication to her clients. In fact, approximately 90% of Venita's sales are derived from her past clients and client referrals, showcasing the exceptionalleveloftrustandsatisfactionsheconsistentlydelivers.
Selecting the right agent is crucial, and there is no better way to make that decision than by evaluating their success and the manner in which they achieve it. Venita's vast clientele, who repeatedly seek her services, skill, and advice, stand as a true testamenttoherabilitytoexceedexpectations.
While Venita boasts extensive experience and a track record of success, she remains driven and committed to going above and beyond to achieve a premium outcome for every client. Her dedication to continuous improvement ensures that she remainsat theforefrontoftheindustry,offeringyouunparalleledserviceandexpertise.
When you choose Venita as your agent, you can rest assured that you have a trusted partner by your side, who will tirelessly work to secure the best possible results for you. With Venita, your real estate journey is in safe hands, backed by a legacy of excellenceandarelentlesspursuitofsuccess.
Contact Venita today and experience firsthand the difference a seasoned and determinedprofessionalcanmakeinyourrealestateendeavours.
PaulaCox Sales&MarketingConsultant
021396977
paula.cox@ljhooker.co.nz

Step into the world of real estate with Paula, an agent who exudes passion and dedication.Withacareerspanningtwodecades,thisseasonedprofessionalhasbeen enamored with every aspect of the industry since 2003. From the moment a property islistedtotheexhilaratingexchangeofkeysonsettlementday,herenthusiasmnever wavers.
WhatsetsPaulaapartisthedeepsenseofprivilegeshefeelswhenentrustedwiththe sale of a property. The responsibility bestowed upon her is not taken lightly, and she approaches each opportunity with humility and gratitude. Over the years, this commitment has not only resulted in successful transactions but has also forged lastingconnectionswithclients,transformingthemintolifelongfriends.
Trustinanagentwhocherisheseverymilestone,wherethesatisfactionofbothbuyers andsellersistheultimatetestamenttoherexceptionalservice.
knut.klavenes@ljhooker.co.nz

Realising he wasn't fixated in winning the game of life based on what college and conventional wisdom taught him, KJ focused less on the security aspect of jobs and focused more on helping people in their success on selling to earn his way.
Not only was he scoped out by the high ends of a Real estate Agent in New Zealand to start out by a mere first sentence upon meeting, he's also been building his empire under the mentorship of the top 10 of New Zealand!
After achieving levels of income, impact and personal freedom he could've only dreamt of as a child, KJ, on top of all his multi 6-8 figure clients, has dedicated his ambitions towards helping people achieve the best prices they can in their own circumstances provided!
Will you be next?
Steve Reilly

Steve Reilly
Licensee
Salesperson
021 930 352
steve.reilly@ljhooker.co.nz

Steve commenced Real Estate in 2001 and since then has continually been in the upper echelon of Real Estate performers. There are many reasons why people approach Steve to work for them.
Not only his experience (and in the Real Estate world we now live in, this is a significant benefit to the client), but more-so his integrity. The fact that Steve's business is built around repeat clients (as well as a significant referral network) is testimony to the fact that Steve really understands and appreciates what Real Estate is all about. That is, building relationships with integrity, expertise and of course hard work to achieve premium results. This no doubt creates clients for life.
Steve's commitment is also demonstrated by his wife Suzie, who has been along side him for some 43 years. A great sporting family, with four children and now doting grandparents.
Being life-long South Auckland residents, Steve enjoys contributing to the local community and sporting associations, further endorsing his strong belief in the families and community.
Steve and the team will work hard obtaining the very best result for you too with 100% confidence.
Anu Jay
LicenseeSalesperson

Introducing Anu Jay, a seasonsed and accomplished sales profession with an impressive track record in the retail sales / financial sales & services industry. With extensive expertise in Sales, Customer Service, Banking, Credit analysis & Business Development, Anu Jay has consistently demonstrated a keen understanding of the industry'snuancesandapassionfordrivingsuccess.
Equipped with a Master of Business Administration (MBA) degree in Business Administration and Management from the prestigious London Metropolitan University, Anu Jay possesses a sold foundation of knowledge and strategic acumen, making him avaluableassettoanyteamororganisation.
Currently, Anu Jay has ventured into the dynamic world of Real Estate as a Sales & Marketing Consultant. Leveraging his robust experience and innovative approach, he excels in finding tailored solutions for clients, ensuring their needs are met and exceeded.
If you are seeking a seasoned professional with a proven track record in the financial and real estate sectors, look no further. Contact Anu Jay today and discover how his expertisecanelevateyourbusinessorrealestateendeavourstonewheights.
LinaRoban LicenseeSalesperson
02102288521
lina.roban@ljhooker.co.nz

Prior to entering the world of real estate, driven by her love of meeting and helping people, Lina had an impressive 20 year career in sales and marketing roles in the telecommunications and corporate marketing industries where her expertise in communication and negotiation always resulted in the delivery of superior customer service to her clients.
Originally from Fiji, Lina epitomises energy, passion integrity and hard work in everything she turns her hand to.
When not delivering superior service to her clients, Lina loves spending time with her family and is a passionate cyclist, owning both road and mountain bikes. With her three children all having "flown the coop", Lina and her husband also have plenty of time to enjoy their love of travel and some of their more memorable adventures include extensive journeys throughout South East Asia, the USA and the South Pacific.
BrentWorthington
LicensedAgent&Principal
0292965362
Brent.worthington@ljhooker.co.nz

There’s not much Brent doesn’t know when it comes to selling real estate. This town and country agent has had a successful career in the property market and is now the proud owner of his own business. Definitely a quality over quantity man, when you bring Brent on board, you’ll find that accumulating listings is far less important to him than making each one as good as it can get. He prides himself on telling it like it isknowing you’ll be able to make better decisions with a person and information you can trust.
Complementing Brent’s practical and credible approach is a background full to the brim of industry knowledge and business expertise from 30 years working within the construction industry. His capabilities have been well proven as a highly successful business owner.
A family man, with a proven track record of success, Brent has earned an excellent reputation and the trust of his local community and business colleagues.
He places huge emphasis on customer satisfaction, attention to detail and conducting his business with a genuine duty of care. Brent has gained many awards as a business leader during his 12-year tenure in Real Estate.
His entrepreneurial style ensures he reaches out and connects people with like minds. He imparts his wisdom in a warm and friendly manner and helps people to make wise and right decisions before investing in the property market, Auckland wide.
If you are considering a lifestyle change, investing for your future or simply wanting to know the worth of your property in this fluctuating market, feel welcome to call or email Brent to receive the latest updates on the trends and statistics in your area.

Debbie Harrison PropertyManager
021302864
debbie.harrison@ljhooker.co.nz
With a passion and a commitment to providing exceptional service, Debbie has a fantastic attitude of getting things done and ensuring that the clients are happy and well cared for. She takes great pride in her work and goes above and beyond to ensure the satisfaction of both property owners and tenants.
Debbie’s attention to detail and organizational abilities are exceptional, enabling her to efficiently handle all aspects of property management, from tenancy agreements, rent collection to property inspections and maintenance coordination.
Debbie understands that property management requires a compassionate and empathetic approach, and she always strives to create a positive and harmonious living environment for tenants while protecting the interests of property owners.
Whether you are a property owner seeking professional management services or a tenant searching for a well-maintained rental property, Debbie is committed to delivering exceptional results and ensuring a smooth and rewarding experience for all parties involved.
With her excellent communication skills, strong work ethic and dedication to excellence, Debbie Harrison is a true asset to LJ Hooker, Drury.
Johnny is proud to be a part of the team at Apollo Auctions NZ. Entering real estate in 2014, he has developed and honed his craft of auctioneering and negotiating skills to a level that now sees him as an industry leader. Johnny has worked and collaborated with some of the most notable agents, business owners and auctioneers across New Zealand.
With the fusion of his knowledge and skill together with his personable approach, Johnny creates the ultimate auction experience . He implements drive and dedication to each and every property that he calls - regardless of value, location or personal circumstances. Johnny’s performance style and welcoming nature allows him to capture the audience and motivate buyers. He will guide you through the process and create a solid platform to achieve the best possible outcome for your auction.

Johnny also has a passion for acting. With a Bachelor of Performing and Screen Arts, he has appeared in several TV commercials and films, his most widely recognized being ‘Falling Inn Love’, an American Netflix production which was filmed in New Zealand. He has also worked with the Auckland Theatre Company on a number of occasions.
He currently resides in Beachlands with his wife and two young children.

RobertTulp DIRECTOR& AUCTIONEER
WinnerApolloAuction
Invitational2017&2018
FinalistApolloAuction
Invitational2018
FinalistHarcourts
NewZealandAuctioneer oftheYear2011,2018&2019

Runner-upREINZNationalAuction Competition2010&2019
FinalistREINZNationalAuctionCompetition2010,2011,2012, 2013,20162018
WinnerHarcourtsNewZealandAuctioneeroftheYear2010, 2014&2017
WinneroftheAustralasianCompetition2011&2015
FinalistAustralasianCompetition2010
Runner-upREINZNationalAuctionCompetition2020

It’s rare in life that we get something for nothing with no strings attached, especially if it genuinely adds value. Nevertheless, that’s precisely I will give you. Expert home loan advice which has reliably proven to offer significant long-term financial advantage. I keep strict tabs on the country’s largest network of banks plus numerous smaller and second-tier lenders, so you don’t have to. What’s more, this comes at no cost to you because your chosen bank pays for the privilege. You have nothing to lose, yet have a higher chance of securing better terms. Rest assured - if there’s a superior deal out there for you, I’ll find it.
In the typically stoical world of finance, I offer a point of difference. Not only will you receive excellent independent and impartial advice, but you’ll have fun doing it. Even after 15 years in the mortgage arena, my enthusiasm for objectives and commitment to clients shines through at every turn. Endorsement comes from countless glowing testimonials and in my own words: “I’m at my happiest helping people navigate through difficult situations, giving hope and concrete opportunity where they previously had none.”
Prior experience as sales manager in the fields of telecommunications and pharmaceuticals, then later, a small business owner and private property investor, provided me with considerable business acumen across many industries. My customer-focused approach and personable demeanor also reflect a lifetime of experience in client relations. I credit travel to distant locations for creating an enduring interest in different cultures and honing my ability to relate well to the needs of the broader population. In particular, I soundly empathise with people relocating from other countries to make New Zealand their home.
To continue giving my professional best, I maintain balance by travelling and participating in seasonal sports such as paddle boarding and skiing. I enjoy indulging in my creative side; with landscaping, painting watercolours or improving my guitar playing prowess. Additionally, I actively support my community through Christians Against Poverty (CAPNZ), but above all, my wife and our five shared children always take centre stage.
There's little that I haven't seen in my time in the industry, priding myself on an ability to deal with the trickiest of scenarios, never turning anyone away. My philosophy of treating people how I'd like to be treated results in a 360-degree perspective which sets myself apart.
Get in touch if you need any expert guidance. Regards
Keith Jones 021 849 767
keith.jones@loanmarket.co.nz loanmarket.co.nz/keith-jones


Wheretheonlyresultthatmattersisyours!

Town&Country