Published 14 August 2025

July 2025

Published 14 August 2025
July 2025
This report includes REINZ residential property statistics from July 2025.

The Real Estate Institute of New Zealand (REINZ) has released its figures for July 2025, showing that sales activity has increased compared to the same time last year. Listings were lower in July 2025 than a year earlier, despite a modest month-on-month rise after a significant drop in June. The national median price increased slightly year-on-year, reflecting a slight rise amid an otherwise steady trend, with monthly movements shaped by seasonal factors.
“We’re seeing the usual seasonal patterns play out, with buyers still active in the market even as listing volumes tighten ahead of spring,” said Lizzy Ryley, REINZ Chief Executive. “The lift in sales compared to last July suggests there’s a solid level of interest despite fewer new listings coming to market.”
The median price for New Zealand increased by 1.8% year-on-year, reaching $767,250. Excluding Auckland, the median price increased by 3.9% year-on-year to $695,000. Auckland’s median price increased by 2.6% year-on-year, to $975,000.
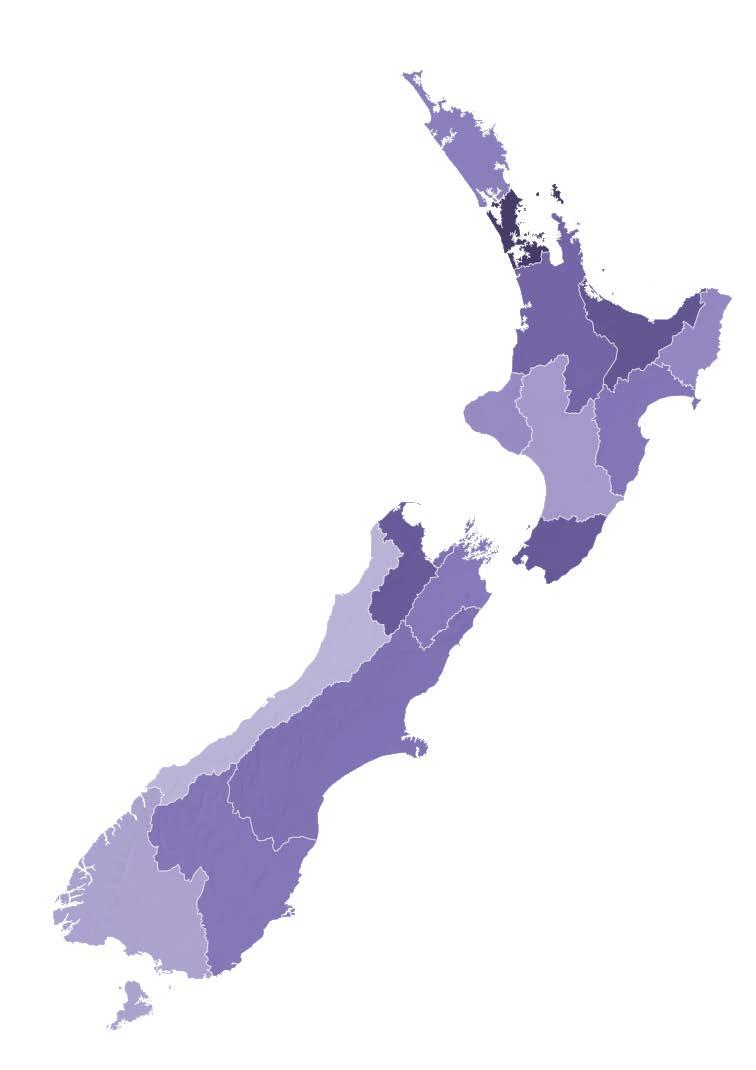
Eleven out of the sixteen regions reported an increase in median prices compared to July 2024. The most significant year-on-year increases were recorded in Nelson, up 15.7% from $657,000 to $760,000, and in Otago, up 11.1% from $657,000 to $730,000.
“The data shows a broad-based resilience in property values, with price growth in some areas, which suggests that local markets responded positively to buyer demand despite winter conditions,” Ryley says. “Compared to June 2025, the seasonally adjusted data indicates a slight increase in New Zealand’s median price. While some regions saw notable price growth, others experienced declines, highlighting a mixed housing market across the country.”
The number of properties sold across the country increased by 4.0% year-on-year, increasing from 6,074 to 6,319. When excluding Auckland, sales increased by 6.1%, from 4,166 to 4,421. Looking to the regions, eight regions recorded year-on-year increases in sales count - the highest of which was recorded in Nelson, which saw a 43.6% increase (from 55 to 79 sales). Other regions with notable sales increases included the Bay of Plenty (+18.9%), Hawke’s Bay (13.5%) and Northland (+10.5%).
“Seasonally adjusted sales counts at the national level show sales were slightly down. Sales growth varied widely across regions, with strong rises in areas like
Northland, while some regions experienced declines, reflecting a varied sales market across the country,” continues Ryley.
Looking at new listings, New Zealand saw a 4.2% decline in listings compared to July 2024, totalling 7,737 new listings. There was also a decline in listings for New Zealand, excluding Auckland, down 5.2% to 4,925. Inventory levels across the country also recorded a decrease, down slightly by 0.4% year-on-year to 30,430 available for sale.
In July, there were 853 auctions recorded, which represented 13.5% of all sales. For New Zealand, excluding Auckland, there were 475 auction sales, which were 10.7% of all sales. The Bay of Plenty recorded the highest percentage of auction sales, with 24.1% of all sales being done by auction. The median number of days to sell for New Zealand declined by one day to 48 days. The same was recorded for New Zealand, excluding Auckland.
“While buyers remain active, local salespeople around the country say they’re not in a rush to purchase. With the median days to sell holding steady or improving slightly, it’s clear that buyers still feel they have time to assess the market,” adds Ryley.
Ryley notes that local salespeople believe most vendors are realistic and are meeting current market expectations. However, due to declining listing volumes, winter conditions and uncertainty about buyer behaviour, many prefer to wait until spring, when activity usually increases and confidence tends to lift.
The House Price Index (HPI) for New Zealand is currently at 3,564, showing a year-on-year increase of 0.1% and a decrease of 0.4% compared to last month. Over the past five years, the average annual growth rate of New Zealand’s HPI has been 3.4%.
The Real Estate Institute of New Zealand (REINZ) has the latest and most accurate real estate data in New Zealand, for more information and data on national and regional activity visit the REINZ’s website
Media contact: Communications and Engagement Team communications@reinz.co.nz


48


Count


• The total number of properties sold in New Zealand increased by 4.0% year-on-year, to 6,319 properties sold in July 2025. New Zealand, excluding Auckland, saw sales increase by 6.1% year-on-year, to 4,421 properties sold in July 2025.
• Nationally, the seasonally adjusted figures for New Zealand show a sales count year-on-year increase of 4.2%. Compared to last month, the seasonally adjusted count shows a 1.7% decline.
• Nelson had the highest percentage increase in sales count, up 43.6% year-on-year, from 55 to 79 sales. Waikato followed with an increase of 18.9% year-onyear, from 567 to 674 sales.
• Eleven regions recorded increases in median prices – Nelson led the way with a 15.7% increase year-onyear, from $657,000 to $760,000.
• West Coast recorded the highest decline in median price year-on-year, down 14.0% from $401,000 to $345,000.
• Listings nationwide decreased by 4.2% yearon-year, to 7,737. For New Zealand, excluding Auckland, listings fell by 5.2% to 4,925.
• The median days to sell for New Zealand declined by one day, reaching an average of 48 days. The same was for New Zealand, excluding Auckland.
• Four regions reported an increase in listings compared to last year. These were:
– Gisborne, up 54.5% (from 33 to 51)
– Taranaki, up 34.3% (from 140 to 188)
– Northland, up 26.3% (from 224 to 282)
– Bay of Plenty, up 0.8% (from 527 to 531)
More information on activity by region can be found in the regional commentaries. Visit the REINZ website.

• 11 of 16 regions had year-on-year median price increases with Nelson leading the way with a 15.7% increase
• For Auckland, 3 of the seven territorial authorities had a positive year-on-year median price movement, with Franklin District leading with a 7.5% increase
• For Wellington, 4 of the eight territorial authorities had positive year-on-year median price movements, with Masterton District leading with a 7.8% increase
• There were no regional median price records this month
• Highest July sales count since 2003: Canterbury
• Highest July sales count since 2020: Hawke’s Bay, Nelson, Otago
• Highest July sales count since 2021: New Zealand, NZ excl. Auckland, Northland, Waikato, Marlborough, Southland
• Highest July days to sell
Since 2011: Otago
Since 2019: Canterbury
– Since 2022: Gisborne, Wellington
• Lowest July days to sell
– Since 2021: Bay of Plenty, Hawke’s Bay
–

Since 2022: Northland, Waikato, Taranaki, Manawatu-Wanganui, Southland
• Lowest days to sell since March 2024: Bay of Plenty
• Lowest days to sell since November 2024: Gisborne
• Taranaki is the top-ranked HPI year-on-year movement this month. Southland is second, and Canterbury is third
• Regarding the 3-month ending HPI movement, Taranaki ranks first, Gisborne is second, and Hawke’s Bay is third
• Year-on-year inventory increased in 8 of the 15 included regions
• Year-on-year inventory decreased in 7 of the 15 included regions
• Streaks above 20%: Gisborne (13 months), West Coast (10 months)
• Streaks above 30%: Gisborne (8 months)
• Year-on-year listings increased in 4 of the 15 included regions
• Year-on-year listings decreased in 11 of the 15 included regions
• Streaks above 20%: Gisborne (8 months)
• In July, there were 853 auctions recorded, which represented 13.5% of all sales. For New Zealand, excluding Auckland, there were 475 auction sales, which were 10.7% of all sales.
Inventory and listing data is courtesy of realestate.co.nz
More information on activity by region can be found in the regional commentaries. Visit the REINZ website.
Regions Compared to Last Month
Compared to Last Year

The monthly REINZ residential sales reports remain the most recent, complete and accurate statistics on house prices and sales in New Zealand. They are based on actual sales reported by real estate agents. These sales are taken as of the date that a transaction becomes unconditional, up to 5:00pm on the last business day of the month. Other surveys of the residential property market are based on information from Territorial Authorities regarding settlement and the receipt of documents by the relevant Territorial Authority from a solicitor. As such, this information involves a lag of four to six weeks before the sale is recorded.
This report is intended for general information purposes only. This report and the information contained herein is under no circumstances intended to be used or considered as legal, financial or investment advice. The material in this report is obtained from various sources (including third parties) and REINZ does not warrant the accuracy, reliability or completeness of the information provided in this report and does not accept liability for any omissions, inaccuracies or losses incurred, either directly or indirectly, by any person arising from or in connection with the supply, use or misuse of the whole or any part of this report. Any and all third party data or analysis in this report does not necessarily represent the views of REINZ. When referring to this report or any information contained herein, you must cite REINZ as the source of the information. REINZ reserves the right to request that you immediately withdraw from publication any document that fails to cite REINZ as the source.
Our property reports contain revised figures for previous months. These revisions reflect our dynamic database, which occasionally receives late sales data or corrections after our monthly publication deadline. While such updates are infrequent, they can influence key metrics like median prices, particularly in smaller geographic areas with fewer transactions. By incorporating these legitimate data adjustments in each new report, we ensure you receive the most accurate and current market analysis available.
The median price for Northland increased by 1.6% year-on-year to $655,000
“Owner-occupiers and first home buyers were the most active buyer group.
Most vendors met current market conditions regarding asking price, with lower offers being accepted. Attendance at open homes varied around the region, with reports of very low attendance at older listings, but stronger attendance reported in Whangarei due to the decline of new listings.
Auction room activity and attendance remained steady; if a property wasn’t sold during the auction, around 70% of the time it was sold afterwards. In Kerikeri, however, it was a different story, with most auctions being passed in and having low attendance.
Factors such as a tight rental market, interest rates easing without making an immediate impact, and a lack of buyer urgency influenced market sentiment. Local salespeople predict that the local market will remain steady over the next few months, stating that if Auckland’s market lifts, theirs will follow.”
Lizzy Ryley
REINZ Chief Executive
The current median Days to Sell of 62 days is more than the 10-year average for July which is 54 days. There were 50 weeks of inventory in July 2025 which is 3 weeks more than the same time last year.
Compared to June 2025

The median price for Auckland increased by 2.6% year-on-year to $975,000
“First home buyers, owner-occupiers looking to upsize, and developers were most active in the region, while investor engagement declined.
Vendors adjusted expectations based on their salespersons’ feedback, but some remained unrealistic. Open home attendance was strong for newer listings and those marketed as first homes. Auction attendance was low, yet bidding was higher than in recent months, excluding properties for first home buyers.
Market sentiment was influenced by factors like a lack of optimism, economic concerns, rental challenges, and anticipation for interest rate reductions. Local salespeople expect activity might lift in spring, but no significant changes are predicted until early 2026.”
Lizzy Ryley
REINZ Chief Executive
The current median Days to Sell of 48 days is more than the 10-year average for July which is 41 days. There were 29 weeks of inventory in July 2025 which is 11 weeks less than the same time last year.
900,000 1,000,000 1,100,000 1,200,000 1,300,000 1,400,000
Waikato’s median price increased by 2.6% yearon-year to $740,000
“Owner-occupiers, first home buyers and investors were the most active across the Waikato region.
Most vendors priced their properties in line with current market value, while some still set prices as if it were the peak of the market. Attendance at open homes remained consistent with other months, with newer listings attracting the highest numbers.
In the auction space, local salespeople experienced a slower pace, with decreased attendance and fewer bidders –attributed to a mix of seasonal and sentiment-driven factors. Market sentiment was influenced by economic uncertainty, optimism from interest rate reductions, ongoing affordability pressures, and general uncertainty.
Local salespeople cautiously predict that the property market will gradually gain momentum as we head into spring, creating a more positive space for buyers and vendors.”
Lizzy Ryley REINZ Chief Executive
The current median Days to Sell of 57 days is much more than the 10-year average for July which is 44 days. There were 23 weeks of inventory in July 2025 which is 9 weeks less than the same time last year.

The median price for the Bay of Plenty decreased by 0.6% year-on-year to $800,000
“First home buyers and investors were the most active buyer groups, with buyer numbers remaining steady.
Most vendor expectations were realistic regarding asking prices, but a small percentage remained ahead of the market. Attendance at open homes was steady; newer listings and well-marketed properties drew the highest number of attendees.
Auction rooms were busy across the region, with interest and activity increasing. Clearance rates improved, either through sales under the hammer or in a timely fashion after the auction. Reports indicate steady sales figures compared to last year.
Market sentiment shows quiet optimism for an earlier spring upswing compared to previous years. While finance and strict regulations around unconsented work, floodplains, and slope designations pose challenges, investor activity is increasing, with more willingness to pay higher prices for properties with potential.
Local salespeople cautiously predict a rise in listings as spring approaches, with sales following suit and a marginal increase in prices.”
Lizzy Ryley REINZ Chief Executive
The current median Days to Sell of 43 days is less than the 10-year average for July which is 45 days. There were 21 weeks of inventory in July 2025 which is 10 weeks less than the same time last year.
Median Price Sales Count
Compared
Seasonally Adjusted Median Price Median Price
Days to Sell
Seasonally Adjusted Sales Count Sales Count
Days to Sell

Gisborne’s median price decreased by 2.6% year-on-year to $570,000
“Owner-occupiers were the most active buyer group across the region, with increased investor interest in the lower end of the market.
Vendor expectations remained realistic, influenced by the lower stock levels on the market. Attendance at open homes was strong, due to a limited number of new properties, which encouraged buyers to become more active.
Auction attendance and clearance rates were lower than in previous months, as were sales, due to the combination of school holidays and winter.
Market sentiment was affected by the scarcity of new listings, with buyers having fewer choices but becoming more active, seeking to capitalise on current market conditions. Local salespeople cautiously predict there will be an increase in new properties on the market, as the regional spring rush is expected to arrive slightly earlier than usual.”
Lizzy Ryley
REINZ Chief Executive
The current median Days to Sell of 48 days is more than the 10-year average for July which is 40 days. There are 18 weeks of inventory in July 2025 which is 5 weeks less than last year.
Hawke’s Bay’s median price increased by 3.0% year-on-year to $680,000
“First home buyers and owner-occupiers looking to downsize were the most active in July. Investors were notably absent, as most were after specific properties, such as those at especially low prices.
Most vendor expectations were generally in line with current market conditions. Attendance at open homes was higher than in previous months for properties new to market and presented well for first home buyers or downsizers –other properties, like ones on the market for a while, saw fewer in attendance at open homes. A similar pattern was seen for auction room activity and attendance.
Market sentiment was influenced by rising rates and insurance costs, exerting pressure across all sectors, along with bank lending criteria for hazard assessments. Local salespeople suggest that the next three months will be steady for the region.”
Lizzy Ryley
REINZ Chief Executive
The current median Days to Sell of 45 days is more than the 10-year average for July which is 39 days. There were 15 weeks of inventory in July 2025 which is 6 weeks less than the same time last year.
Taranaki’s median price increased by 5.8% yearon-year to $640,000
“All buyer types were active in the Taranaki region, with owneroccupiers the most active.
Most vendors were realistic with their price expectations, with the region holding relatively steady. Attendance at open homes was well-attended, particularly for properties marketed as first homes or as investment properties.
Market sentiment remained steady compared to previous months, with a wide range of properties on offer, encouraging buyer activity. Local salespeople are cautiously optimistic that further interest rate cuts will bring positive news for buyers, but they believe that the end of winter will see high listings alongside lower sales.”
Lizzy Ryley
REINZ Chief Executive
The current median Days to Sell of 45 days is more than the 10-year average for July which is 39 days. There were 19 weeks of inventory in July 2025 which is 6 weeks less than the same time last year.
Price Sales Count
to Sell Seasonally Adjusted Median Price
Price Seasonally Adjusted Sales Count Sales Count
The median price for Manawatu/Whanganui increased by 0.6% year-on-year to $535,000
“Owner-occupiers and first home buyers were the most active, although local salespeople reported light buyer enquiry during July. There were reports of fewer investors and no out-of-town buyers.
Most vendor expectations exceeded the current market value, and buyers are keen to know what these expectations are. New listings drew good attention at open homes. Properties that remained on the market for some time became stagnant, with most vendors needing to adjust prices to generate interest.
There was minimal activity at auctions, both in terms of attendance levels and sales; however, reports indicated some successes following the auctions.
Market sentiment was primarily shaped by the seasonal market shift, with key concerns being vendor expectations, job security, and high unemployment rates. Local salespeople say the market is hard to predict for the coming months, but remain hopeful that spring will bring the much-needed change and optimism to the region.”
Lizzy Ryley REINZ Chief Executive
The current median Days to Sell of 50 days is more than the 10-year average for July which is 41 days. There were 20 weeks of inventory in July 2025 which is 9 weeks less than the same time last year.
Compared to July 2024
Median Price Sales Count
Days to Sell
Compared to June 2025
Median Price
Seasonally Adjusted Median Price
Seasonally Adjusted Sales Count Sales Count
Days to Sell

Wellington’s median price decreased by 1.3% year-on-year to $755,000
“First home buyers were the most active buyer group in Wellington, with some activity among owner-occupiers as well, while investors remained cautious.
Vendors continued to adjust to current market conditions, with most pricing realistic, although some still hoped for higher values and faced longer selling timeframes. Attendance at open homes was dependent on location and price bracket. Entry-level homes attracted reasonable attendance, while higher-priced properties saw softer interest.
Auction volumes and sales remained limited, as recent price softening contributed to a more measured buyer approach. Economic conditions and affordability pressures continued to influence decision-making.
Local agents noted that sentiment is stabilising, with signs that buyer confidence may slowly build over the coming months.”
Lizzy Ryley REINZ Chief Executive
The current median Days to Sell of 53 days is much more than the 10-year average for July of 40 days. There were 15 weeks of inventory in July 2025 which is 2 weeks less than the same time last year.

The median price for Nelson increased by 15.7% year-on-year to $760,000. The median price for Marlborough increased by 8.6% year-on-year to $630,000. The median price for Tasman increased by 1.9% year-on-year to $810,000.
“First home buyers were the most active buyer group, with investors active in Blenheim, but notably absent from the Nelson region.
Most vendors were realistic about meeting the market with their asking prices, while others, who were willing to wait, held firm with higher expectations for their property. Attendance at open homes was well-attended for new listings, and other listings continued to be low, which was expected for this time of year.
Overall, auction room activity saw limited bidding and low attendance, although sales under the hammer increased. Factors like easing interest rates and a lack of new stock influenced market sentiment. Local salespeople suggest that their market remains steady, and with spring just around the corner, they are cautiously expecting an uplift in activity.”
Lizzy Ryley REINZ Chief Executive
The current median Days to Sell of 48 days is more than the 10-year average for July which is 40 days. There were 23 weeks of inventory in July 2025 which is 6 weeks less than the same time last year.
Compared to July 2024
Compared to June 2025
Source: REINZ
Source: REINZ
West Coast’s median price decreased by 14.0% year-on-year to $345,000
“Owner-occupiers looking to upsize or upgrade from their current properties were the most active in the region, with no reports of any decline in buyer type.
Most vendors were realistic about the asking price, aligning with current market conditions. Attendance at open homes was low, as is typical in July. Sales figures declined over the month, which is attributed to bad weather and a limited number of listings on the market.
Market sentiment was influenced by the lack of willingness to negotiate between buyers and vendors. Local salespeople predict the market will spring back in the next few months, with salespeople having to work hard to support buyers and vendors with getting a sale across the line.”
Lizzy Ryley
REINZ Chief Executive
The current median Days to Sell of 42 days is much less than the 10-year average for July which is 71 days. There were 45 weeks of inventory in July 2025 which is 10 weeks less than the same time last year.
Median Price Sales Count
Days to Sell
Median Price
Seasonally Adjusted Median Price
Seasonally Adjusted Sales Count Sales Count
Days to Sell

The median price for Canterbury increased by 4.2% year-on-year to $677,600
“First home buyers, owner-occupiers and investors were the most active across the region.
Some vendors were realistic regarding price and happy to review offers handed to them, especially for those who were motivated to sell. Attendance at open homes was steady, particularly for those in desirable school zones or the properties listed with an asking price. Auction rooms saw multiple bidders and good numbers in attendance.
Factors such as lower interest rates, reasonable local economic activity, and increased activity across commercial and rural markets influenced market sentiment. Local salespeople suggested that there were a few buyers in the market, especially those transferring to Christchurch.
For the upcoming months, local salespeople suggest that there will be an uptick in listings and have a general expectation that things will improve, and remain cautiously optimistic.”
Lizzy Ryley REINZ Chief Executive
The current median Days to Sell of 41 days is more than the 10-year average for July which is 37 days. There were 14 weeks of inventory in July 2025 which is 5 weeks less than the same time last year.
Seasonally Adjusted Median Price Median Price
Price Sales Count Day to Sell
Seasonally Adjusted Sales Count Sales Count
to Sell

“Dunedin’s median price increased by 4.8% year-on-year to $600,000
First home buyers were the most active, with reports of a decline in investor activity and enquiries.
Most vendor expectations regarding asking price were typically in line with market conditions, although some pushed higher than the market value. Attendance at open homes was good, especially in the first seven to ten days of being listed for sale. Most properties sold by auction struggled to find a buyer, but the method of sale generally yields a result post-auction.
Factors like interest rates easing, high cost of living, and average levels of confidence in the market influenced market sentiment.
Local salespeople predict the next few months will bring much of the same for the region, with the suggestion that the number of listings may pick up into the spring.”
Lizzy Ryley REINZ Chief Executive
The current median Days to Sell of 58 days is much more than the 10-year average for July which is 39 days. There were 18 weeks of inventory in July 2025 which is 3 weeks less than the same time last year.
Days to Sell
Median Price Sales Count Days to Sell
Seasonally Adjusted Median Price Median Price
Seasonally Adjusted Sales Count Sales Count
“First home buyers continue to be the most active in the market, with an increased number of overseas buyers reported, possibly due to the ski season. Buyers at the top end of the market were absent from the market.
Most vendors were open to negotiation, as many properties on the market were marketed as auction or deadline sales. Attendance at open homes was steady – stock numbers for the region dropped considerably, as some vendors wait until spring to bring their properties to market.
Auction activity remains much the same as in previous months, proving to be challenging, but most properties received bids on the day, although clearance rates remain around the 50% mark. Factors like rental rates, interest rates easing, bank lending criteria and competitiveness all influenced market sentiment.
Local salespeople predict the winter market will remain steady. They expect stock levels to rise in the coming months, potentially boosting market activity, though low inventory and selective buyer engagement may continue to present challenges.”
Lizzy Ryley
REINZ Chief Executive
The median price for Southland saw no change in median price year-on-year, steady at $490,000
“First home buyers were the most active group in the Southland region.
Vendor expectations regarding asking price were, at times, a little high. Attendance at open homes continued to be good for newer listings. Auction room activity generally saw between one and three bidders at each auction over the month.
Factors such as a strong local economy and increased confidence have positively influenced market sentiment. Local salespeople suggest that winter conditions have altered buyer and vendor behaviour, leading to a slowdown in overall market activity, and they believe that with lower rates and spring approaching, vendors are willing to wait for better conditions.
Local salespeople predict that as winter ends and spring starts to bloom, activity will start to pick up across the market.”
Lizzy Ryley REINZ Chief Executive
The current median Days to Sell of 42 days is more than the 10-year average for July which is 36 days. There were 13 weeks of inventory in July 2025 which is 13 weeks less than the same time last year.