THE PROPERTY CHRONICLE

Whenyouknow,youknow.™


April2023


DRURY CONTENTS Page Letter from Principal (Brent Worthington) 3 LJ Hooker Home Smart Newletter 5 REINZ REPORTS 18 Apr 23 (March Data) • Monthly Property Report 7 o Contents Page with link to full report o Press Release (page 3) o Market Snapshot (pages 4 &7) o Annual Median Price Changes (page 5) o Sales Volumes & Price seasonally adjusted (page 10) • REINZ – Monthly House Price Index 14 • REINZ & Tony Alexander Real Estate Survey 28 Tony’s View o The housing shift to come. o If I were a borrower, what would I do? 35 Visit us at Fieldays Invitation o (14 – 17 June 2023) Mystery Creek) 41 LJ Hooker Drury - Properties • Our Current Listings 43 • Our Recent Sales 47 Our Salespeople 48 • Brent Worthington - To Sell or To Hold • Nav Johnson • Lina Roban Chance to win $5,000 worth of furniture 52 Property Management - Rent Exchange 53 Newsletter – What you should know before you rent a property 54 Loan Market Information – Keith Jones 56 Top Reasons to Get a Property Inspection Before You Sell 57 SuperGold Welcome Here 61 ANZAC Day Commemoration 25th April
HOUSINGMARKETSTABILISESWITHRISEINACTIVITYFOR2023


Interestratescontinuetorise,foodpriceincreasesareata30yearhighandarecessionis looming.Despitethegloom,thereislightinthehousingmarketasitstabilisesandregains momentumfor2023.
Toreduceinflation,theReserveBankofNewZealandhasliftedtheofficialcashrate11 consecutivetimes,reaching5.25percentinApril.
Despitetheseeffortstocreateconcernaboutaloomingrecession,independent economistTonyAlexandersaysoureconomyisnotpermanently“munted”.
“We'reinanenvironmentwhereit'sactuallyhelpfulifpeoplethinkthefutureismunted,”
Alexandersaid.
“TheReserveBankisencouragingpeopletothinkintermsofrecession,becausethathelps restraintheinflationarypressuresontheeconomyandthereforepeopledon'taskforbig wagerisesand[it]willmakebusinesseshesitantaboutraisingprices.”
Despiteincreasestotheofficialcashrate,manybankshavebeenloweringmortgage rates.However,theReserveBank’seffortscouldseethisdownwardtrendlevelout.
“Theriskispeoplethinkthatthistightperiodinthemonetarypolicycycleissomething that'sgoingtobeherepermanentlyandextrapolatetheremainderofthisyearintowhat theconditionsarelikelytobefor2024,2025and2026.Thatwouldbeamistake.Wewillsee improvementintheeconomy,”Alexandersaid.
Brent Worthington Principal and Licensee Agent

continued over...
LJ Hooker Drury & Property Management 1/233 Great South road, Drury 09 294 75 00 0292 965 362 D RURY
April2023 Hi,
20
WhilethepropertymarketisstilldownfromitspeakinNovember2021,priceshave stabilisedandthenumberofsaleshaspickedup.
ThemedianhousepriceinMarch2023was$775,000,whichwasup1.3percentfrom February.Marchalsosaw5,877propertiessold,upnearly43percentfromFebruary.
RealEstateInstituteofNewZealandCEOJenBairdsaysthereareclearsignsweareatthe lowerphaseofthisdownwardcycle.
“Vendorswhoaremotivatedtosellaremeetingthemarketwithmorerealistic expectationsontimeframeandprice.Thosewhoneedtosellarestillselling,”Bairdsaid.
Bairddoesn’texpectanymajormovementsinthepropertymarketduringthecomingyear.
“ThemarketislikelytoremaininthisphaseasNewZealanderswaitforpeakofinflation,a settlingininterestratesandsomeclarityaroundthepossibleoutcomeoftheelection.That said,withthenumberoflistingscontinuingtoease,wemaystarttoseethesupply/ demandbalancechangeinsomeareas.”
As always I trust you enjoy this month's publication.
Kind regards
Brent
Brent Worthington Principal and Licensee Agent
Hooker Drury & Property Management 1/233 Great South road, Drury 09 294 75 00 0292 965 362 D RURY Continued
LJ
Significant Life Events That Influence Real Estate Decisions

Life is a journey and it’s full of change. Just like life, your property journey is influenced by the decisions you make and what happens in your life.
For most, any decision to buy or sell a home is a m ajor life event. Home is where you grow and create m emories, which is why we get attached to our homes. There are many life events that can influence your real estate decisions. They can range from personal milestones to professional cha ng es, all of which can have a significant impact on your housing needs and preferences.
When you decide to buy or invest in property, your decision is weighted on your stage of life. Your current family dynamics, health and work situation all play a significant role in real estate decisions. In this blog, we will explore some of the key life events that can influence real estate decisions and how they can impact your choices.

Getting married
Getting married is a ma jor life event that often triggers the desire to purchase a home together. For so m e, it could mean upgrading to a larger home that accommodates both of your needs. While for others, it could mean finding a home that is suitable for starting a family In either case, it's important to consider factors such as location, budget, and your future plans when purchasing a ho m e. Additionally, it's essential you ensure you are both on the same page about what you want in a home to avoid conflict down the roa d.
Having kids
Having children is another significant life event that can notably impact your real estate decisions As your family grows, you may need to purchase a larger home or find a home in a family-friendly neighbourhood with good schools and ample outdoor space. It's essential to consider factors such as school zones , commute t ime, and access to amenities. Additionally, it's important to think about how your family's needs may change over time and ensure that the home you purchase can accommodate those changes.
Space is king when you have kids. Make sure you find a home that has the storage you need. You also want space for your child to grow.
Job changes
Career advancements or changes can be exciting . Sometimes decisions you make at work can impact your housing needs. If you receive a promotion that requires you to move to a new city, you may need to sell your current home and find a new one in your new location. You may also have changes at the office which may mean you can work from ho m e. This may mean you need a house with a home office to give you a better lifestyle. Alternatively, if you lose your job, you may need to downsize to a more affordable ho m e
When making a real estate decision based on a job change, it's important to consider factors such as the cost of living in the new location, job s tability, and future career plans.
Retirement
There is a time in all of our lives when you want to step back from work and enjoy life. You might even want to change your living situati on. Many retirees choose to downsize to a smaller home or relocate to a more affordable area Downsizing also gives you a great opportunity to go through all of your stuff and have a good clear out.
At this stage in your life, you might be ready to purchase a holiday home A property near the water or somewhere warmer could be an ideal place to escape to. If you want a little more income, you could turn it into a seasonal rental. Investment properties might be another way to secure you income in retirement

ljhooker.co.nz
Divorce

No one gets into a marriage expecting to get a divorce. This emotional chapter of life can be a m ajor disruption. In this situa tion, some people may choose to sell their property and spilt the earnings. This can be a very difficult process for all involved. Possessions often make up a big part of disagreements , but it doesn’t have to be like that.

If you are selling in this situa tio n, you need to have clear communication, while respecting each other’s boundaries and needs during this time.
Once the divorce and sale of the home is done, you may need to buy a new home that accommodates your new lifestyle and budget. When making a real estate decision based on divorce, it's essential to consider factors such as legal agreements, child custody arrangements, and financial sta bility .
Health issues
Another challenge that may change your living needs are health iss ues. If you or a family member has a disability or mobility iss ues, you may need to find a home that is more accessible or has features that accommodate those needs. In this situation you will want to consider factors such as home modifications, accessibility to medical facilities, and proximity to family and friends when searching for the right ho me
Financial windfalls

Everyone dreams of winning the lottery or receiving some extra cash Whether you got lucky with your lotto
numbers or are left a significant i nheri tance, financial windfalls impact your real estate decisions. You may choose to purchase a larger home or invest in rental properties to generate passive incom e When making a real estate decision based on a financial windfall, it's essential to consider factors such as taxes, ongoing expenses, and the potential for rental incom e.
Recessions
Life is full of ups and do wns, and the economy is the same. While it is nice to be riding the good times in the economy, at times the economy s hri nks, triggering a recession
During tough times, homeowners and buyers may have to reassess their finances and investments. This is also a time when some have to make difficult decisions to save themselves from economic strife From selling a home and downsizing, to opting to rent instead of entering hom eownership, a recession might mean having to change your living arrangements to accommodate this economic shift For example, many people might be faced with job loss or simply cannot afford to enter the housing ma rket. You don't want to be in a position of not being able to pay your mortgage increases.
Life events like these aren’t easy. With 95 years of experiencing the ups and do wns, LJ Hooker is here to help.
Life events can significantly impact your real estate journey. Whether you buy, sell or invest in pro perty, it will be very rewarding. Not all of these decisions will be easy, but they will all be important.
When navigating these significant milestones, being prepared is your best a dvanta g e. The next step is to talk with a real estate expert who can walk you through the property options available to you that can help accommodate these events.

ljhooker.co.nz
When making a decision about where to live during your retirement, it's essential to consider factors such as proximity to family, healthcare facilities, and access to ameniti es.
The information contained in this publication is general in nature and is not intended to be personalised real estate advice Before making any decis ions, you should consult a legal or professional advisor LJ Hooker New Zealand Ltd believes the information in this publication is correct, and it has reasonable grounds for any opinion or recommendation contained in this publication on the date of this publication Nothing in this publication is, or should be taken as, an offer, invitation or recomm endation LJ Hooker New Zealand Ltd accepts no responsibility for any loss caused as a result of any person relying on any information in this pub lication This publication is for the use of persons in New Zealand only Copyright in this publication is owned by LJ Hooker New Zealand Ltd You must not reproduce or distribute content from this publication or any part of it without prior permission

MONTHLY PROPERTY REPORT. 18 April 2023
2 | REINZ Monthly Property Report Contents Northland ........................................................................................................................................................... 11 Auckland .............................................................................................................................................................. 13 Waikato 15 Bay of Plenty 18 Gisborne 21 Hawke’s Bay 23 Taranaki 25 Manawatu/Whanganui 27 Wellington 30 Nelson/Marlborough/Tasman 33 West Coast 35 Canterbury 37 Otago 40 Southland 42 3 Press Release 4 Market Snapshot 7 Annual Median Price Changes 10 Seasonally Adjusted Median Price CLICKHERETOVIEWREPORTINFULL RegionalCommenatries
Market pace slow, activity in the regions starts to reappear
The Real Estate Institute of New Zealand’s (REINZ) March 2023 figures show the continuing impacts of the economic climate with median prices and sales counts easing and properties taking longer to sell.
REINZ Chief Executive Jen Baird, says there is no denying the current economy is influencing market activity.
Jen Baird CEO, REINZ

Nationally, new listings decreased by 17.7%, from 11,224 listings in March 2022 to 9,242 listings in March 2023. Compared to February 2023, listings increased by 13.5% from 8,143 to 9,242. New Zealand excluding Auckland listings decreased 15.2% year-on-year from 7,191 to 6,099. Auckland’s listings were down 22.1% from 4,033 to 3,143 year-on-year with the only regions increasing being Taranaki (+9.7%) and Marlborough (+18.6%).
“The weather events of the beginning of year are still being felt in those regions heavily impacted. The market is likely to remain in this phase as New Zealanders wait for peak of inflation, a settling in interest rates and some clarity around the possible outcome of the election. That said, with the number of listings continuing to ease, we may start to see the supply/demand balance change in some areas.”
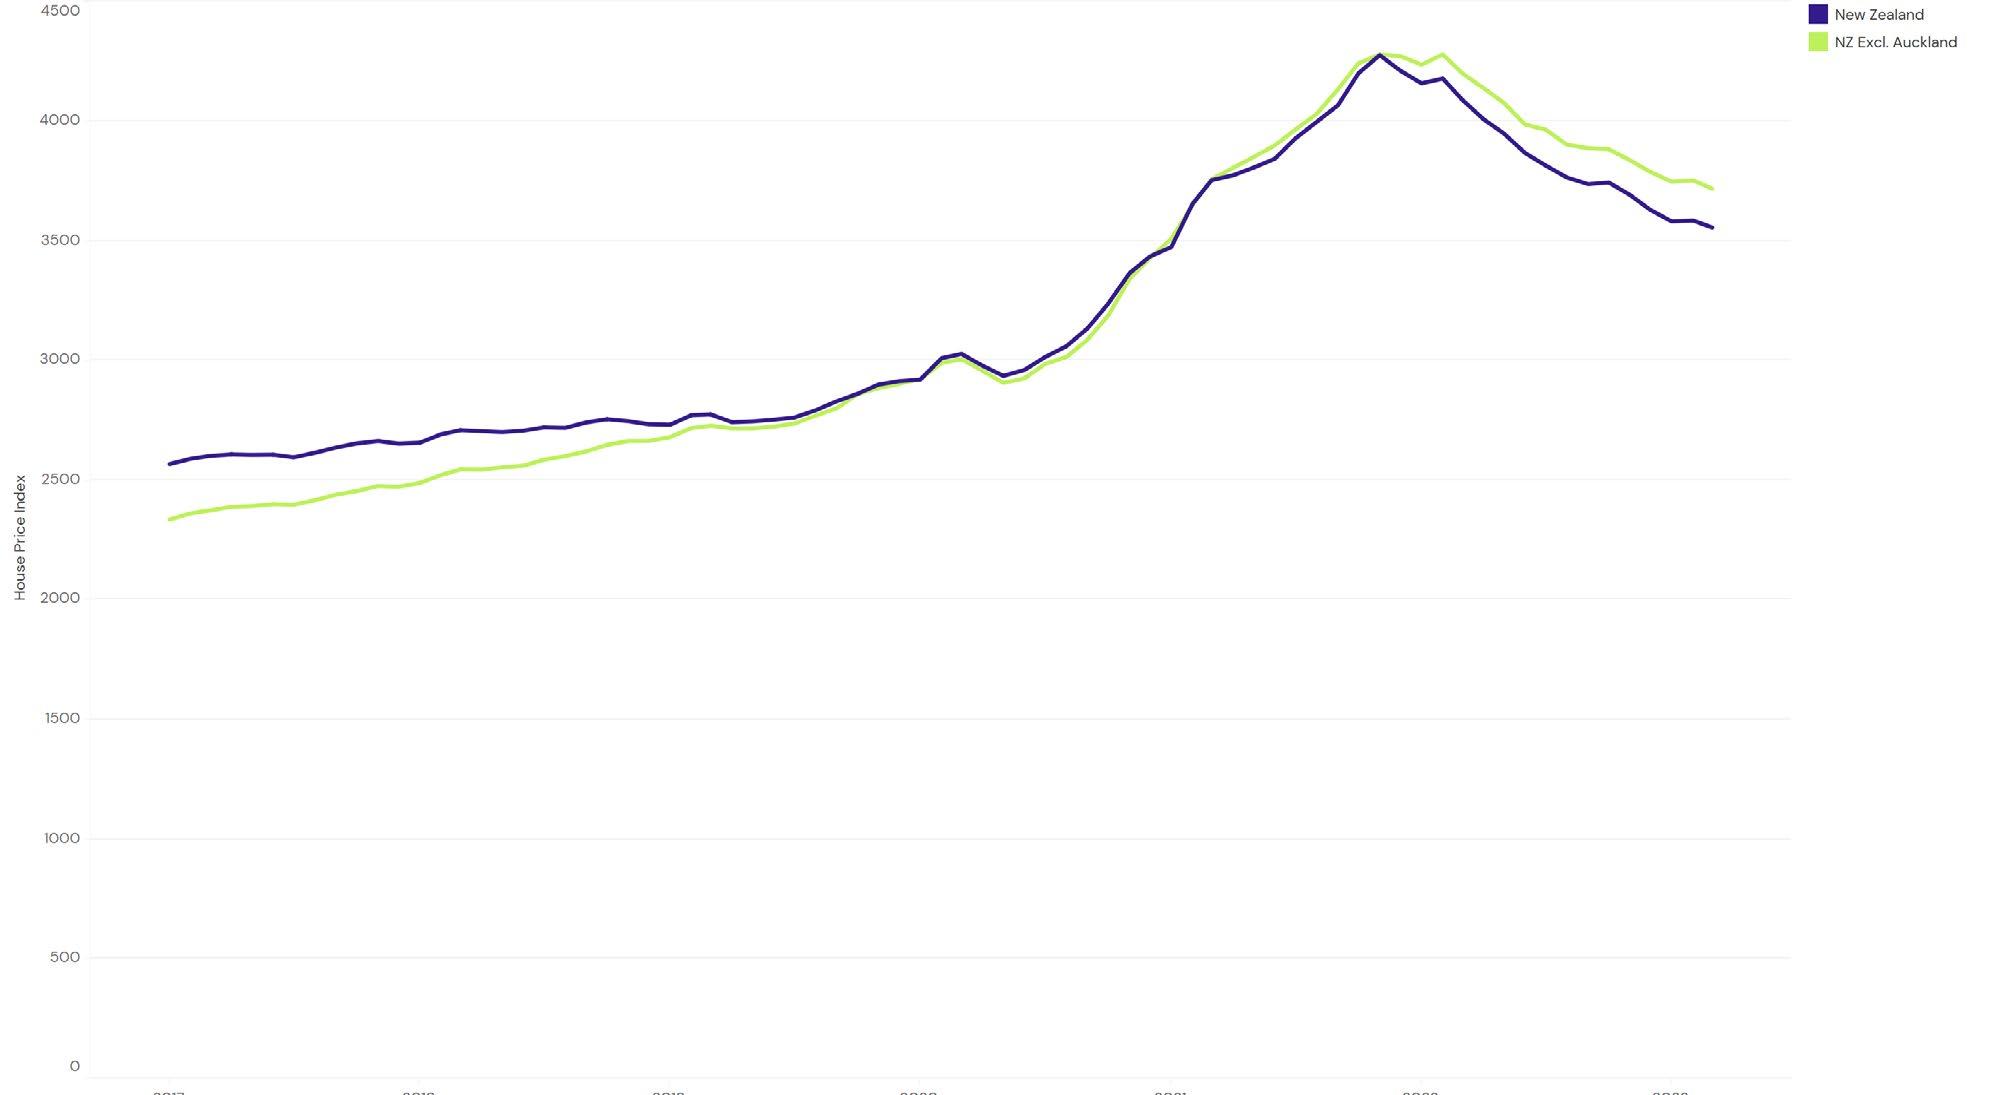
The REINZ House Price Index (HPI) for New Zealand which measures the changing value of residential property nationwide showed an annual decrease of 13.1% for New Zealand and a 11.5% decrease for New Zealand excluding Auckland.
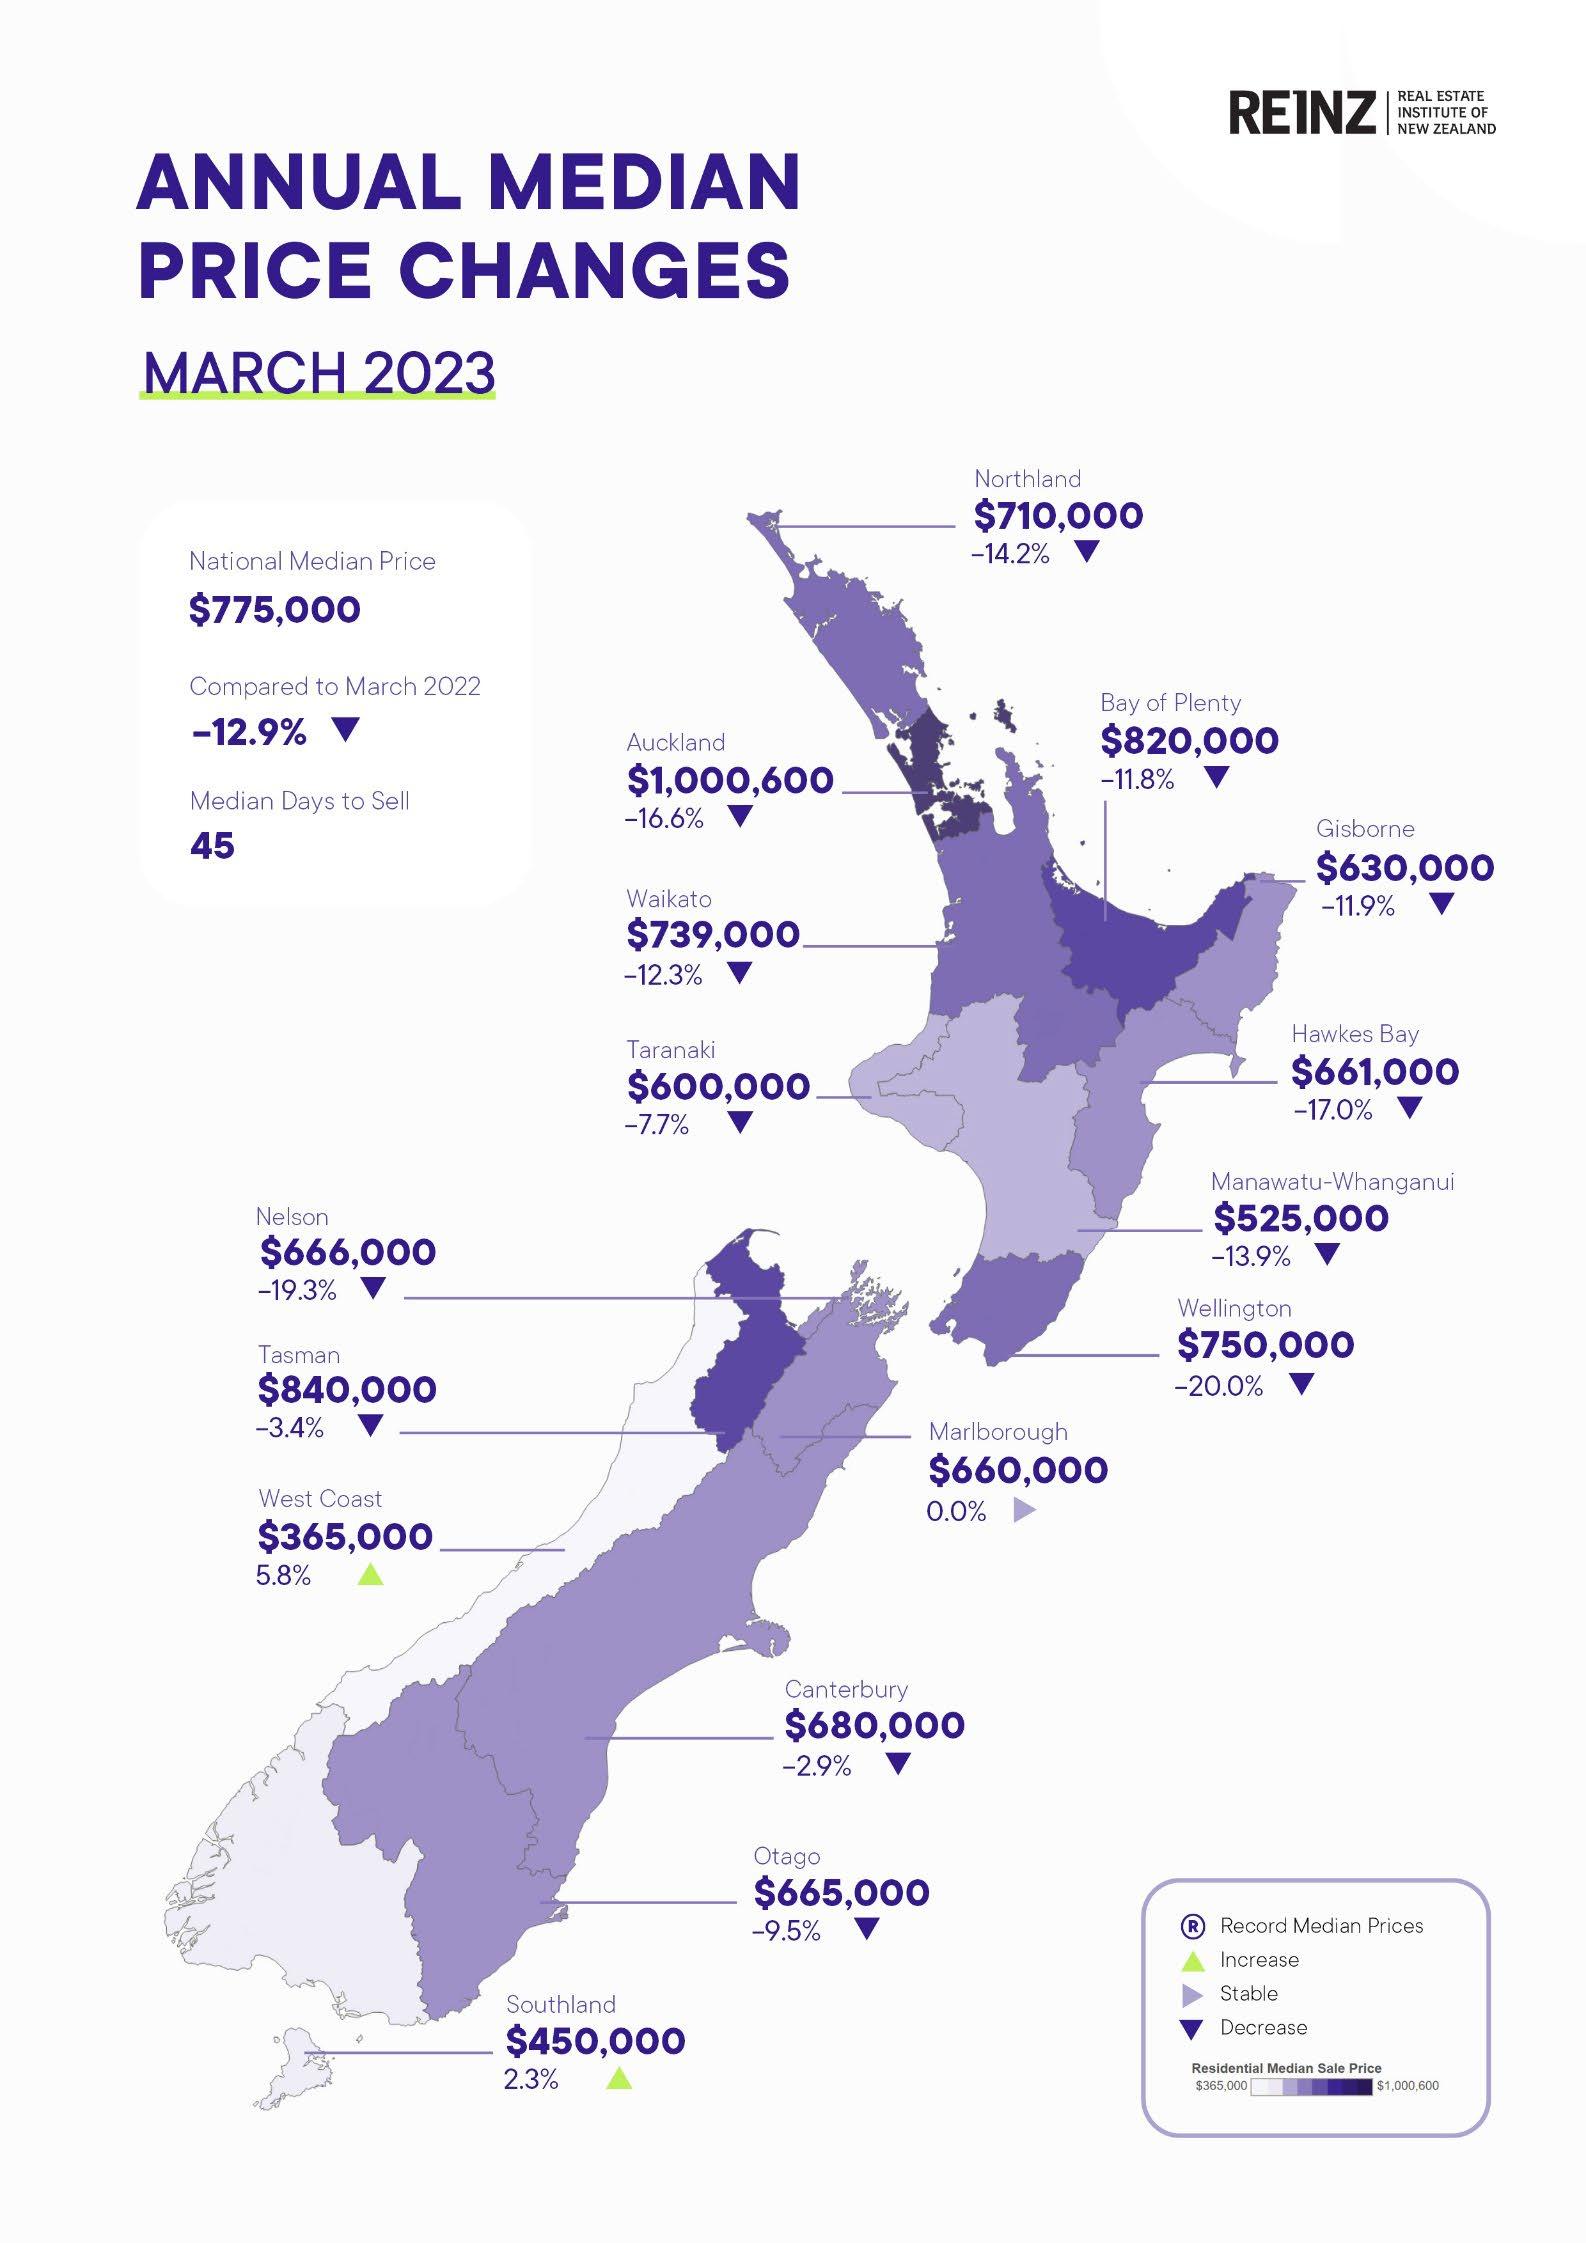
Nationally, the median price decreased 12.9% annually to $775,000 in March 2023. Days to sell have risen to 45 days for March 2023 — up 9 days compared to March 2022 and down 15 days from 60 when compared to February 2023.
At the end of March, the total number of properties for sale across New Zealand was 29,284, up 3,625 properties (+14.1%) year-on-year, and up 0.7% month-on-month. New Zealand excluding Auckland was also up from 14,923 to 18,742, an increase of 3,819 properties annually (+25.6%). Month-on-month, inventory increased 0.5%.
“Inventory levels are returning to the long-term average, which presents an opportunity for buyers looking to take advantage of the lower prices and less competition. REINZ members tell us first home buyers are actively returning in the regions with the advantage of choice as investors remain absent,” says Baird.
The total number of properties sold across New Zealand in March 2023 was 5,877, up from 4,113 in February 2023 (+42.9%), and down 15.0% year-on-year. New Zealand excluding Auckland sales counts decreased by 10.0% year-on-year but increased 34.3% month-on-month.
“There are clear signs that we are in the lower phase of the cycle, but with nearly 6,000 properties sold, vendors who are motivated to sell are meeting the market with more realistic expectations on time frame and price. Those who need to sell are still selling.”
The Real Estate Institute of New Zealand (REINZ) has the latest and most accurate real estate data in New Zealand.
For more information and data on national and regional activity visit the REINZ’s website
Media contact:
Laura Wilmot
Head of Communications and Engagement, REINZ Mobile: 021 953 308 lwilmot@reinz.co.nz
3 | REINZ Monthly Property Report
”
“ While we have seen activity pick up in March, this year’s summer season has been muted. Prices have eased as we can see, and properties are taking longer to sell. Buyers are taking their time, they are negotiating, and some are waiting to see if prices ease further.
REINZ Monthly Property Report | 3
Market Snapshot - March 2023

MEDIAN HOUSE PRICE YEAR-ON-YEAR � T National $775,000 -12.9% T NZ excl Aki $695,000 -9.7% T Auckland $1,000,600 -16.6% MEDIAN HOUSE PRICE MONTH-ON-MONTH � ... National $775,000 1.3% ... NZ excl Aki $695,000 0.4% T Auckland $1,000,600 -0.4%
Days to sell nationally
days year-on-year REINZ HOUSE PRICEINDEX YEAR-ON-YEAR C: National 3,556 -13.1% NZ excl Aki 3,718 -11.5% Auckland 3,331 -15.5% T SALESCOUNT YEAR-ON-YEAR � T National 5,877 -15.0% T NZ excl Aki 4,054 -10.0% T Auckland 1,823 -24.4% SALES COUNT MONTH-ON-MONTH � ... National 5,877 42.9% ... NZ excl Aki 4,054 34.3% Auckland 1,823 66.5% 44 ._ NZ excl Aki +9 days 45 • Auckland +6 days SEASONALLY ADJUSTED SALESCOUNT MONTH-ON-MONTH �04,r<I I> �Pv�� ... ... T National NZ excl Aki Auckland 0.7% 6.0% -11.4% 4 | REINZ Monthly Property Report
45
+9
Median house prices
Our two biggest cities have seen ongoing year-on-year median price declines for the beginning of 2023.
There were no record median prices at the regional or territorial authority level this month.
Sales counts
New Zealand, New Zealand excluding Auckland, Bay of Plenty, Canterbury, Manawatu-Whanganui, Marlborough, Nelson, Otago and Waikato all had the most sales this month since March 2022.
March saw the lowest sales count in:
Taranaki since records began
Auckland, Nelson, Tasman and Wellington since 2008
NZ, NZ Excl. Auckland, Bay of Plenty, Marlborough, and Waikato since 2011
Northland since 2012
Southland since 2013
Canterbury and Manawatu-Whanganui since 2014
Otago and West Coast since 2020.
Days to Sell Month-on-month
All regions had a decrease in median days to sell compared to February 2023, bar Gisborne (+1 day) and Marlborough (+16 days).
March 2023* saw the highest median days to sell in Marlborough since June 2012. Nelson and Waikato recorded their lowest median days to sell since May 2022 and June 2022 respectively.
All regions had an increase in median days to sell year-on-year for March except the West Coast – down 8 days annually. At 26 days, this is the lowest median days to sell in the West Coast in a March month since 2004.
In terms of the month of March, March 2023 had the highest median Days to Sell in:
Hawke’s Bay and Wellington since records began
Auckland and Marlborough since 2001
Gisborne since 2002
New Zealand since 2009
New Zealand excluding Auckland, Otago and Tasman since 2011.
*Excluding the month of January and the two lockdown-affected months of April 2020 and May 2020
House Price Index (HPI)
The HPI measures the changing value of residential property nationwide.
Wellington has been in the bottom two ranked regions seventeen months in a row for the year-on-year HPI movement.
Bay of Plenty and Waikato had their second largest year-on-year drop in HPI since records began.
New Zealand excluding Auckland had its third-largest year-on-year drop in HPI since records began.
Southland is the top-ranked region for HPI year-on-year movement this month. Taranaki ranked second and Otago ranked third.
More information on activity by region can be found in the regional commentaries section of the Monthly Property Report.
7 | REINZ Monthly Property Report
Compared to February Compared to March 2022
Sales volumes seasonally adjusted Median price seasonally adjusted
Compared to February Compared to March 2022
10 | REINZ
Monthly Property Report
Count Change Seasonally Adjusted Change Count Change Seasonally Adjusted Change New Zealand 42.9% 0.7% -15.0% -21.1% NZ ex Akl 34.3% 6.0% -10.0% -14.9% Northland 21.4% 3.6% -25.4% -30.0% Auckland 66.5% -11.4% -24.4% -32.5% Waikato 39.4% 13.5% -9.1% -11.3% Bay of Plenty 45.3% 15.4% -9.8% -14.2% Gisborne 28.6% 10.8% 9.1% 1.6% Hawke’s Bay 49.2% 21.9% 0.6% 0.7% Manawatu/Whanganui 38.4% 14.7% -3.9% -9.7% Taranaki 20.8% -0.1% -18.1% -21.9% Wellington 29.1% -2.5% -3.2% -5.3% Nelson 37.5% 7.4% -7.2% -14.0% Marlborough 91.9% 52.5% -19.3% -24.1% Tasman -8.2% -27.8% -34.1% -40.9% Canterbury 32.7% 1.6% -13.0% -18.1% West Coast -7.3% -12.4% -9.5% -11.6% Otago 38.7% 15.0% -10.0% -12.7% Southland 36.2% 2.6% -0.7% -0.6%
Median Change Seasonally Adjusted Change Median Change Seasonally Adjusted Change New Zealand 1.3% -2.2% -12.9% -12.9% NZ ex Akl 0.4% 0.3% -9.7% -9.8% Northland 0.0% -11.5% -14.2% -5.1% Auckland -0.4% -3.1% -16.6% -16.6% Waikato -4.6% -4.6% -12.3% -12.3% Bay of Plenty -0.2% -0.2% -11.8% -11.8% Gisborne 9.6% 9.6% -11.9% -11.9% Hawke's Bay -1.5% -1.5% -17.0% -17.0% Manawatu/Whanganui -1.9% -0.9% -13.9% -12.3% Taranaki 3.4% 2.8% -7.7% -7.3% Wellington -5.7% -3.6% -20.0% -20.5% Nelson -2.8% -2.8% -19.3% -19.3% Marlborough -3.6% -3.6% 0.0% 0.0% Tasman -1.2% -1.2% -3.4% -3.4% Canterbury 2.3% 1.8% -2.9% -2.4% West Coast 4.3% 4.3% 5.8% 5.8% Otago -3.6% -3.6% -9.5% -9.5% Southland 4.7% 4.7% 2.3% 2.3%

© REINZ - Real Estate Institute of New Zealand Inc. MONTHLY HOUSE PRICE INDEX REPORT 18 April 2023
REINZ House Price Index (HPI)
As one of the country’s foremost authorities on real estate data, we are proud to bring you the REINZ HPI (House Price Index). It provides a level of detail and understanding of the true movements of housing values over time to a higher standard than before. The REINZ HPI was developed in partnership with the Reserve Bank of New Zealand and provides a more complete picture of the New Zealand housing market.
BENEFITS OF THE REINZ HPI
Data on median and average house prices is open to being skewed by market composition changes. This means observed changes in these values could be almost entirely due to the changed nature in the underlying sample (e.g. an unusually large representation of high end housing sales) rather than changes in the true market value. The REINZ HPI takes many aspects of market composition into account resulting in greater accuracy.
ABOUT REINZ HPI
The REINZ HPI is based on the SPAR methodology and has been proven to be the most comprehensive tool to understand the housing market for four main reasons:
• Timeliness - This is the number one advantage of REINZ HPI. REINZ data is based on sales as they occur (unconditional) so is the most up to date data source in NZ.
• Accuracy - REINZ data is supplied by the actual sales prices supplied by its members so has a high level of accuracy.
• Stability - REINZ has the most data available to it so can provide the most stable and complete one month indices.
• Disaggregation - Indices can be disaggregated to a lower level than before. Disaggregation means you can focus on a smaller data set, allowing comparison of building typology and suburbs, i.e. Three bedroom houses in Manukau.
EXPERT INDUSTRY FEEDBACK
“I have had the opportunity to utilise the REINZ HPI website, and have been involved in advising on the HPI’s preparation. The new index fills a gap in providing reliable up to date information on house price developments across all of New Zealand’s local authorities. It’s wonderful to see REINZ providing this level of detailed data for wider public use. I am already planning to use this data in my own research.”
Dr Arthur Grimes Senior Fellow, Motu Research; and Adjunct Professor, Victoria University of Wellington
“Accuracy and timeliness of information on house price movements is vital for home buyers, sellers, agents, and analysts such as myself. The data from REINZ meets both requirements and gives New Zealand a collection of house price series comparable with the best overseas.”
Tony Alexander Independent Economist and Speaker
“The Real Estate Institute of New Zealand’s Market Intelligence portal opens up to users the ability to interactively compare price trends amongst a wide range of local council regions. Users can pick and choose regions of interest and use the chart tools to instantly compare price performances. For those wanting to look at house prices in more depth there is the capability to download the data in spreadsheet format all the way back to 1992 when the Institute started recording sales price information.”
Nick Tuffley Chief Economist, ASB
The number one advantage between REINZ data and other housing data on the market is that REINZ has access to sales data from the time the price is locked in (unconditional data) as opposed to when the house changes hands (settlement date) which can often be weeks/months later. Therefore, the REINZ HPI is the best and most timely measure of recent housing market activity.
2 | REINZ Monthly House
Index Report
Price
For more information visit: reinz.co.nz/reinz-hpi
MARCH 2023 RESULTS REINZ HOUSE PRICE INDEX
Looking at the REINZ HPI for March 2023, the ‘gold standard’ for New Zealand house price analysis, Jen Baird, Chief Executive at REINZ, says:
The REINZ House Price Index was developed in partnership with the Reserve Bank of New Zealand.

Already being used by the Reserve Bank’s forecasting and macro financial teams, plus the major banks, the REINZ HPI provides a level of detail and understanding of the true movements of housing values over time. It does this by analysing how prices in a market are influenced by a range of attributes such as land area, floor area, number of bedrooms etc. to create a single, more accurate measure of housing market activity and trends over time. Using the Reserve Bank’s preferred Sale Price to Appraisal Ratio (SPAR) methodology, the REINZ HPI uses unconditional sales data (when the price is agreed) rather than at settlement, which can often be weeks later. It is therefore more accurate and timely.
“The REINZ HPI takes many aspects of market composition into account and thus provides more accurate results. When applied to the March data, the HPI indicates that the housing market value nationwide has dropped 13.1% year-on-year. In Auckland, the value decreased by 15.5% and decreased by 11.5% outside of Auckland. Southland takes the top spot in the 12-month ending percentage changes. Taranaki and Otago came second and third, respectively, for annual percentage movement.
“The importance of the HPI is evident in the Taranaki region this month, where the median sale price tells a different story to the HPI.
“The median sale price in the region decreased 7.7% over the past year, a ‘middle-of-the-road’ return compared to the other regions. This suggests a market where value growth is approximately positioned in the ‘middle of the pack’ in the longer term compared to other regions.
“However, the Taranaki region had the second strongest annual performance of all regions in HPI over the past year with a decrease of 5.9%. Sample composition changes — such as the size of properties or the underlying value of properties sold — can change statistics, such as median, that are purely based on price. However, because the underlying value of each property sold is considered by the HPI, such sample changes have little effect on HPI results. In summary, long-term property value growth in Taranaki is decreasing at a slower rate than most other regions, a fact that would have remained hidden from those monitoring statistics without access to the HPI.”
3 | REINZ Monthly House Price Index Report
Year-on-year, the HPI indicates that housing market value nationwide has fallen 13.1%, down in Auckland by 15.5% and down outside Auckland by 11.5%.
NEW ZEALAND HOUSE PRICE INDICIES
4 | REINZ Monthly House Price Index Report
National House Price Index Figures
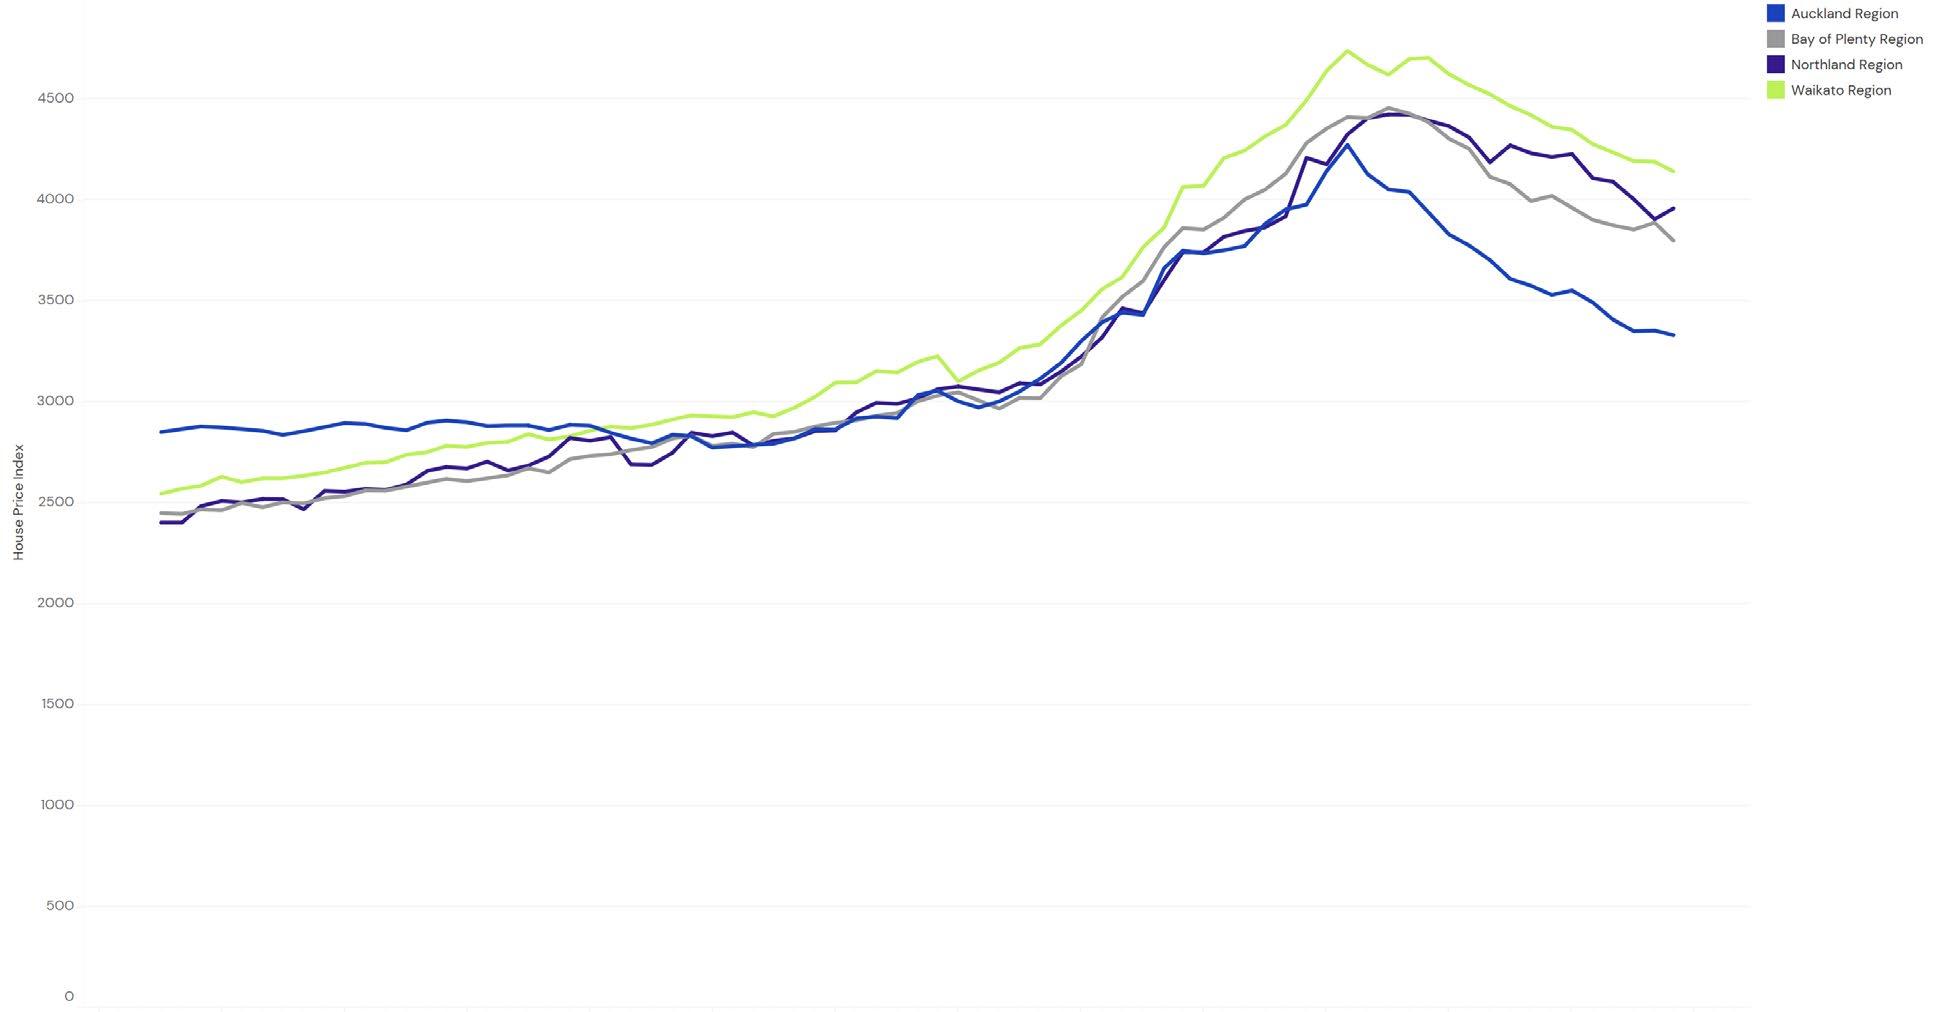
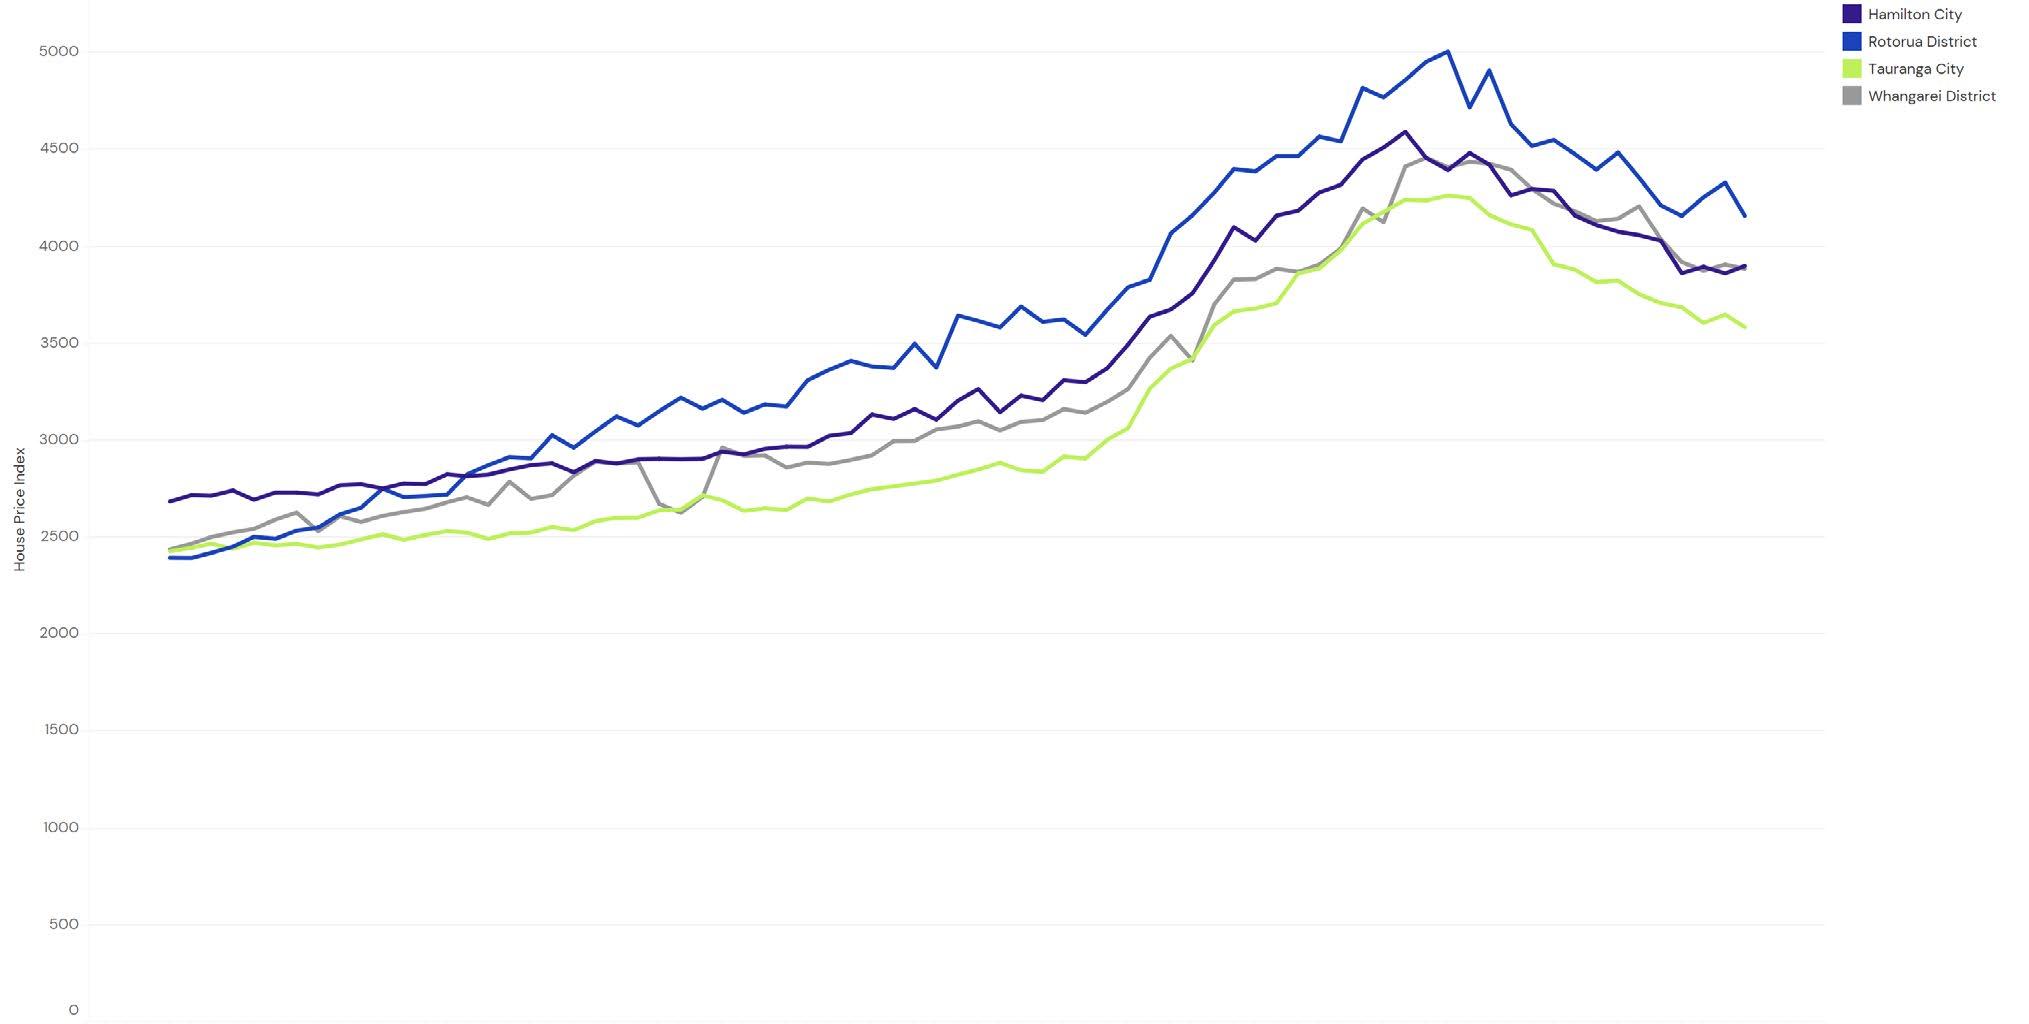
UPPER NORTH ISLAND
REGIONAL HOUSE PRICE INDICIES
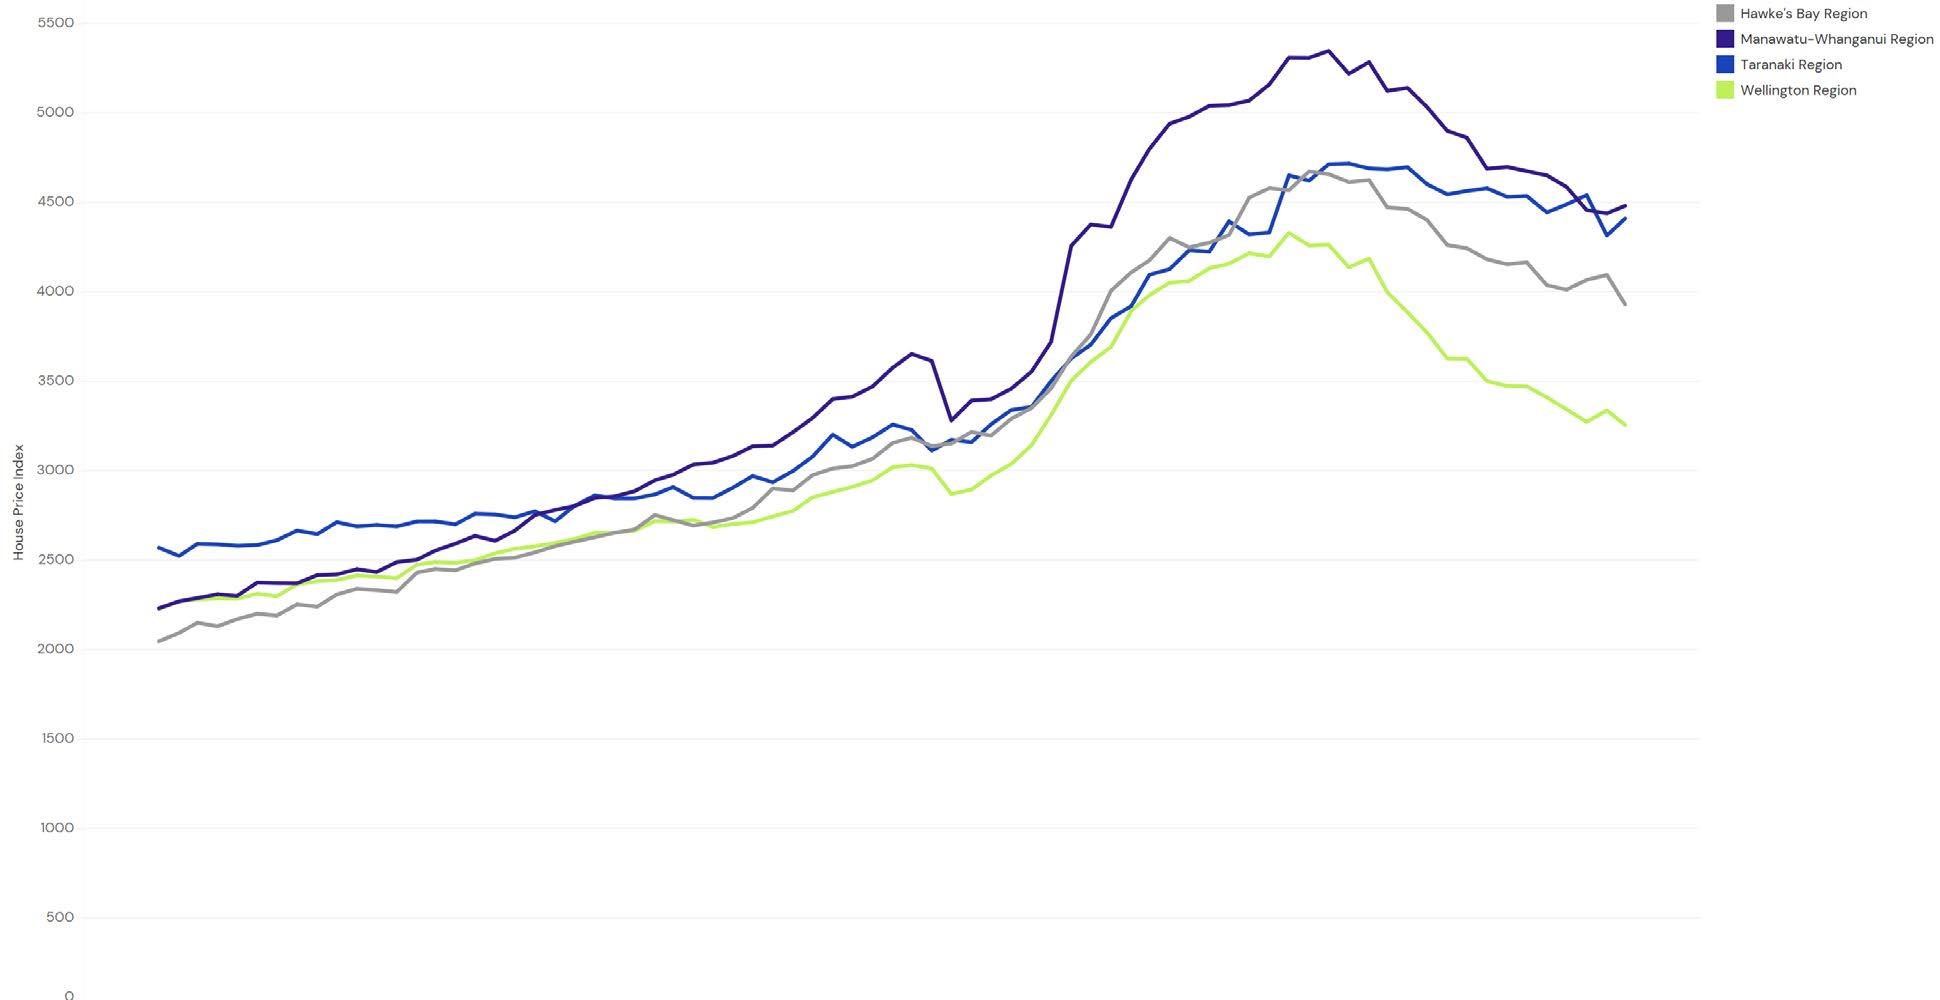
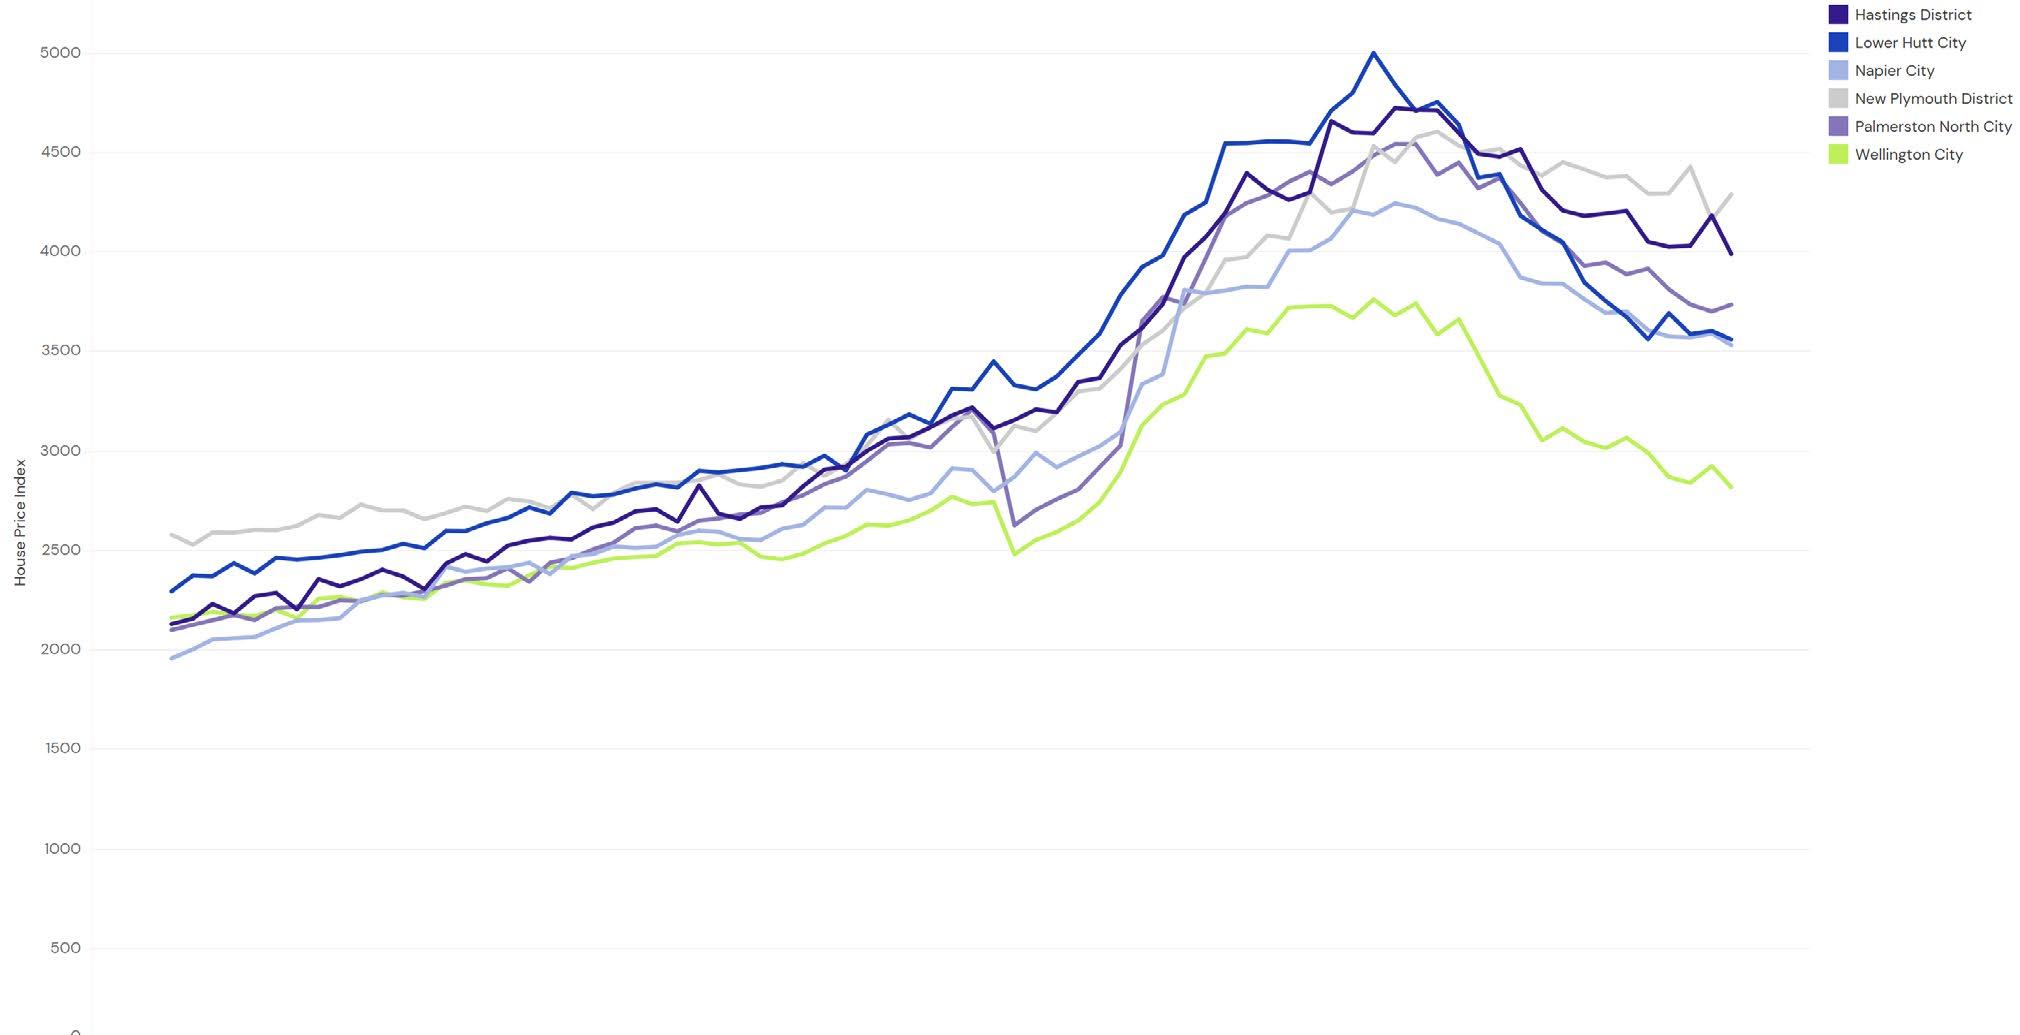
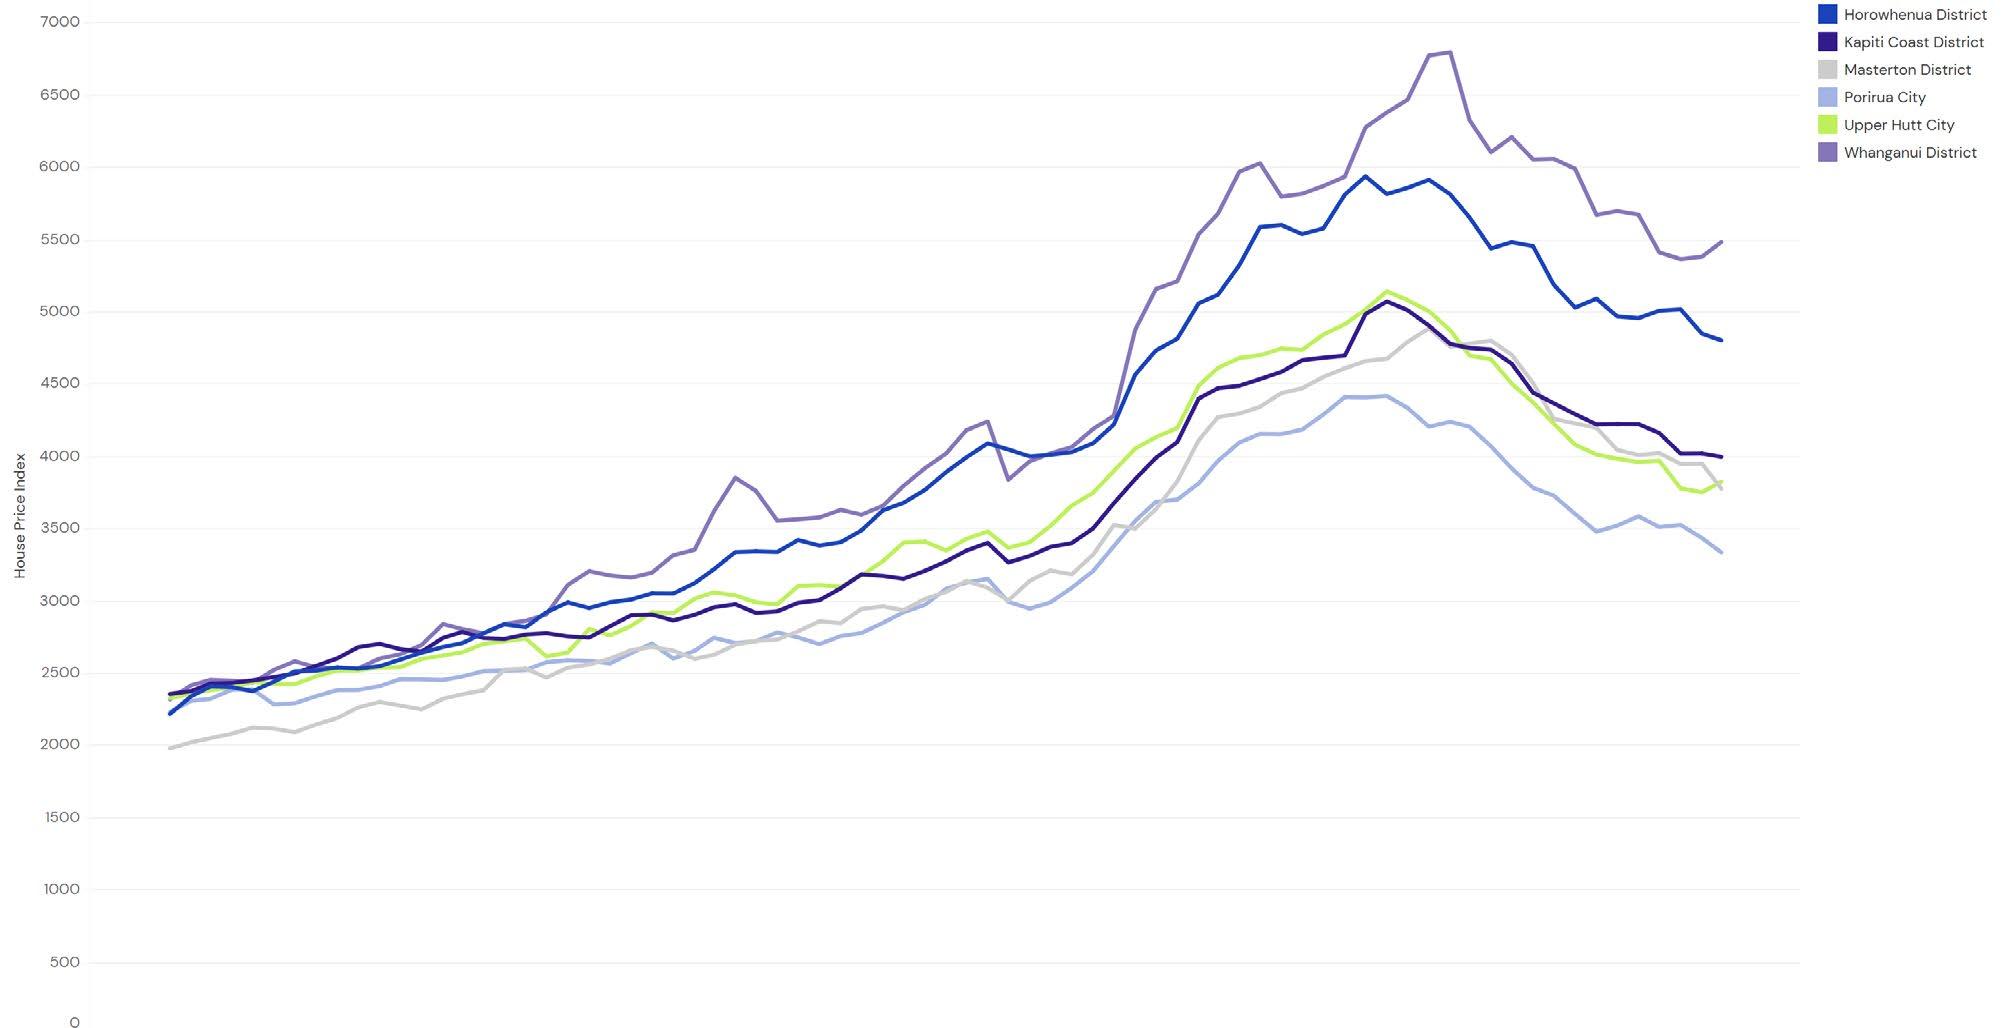
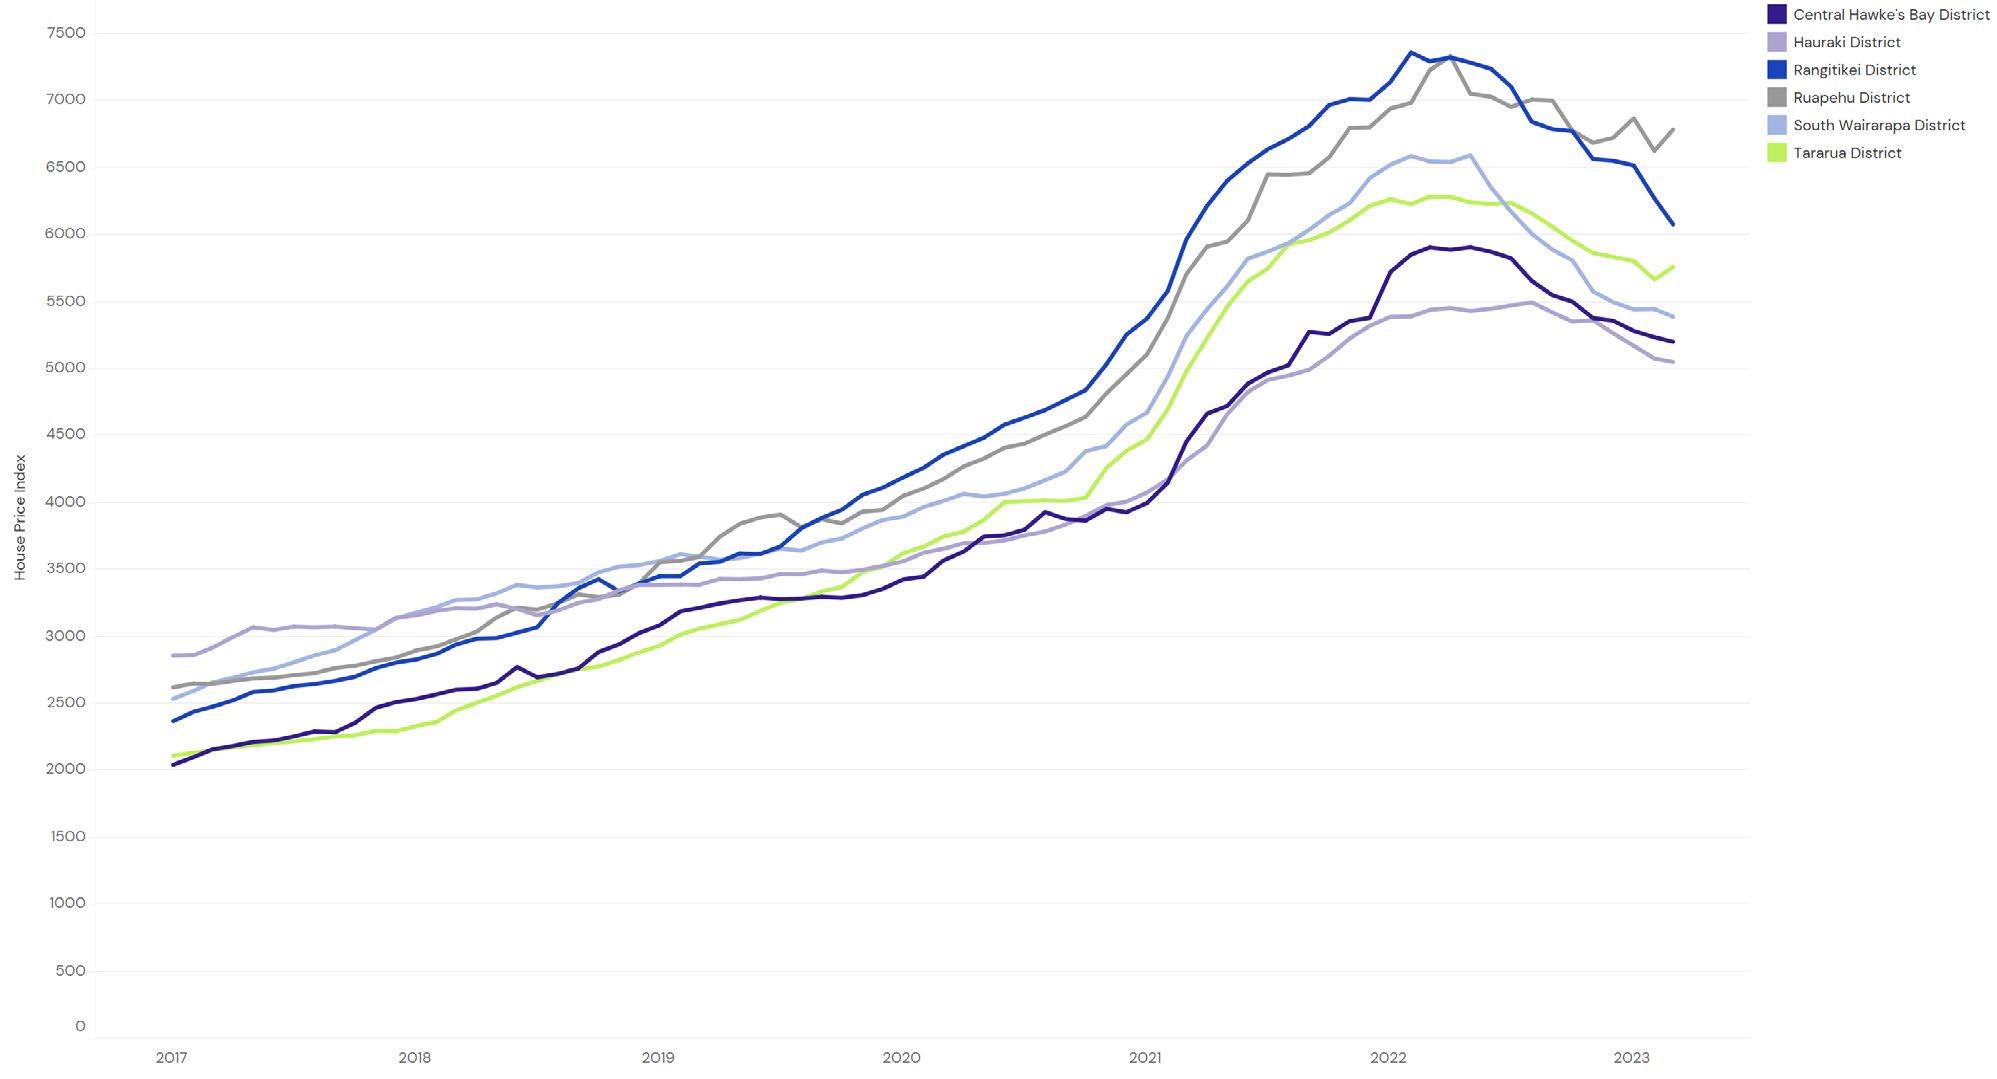
LOWER NORTH ISLAND REGIONAL HOUSE PRICE INDICIES
5 | REINZ Monthly House Price Index Report
Regional House Price Index Figures
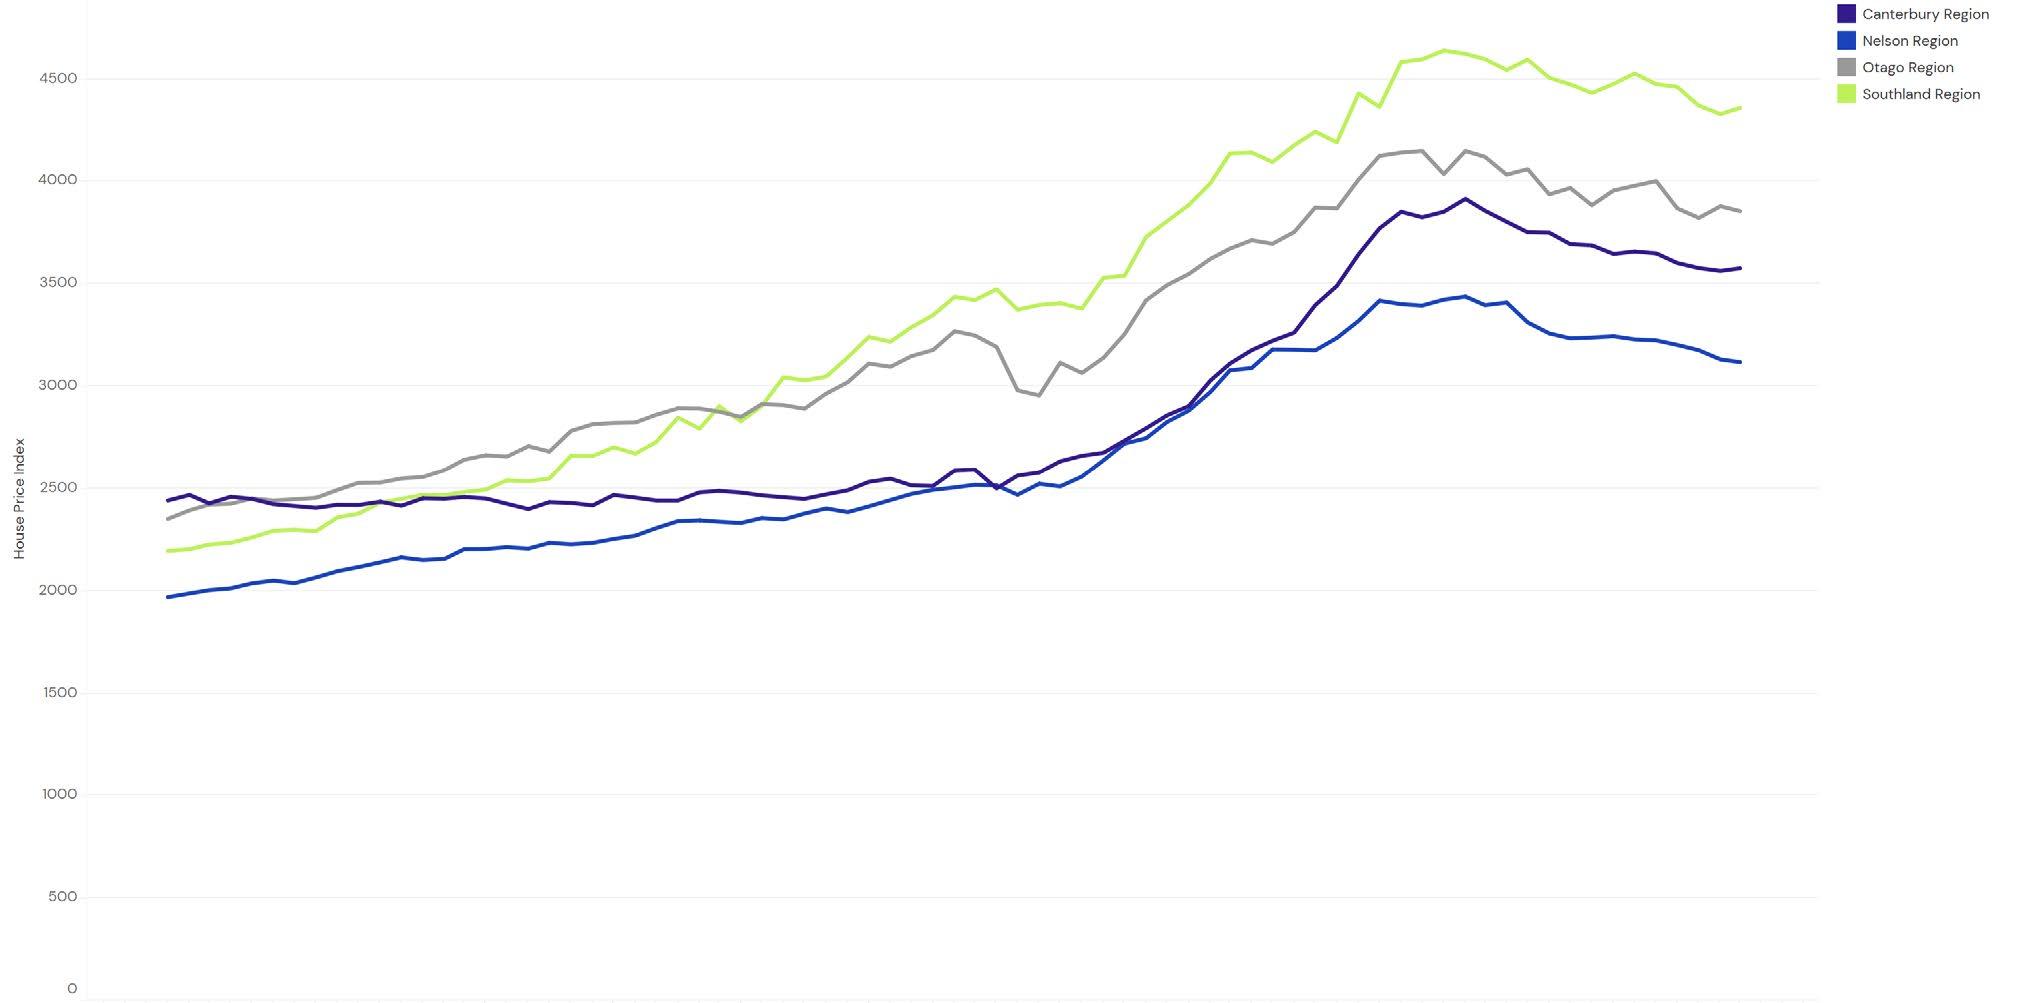
SOUTH ISLAND REGIONAL HOUSE PRICE INDICIES
SUMMARY OF MOVEMENTS
6 | REINZ Monthly House Price Index Report
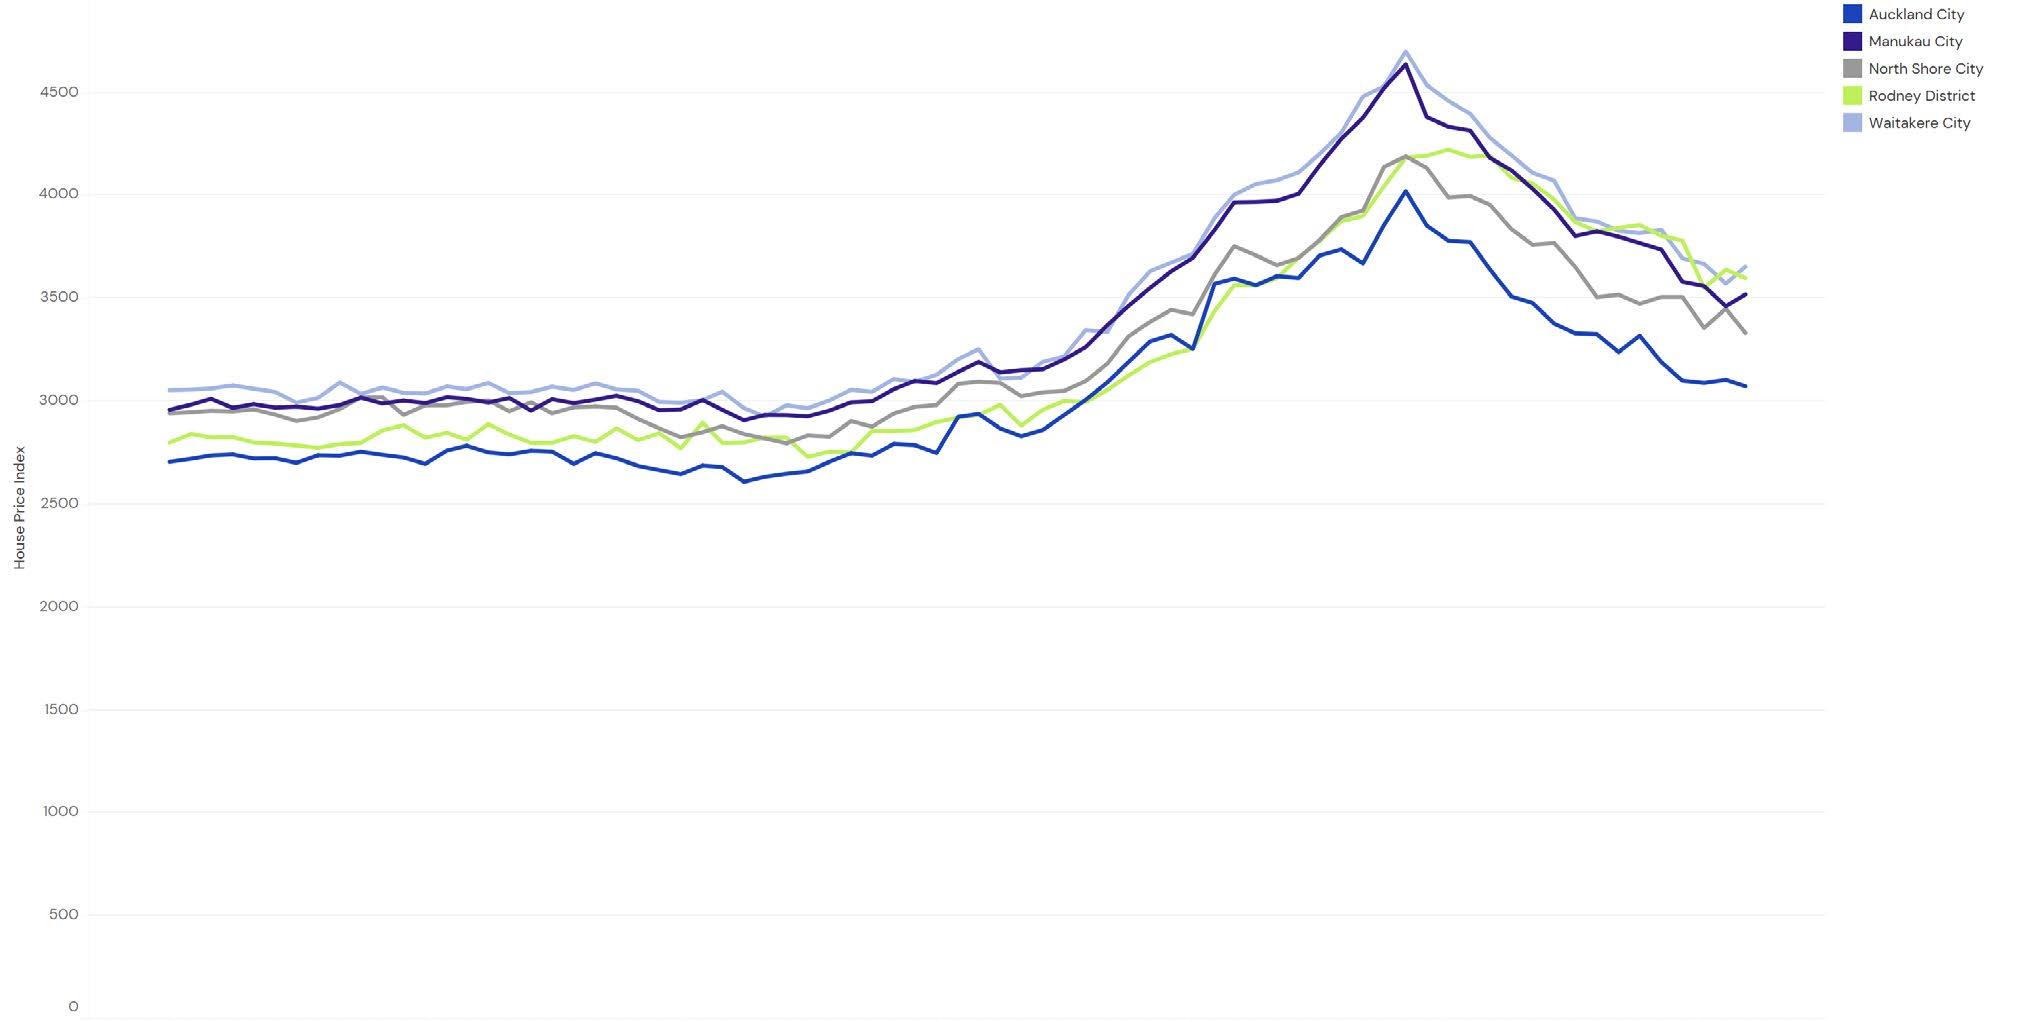
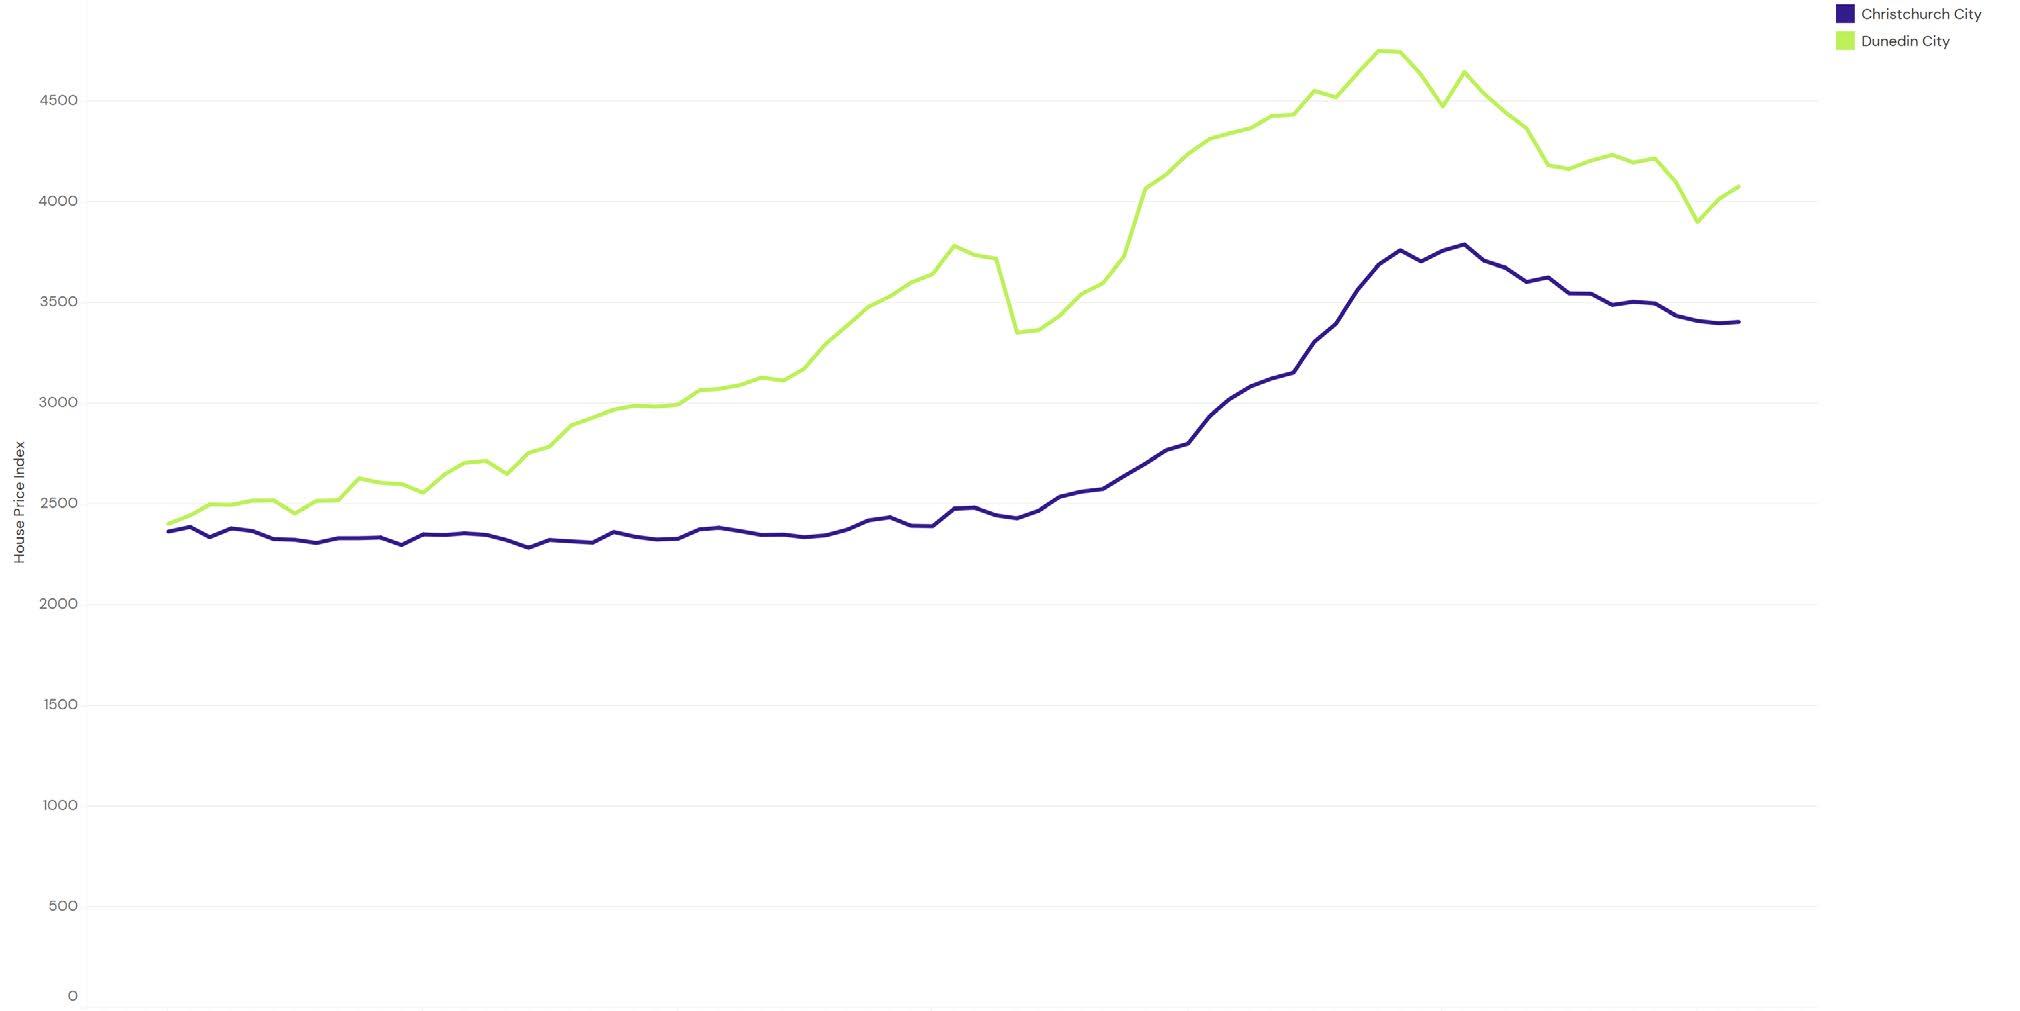
Regional House Price Index Figures House Price Index Index level One Month Three Months One Year Five Years* House Price Index Index level One Month Three Months One Year Five Years* New Zealand 3,556 -0.8% -2.0% -13.1% 5.6% NZ excl. Auckland 3,718 -0.9% -1.8% -11.5% 7.9% Auckland 3,331 -0.7% -2.3% -15.5% 2.8% Rodney District 3,600 -1.1% -4.8% -14.2% 5.0% North Shore City 3,333 -3.4% -5.0% -15.8% 2.1% Waitakere City 3,655 2.3% -1.1% -14.6% 3.6% Auckland City 3,074 -1.0% -0.9% -15.6% 2.0% Manukau City 3,520 1.6% -1.7% -15.9% 3.2% Papakura District 3,840 2.0% -1.0% -17.0% 4.5% Franklin District 4,006 -4.1% -3.5% -14.7% 5.0% Other North Island Whangarei District 3,887 -0.5% -0.9% -12.2% 7.5% Hamilton City 3,901 1.0% 1.0% -11.8% 6.7% Tauranga City 3,585 -1.8% -2.8% -13.9% 7.3% Rotorua District 4,160 -3.9% 0.0% -15.3% 8.0% Hastings District 3,994 -4.6% -0.9% -11.2% 10.0% Napier City 3,536 -1.6% -1.2% -13.7% 8.1% New Plymouth District 4,292 3.0% -0.1% -4.7% 9.5% Palmerston North City 3,739 0.9% -2.0% -13.5% 9.6% Wellington 3,258 -2.5% -2.6% -18.6% 5.5% Porirua City 3,365 2.1% -0.3% -18.4% 6.8% Upper Hutt City 3,862 0.3% -2.4% -18.5% 7.1% Lower Hutt City 3,564 -1.2% -3.6% -18.6% 6.5% Wellington City 2,822 -3.6% -1.8% -19.0% 3.7% South Island Nelson City 2,943 1.2% 0.2% -8.8% 7.0% Christchurch City 3,405 0.2% -0.9% -8.2% 7.7% Queenstown-Lakes District 3,560 -2.0% 1.0% -3.1% 6.9% Dunedin City 4,076 1.5% -0.6% -10.2% 8.5% Invercargill City 4,210 1.2% -2.8% -5.7% 11.9%
Source: REINZ *=Compound Growth Rate
AUCKLAND COUNCILS HOUSE PRICE INDICIES
UPPER NORTH ISLAND (EX-AUCKLAND)
COUNCIL HOUSE PRICE INDICIES
7 | REINZ Monthly House Price Index Report
Monthly Calculated House Price Index Figures For Councils
LOWER NORTH ISLAND COUNCILS HOUSE PRICE INDICIES
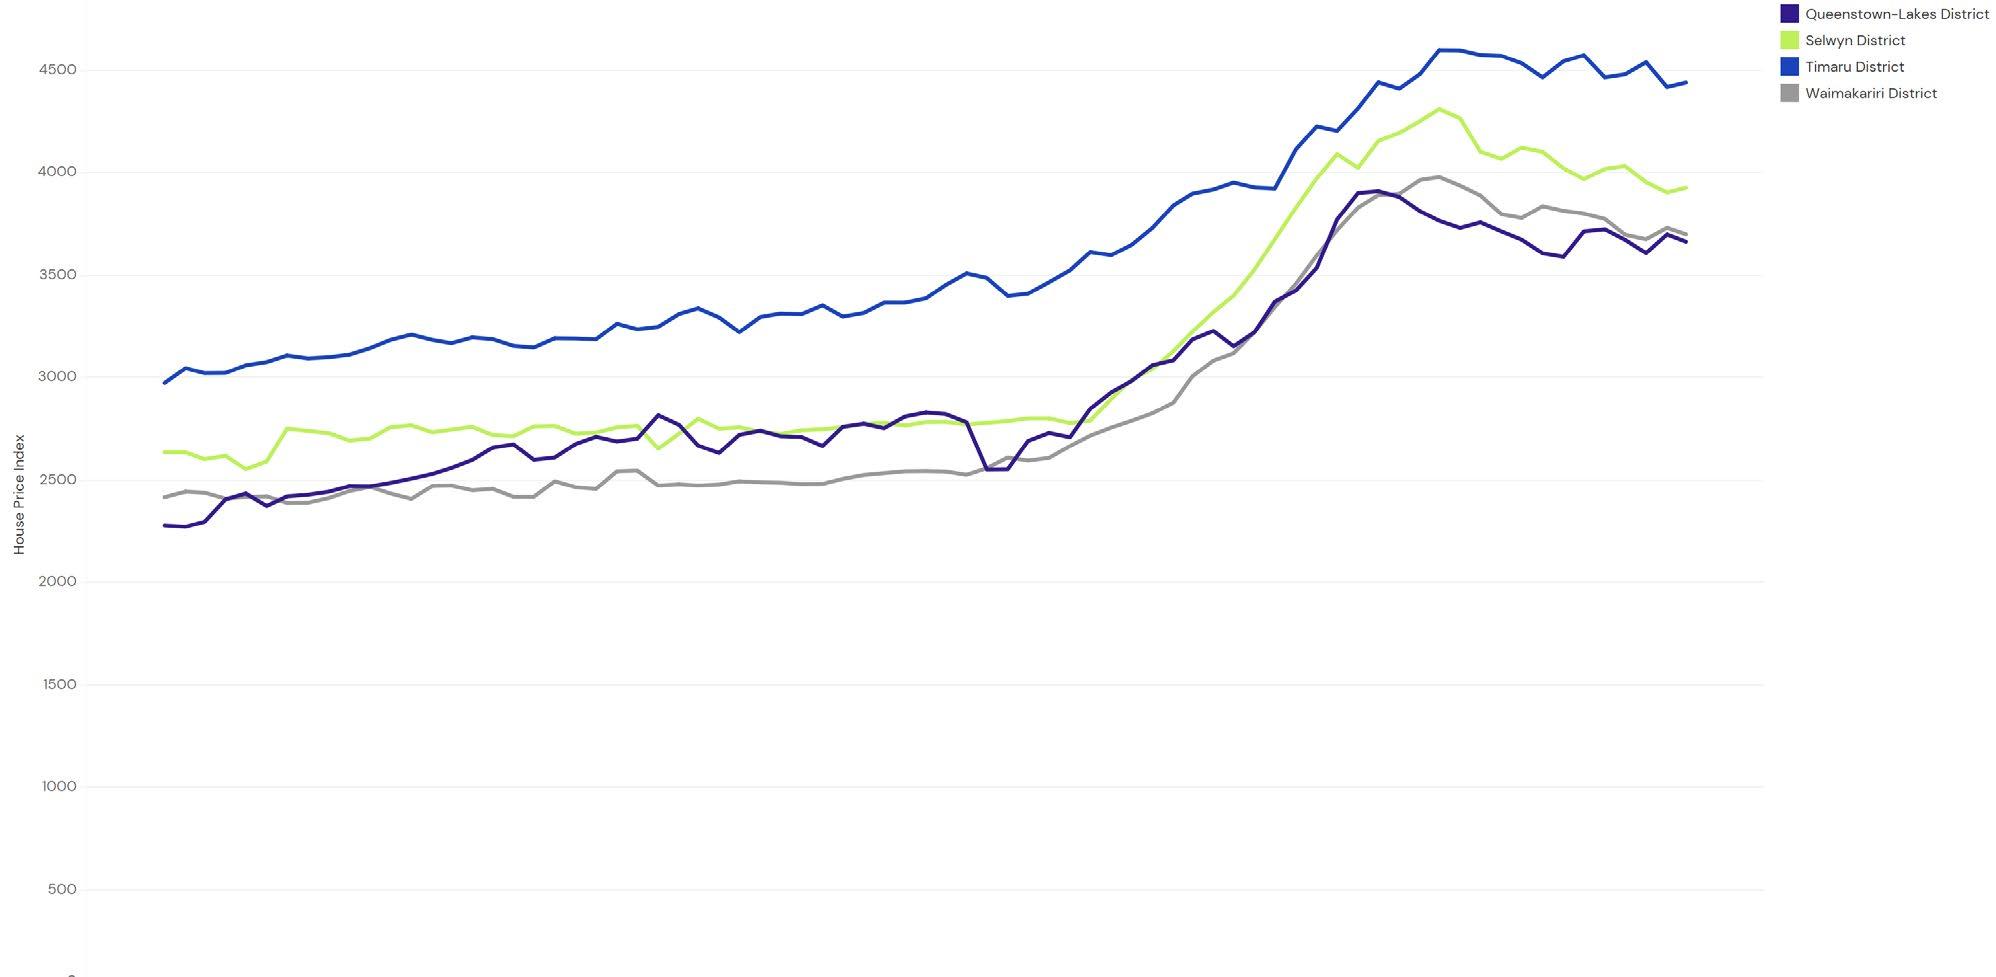
SOUTH ISLAND COUNCIL HOUSE PRICE INDICIES
8 | REINZ Monthly House Price Index Report
Monthly Calculated House Price Index Figures For Councils
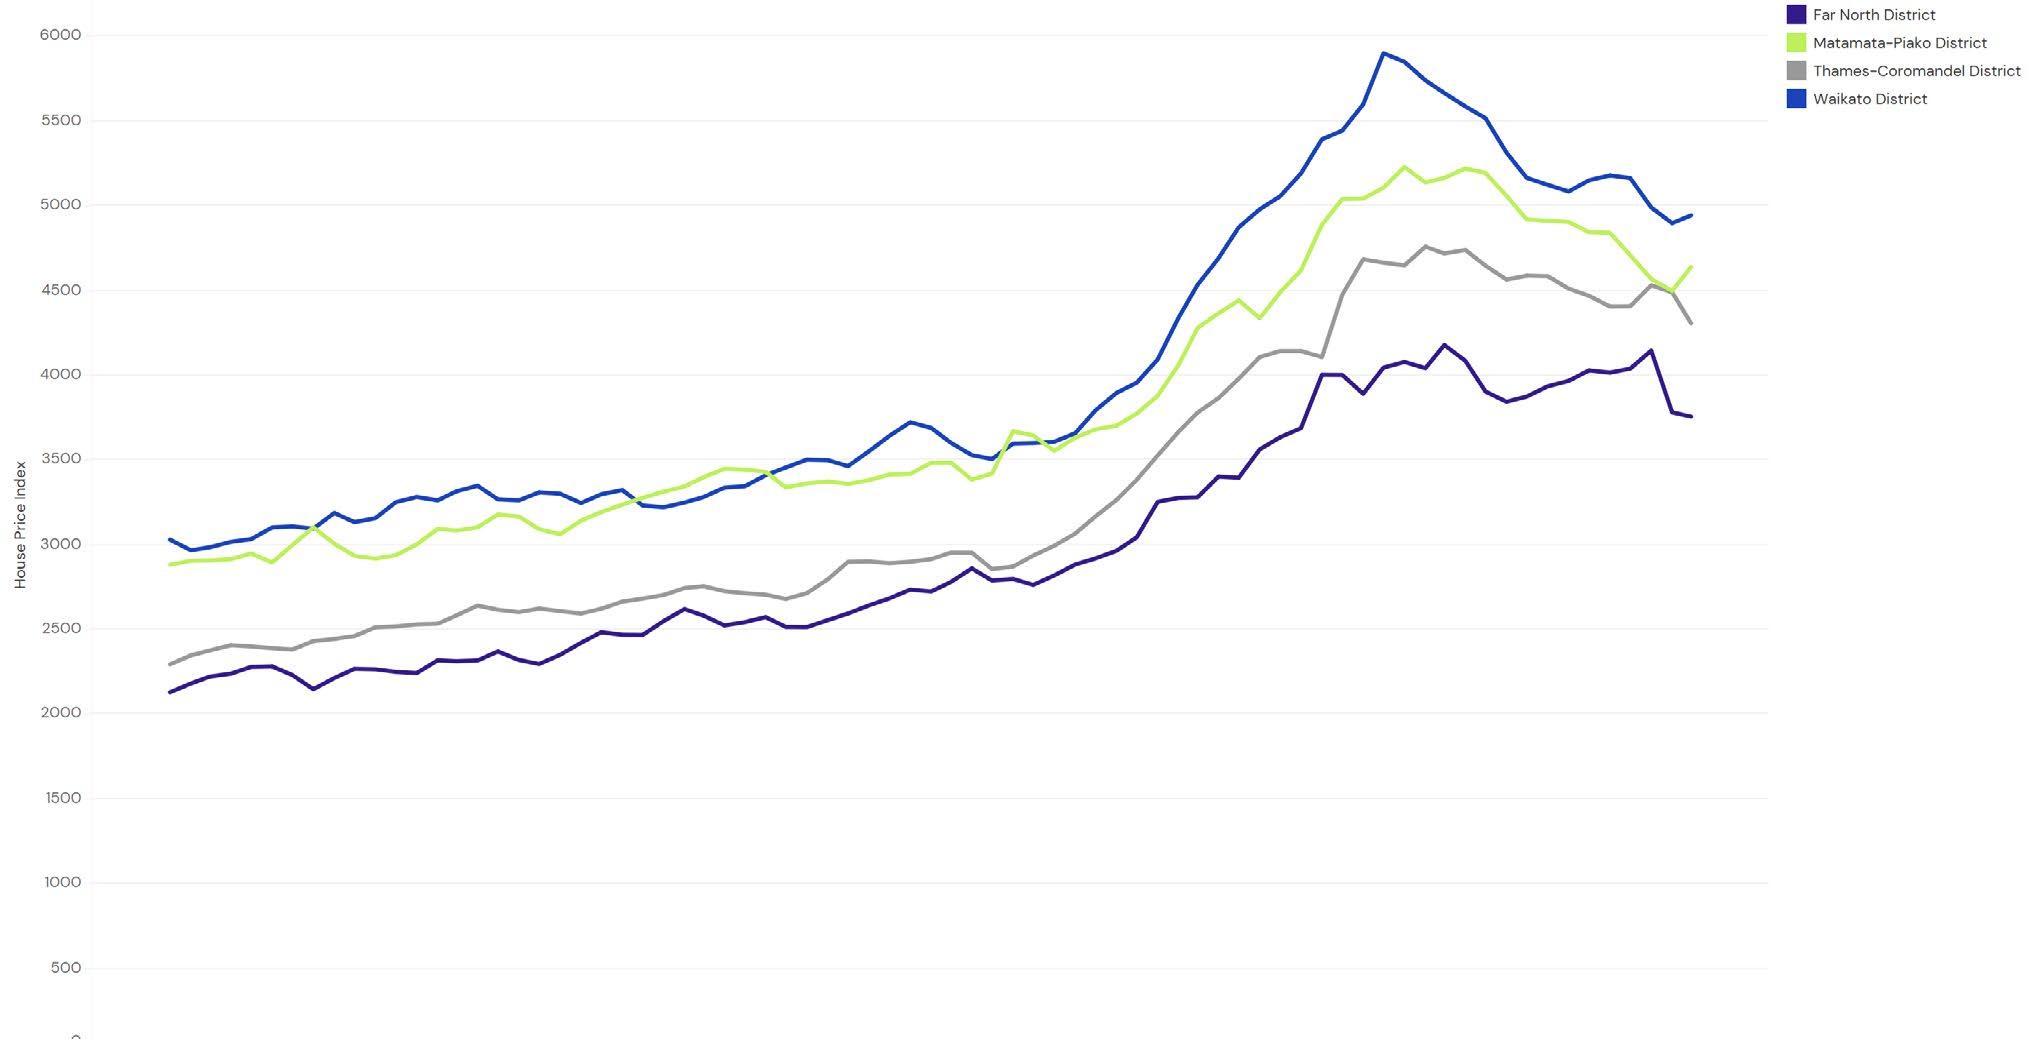
UPPER NORTH ISLAND
(EX-AUCKLAND) COUNCILS HOUSE PRICE INDICIES
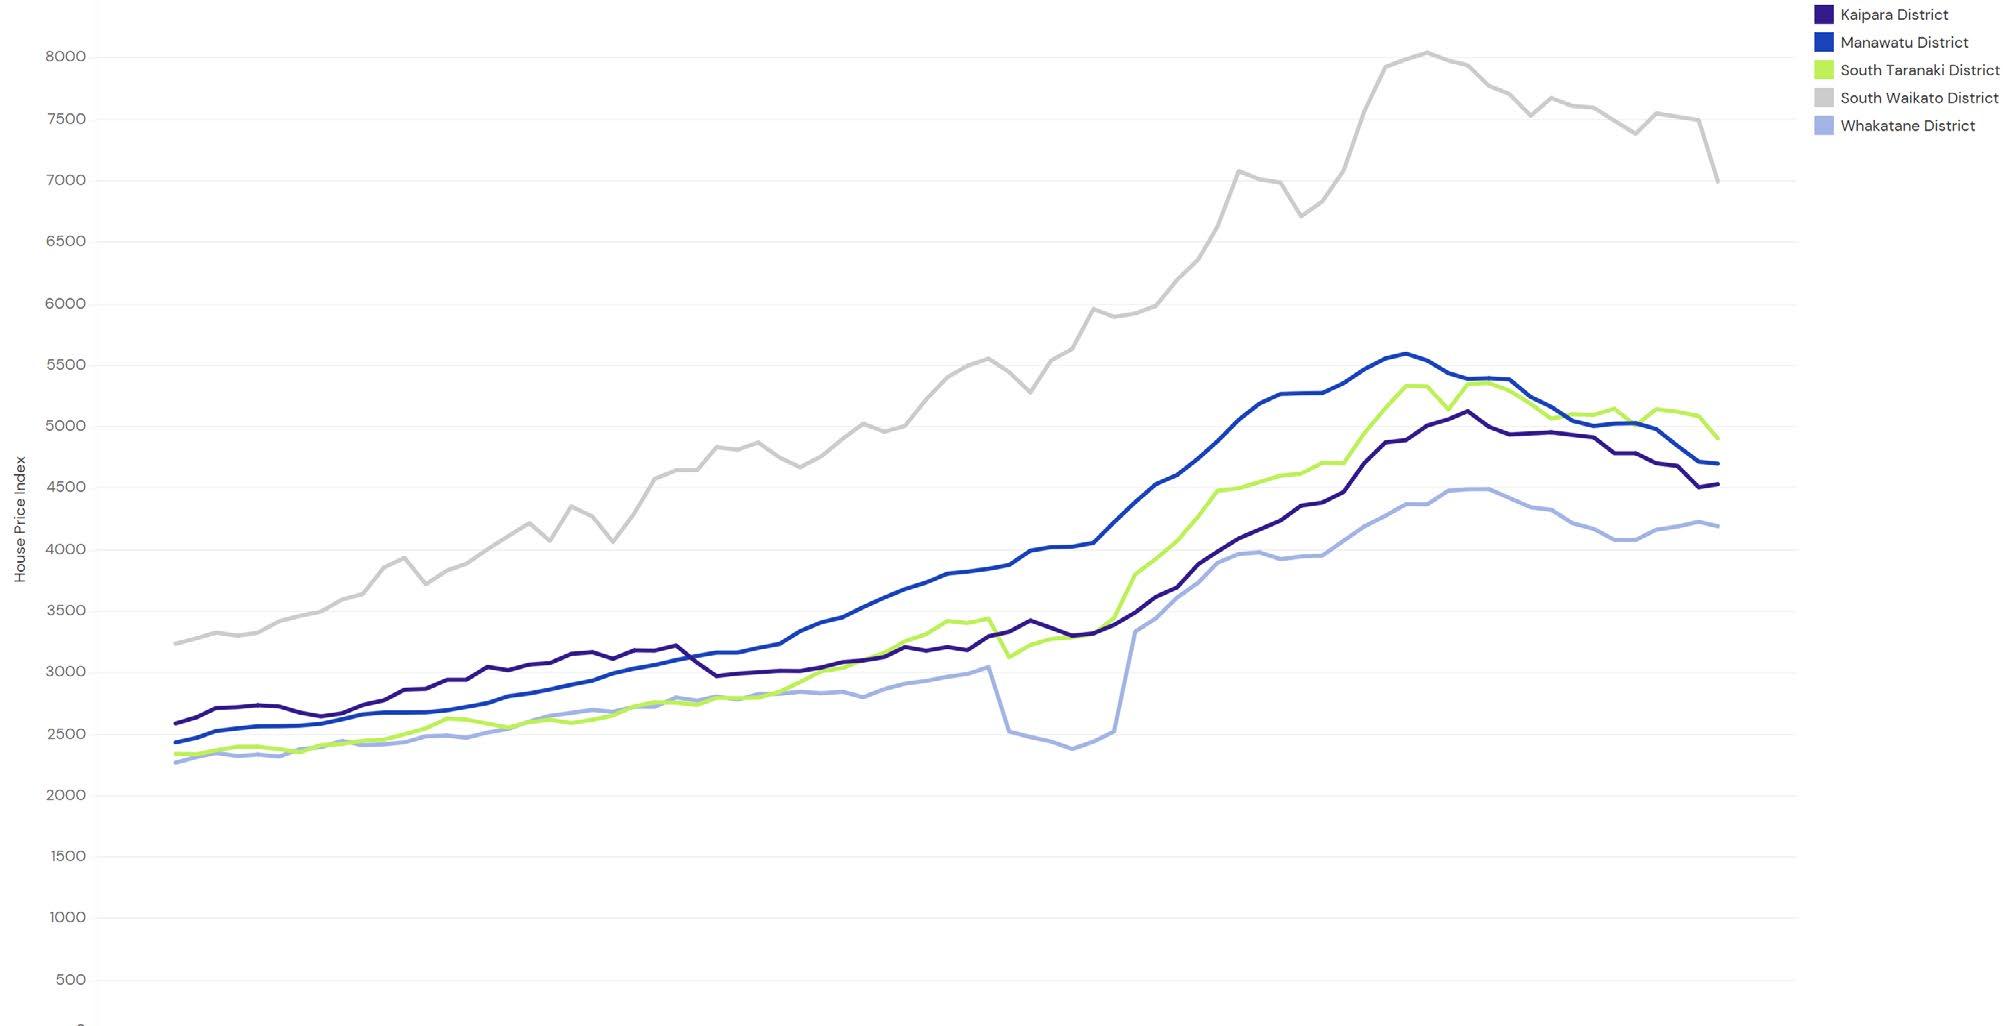
MID NORTH ISLAND COUNCIL HOUSE PRICE INDICIES
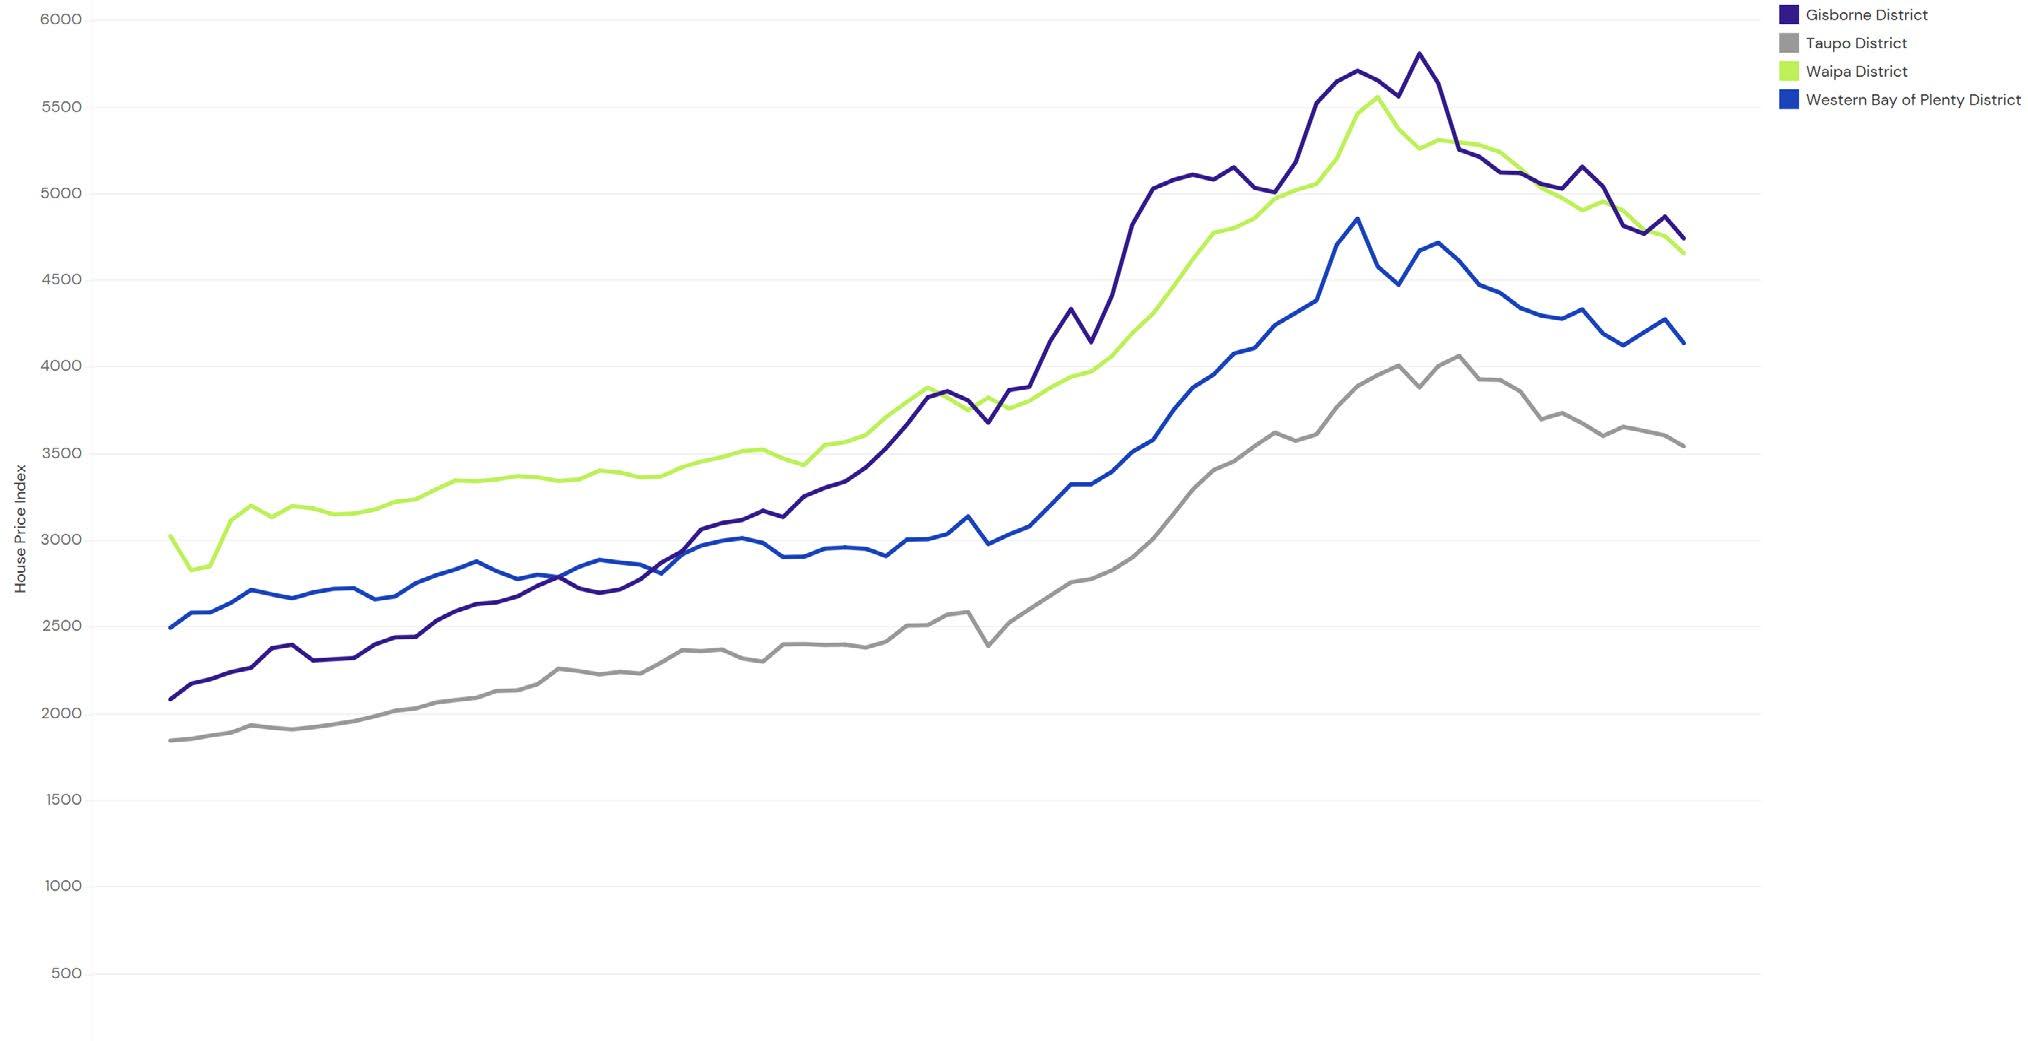
9 | REINZ Monthly House Price Index Report Two Month Rolling Calculated House Price Index Figures For Councils
LOWER NORTH ISLAND COUNCILS HOUSE PRICE INDICIES
UPPER SOUTH ISLAND COUNCIL HOUSE PRICE INDICIES
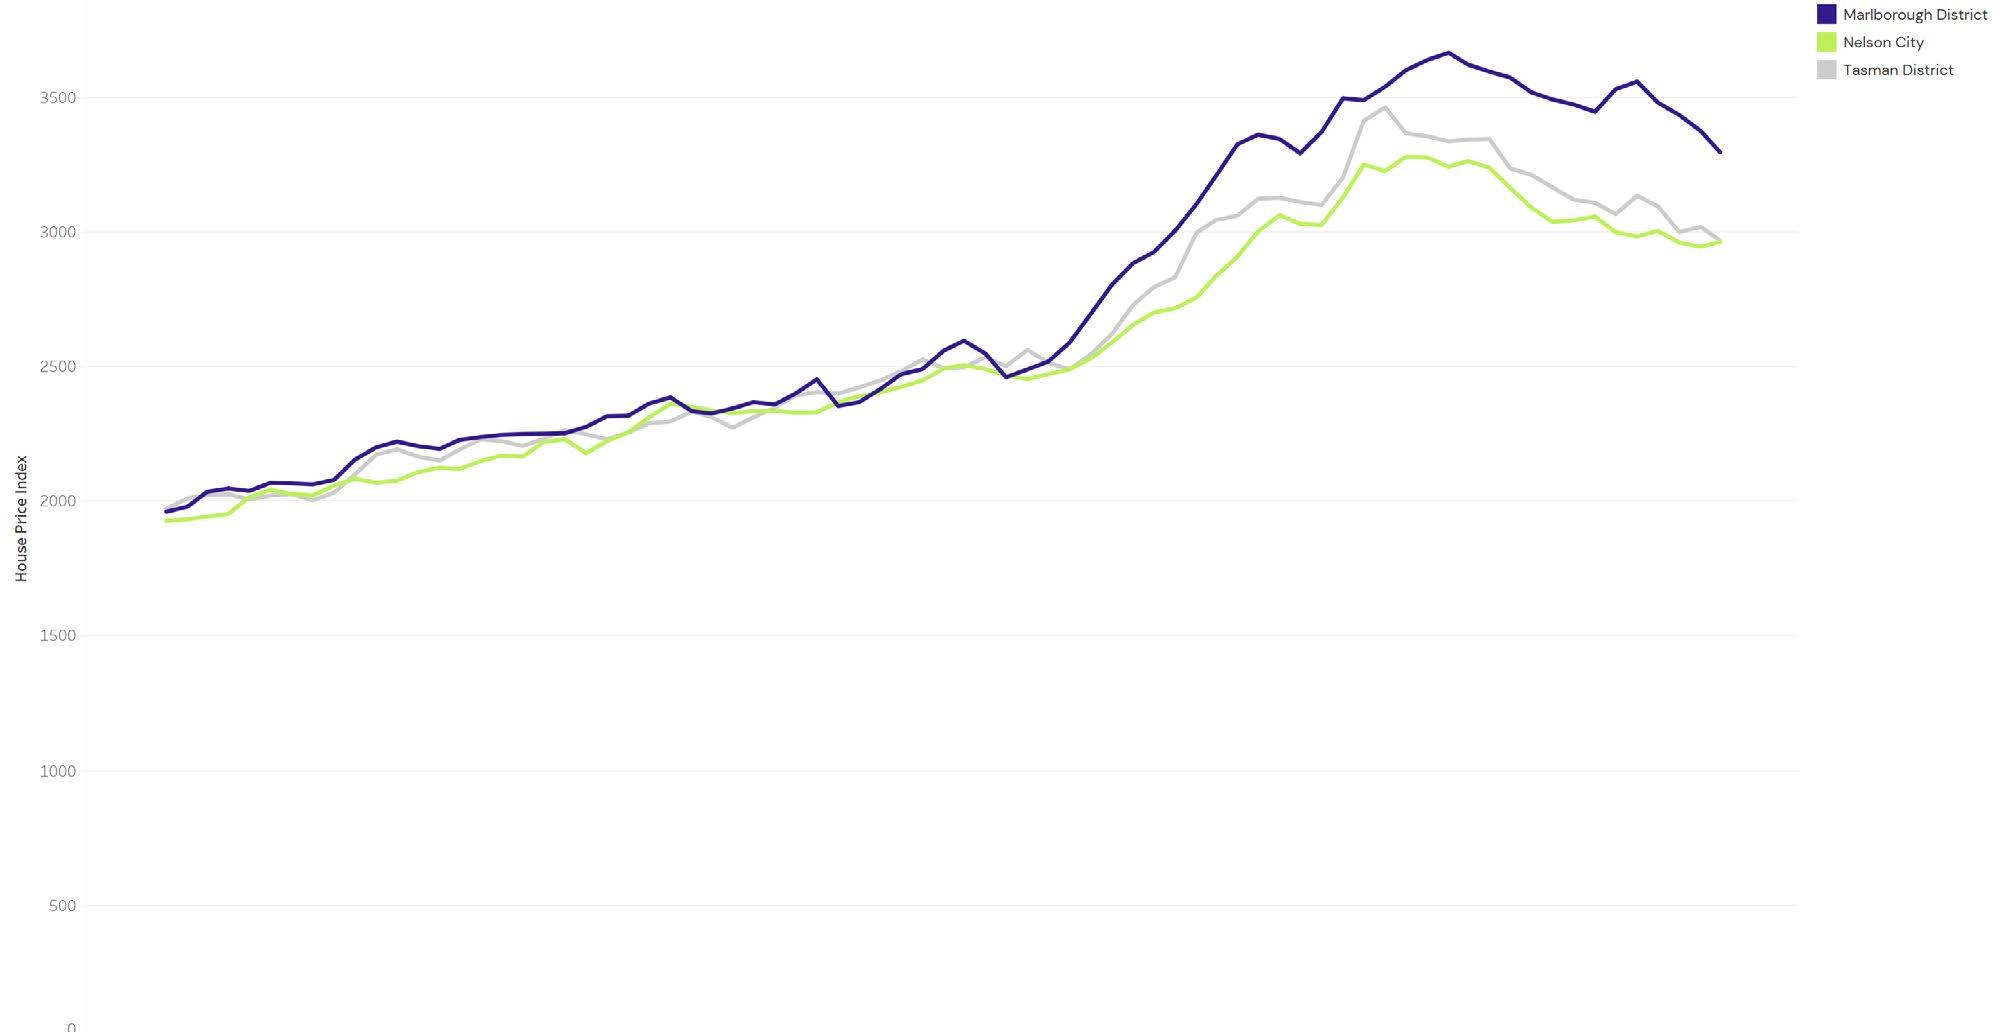
10 | REINZ Monthly House Price Index Report Two Month Rolling Calculated House Price Index Figures For Councils
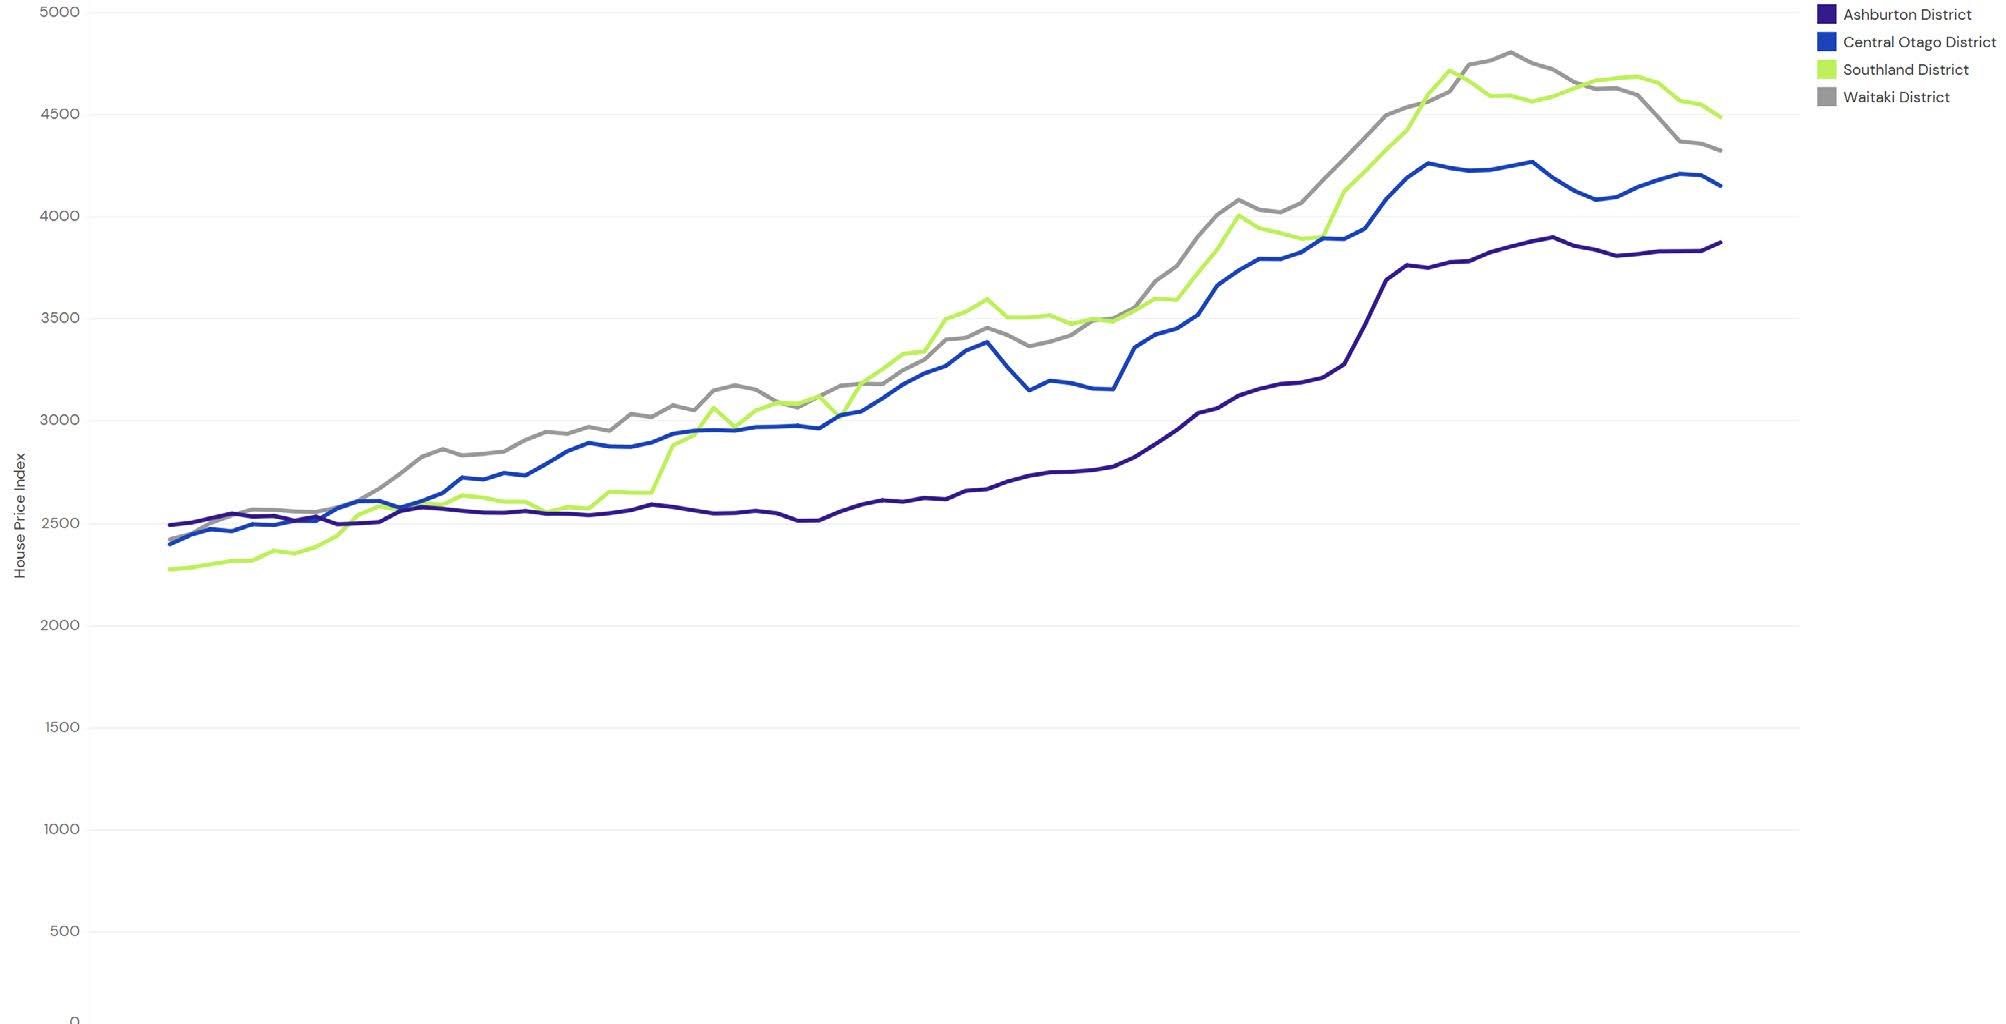
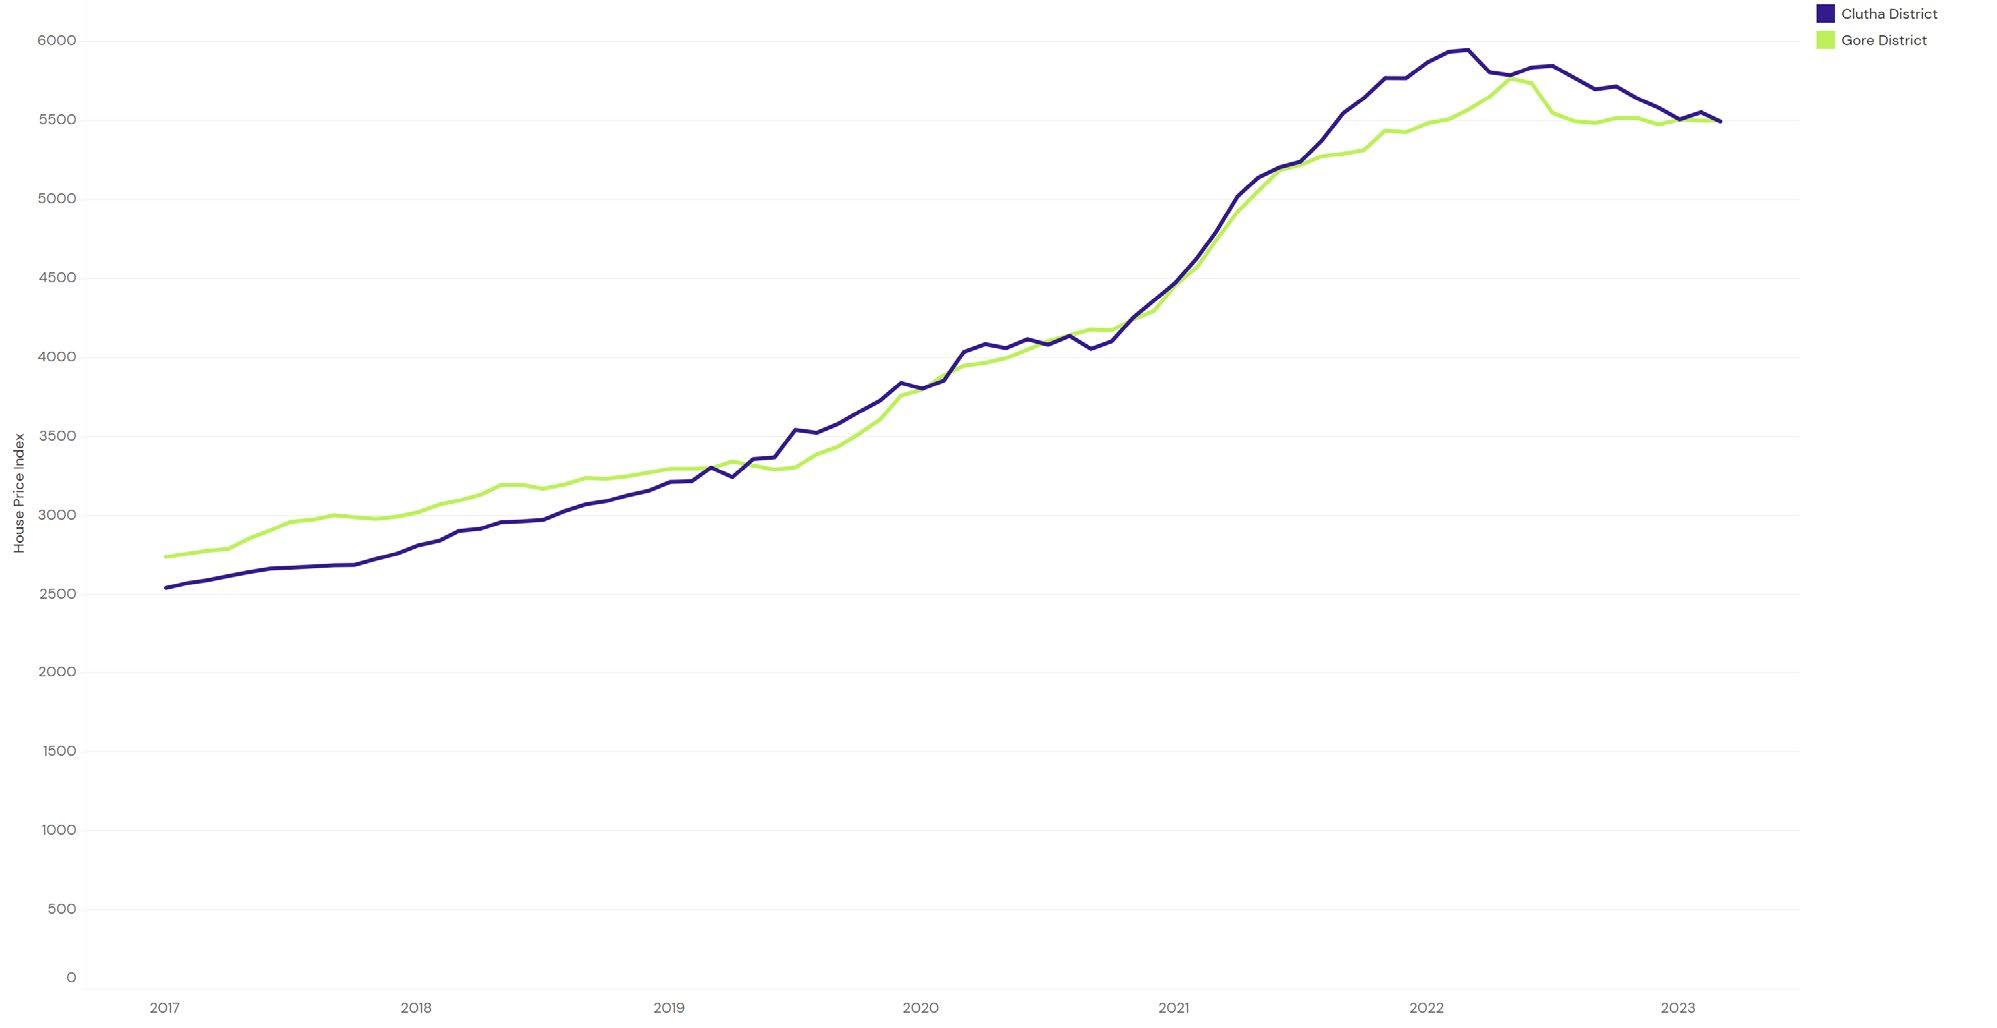
LOWER SOUTH ISLAND
COUNCIL HOUSE PRICE INDICIES
11 | REINZ Monthly House Price Index Report Two Month Rolling Calculated House Price Index Figures For Councils
NORTH ISLAND COUNCILS HOUSE PRICE INDICIES
SOUTH ISLAND COUNCIL HOUSE PRICE INDICIES
12 | REINZ Monthly House Price Index Report Three Month Rolling Calculated House Price Index Figures For Councils
NORTH ISLAND COUNCILS HOUSE PRICE INDICIES
SOUTH ISLAND COUNCIL HOUSE PRICE INDICIES
13 | REINZ Monthly House Price Index Report Six Month Rolling Calculated House Price Index Figures For Councils
TERRITORIAL AUTHORITY HPI VALUES
DISCLAIMER
This report is intended for general information purposes only. This report and the information contained herein is under no circumstances intended to be used or considered as legal, financial or investment advice. The material in this report is obtained from various sources (including third parties) and REINZ does not warrant the accuracy, reliability or completeness of the information provided in this report and does not accept liability for any omissions, inaccuracies or losses incurred, either directly or indirectly, by any person arising from or in connection with the supply, use or misuse of the whole or any part of this report. Any and all third party data or analysis in this report does not necessarily represent the views of REINZ. When referring to this report or any information contained herein, you must cite REINZ as the source of the information. REINZ reserves the right to request that you immediately withdraw from publication any document that fails to cite REINZ as the source.
14 | REINZ Monthly House Price Index Report
Council Calculated HPI Ashburton District 3 month rolling 3,879 Auckland City Actual Month 3,074 Buller District 6 month rolling 4,310 Carterton District 6 month rolling 4,430 Central Hawke’s Bay District 6 month rolling 5,203 Central Otago District 3 month rolling 4,156 Christchurch City Actual Month 3,405 Clutha District 6 month rolling 5,499 Dunedin City Actual Month 4,076 Far North District 2 month rolling 3,758 Franklin District 2 month rolling 3,936 Gisborne District 2 month rolling 4,747 Gore District 6 month rolling 5,505 Grey District 6 month rolling 3,924 Hamilton City Actual Month 3,901 Hastings District Actual Month 3,994 Hauraki District 6 month rolling 5,052 Horowhenua District 2 month rolling 4,808 Hurunui District 6 month rolling 4,581 Invercargill City Actual Month 4,210 Kaikoura District 3 month rolling 3,101 Kaipara District 2 month rolling 4,581 Kapiti Coast District Actual Month 3,946 Kawerau District 3 month rolling 6,586 Lower Hutt City Actual Month 3,564 Mackenzie District 6 month rolling 7,537 Manawatu District 3 month rolling 4,705 Manukau City Actual Month 3,520 Marlborough District 2 month rolling 3,297 Masterton District 2 month rolling 3,783 Matamata-Piako District 2 month rolling 4,642 Napier City Actual Month 3,536 Nelson City 2 month rolling 2,964 New Plymouth District Actual Month 4,292 North Shore City Actual Month 3,333 Opotiki District 6 month rolling 4,626 Council Calculated HPI Otorohanga District 6 month rolling 5,129 Palmerston North City Actual Month 3,739 Papakura District 2 month rolling 3,796 Porirua City 2 month rolling 3,341 Queenstown-Lakes District 2 month rolling 3,666 Rangitikei District 6 month rolling 6,081 Rodney District Actual Month 3,600 Rotorua District Actual Month 4,160 Ruapehu District 6 month rolling 6,788 Selwyn District 2 month rolling 3,929 South Taranaki District 3 month rolling 4,910 South Waikato District 3 month rolling 7,000 South Wairarapa District 6 month rolling 5,391 Southland District 3 month rolling 4,493 Stratford District 6 month rolling 6,110 Tararua District 6 month rolling 5,761 Tasman District 2 month rolling 2,969 Taupo District 2 month rolling 3,547 Tauranga City Actual Month 3,585 Thames-Coromandel District 2 month rolling 4,309 Timaru District 2 month rolling 4,443 Upper Hutt City 2 month rolling 3,830 Waikato District 2 month rolling 4,946 Waimakariri District 2 month rolling 3,702 Waimate District 6 month rolling 6,241 Waipa District 2 month rolling 4,661 Wairoa District 6 month rolling 5,101 Waitakere City Actual Month 3,655 Waitaki District 3 month rolling 4,329 Waitomo District 6 month rolling 5,341 Wellington City Actual Month 2,822 Western Bay of Plenty District 2 month rolling 4,143 Westland District 6 month rolling 5,045 Whakatane District 3 month rolling 4,196 Whanganui District 2 month rolling 5,488 Whangarei District Actual Month 3,887
REINZ & TONY ALEXANDER REAL ESTATE SURVEY
April 2023

CONTENTS
Page 1
• Are more or fewer people showing up at auctions?
• Are more or fewer people attending open homes?
Page 2
• How do you feel prices are generally changing at the moment?
• Do you think FOMO is in play for buyers?
• Are you noticing more or fewer first home buyers in the market?
• Are you noticing more or fewer investors in the market?
Page 3 Page 4
• Are you receiving more or fewer enquiries from offshore?
• Are property appraisal requests increasing or decreasing?
• What are the main concerns of buyers?
Page 5
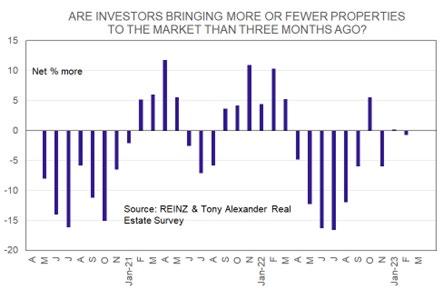
• Are investors bringing more or fewer properties to the market to sell than three months ago?
• What factors appear to be motivating investor demand?
• Regional results
This survey gathers together the views of licensed real estate agents all over New Zealand regarding how they are seeing conditions in the residential property market in their areas at the moment. We asked them how activity levels are changing, what the views of first home buyers and investors are, and the factors which are affecting sentiment of those two large groups.
to friends and clients wanting independent economic commentary.
Disclaimer: This report is intended for general information purposes only. This report and the information contained herein is under no circumstances intended to be used or considered as legal, financial or investment advice. The material in this report is obtained from various sources (including third parties) and REINZ does not warrant the accuracy, reliability or completeness of the information provided in this report and does not accept liability for any omissions, inaccuracies or losses incurred, either directly or indirectly, by any person arising from or in connection with the supply, use or misuse of the whole or any part of this report. Any and all third party data or analysis in this report does not necessarily represent the views of REINZ. When referring to this report or any information contained herein, you must cite REINZ as the source of the information. REINZ reserves the right to request that you immediately withdraw from publication any document that fails to cite REINZ as the source. ISSN: 2703-2825 This publication is written by Tony Alexander, independent economist. Subscribe here https://forms.gle/qW9avCbaSiKcTnBQA To enquire about having me in as a speaker or for a webinar contact me at tony@tonyalexander.nz Back issues at www.tonyalexander.nz Tony’s Aim To help Kiwis make better decisions for their businesses, investments, home purchases, and people by writing about the economy in an easy to understand manner. Feel free to pass on
STEADY RESULTS AMIDST GLOBAL RUCTIONS
Welcome to the REINZ & Tony Alexander Real Estate Survey. This survey gathers together the views of licensed real estate agents all over New Zealand regarding how they are seeing conditions in the residential property market in their areas at the moment. We ask them how activity levels are changing, what the views of first home buyers and investors are, and the factors which are affecting sentiment of those two large groups.
The key results from this month’s survey include the following.
• Despite banking sector worries offshore just as many agents are seeing more first home buyers in the market as last month.
• Investors remain firmly on the side lines
• Concerns remain high regarding interest rate level, access to credit, and the risk of prices falling further.
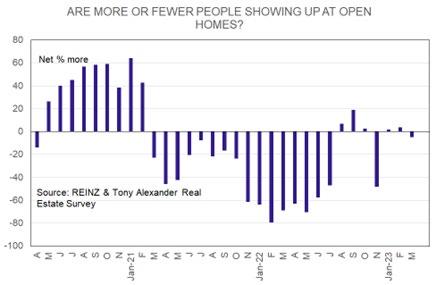
ARE MORE OR FEWER PEOPLE ATTENDING OPEN HOMES?
A small net 5% of agents this month have reported that fewer people are attending open homes. This measure has been very close to zero for three months in a row now following the temporary large decline late in November after the strong tightening of monetary policy on 23 November. The latest result tells us that for the moment the extent of tyre kicking by potential buyers remains muted.
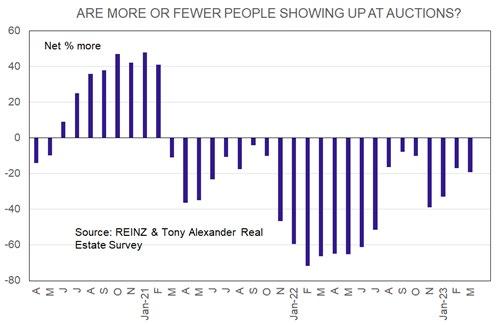
ARE MORE OR FEWER PEOPLE SHOWING UP AT AUCTIONS?
A net 19% of the 512 real estate agents responding in this month’s survey have reported that fewer people are showing up at auctions. As our first graph shows, this result is in line with that for last month and tells us that for now the people who do go to auctions are not facing much competition in the room.
1
HOW DO YOU FEEL PRICES ARE GENERALLY CHANGING AT THE MOMENT?
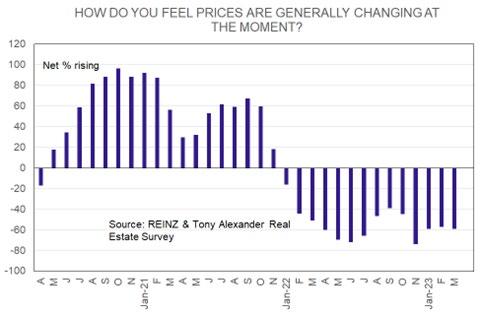
A net 59% of agents throughout the country report that prices are falling in their location of interest. This result is consistent with almost all others since early last year and therefore gives no hint that the pace of price decline is necessarily slowing as yet.
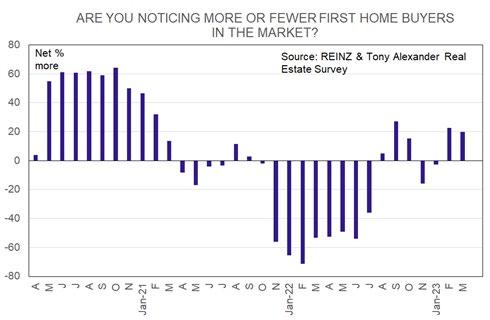
ARE YOU NOTICING MORE OR FEWER FIRST HOME BUYERS IN THE MARKET?
The key change recorded in our late-February survey released four weeks ago was a jump in the net proportion of agents noticing more first home buyers in the market to 22% from -3% in late-January. The latest result is statistically unchanged from four weeks ago at a net 20% positive. First home buyers are present but there is not a swelling wave as such of these mainly young purchasers.
DO YOU THINK FOMO IS IN PLAY FOR BUYERS?
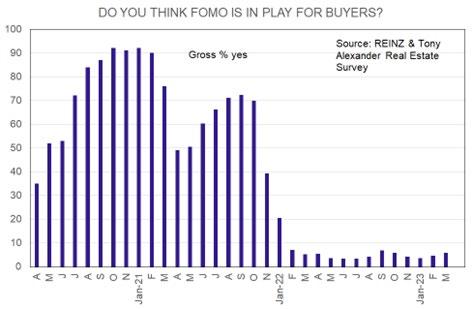
FOMO = Fear of missing out
Only 6% of agents feel that buyers are displaying a fear of missing out on making a purchase. When prices were rising rapidly and turnover was very high our FOMO measure was typically between 50% and 92%. We are about as far removed from that particular psychological state of the market as it is possible to be.
ARE YOU NOTICING MORE OR FEWER INVESTORS IN THE MARKET?
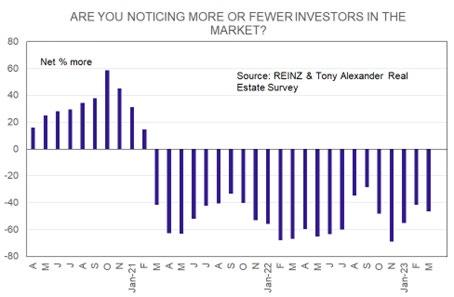
As has been the case for every month and every survey since March 2021 when tax rules changed, there is no sign of investors being active in New Zealand’s residential real estate market. There is now a steady string of negative results for this gauge of investor demand and this tells us that the available pool of rental accommodation may well be shrinking.
2
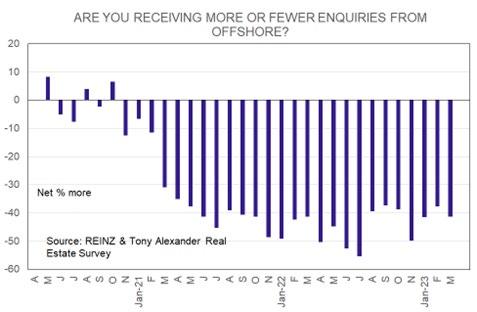
ARE YOU RECEIVING MORE OR FEWER ENQUIRIES FROM OFFSHORE?
There is very little offshore interest in New Zealand’s housing market. Note, however, that comments submitted by real estate agents in our survey indicate a lift in buying by migrants into the country. A net 41% of agents this month reported seeing fewer offshore buyers.
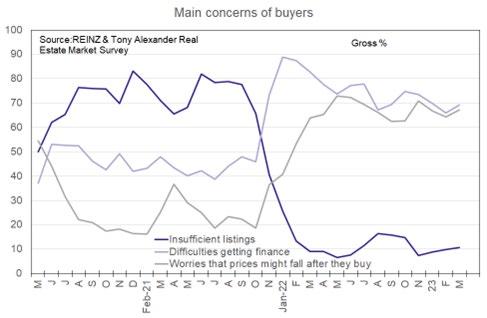
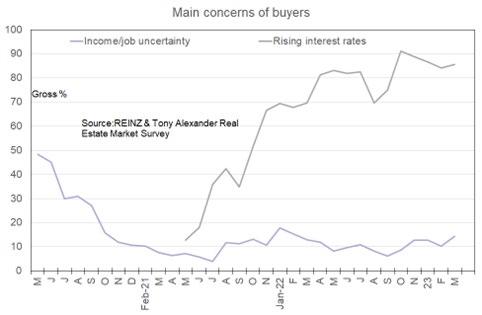
WHAT ARE THE MAIN CONCERNS OF BUYERS?
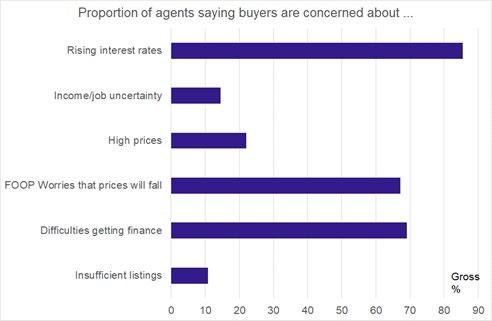
As has been the case for over a year now, the main concerns of buyers remain rising interest rates, prices falling after buying, and accessing financing.
There is a mild downward drift underway in the degree of concern about getting mortgage finance. Few agents note that buyers have concerns about an inadequacy of listings of properties for sale.
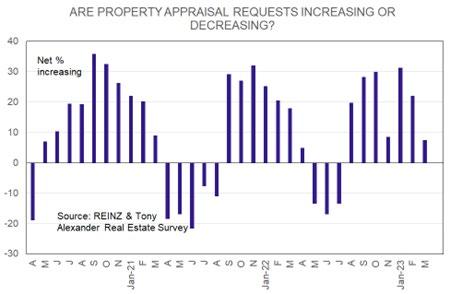
ARE PROPERTY APPRAISAL REQUESTS INCREASING OR DECREASING?
Requests for appraisals of properties continue to rise, as shown by the net 7% positive reading for this appraisal request measure. This is however the weakest outcome since July last year and like so many of our measures for the past two years shows that there is no rush of property being placed on the market by owners.
The outlook for interest rates has improved as a result of the banking sector ructions offshore. But few agents feel that buyers are as yet getting less worried about the level of interest rates in New Zealand.
3
ARE INVESTORS BRINGING MORE OR FEWER PROPERTIES TO THE MARKET TO SELL THAN THREE MONTHS AGO?
No wave of properties is being placed on the market by investors, even as they lose another 25% of their ability to offset interest expenses against rental income.
WHAT FACTORS APPEAR TO BE MOTIVATING INVESTOR DEMAND?
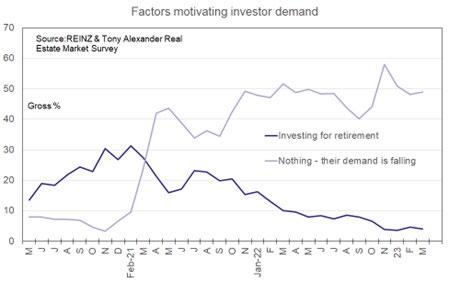
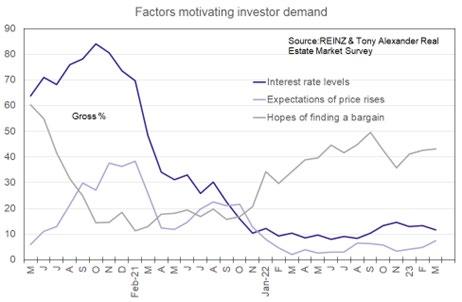
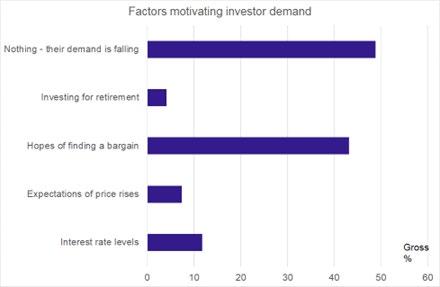
For those investors who are thinking about buying, the main motivation remains hopes of finding a bargain.
Bargain hopes have been trending neither up nor down for a number of months now. Of some interest however may be the second graph following which is showing a trend decline in the proportion of agents feeling that funding one’s retirement is a motivation for investing. This might reflect the increasing complexities involved in running an investment property and the ever rising costs involved as flexibility to freely manage one’s asset declines. There is an underlying implication here that the rental stock in New Zealand may shrink.
4
REGIONAL RESULTS
The following table breaks down answers to the numerical questions above by region. No results are presented for regions with fewer than 7 responses as the sample size is too small for good statistical validity of results. The three top of the South Island regions are amalgamated into one and Gisborne is joined with Hawke’s Bay.
Best use of the table is achieved by picking a variable and comparing a region’s outcome with the national result shown in bold in the bottom line. For instance, nationwide a net 5% of agents nationwide say that fewer people are showing up at auctions. But this is a net positive 20% in Queenstown and 16% in Wellington.
The table shows net percentages apart from the FOMO question in column F. The net percent is calculated as the percentage of responses saying a thing will go up less the percentage saying it will go down.
If anyone is interested, I can make available time series for each measure shown here. Contact me at tony@alexander.nz
A. # of responses
B. Are property appraisal requests increasing or decreasing?
C. Are more or fewer people showing up at auctions?
D. Are more or fewer people attending open homes?
E. How do you feel prices are generally changing at the moment?
F. Do you think FOMO is in play for buyers?
G. Are you noticing more or fewer first home buyers in the market?

H. Are you noticing more or fewer investors in the market?
I. Are you receiving more or fewer enquiries from offshore?
J. Are investors bringing more or fewer properties to the market to sell than three months ago?
5 A #obs B Appraisals C Auctions D Open H. E Prices F FOMO G FHBs H Invest. I O/seas J Inv.selling Northland 27 41 -19 -33 -70 4 -26 -48 -30 -26 Auckland 193 8 -7 10 -54 10 30 -42 -31 -3 Waikato 64 20 -33 -11 -64 2 27 -45 -44 25 Bay of Plenty 28 29 -18 4 -75 7 43 -50 -32 11 Hawke's Bay 18 6 6 61 -33 11 56 -6 -50 17 Taranaki 5 -22 11 -22 11 11 -33 -56 -22 Manawatu-Wanganui 21 24 -24 -19 -71 0 5 -67 -48 -10 Wellington 45 -22 -20 16 -64 0 38 -58 -56 -7 Nelson/Tasman 22 32 -23 -41 -86 5 9 -55 -45 18 Canterbury 54 -26 -43 -41 -57 4 -11 -59 -57 6 Queenstown Lakes 10 0 -40 20 -10 0 20 -20 -40 -10 Otago exc. Q'town 14 -14 -14 -57 -71 7 7 -71 -43 -43 Southland 10 0 -50 -60 -50 0 -40 -20 -60 -20 New Zealand 512 7 -19 -5 -59 6 20 -46 -41 0
Input to your Strategy for Adapting to Challenges
Feel free to pass on to friends and clients wanting independent economic commentary

ISSN: 2703-2825
Signupforfreeatwww.tonyalexander.nz
The housing shift to come
Know what this graph shows with quantities along the horizontal axis and prices on the vertical? Demand and supplycurves.
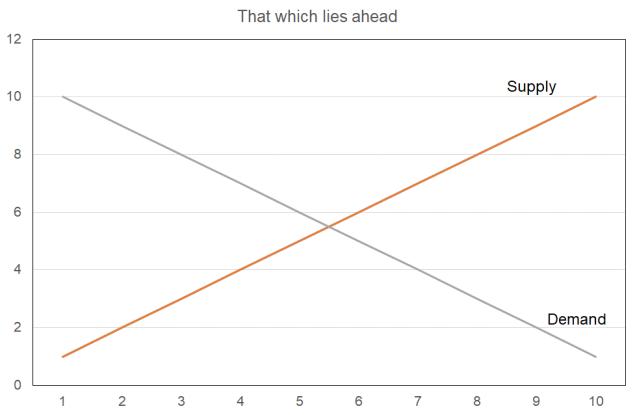
The orange line rising to the right shows that as the price of a thing goes up on the vertical axis we can expect more supply to come forth – eventually. There is no time element able to be shown in this most simple of graphs which formsthebedrockbasisofeconomics.
The grey line sloping down to the right is the demand curve and it shows demand for a thingfallingtotheleftasthe pricegoesup.
Wednesday 5 April 2023
Where they intersect is the equilibrium. In practise you’ll never see such curves. But as a way of analysing a situation it is hardtogobeyondthem,andwhenyouare surrounded by many confusing elements you can do worse than sitting down with a bit of paper and drawing where the curves move as the factor you are thinking of comesintoplay.
Let’s do that for some of the big factors coming up for New Zealand’s housing market. Sorry to those who belief a permanent shift towards vastly improved housing affordability is underway. It’s not happening and the rental situation is likely toturndecidedlyagainstrentersnextyear.
Rising net immigration
The higher the number of people added to the population from changes in people leaving versus arriving, the greater the population. We can show that as the demand curve moving out to the right. For every price there will be more people lookingtobuyathing.
The outcome of this rightward shift in the demand curve is more of a thing being bought and sold and a higher average price.
Page | 1
Net migration inflows have soared from -16,000 seven months ago to +33,000. Thedemandcurveisalreadyshiftingtothe right but the main shift will come when people realise what is happening with our post-pandemic rate of population growth. This change has not yet entered popularconsciousness.
Rising stock of delayed buyers

For many things we can shift our purchases through time. We will delay buying a car if times are tough. At the moment there are tens of thousands of people holding back from buying a property because they expect prices will fall further. This stepping back of buyers over the past year and a half is represented by the demandcurvemoving to the left. You will see that such a move means lower turnover of real estate and lowerprices.
At some stage people’s views on price risk will shift. They will decide the time is right to make a purchase and the demand curve will shift back to the right. Turnover and prices will rise. I’ll be able to see this in near real-time in the many indicators gathered in my monthly surveys of real estate agents and mortgage brokers. In particularwewill see it in the FOMO gauge rising. We’re definitely notthereyet.
Falling interest rates
The rise in fixed mortgage rates between June 2021 and the end of November has made purchasing a home too expensive for many people. This shows up as the demand curve moving to the left resulting again in lower prices and lower turnover. Worries about interest rates continuing to rise would have added tothiseffect.
What is happening now? There is growing acceptance that fixed mortgage rates peaked two months ago and talk that worries about banking sector stability and banks cutting credit access will slow world growth and inflation from here on. That has already resulted in wholesale borrowing costs falling and scope is growing for some fixed ratecutsdownthe track.
The combination of people no longer expecting higher interest rates and instead thinking about themfalling means a rightward shift in the demand curve bringinggreaterturnoverandhigherhouse prices. This is something set to come along incomingmonths.
Note that negative housing commentary built around the refixing of existing mortgage interest rates from 3.5% to 6.5% or so is essentially irrelevant. These changes are for people who already have a house and very few of them will be
Page | 2
inthemarketforanother.Themediaseemto missthis.
Falling house construction
New dwelling consent numbers are now running almost 20% down from a year earlier and in seasonally adjusted monthly terms are on a steep slide. New house supply will continue to rise but the new supply in the coming year will be a lot less than in the past year. Same for the yearbeyondMarch2024.
Reduced supply is represented by the orange supply curve shifting to the left. This means reduced turnover and higher prices.
We are not there yet because most people are not aware of what is about to happen in the residential construction sector. But this factor will really come into play when people also realise what is happening with the net migration flows. One curve shifts to the left, the demand curve to the right and the price response can be strong. We are notthereyet.
Job security
If people feel secure in their jobs, they are more likely to buy a house. If job security falls, they will feel less secure. As the unemployment rate rises in the coming year feelings of job security are
likely to decline and that means a leftward shift of the demand curve bringing lower turnover andlowerprices.
Note however that for many people this shift has already occurred in response to the Reserve Bank’s prediction of recession and forecast of the unemployment rate going to almost 6%. But that forecast is likely to be aggressively cut at some stage and people’s feelings of job security will improve.
Balancing off these two pressures on job security feelings is impossible so this is unlikely to be much of a driving force in the housing market until the unemployment rate starts falling from its peak somewhere too far down the track to really be relevant to any of my discussionhere.
Rents rising
The pace of rent rises currently is not that high. But landlords are showing rising intentions of increasing their rents and we know what accelerating population growth, more foreign students, and the return of short-stay holiday-makers will do to rental availability andthereforeaveragerents.
Whatever the numerical outcome for rent rises the key thing to keep in mind is this. While house prices have been falling since December 2021
Page | 3
and continue to do so, rents have continued to rise. The equation some people run of renting versus buying is shifting more in favour of buying and will takeastep jump indoing so when interest rates are seen to be on a good downward track.
This effect is represented as the demand curve shifting out to the right for home ownership. That means higher turnover andhigherprices.
Credit availability
Banks are bit by little bit easing up their willingness to lend for home purchases. This easing is partly driven by low house sales causing lending targets to be badly missed. As lending willingness slowly grows more people will find themselves able to make a purchase. This is represented by the demand curve shifting out totheright.
Stock availability
There are many reasons why the stack of people delaying their purchase has grown and grown. One is increased numbers of properties on the market allowing buyers to feel they can stay on the side lines and jump in whenever they wantsomewheredownthetrack.
But at some point, the high number of propertylistings will decline. The second half of 2021
showed us what can happen when listings are low – prices can soar and FOMO (fear ofmissingout)jump up even in the face of rising interest rates, investor tax changes, the return of Loan to Value Ratio rules and netmigrationoutflows.
When stocks start falling the return of some buyers feeling the clock is ticking on goodavailability will cause the demand curve to shift out to the right bringing higher turnover (and accelerating decline in listings) alongside risingprices.
Vendor selling
Offsetting the holding off of buyers since the end of 2021 has been a similar holding back of vendors. One thing discouraging people from listings their property has been concern about being a weak seller in a buyer’s market, and high job security removing a perceived “need” to sell. The vast majority of borrowers can comfortably handle higher mortgage rates because their debt has reduced over the years, they have a job, they can pick up extra hours of work or additional employment in a strong economy, and/or take in a boarder easily as accommodation istight.
When market conditions change and vendors feel they are not the weakest partner in the property transaction, some will bring their properties to the market. This is represented by the supply curve
Page | 4
shiftingtotherightandmeanshigher turnoverbutlowerprices.
There are many other factors in play and I invite you to shift the curves around in response to how you think the thing which interests you will change. I stress change because the curves only shift when things change. If there is a factor which interests you that has been around a while and will remain as substantial in the future as now, then there is no shifting of the relevant supply or demand curve. Your thing of interest has to change to be relevant to future changes in turnoverandprices.
WhereIsitisthis.
Negatives continue to dominate and in particular the feeling buyers have that time is on their side and its best not to buy in case interest rates go a lot higher and/or theylosetheirjob.
But new house supply is about to fall at the same time that demand rises in response to a changing outlook for interest rates. These factors will help produce an end to the downward leg of the house price cycle. The upward leg will really get going once the still growing stack of buyers holding back turns and FOMO returns. How strong will this effect be? We cannot know. But the balance of risks facing a house buyer is set to shift. When? The experience of the past few years tells us that we cannot reliably pick when the main shift will come. Good luck to those holding off buying because you think you can.
And one final point. There is a catch-up surge in home buying to come at the same time as new supply growth falls away. With investors disincentivised to continue to hold their properties the demand from owner-occupiers is going to create a fairly
strong tightening up of the rental market in New Zealand. The response will be higher rents, cramming in together of people who have to rent as they cannot afford to buy, and a deepening of social inequitie because the renting group are on lower incomes on average than those who own.
If I were a borrower, what would I do?
Yesterday the Reserve Bank reviewed the official cash rate and while the common expectation had been for a 0.25% rise they in fact lifted the rate 0.5% to 5.25%. This rise followed a 0.5% rise on February 22 this year and 0.75% rise on November 23 last year.
While noting that the economy is smaller than expected, they expressed concern about a number of things. These include the following.
• Employment still being above sustainable levels.
• Inflation to receive a boost from recent flooding.
• The economy to receive a boost from reconstruction, effectively offsetting a weaker world growth outlook.
• Stimulus coming from easier fiscal policy.
• Inflation sitting still uncomfortably too high.
It also looks like the Reserve Bank has become concerned that the recent declines in wholesale bank borrowing costs because of events offshore could lead to a round of reductions in retail interest rates. Therefore, they have raised the cash rate 0.5% to get those wholesale borrowing costs back up and to prevent retail rate cuts. To whit
“However, wholesale interest rates have fallen significantly since the February Statement, and this could put downward pressure on lending rates. As a result, a 50 basis point increase in the OCR was seen as helping to maintain the current lending rates
Page | 5
faced by businesses and households, whilealsosupportinganincreaseinretail depositrates.”
Inotherwords,theydonotactuallyintend thattoday’s0.5%rateriseleadstohigher mortgagerates – buttheyhavecontinued theirpressureonbankstoraisedepositrates.
Thereremainsalotofwatertogounderthe bridgeregardinginflationandwearestill somewaysofftheReserveBankbeingable toexpressconfidencethat2%liesnottoofar downthetrack.Butsomeoftheomensare good.
Thereissubstantialrestraintstilltocomefrom thenear$170bnworthofmortgagesupfor rateresettinginthecomingyear.Near3% costjumpswillplacedownwardpressureon householdspending.
The NZIER’s Quarterly Survey of Business Opinionreleasedyesterdayshowedthat althoughbusinesspricingplansremainmuch toohigh,capacitypressuresareeasing.Iwill discuss this more in next week’s TVP but sufficetosaytheeasingofdifficultiesfirm faceinsecuringskilledandunskilledlabourto onlyjustaboveaveragelevelsbodeswellfor slowingwagesgrowth.
Globalinflationiseasingoffslowlyandnew restrictionsonbanklendingoffshorebecause ofUSbankcollapseswillcausesomeextra weaknessinworldgrowthandtherefore worldinflation.
And there is this to note as one thinks about how much higher the cash rate will go. We are probably at the peak now at 5.25%. In February the Reserve Bank wrote that “… monetary conditionsneedtotightenfurther…” Theyhavenowdroppedthatcommentand writtenthis.
“Lookingahead,theCommitteeis expectingtoseeacontinuedslowingin domesticdemandandamoderationincore inflationandinflationexpectations.The extentofthismoderationwilldeterminethe directionoffuturemonetarypolicy.
Thisweektheone-yearwholesaleinterestrate atwhichbanksborrowtolendfixedforone yeartoyouandIedgeddownaheadoftheNZ ratereviewtodaybutthenclimbedtositthis afternoonnear5.55%from5.29%lastweek and5.66%fourweeksago.
Thethreeyearrateisnear4.7%from4.63% lastweekand5.24%fourweeksback.
If I were borrowing currently I’d personally just fix one year. Some debt fixed at two years may suit many people however given that uncertainties in play remain quite extreme.
Nothing I write here or anywhere else in this publication is intended to be personal advice. You should discuss your financing options with a professional.
This publication has been provided for general information only. Although every effort has been made to ensure this publication is accurate the contents should not be relied upon or used as a basis for entering into any products described in this publication. To the extent that any information or recommendations in this publication constitute financial advice, they do not take into account any person’s particular financial situation or goals. We strongly recommend readers seek independent legal/financial advice prior to acting in relation to any of the matters discussed in this publication. No person involved in this publication accepts any liability for any loss or damage whatsoever which may directly or indirectly result from any advice, opinion, information, representation, or omission, whether negligent or otherwise, contained in this publication. No material in this publication was produced by AI.
Page | 6
”
LJHookerisreturningtoFieldays!

Freeupyourcalendarandmakesureyouheaddownto MysteryCreekthisJuneandstopintoseeusatsiteF62.
Ifyouwanttosell,buyorrentaproperty,ourteamwillbe theretohelptalkyouthroughthenextsteps.
Wewillbetheretosupportyournextpropertyjourneyand getyouthebestresultsinthismarket.
PROPERTIES

D RURY


2 (2008) •3-4Bedrooms •2BathroomsinclEnsuite •Walk-inrobe •Largeoffice-fourthbedroom *SeparateLaundry *LargeDoubleGarage $1,225,000 ByAppointment CLICKHERETOVIEWFULLDETAILSONOURWEBSITE


brent.worthington@ljhooker.co.nz (2008) FIRSTTIME valuableland,currently closeproximity FORSALE $1,200,000 View ByAppointment Contact 2 1 1 CLICKHERETOVIEWFULLDETAILSONOURWEBSITE
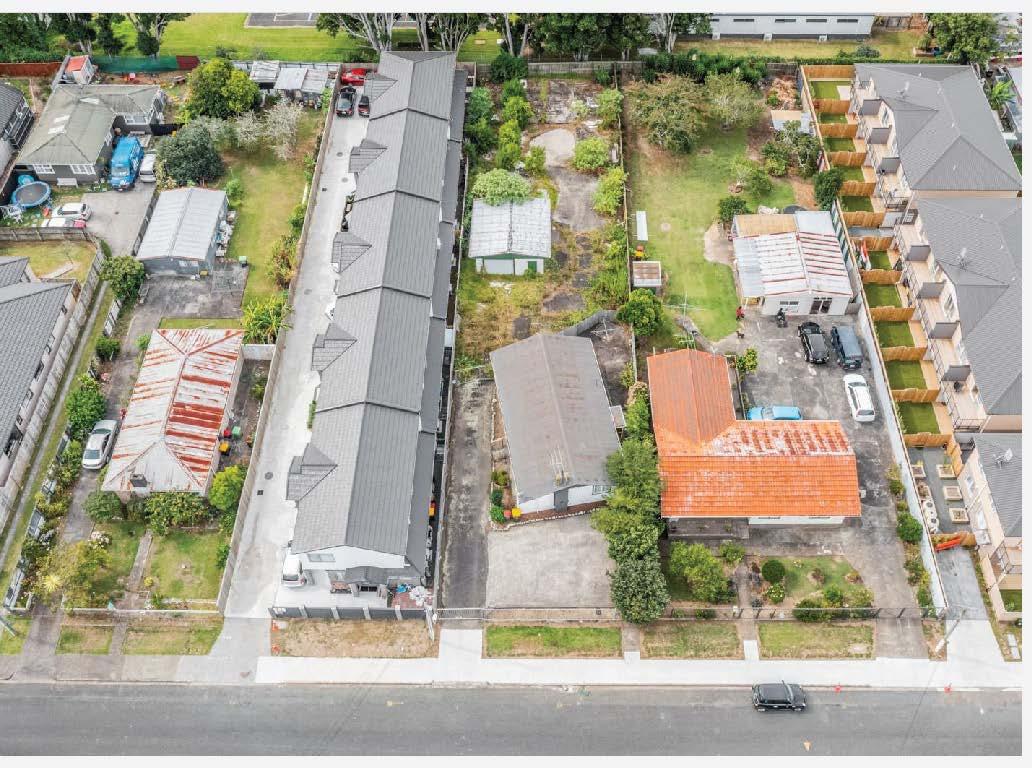
*Increasinglymoredifficulttofindblocksofthissize andzoning aroundintheheartofPapatoetoe


*SiteisheldintwoRecordsofTitlelocatedadjacentto thecorner ofCoronationandShirleyRoads..
*UndertheAucklandCouncilAucklandUnitaryPlan (AUP)states that:
"Thezoneprovidesforawiderangeofactivities including commercial,leisure,residential,tourist, cultural,communityand civicservices,providinga focusforcommercialactivitiesand growth."
*Thesixexistingtenantscurrentlyreturn$138,581.00 perannum plusGSTandoutgoings.
(2008)
PAPATOETOE View Contact
LJHooker
CurrentOfficeListings

30 Franklyne Road, Otara NZ
§3 bl �1
URGENT SALE-MAKE AN OFFER
Currently tenanted, this 985m2 site (more or less) is a developers dream. Zoned Residential (9D), re...
18th,
https://drury.ljhooker.co.nz/
1 Luke Place, Otara NZ
§5 b2 �2
URGENT SALE-MAKE AN OFFER
* Prominent site
* Prime Location
* Huge development potential
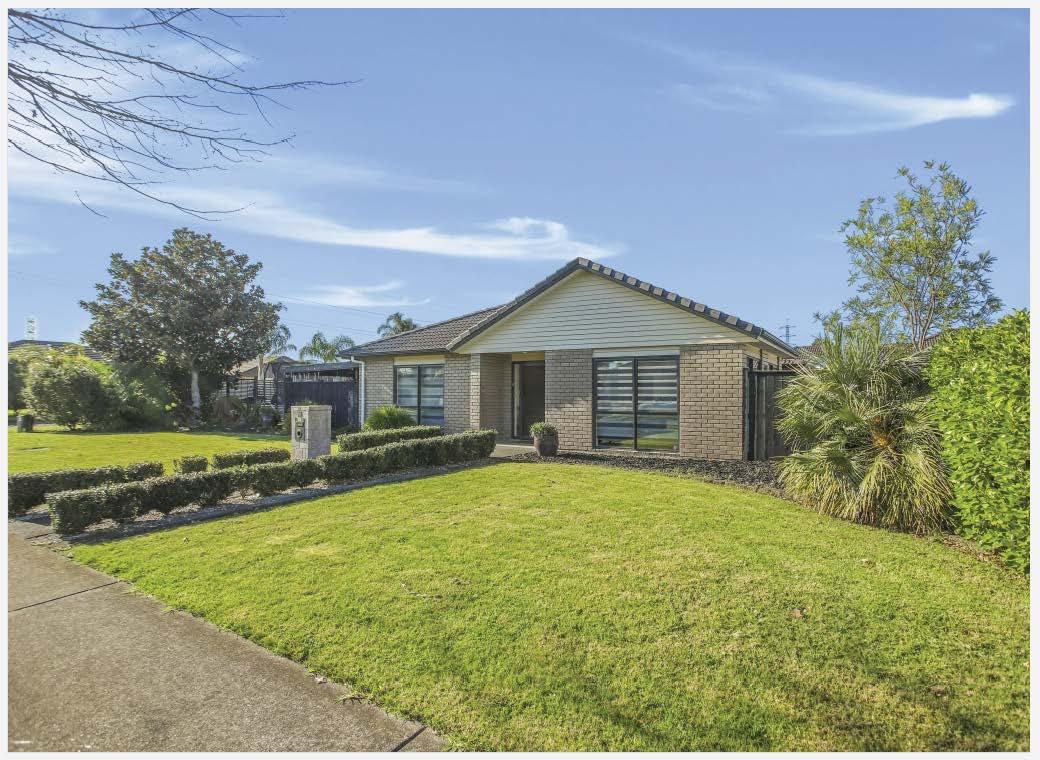
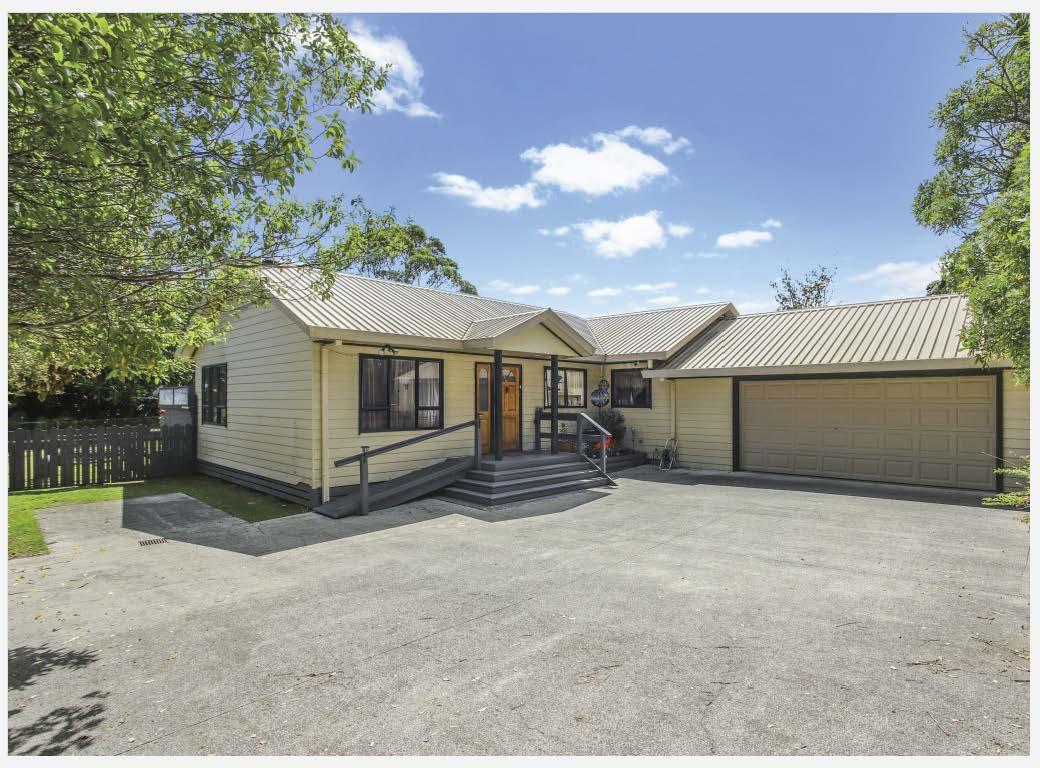
14 Toscana Drive, Karaka NZ §4 b2 �4
HOME ISWHERETHEHEART IS
If a beautifully presented family home is on your 'wish list' then this darling is a 'must view'.
ForSale By Negotiation
View ByAppointment
Brent Worthington 029 296 5362
brent.worthington@ljhooker.co.nz
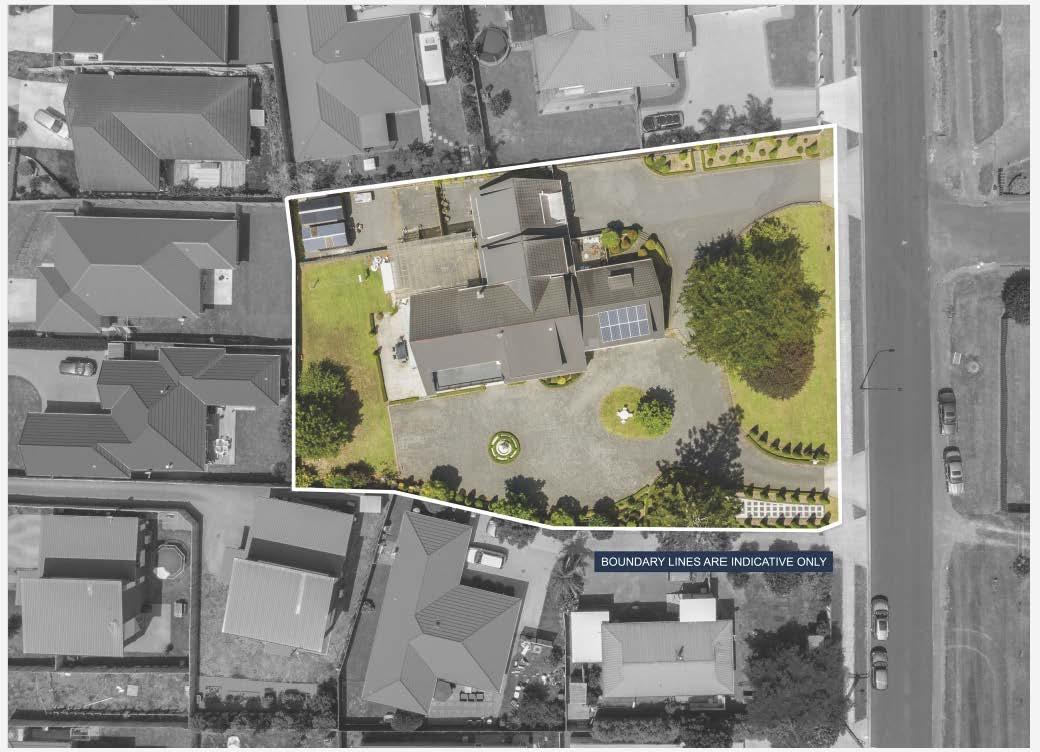
114 Harbourside Drive, Karaka NZ
§- b-�-
RIPEFOR DEVELOPMENT in KARAKA
Located in the "sought after" Karaka Harbourside Estate, the opportunity topurchase another land ho...
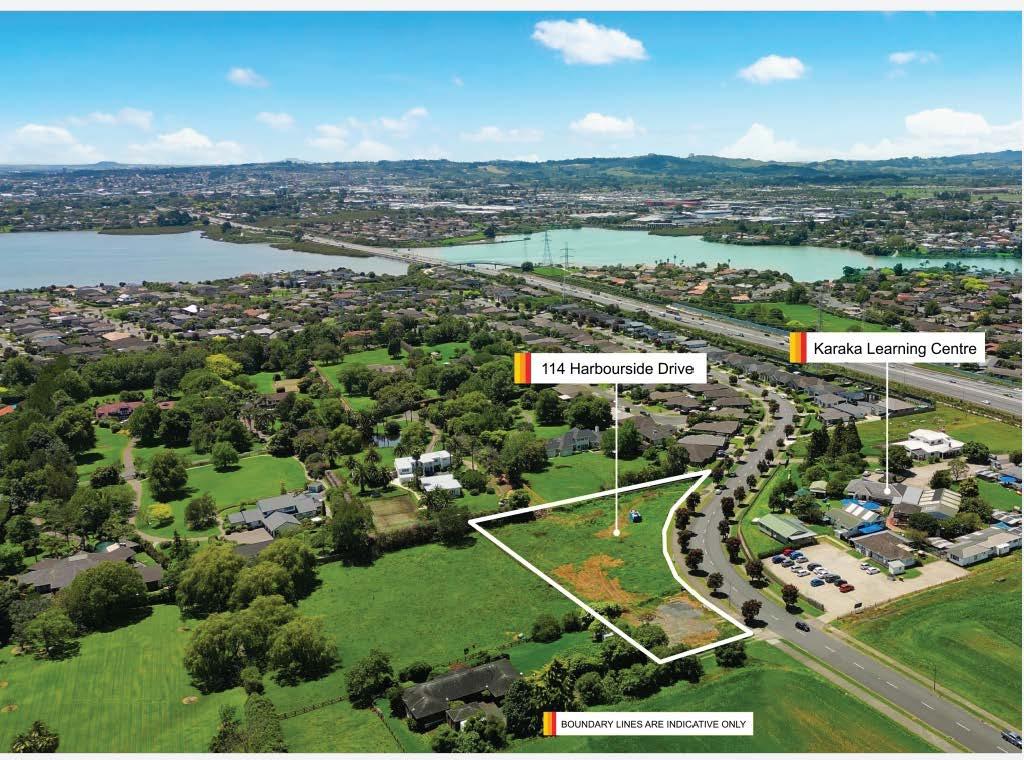
ForSale Price By Negotiation
View ByAppointment
Nav Johnson 027 827 2213
nav.johnson@ljhooker.co.nz
5 Coronation Road, Papatoetoe NZ
PRIMECOMMERCIAL BLOCK.
Set in the heart of Old Papatoetoe's commercialhub, theopportunityto acquire blocks of this size
ForSale Price By Negotiation
View ByAppointment
Nav Johnson 027 827 2213
nav.johnson@ljhooker.co.nz
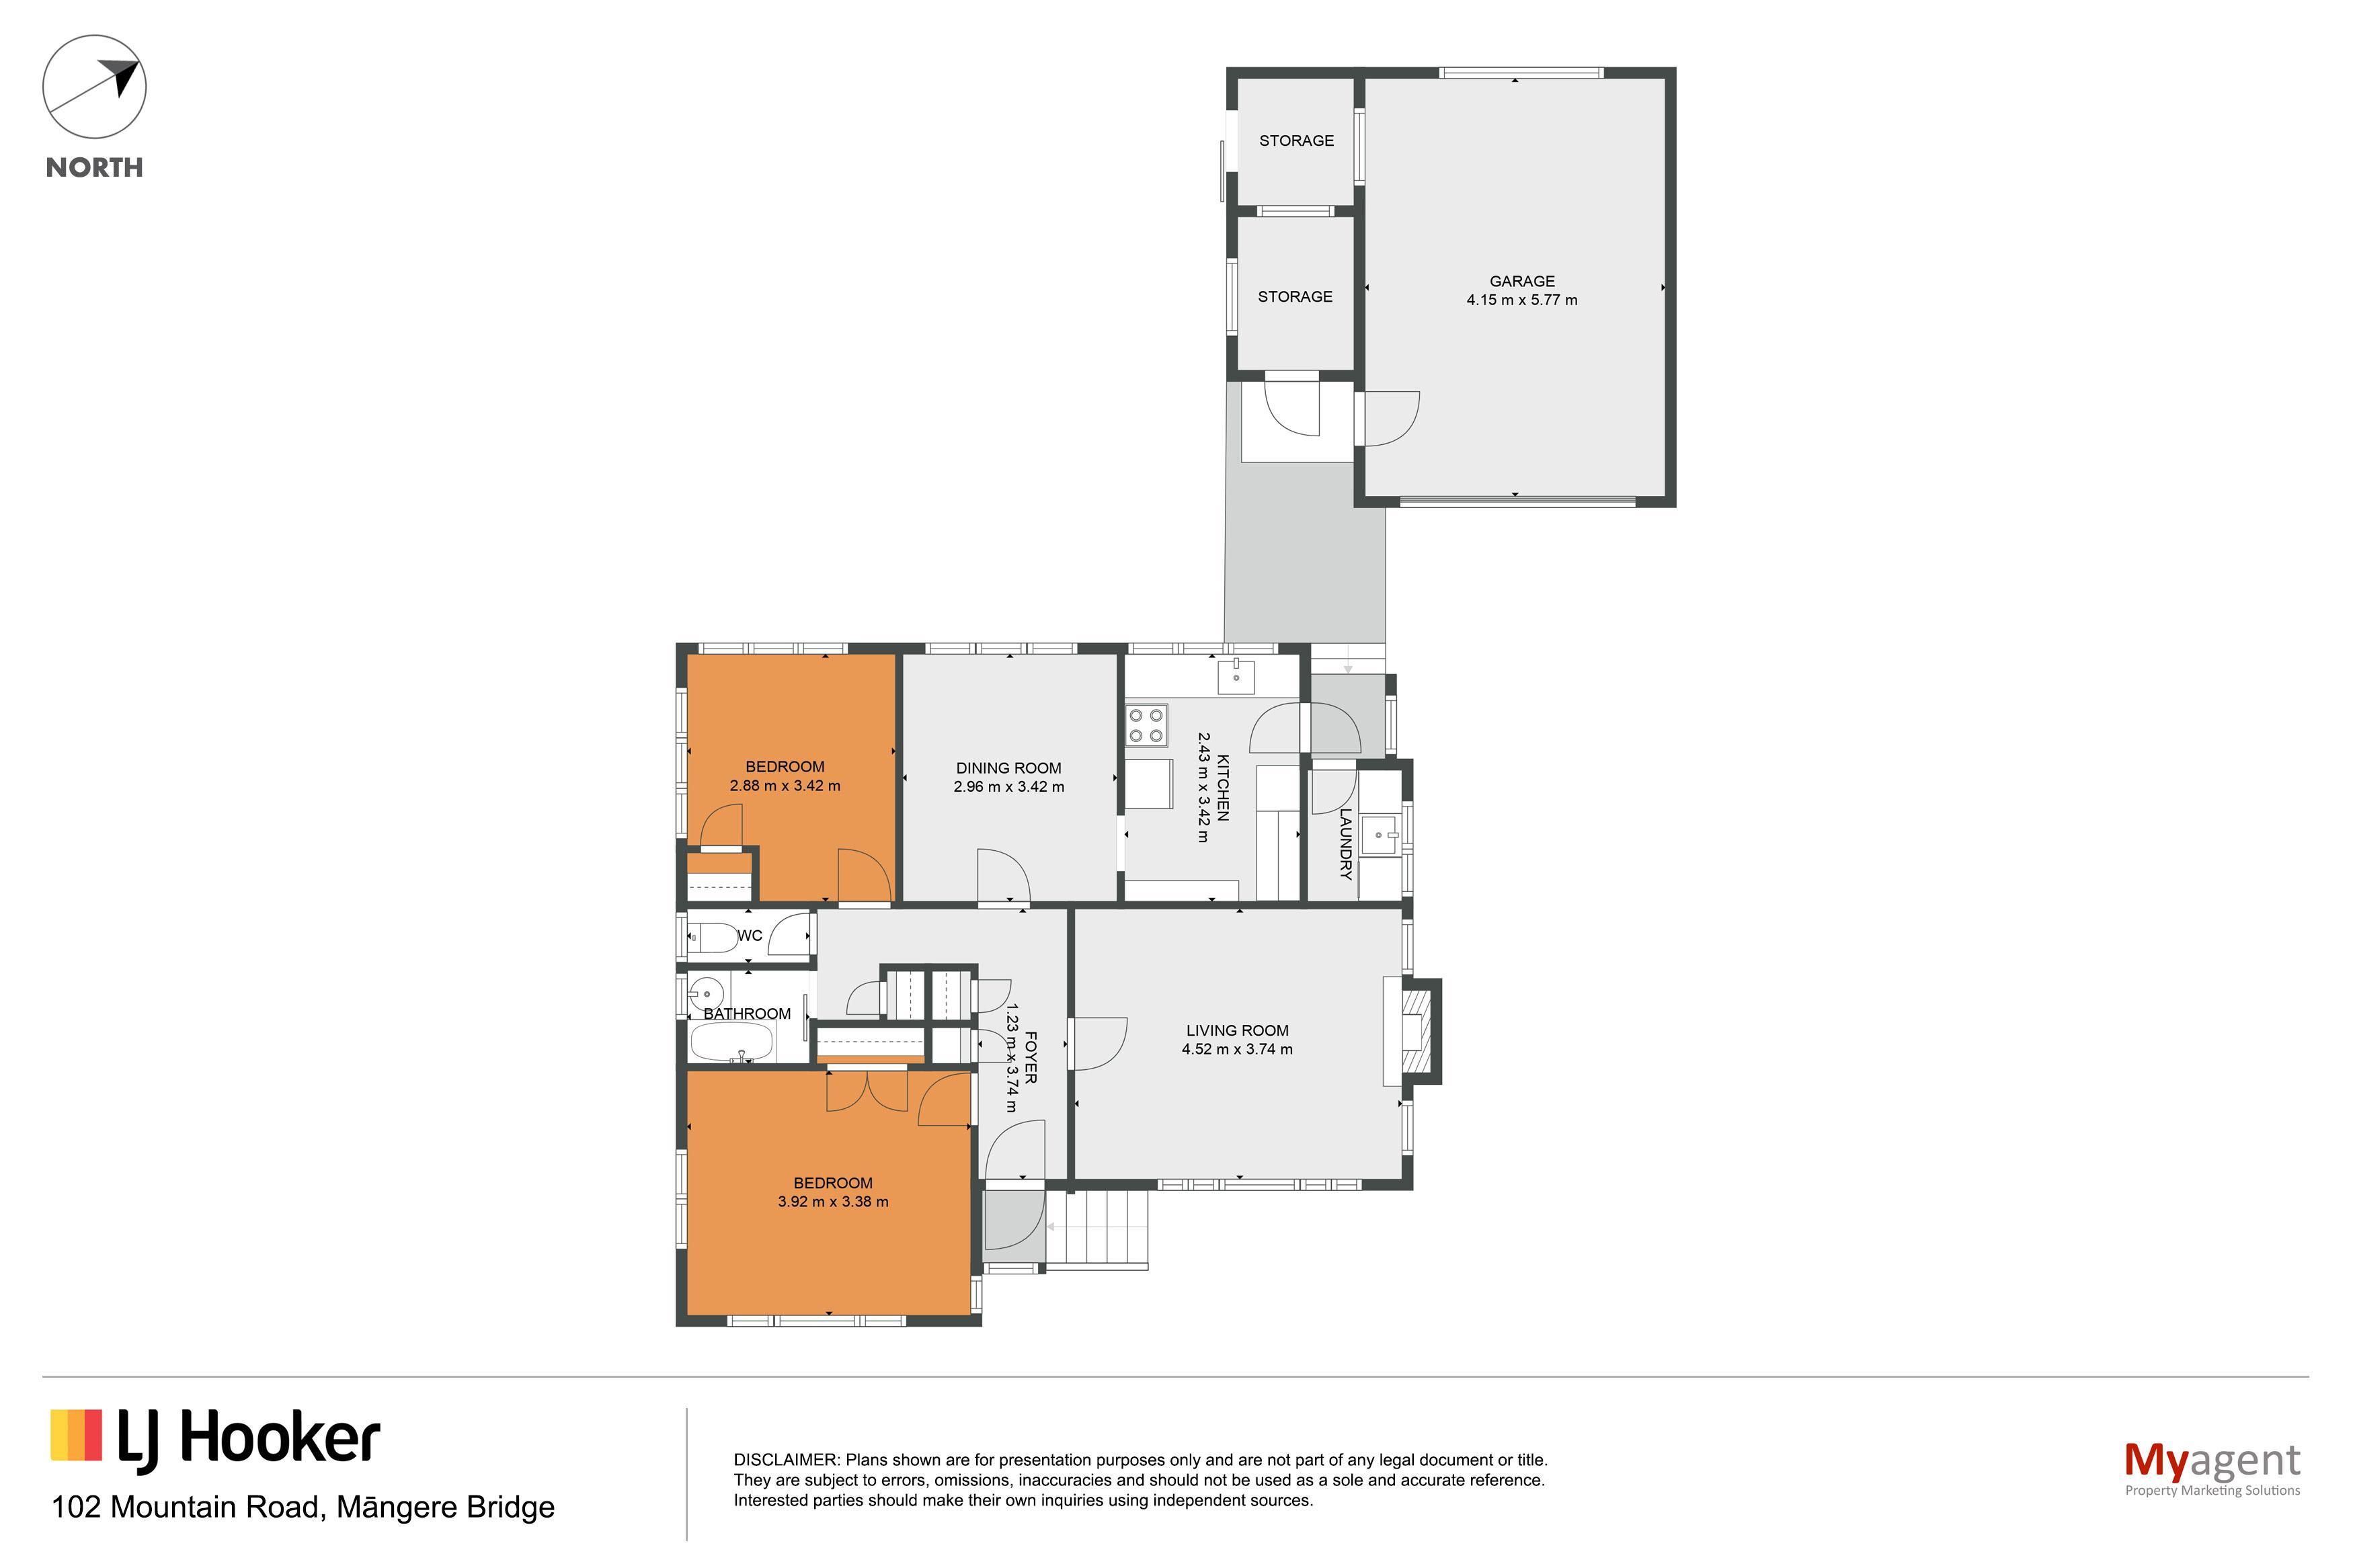
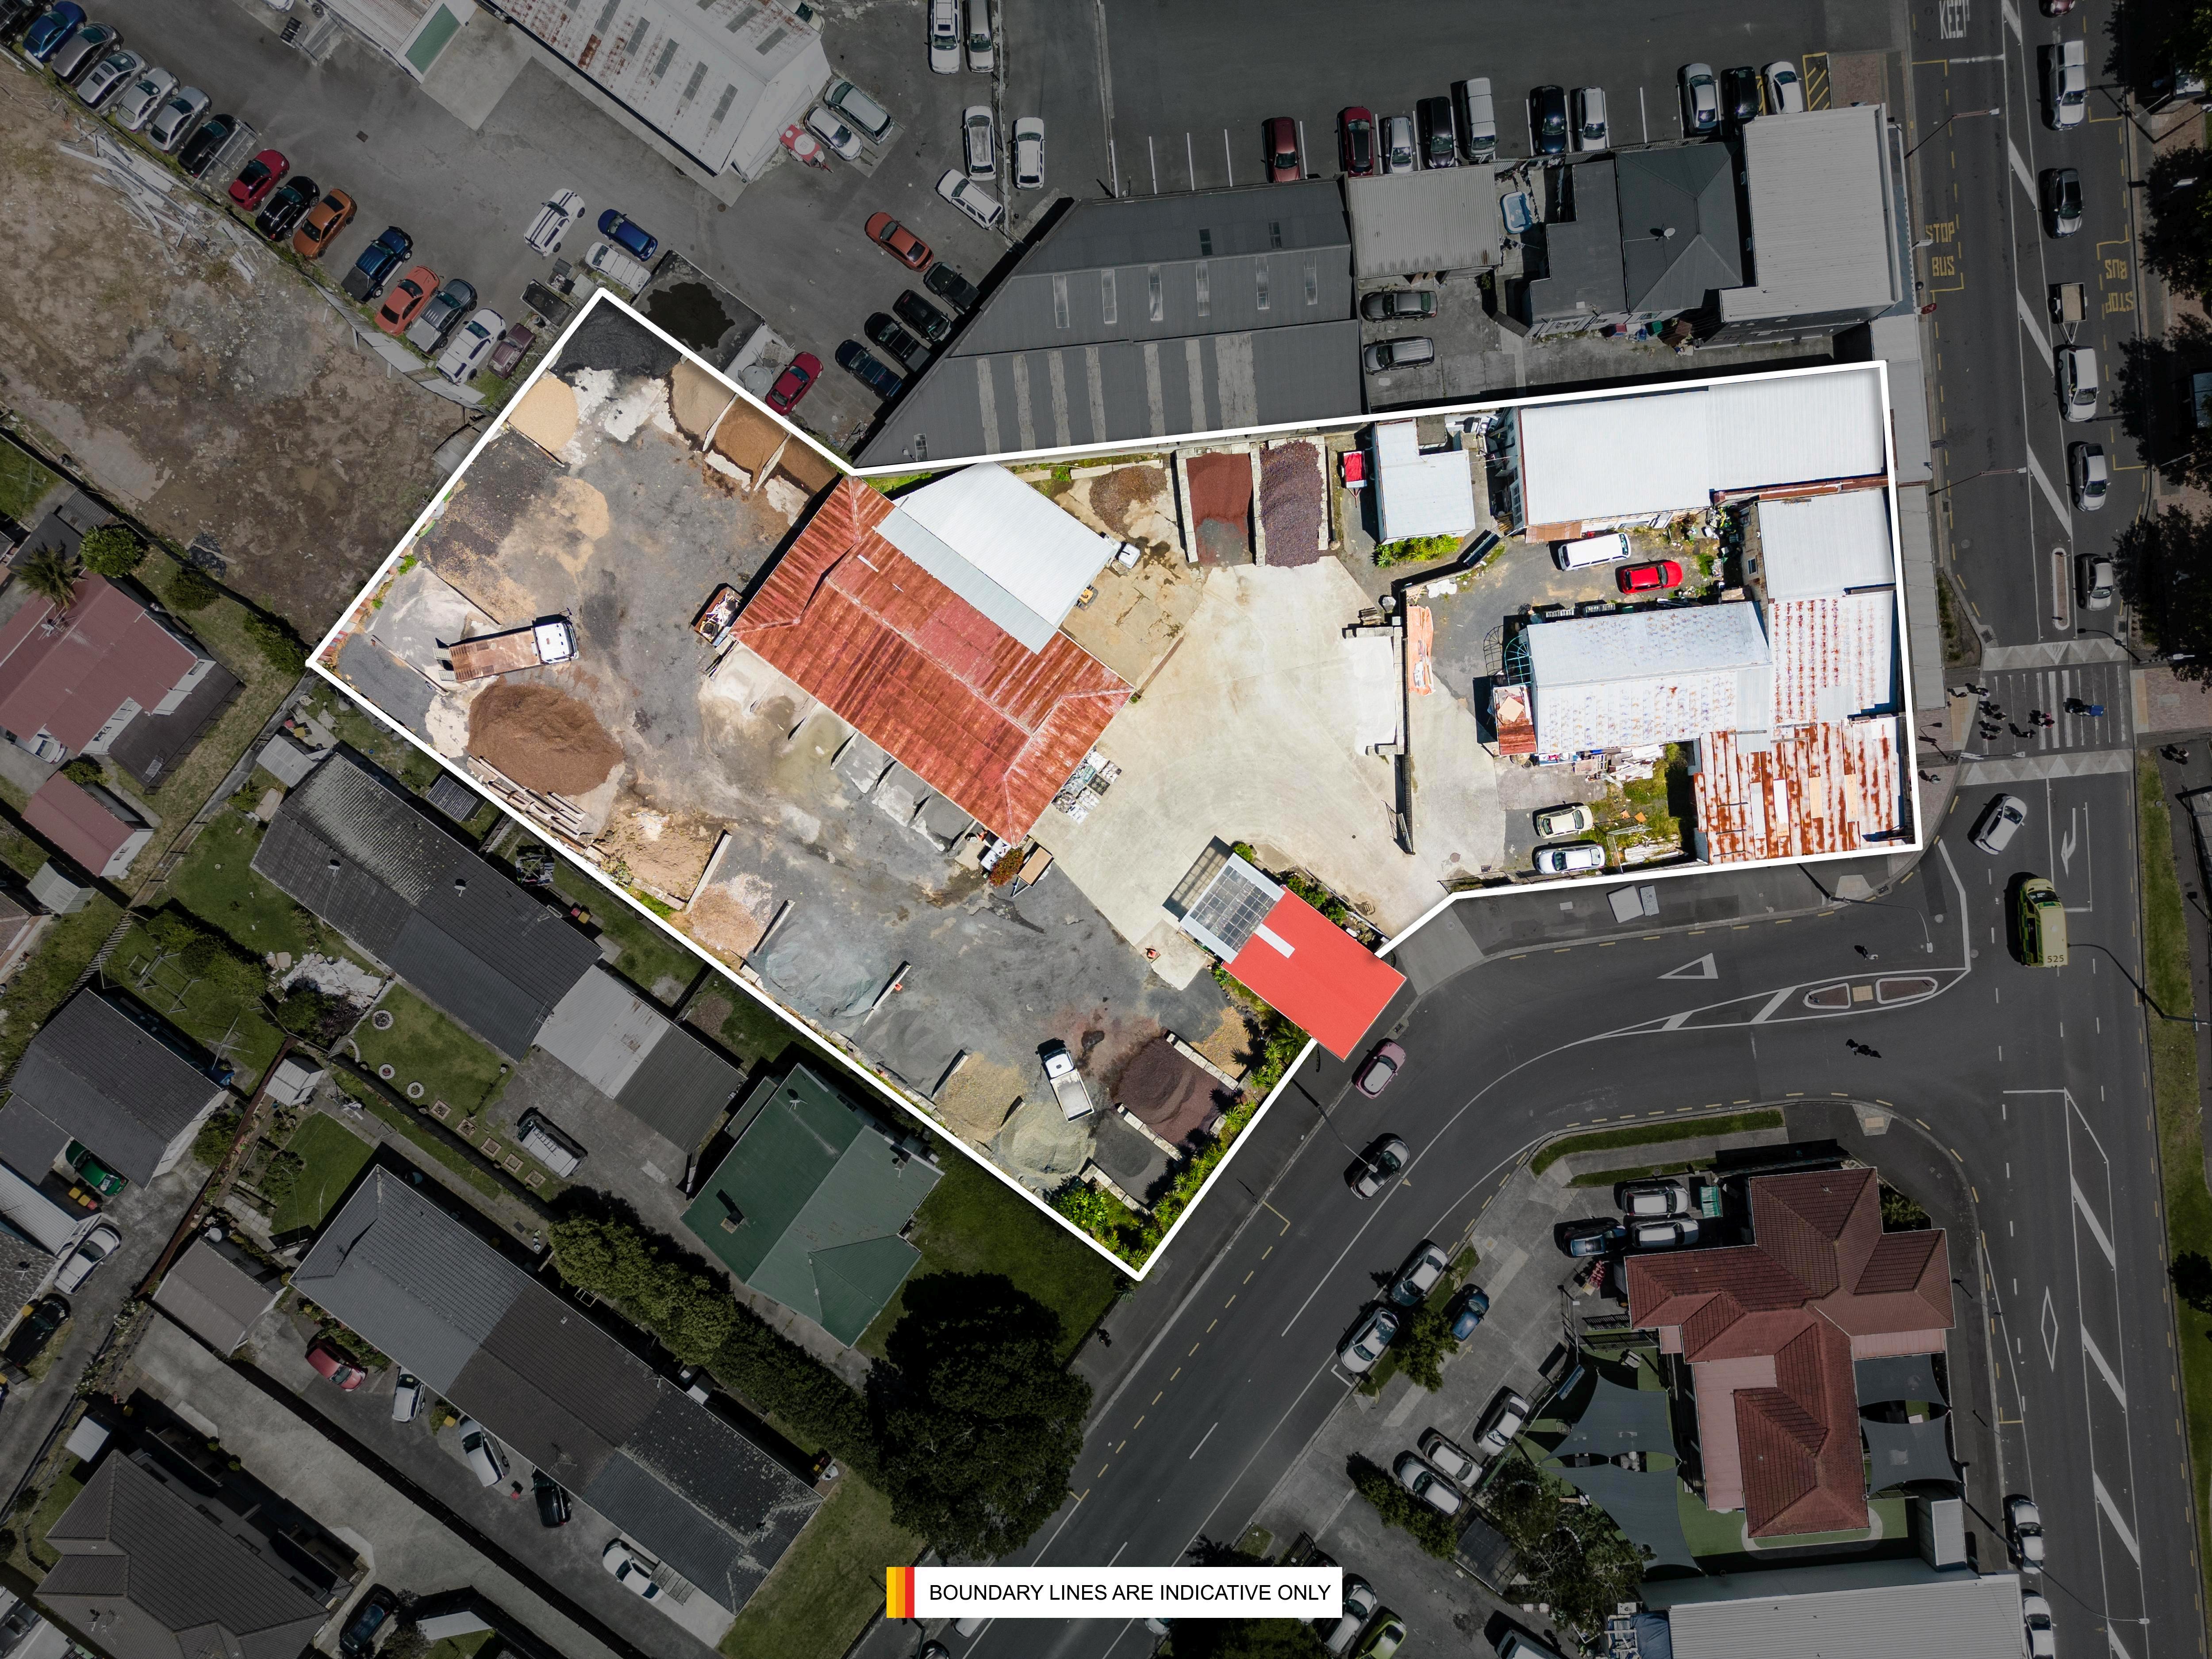
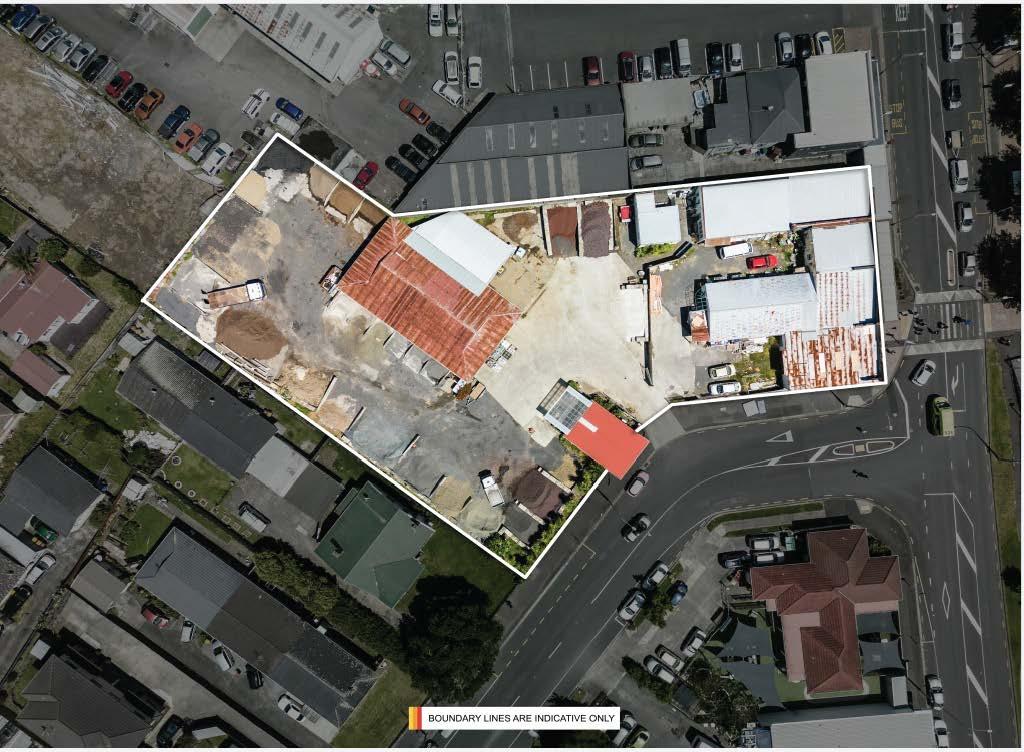
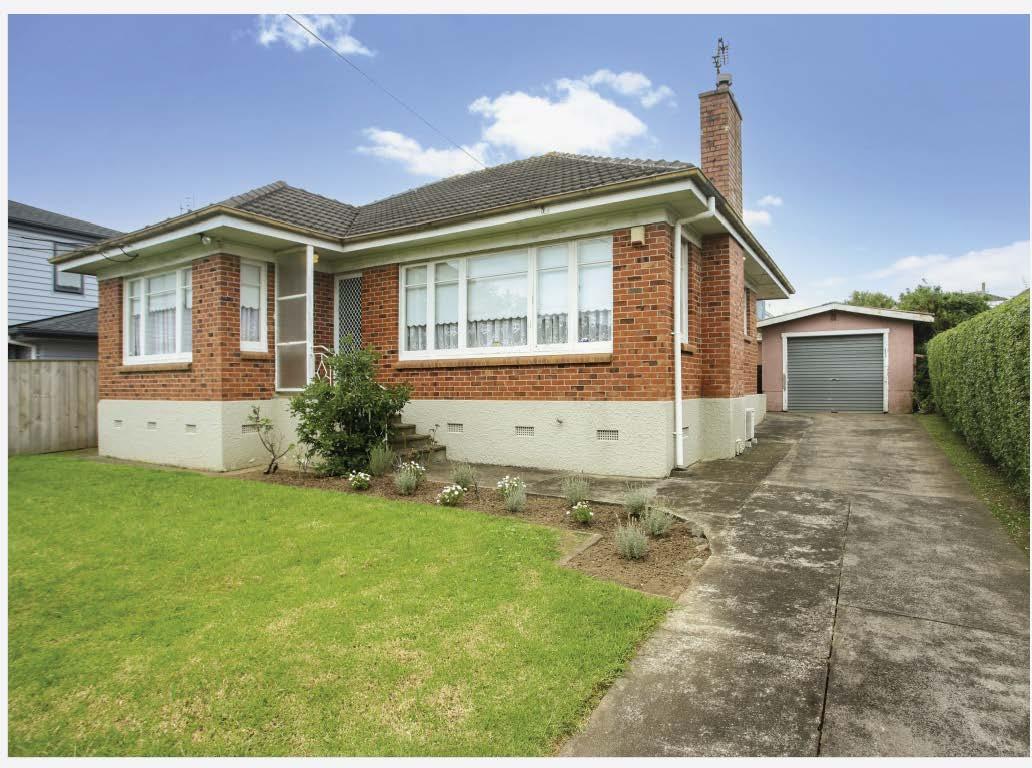
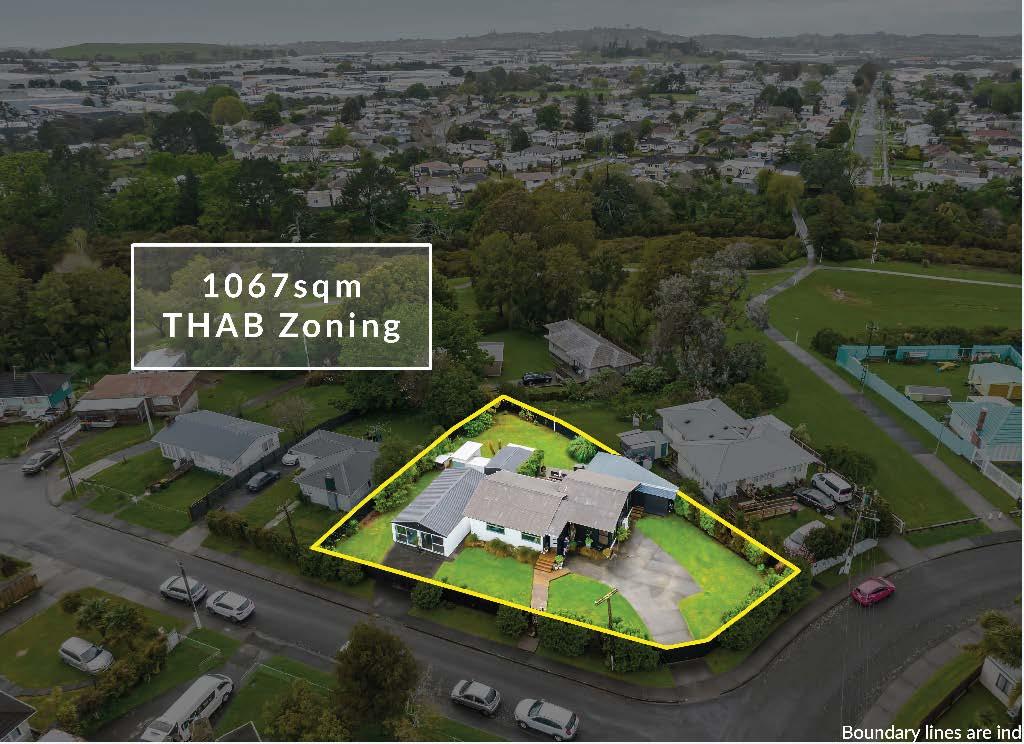
102 Mountain Road, Mangere Bridge NZ
§2 bl �1
BANK THELAND- LIVETHELIFESTYLE. On the market for the first time ever, this offering is position perfect and delivers the astute buy...
UnderOffer By Negotiation
Brent Worthington 029 296 5362 brent.worthington@ljhooker.co.nz
ForSale By Negotiation
View ByAppointment
Brent Worthington 029 296 5362
brent.worthington@ljhooker.co.nz
UnderOffer $1,200,000
Brent Worthington 029 296 5362 brent.worthington@ljhooker.co.nz
09 294 7500
Apr2023
1/233 Great South Road Drury NZ 2113 drury@ljhooker.co.nz
LJHooker
CURRENTOFFICELISTING

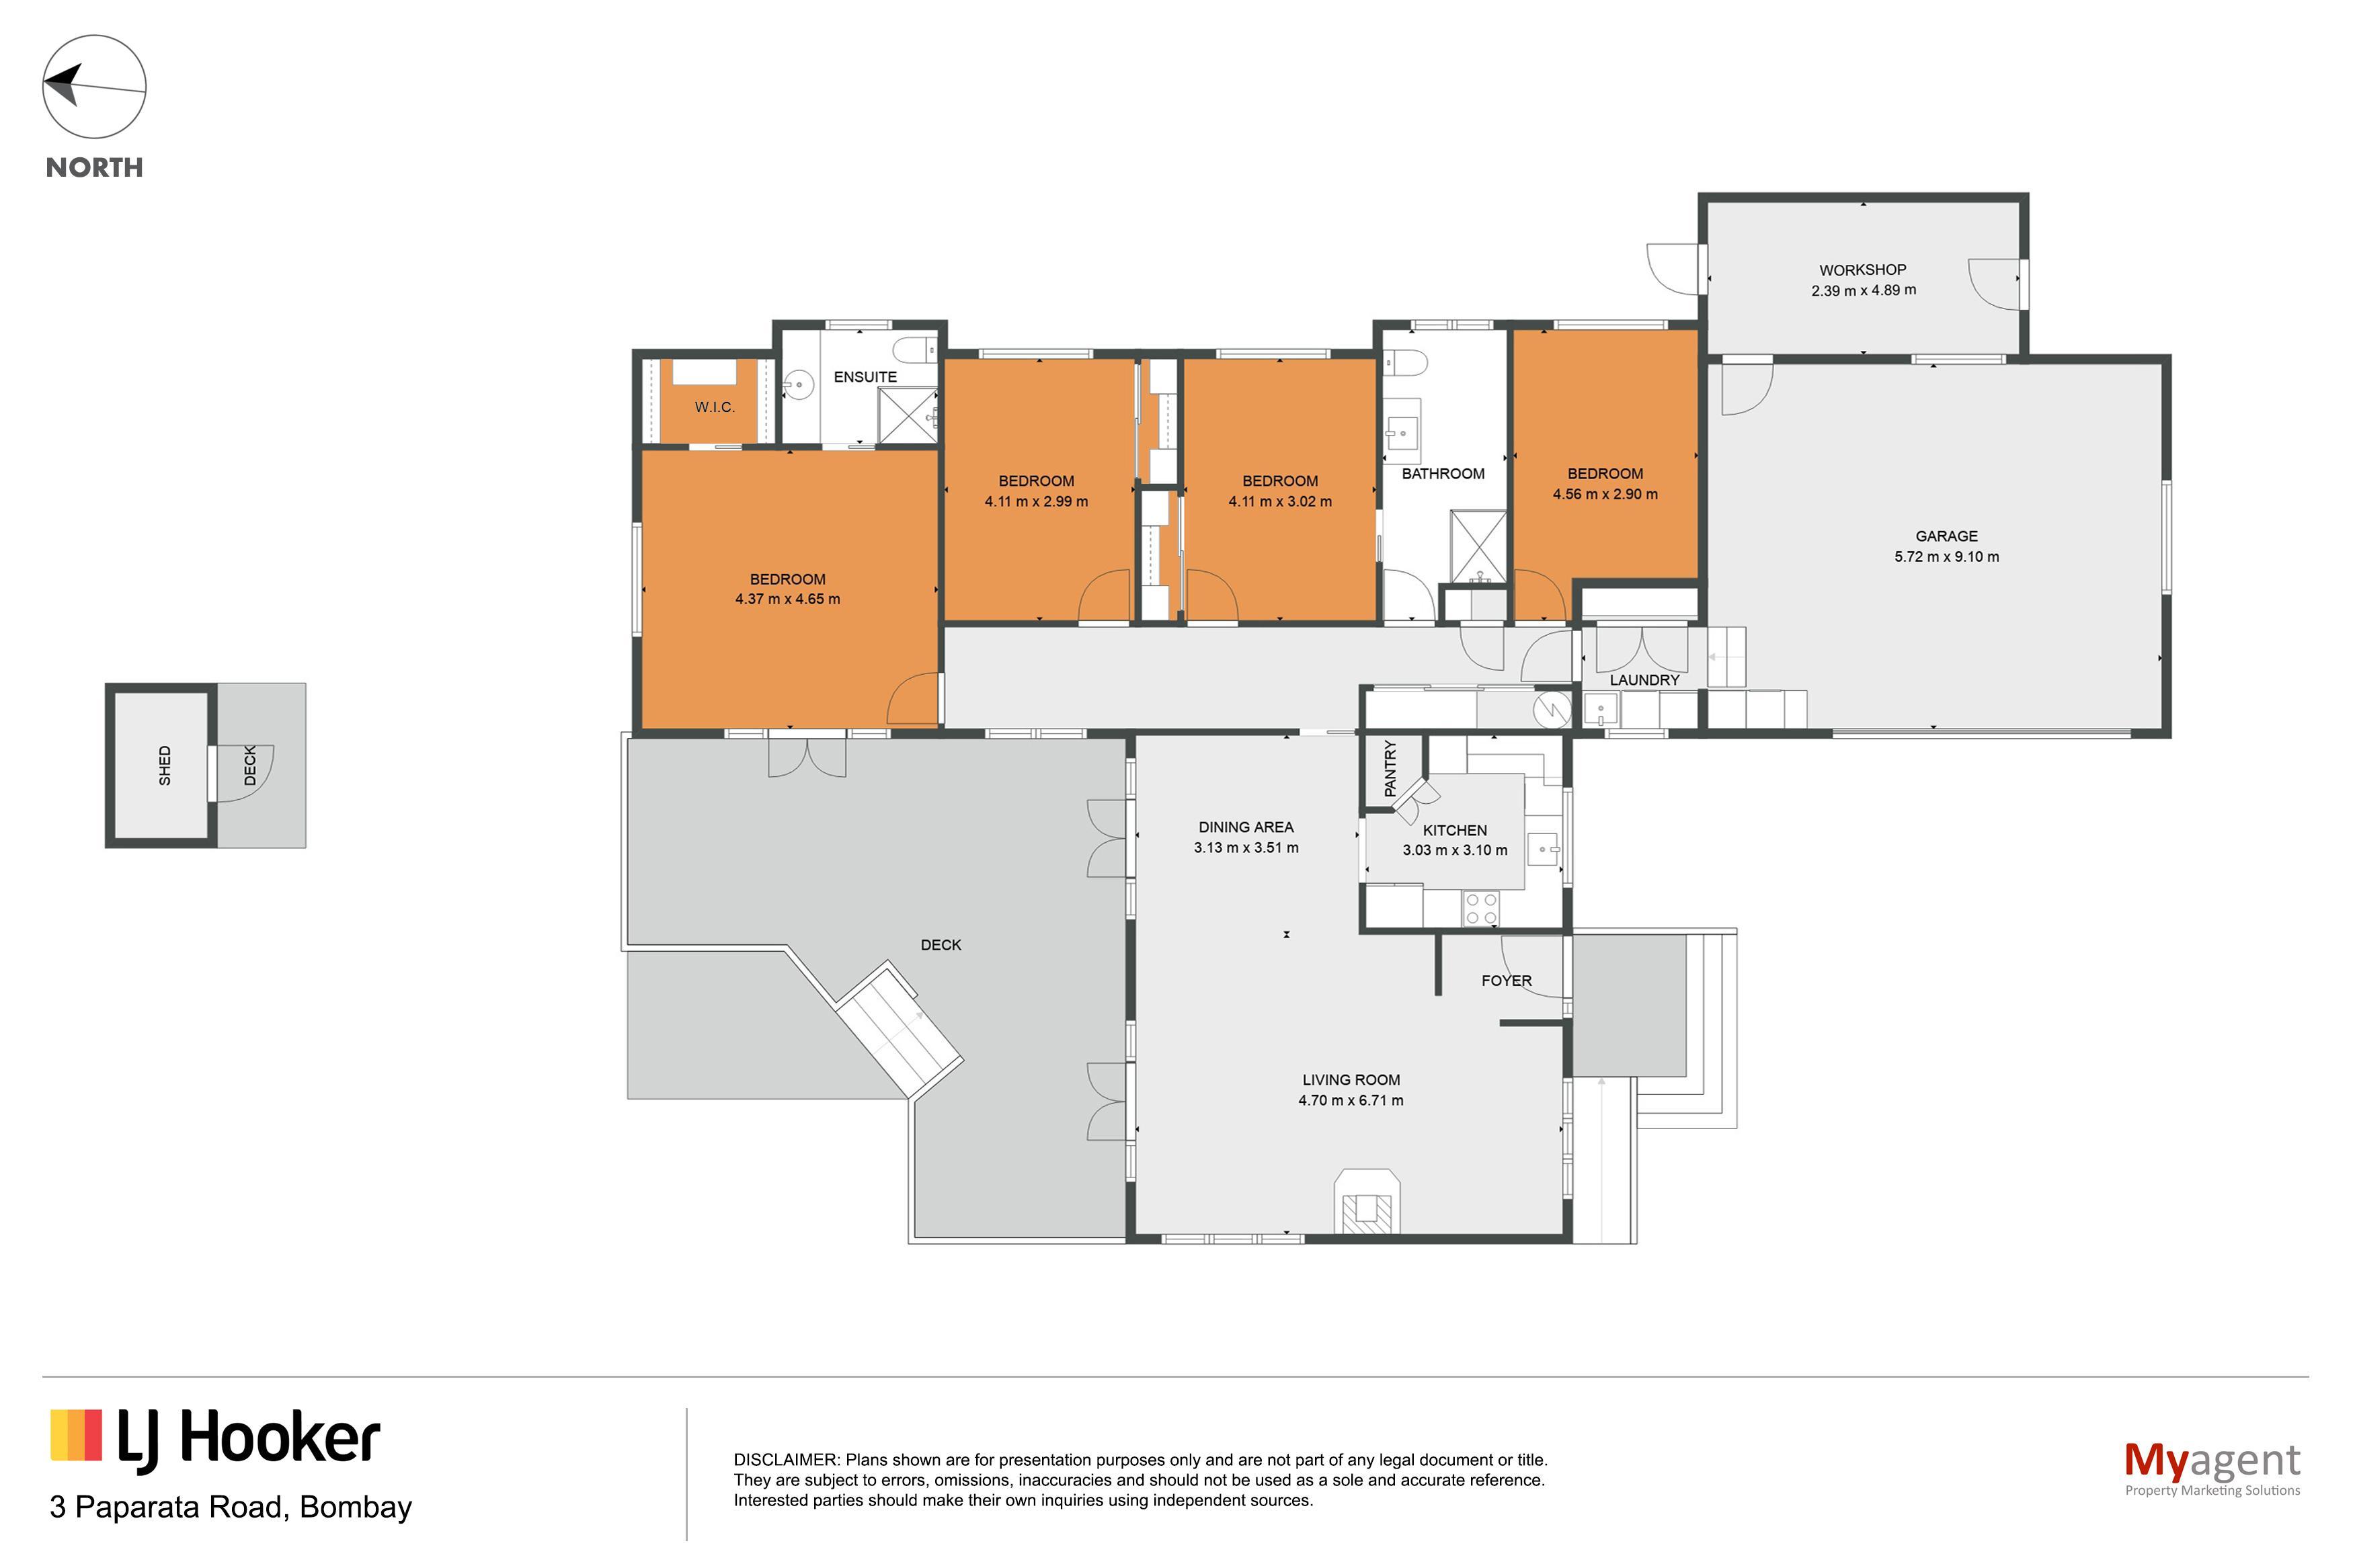
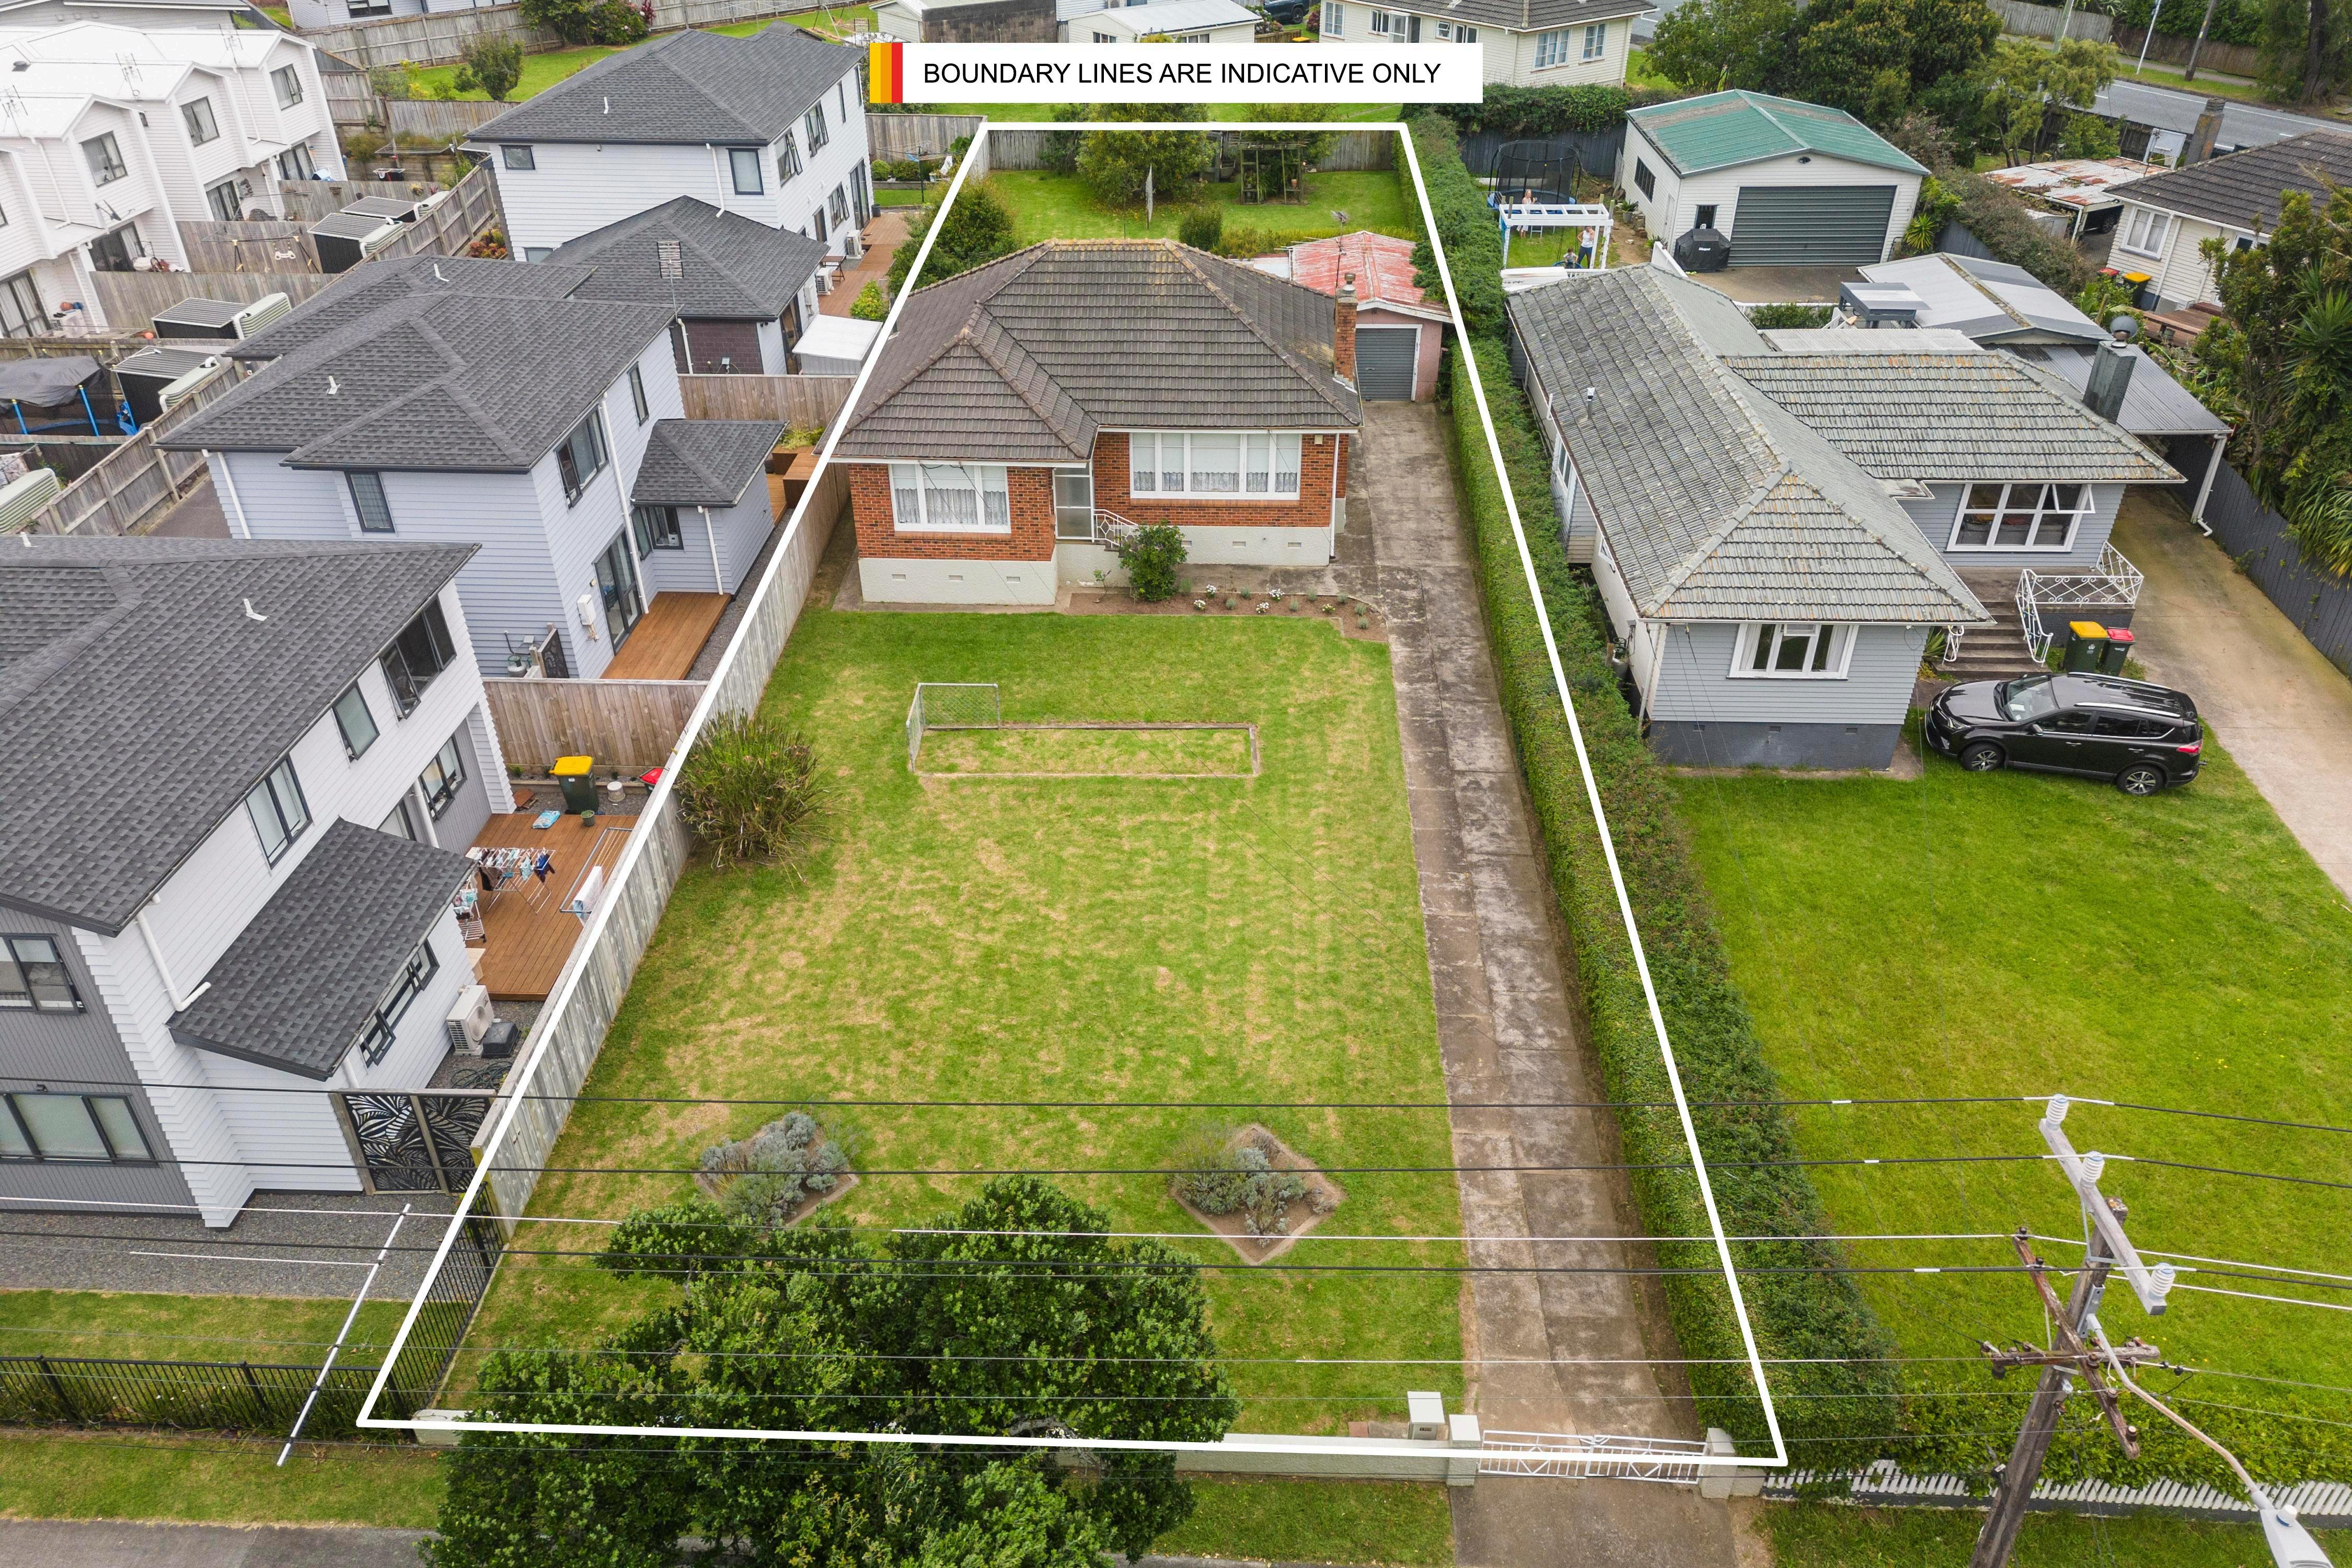
3 Paparata Road, Bombay NZ
§3 b2 �s
POSITION PERFECT!
It certainly is! 150 meters up the road you have the Decile9 Bombay Primary School, the Bombay Rug...
18th,
https://drury.ljhooker.co.nz/
Brent Worthington 029 296 5362
1/233 Great South Road Drury NZ 2113 drury@ljhooker.co.nz
09 294 7500
ForSale $1,225,000 View By Appointment Apr2023
brent.worthington@ljhooker.co.nz
LJHooker
https://drury.ljhooker.co.nz/
Recent Sales
35 Briody Terrace, Stonefields NZ
4 bed, 3 bath
STAND ALONE IN STONEFIELDS
Set on a 372m2 site (more or less) this 243m2 Fletcher designed and built dwelling will definitely i ...
91 Beatty Road, Pukekohe NZ
§8 b7 �
uNuM1TEo POTENTIAL

On the market for the first time in 43 years. The 630m2 dwelling is set on a 2,379m2 site (more or I...
Sold Brent Worthington 0292 965 362
brent.worthington@ljhooker.co.nz
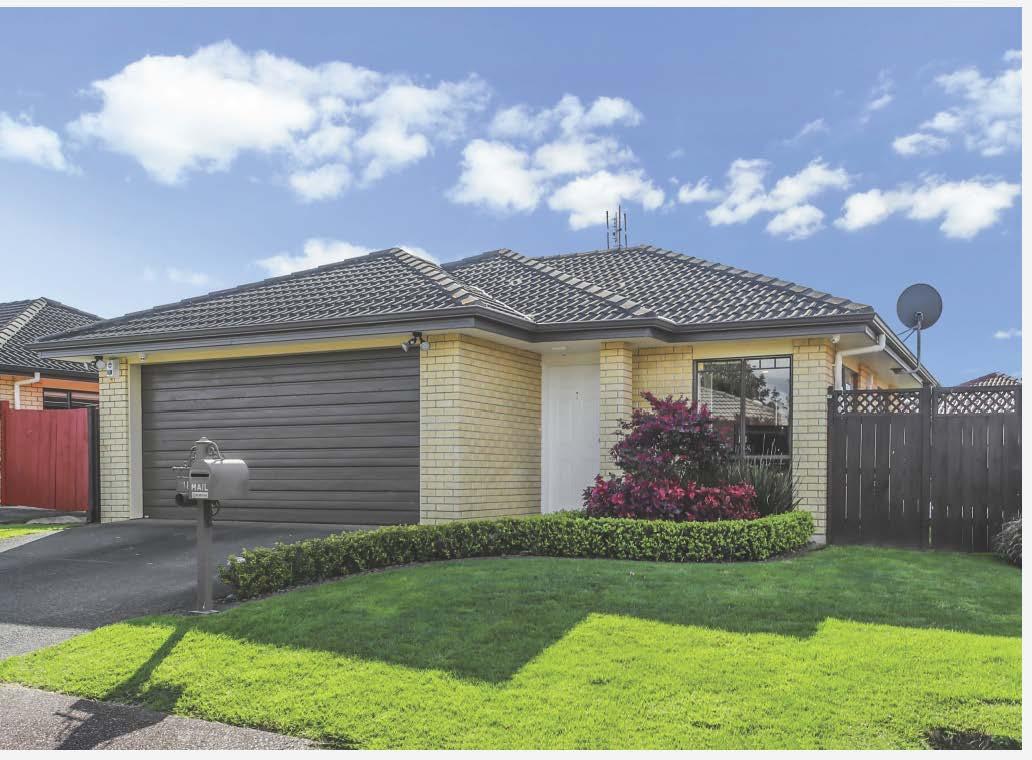
16 Stellata Court, Randwick Park NZ
§3 b2 �2
Brick&Tile Beauty In The Park. If it's the easy care of a brick and tile home you're after, then this one's for you.
Situat
87 Beatty Road, Pukekohe NZ
5 bdrm 4 bathrm 2 vehicles
Perfect Home and Income
The 262m2 (more or less) main dwelling is set on a 949m2 site (more or less) and offers the perfect ...
Sold Brent Worthington 0292 965 362
brent.worthington@ljhooker.co.nz
Sold Nav Johnson 027 827 2213 nav.johnson@ljhooker.co.nz


Sold Brent Worthington 0292 965 362
brent.worthington@ljhooker.co.nz
09 294 7500
LJ HookerDrury
1/233 Great South Road Drury NZ 2113 drury@ljhooker.co.nz
BRENTWORTHINGTON
BrentWorthington LicensedAgent&Principal
0292965362
Brent.worthington@ljhooker.co.nz
TOSELLORTOHOLD
Inthisclimateit’sallaboutmanagingexpectationssaysBrentWorthington,the town and country agent with a vast knowledge of the patterns and trends happeninginthepropertymarkettoday.

Having experienced the fluctuations and results of fallouts in the past, Brent is firmly of the belief that the cost of retention is likely to be higher than the cost ofsellingyourpropertyatthistime.

He gives a recent example of a mature couple who decided it was time to move into a retirement village. Their property sold for $300k under CV but the cost to have held on to it would have outweighed the benefit of what they gainedthroughmakinganinformeddecisiontomoveon.
It’s this sort of advice that Brent is able to provide to those who are contemplating their next move and who just need to talk it over with someone whoisintheknow.
For a private and confidential chat, feel welcome to call Brent on ……… to arrangeanappointmenttodiscussyouroptions.
When
™ TNB Property Services Limited, Licensed REAA (2008)
youknow,youknow.
NAVJOHNSON
NavJohnson LicenseeSalesperson
With more than 17 years customer service experience, Nav's clients all echo the same sentiments about him. Punctual, honest, softly spoken, understanding, calming in difficult and stressful situations. All qualities and attributes essential in Nav's previous employment as a driving instructor for 6 years. Now, these same qualities and attributes are what Nav delivers for his clients in the world of real estate.
By his own admission, Nav's driven by the pleasure of assisting his clients to reach their goals while delivering a great experience and outcome. "I like to work with you and not for you".

Fluent in English, Hindi, Punjabi and Urdu, away from real estate Nav enjoys the pleasures of family time with his wife, two children a cat and four budgies. He's also an ardent cricket fan, has played representative cricket abroad and is currently involved incoachingattheHowickPakurangaCricketClub.
TNB Property Services Limited, Licensed REAA (2008 drury@ljhooker.co.nz https: //drury.ljhooker.co.nz)
0278272213 nav.johnson@ljhooker.co.nz
Whenyouknow,youknow.™
LINAROBAN
LinaRoban
LicenseeSalesperson
02102288521
lina.roban@ljhooker.co.nz
Prior to entering the world of real estate, driven by her love of meeting and helping people, Lina had an impressive 20 year career in sales and marketing roles in the telecommunications and corporate marketing industries where her expertise in communication and negotiation always resulted in the delivery of superior customerservicetoherclients.

Originally from Fiji, Lina epitomises energy, passion integrity and hard work ineverythingsheturnsherhandto.
When not delivering superior service to her clients, Lina loves spending time with her family and is a passionate cyclist, owning both road and mountain bikes. With her three children all having "flown the coop", Lina and her husband also have plenty of time to enjoy their love of travel and some of their more memorable adventuresincludeextensivejourneysthroughoutSouthEastAsia,the USAandtheSouthPacific.
TNB Property Services Limited, Licensed REAA (2008 drury@ljhooker.co.nz https: //drury.ljhooker.co.nz)
Whenyouknow,youknow.™

Property Management

Onthefollowingpagesyouwillfindour Property ManagementNewsletter.

on’thesitatetocontactDebbieHarrisonwhocanably assist you with any Property Management issues you may have or if you have any questions about anything in the Newsletterorpropertymanagementingeneral


Email: debbie.harrison@ljhooker.co.nz
Phone:021303864

WhatYouShouldKnowBeforeYouRentaProperty
Rentingapropertycanbeanexcitingtime.Thisisgoingtobeyourhome,aplacewhereyou willgrowandwhereyouwillspendalotofyourtime Beforeyousignthatcontract,it's importanttobeinformedandpreparedforthatcommitment.

Tohelpyousettleintoyournextrentalproperty,here aresometipsforwhatyoushouldknowbefore rentingaproperty:

Understandyourrightsandresponsibilities
Asatenant,youhavecertainrightsand responsibilitiesoutlinedintheResidentialTenancies Act1986 Thisincludestherighttoquietenjoymentof theproperty,therighttoreasonablenoticebeforethe landlordenterstheproperty,andtherighttohave repairsandmaintenancedoneinatimelymanner

Youalsohavecertainresponsibilities,suchaspaying rentontime,keepingthepropertycleanandtidy,and notcausingdamagetotheproperty
It'simportanttounderstandyourrightsand responsibilitiesbeforesigningalease,asthiswillhelp youavoidanydisputeswithyourlandlordorproperty managerdownthetrack Ifyou'reunsureabout anything,youcancontacttheTenancyServicesor CitizensAdviceBureauforadvice
Doyourresearch
Beforerentingaproperty,it'simportanttodoyour researchontheareaandthepropertyitself.Thiswill helpyoumakeaninformeddecisionaboutwhether thepropertyisrightforyou.
Youshouldcheckouttheareatomakesureyoufeel safe,findoutaboutthequalityoftheschools,andthe proximitytopublictransportandotheramenities.You canalsouseonlinetoolslikeGoogleMapstogeta betterunderstandingofthearea.
Wheninspectingtheproperty,lookforanysignsof
damageorwearandtear Checkthatallthe appliancesareinworkingorder,andmakesure therearenoleaksordampness Youshouldalso checkthatthepropertymeetsyourneedsinterms ofsizeandlayout
Readthetenancyagreementcarefully
Thetenancyagreementisalegalcontract betweenyouandthelandlord,soit'simportantto readitcarefullybeforesigningit Makesureyou understandallthetermsandconditions,including therentamount,thelengthofthetenancy,andany otherrequirements
Youshouldalsocheckforanyspecialconditions thatmaybeincludedinthelease,suchas restrictionsonpetsorsmokingandvaping If there'sanythingyou'reunsureabout,askthe landlordorpropertymanagerforclarification
Knowthecostsinvolved

Beforerentingaproperty,it'simportantto understandallthecostsinvolved Thisincludesthe rentamount,thebond(whichwillbenomorethan fourweeks'rent),andanyotherfeesorcharges.
Youshouldalsoaskaboutthecostsofutilities, suchaselectricity,gas,andwater.Somelandlords mayincludethesecostsintherent,whileothers mayrequireyoutopaythemseparately.
It'simportanttobudgetforthesecostssothatyou canmanageyourfinanceseffectively.Youshould alsomakesureyouhaveenoughmoneysavedto coverunexpectedexpenses,suchasrepairsor maintenance.
ljhooker.co.nz
Geteverythinginwriting
Toavoidanymisunderstandingsordisputes,it's importanttogeteverythinginwriting Thisincludes anyagreementsyoumakewiththelandlordor propertymanager
Forexample,ifthelandlordpromisestofixaleaky tap,makesureyougetthisinwritingsothatyou haveevidenceiftheydon'tfollowthrough You shouldalsogetanychangestothetenancy agreementinwriting,suchasanextensiontothe tenancyterm
Insureyourbelongings
Whilethelandlord'sinsurancewillcoverdamageto theproperty,itwillnotcoveryourpersonalproperty. Thismeansthatifyourbelongingsarestolenor damagedinafire,youwillnotbecovered.
Toprotectyourpersonalproperty,it'sagoodideato takeoutcontentsinsurance.Thiswillcoveryour belongingsagainstlossordamage,andcangive youpeaceofmindknowingthatyou'reprotected.

Therearemanyinsurancecompaniesthatoffer contentsinsuranceforrenters,soit'sworthshopping aroundtofindthebestdeal.

Knowhowtoendthetenancy
Atsomepoint,youmayneedtoendthetenancy
andmoveoutoftheproperty It'simportantto understandhowtodothisproperlytoavoidany issueswiththelandlord

Thetenancyagreementshouldspecifyhowmuch noticeyouneedtogivebeforeendingthetenancy Thisisusuallyfourweeks,butitcanvary dependingonwhetheryouhaveafix-termor periodictenancy
Youshouldalsomakesurethatthepropertyisleft inthesameconditionaswhenyoumovedin This meanscleaningthepropertythoroughlyand repairinganydamagethatyoumayhavecaused
Onceyou'vemovedout,thelandlordwillconducta finalinspectiontochecktheconditionofthe property.Ifeverythingisinorder,theywillreturn yourbondtoyou.
Rentingapropertyisagreatoptionformany people,it’sawaytolivewhereyouwantandenjoy allthelocalamenities.Butit'simportantto understandyourrightsandresponsibilitiesbefore signingatenancyagreement.Bydoingyour research,readingtheagreementcarefully,and gettingeverythinginwriting.Thiswillallowyouto avoidanyissuesandenjoyyourrentalproperty withpeaceofmind.

Theinformationcontainedinthispublicationisgeneralinnatureandisnotintendedtobepersonalisedrealestateadvice
Beforemakinganydecisionsyoushouldconsultalegalor professionaladvisorLJHookerNewZealandLtdbelievestheinformationinthispublicationiscorrectandithasreasonablegroundsforanyopinionorrecommendationcontainedinthis publicationonthedateofthispublication NothinginthispublicationisorshouldbetakenasanofferinvitationorrecommendationLJHookerNewZealandLtdacceptsnoresponsibilityfor anylosscausedasaresultofanypersonrelyingonanyinformationinthispublication ThispublicationisfortheuseofpersonsinNewZealandonlyCopyrightinthispublicationisownedby LJHookerNewZealandLtd
Youmustnotreproduceordistributecontentfromthispublicationoranypartofitwithoutpriorpermission
ljhooker.co.nz
IIt’srareinlifethatwegetsomethingfornothingwithnostringsattached, especiallyifitgenuinelyaddsvalue.Nevertheless,that’spreciselywhatIwillgive you.
Expert home loan advice which has reliably proven to offer significant long-term financial advantage. Keeping strict tabs on the country’s largest network of banks and numerous smaller second-tier lenders, so you don’t have to.
What’s more, this comes at no cost to you because your chosen bank pays for theprivilege. You have nothing to lose, yet have a higher chance of securing better terms.Restassured-ifthere’sasuperiordealoutthereforyou,I’llfindit.
In the typically stoical world of finance, we offer a point of difference. Not only will youreceive excellent independent and impartial advice, but you’ll have fun doing it. Even after 15 years in the mortgage arena, our enthusiasm for objectives and commitment to clients shines through at every turn. Endorsement comes from countless glowing testimonials and Keith's own words: “We are at our happiest helping people navigate through difficult situations, giving hope and concrete opportunity where they previously had none.”
Since 2002, I have helped countless clients achieve their goals and dreams, either purchasing their first home, their next or building a forever home, or to arrange finance to acquire an investment property or asset finance. Annually, I will also review your existing lending, loan structure or assist with debt consolidation. Being solution focused to obtain the ‘best outcomes financially’ and delivering the ‘most suitable solutions’ for your financial situation, is what drives me. No matter what age or stage you are, working alongside my team, we will represent you and your situation honestly, with integrity and professionalism. Check out my Google reviews. I look forward to journeyingonthispathwithyou.
KeithJones MortgageAdviser
021849767
keith.jones@loanmarket.co.nz

Top Reasons to Get a Property Inspection Before You Sell

Buyers will often get a property inspection to reveal any unwanted surprises that may mean additional costs they did not budget for.
Butsellersshouldnotjustleavethatuptothebuyers,ifyougetabuilding inspectiondonebeforeyourpropertyhitsthemarketitwilluncover whetheryouhavemould,leakingpipes,electricalwiringissues,water damageandpotentiallymore Withthisinformationinhand,youasthe sellergetthechancetosetyourselfupforamoresuccessfulsale.
Sowhyshouldyouconsiderapre-salepropertyinspection?
Getmoreinterestedbuyers
Asaseller,youwanttoattractmoreinterestedbuyers,andwithaproperty inspectionreportprovidedupfront,itgivesbuyersacomprehensive overviewonthegeneralconditionofyourproperty.
Thisgivesbuyersmoreconfidenceyourpropertyhasnoissuestheywould needtodealwith,oritgivesthemconfidencethatworkthatneededtobe donewasdoneproperly. Allthosedetailswouldbeoutlinedinthisreport, andbuyerswillbeabletoproceedwithconfidenceknowingexactlythe stateandconditionofthehometheywanttobuy.
Withthereportinhandatthebeginningofyourpropertysellingjourney,it couldalsoacceleratethedealprocessasyoucanaddressissues beforehand. Thiswouldavoiddelaysandsetbacksthatcouldoccurduring thenegotiationifunexpectedproblemscroppedupfromthebuyer’s propertyinspection.
Givesyouunderstandingofthecurrent conditionsofyourproperty
Afterathoroughinspectionunderthefloorboards,intheceilingand everywhereelsearoundyourproperty,youwillhaveanaccurate understandingofitscondition. Duringthisprocess,minorandmajorissues, suchascracksanddrainageproblems,canbenoticedandeasilyfixedto avoidbiggerproblemsdownthetrack.
Withaprofessionalinspectionyoucancorrectanyissuesrightaway. This givesyouanadvantageduringpricenegotiations,allowingyoutobackup yourclaimsabouttheconditionofyourpropertywithanindependentand expertreport.
Also,withaclearunderstandingofyourproperty’scondition,youhavea betterpicturetodetermineitsvalueforanaccurateandrealistic expectationonwheretosetyourpricerange.
Understandpotentialfutureexpenses
Withacompletepropertyinspection,youwillgetaninsightintofuture costswithahighdegreeofaccuracy. Ensuringyouandthefutureowner understandwhenvarioussystems,suchaspipingandplumbing,may needtobereplaced.
Also,itcouldbehelpfultogetthesesystemsassessedforwearandtearto understandtheirexpectedlifespan. Thisgivesyouconfidencethatthese systemsarestillingoodworkingorderatthetimeofsale.
Whetheryousellornot,thisinformationhelpsyoubetterbudgetandplan forthesecosts,aswellashelpduringnegotiations. Youmightendup havingafaultysystemreplacedbeforelistingyourproperty. Andforthose thatareingoodworkingorderanddonotneedattention,yourinspection givesyoutheopportunitytohighlightthisfacttobuyersandpotentiallyget youabetterprice.
Firmupyourexpectations
A correctandaccurateperspectiveofyourproperty’svaluegivesyou addedconfidenceduringthesellingprocess. Withacomprehensive propertyreport,youwillbeabletosetyourownexpectationsaroundthe priceandthesaleofyourhomewithconfidence.
Youwillalsohaveasolidfoundationforansweringanyquestionsthata prospectivebuyercouldhave. Bybeingabletoreferencetheviewofan independentprofessionalinspectionreport,youcangivebuyersmore confidenceandencouragethemtomakebetteroffersandtransactmore quickly.
Restassured- youhavepeaceofmind
Withadetailedreportfullofcriticalinformationonthe‘health’statusof yourhome,youcanbesuretohavepeaceofmind. Whenyouknowyour homeisstructurallysoundandingoodcondition,youcanattracthigher prices.
Withaninspectionthatputsyourpropertyintheclear,youcanstart marketingyourpropertyandnegotiatewithconfidence,knowingthat prospectivebuyerswon’tfindanyissuesbecauseyouhaveturnedover everyrock.
Additionally,ifanyproblemsdocropupfromthebuyer,youwillbeina positionwhereyouwillbeabletosortthemoutswiftlyand,onyourterms, astheywillnotbeasurprise. Butwithahousethatismove-in-readyand withacleanbillofhealth,youhaveputinterestedbuyersintoa comfortablepositionwheretheyknowtheycanputinanofferwithease.


Get your golden opportunities now supergold.govt.nz SuperGold welcome here 0011 MSD SuperGold Counter Card A4_2_LB_FA.indd 1 13/09/19 10:58 AM
When


you know, you know. ™
Today,wehonourallthosewhoareservingandwhohaveservedtheir country.Yoursacrificesandbraverywillneverbeforgotten. Clicktoviewvideo

April25th –
ANZACDAY
