The market is at an interesting juncture. While stock levels are still relatively high, we’re starting to see more movement in the market. Buyers are taking advantage of increased choice, but vendors still need to be strategic with pricing. The faster turnover of listings is encouraging for both sides, but it’s essential to remain realistic about pricing in a market wherethepowerstilllieswiththebuyer.
Please don't hesitate to contact our team who can ably assist you with any property management matters you may have or if you have any questions about anything in the newsletter or property management in general.
Investing in Property:
Are You Ready to Expand Your Portfolio?
3 September 2024
Investing in property is an exciting and proven way to grow your wealth over time. It’s no surprise that many Kiwi investors aspire to diversify their portfolios by acquiring multiple properties.
However, determining when to purchase a second investment property can be challenging, as it hinges on various factors, including your financial readiness and the current market conditions.
Here's how to assess whether you’re ready to buy another investment property.
Financial readiness
If you’re financially ready to invest, now might be the right time to take action. Regardless of broader market conditions, there are always pockets in cities and regions showing growth and offering solid returns.
However, if you’re unsure about your readiness to invest in another property, start by evaluating your financial preparedness. Here are some key indicators to consider:
Solid cash flow
Evaluate whether your existing investment properties generate consistent cash flow. Positive cash flow indicates that your properties are profitable and could support the purchase of additional assets. Aim for a healthy cash flow that covers mortgage repayments, maintenance expenses, and vacancies.
Healthy emergency fund
Building an emergency fund is crucial for property investors. Unexpected costs, such as repairs, vacancies, or economic downturns, can arise, requiring immediate financial resources. Ensure you have sufficient savings set aside to cover any unforeseen circumstances.
Stable portfolio
Assess the performance of your current investment properties and the overall stability of your portfolio. A diversified portfolio across different property types and locations can help mitigate risk and withstand market fluctuations. If your properties show consistent growth and resilience, it could indicate readiness to expand your portfolio.
Consult your financial adviser
Once you’ve assessed your finances, speak with your broker or lender about loans, interest rates, and pre-approvals. Remember to only borrow within your means. Ideally, aim to have a 35 percent deposit ready in cash or equity or a combination of both. Also, prepare for potential interest rate rises to avoid any surprises in the future.
Researching the market
In addition to financial readiness, conducting thorough market research and assessing your personal commitment to owning additional property is crucial.
Understanding market trends
Stay informed about current real estate market trends and forecasts in your target locations. Look at factors such as supply and demand, rental returns, employment rates, and economic indicators. Identifying emerging property hotspots or potential risks can help guide your investment decisions and timing.
Responsibilities of homeownership
Owning additional investment properties comes with extra responsibilities. Consider whether you’re prepared to handle more property management tasks, tenant relations, maintenance issues, and regulatory compliance.
Alignment with financial goals
Assess how acquiring another investment property aligns with your long-term financial objectives. Clarify your investment strategy, risk tolerance, and desired outcomes. Determine whether the potential benefits of expansion such as increased cash flow, equity growth, or portfolio diversification align with your financial goals and timeline.
Consult with a property professional
Engage with a trusted real estate agent or property adviser who has expertise in your target market. A knowledgeable agent can provide valuable insights into local market trends, property values, and investment opportunities.
Signs you’re ready to buy another property
The best time to purchase your next property is when you feel prepared. Every property investor progresses at their own pace, so there isn’t a one-size-fits-all schedule for expanding a portfolio. However, there are some signs that you might be ready to buy your next property:
You have significant equity
Increased property value boosts your equity, making it easier to secure finance for your next purchase.
You have increased income
A pay rise or improved returns from your first investment can enhance your ability to buy another property.
Your first property is performing well
If your initial investment property is providing steady income and you’re comfortable with the idea of expanding your portfolio, this is a good indicator that you’re ready to buy
Favourable market conditions
Look for areas with low vacancy rates, strong rental returns, and positive growth forecasts, supported by favourable interest rates and government incentives (e.g., new build incentives).
If any or all of these signs apply to your situation, it might be the perfect opportunity to purchase your next investment property.
Carefully evaluate your financial readiness, which will give you the confidence to grow your portfolio.
By investing wisely and seeking expert guidance, you can significantly enhance your financial future.
Whether you’re just starting out or seeking advice on expanding your portfolio, LJ Hooker Town & Country is here to support you.
The Real Estate Institute of New Zealand (REINZ) August 2024 figures show signs of increased confidence, optimism and activity compared to the previous year. While the overall sales volume slightly declined, several regions reported notable increases in activity, and year-on-year listing numbers continue to rise.
REINZ Chief Executive Jen Baird said August provided a sense of confidence and positivity to the property market.
“ August data shows a level of stability in the market. Despite a marginal 0.6% (or $5,000) decrease in national median prices year-onyear, we’re seeing prices hold steady with a 1.3% increase month-on-month,
says Baird.
Compared to August 2023, the total number of properties sold nationally decreased by 0.7% (just 40 properties), from 5,725 to 5,685, and decreased by 5.1% month-on-month, from 5,992 to 5,685. In the regions, eight regions saw an increase in sales in August 2024, and the most significant increases were in Northland (+22.7%), Hawke’s Bay (+21.6%) and Bay of Plenty (+16.2%). Compared to July 2024, five regions saw an increase in sales volume.
The national median price decreased by 0.6% year-on-year, from $770,000 to $765,000, and increased by 1.3% monthon-month. For New Zealand, excluding Auckland, the median price increased 1.6% year-on-year from $670,000 to $681,000. Month-on-month, the median price increased by 1.8%.
Six of the sixteen regions had a median price increase year-on-year, with Otago leading the way with a 6.7% increase to $640,000, followed closely by the West Coast with a 6.6% increase to $357,000. Eight regions increased month-on-month, with the most notable changes observed in Marlborough (+7.8% to $625,000) and Gisborne (+6.0% to $620,000).
Staying in the regions, thirteen of the fifteen have seen a rise in new listings year-on-year, with the most notable increases recorded in Gisborne (+69.2%), Marlborough (+40.8%) and Manawatu-Whanganui (+39.8%). Two regions saw a decrease in new listings year-on-year: Nelson (-18.1%) and Northland (-11.1%). Nationally, there was an 8.1% increase in new listings compared to August 2023.
“This month, we saw further signs of a change in market sentiment, with local agents reporting increased confidence in vendors and purchasers, the return of investors, and increased activity, particularly at open homes over the last two weeks of August. They attribute this change to the decline in interest rates. However, it would be an overstatement to say that we are at a turning point in the market – we merely have our indicators on. While there is a rise in optimism and confidence, we are hopeful that better times are still ahead,” adds Baird.
Jen Baird CEO, REINZ
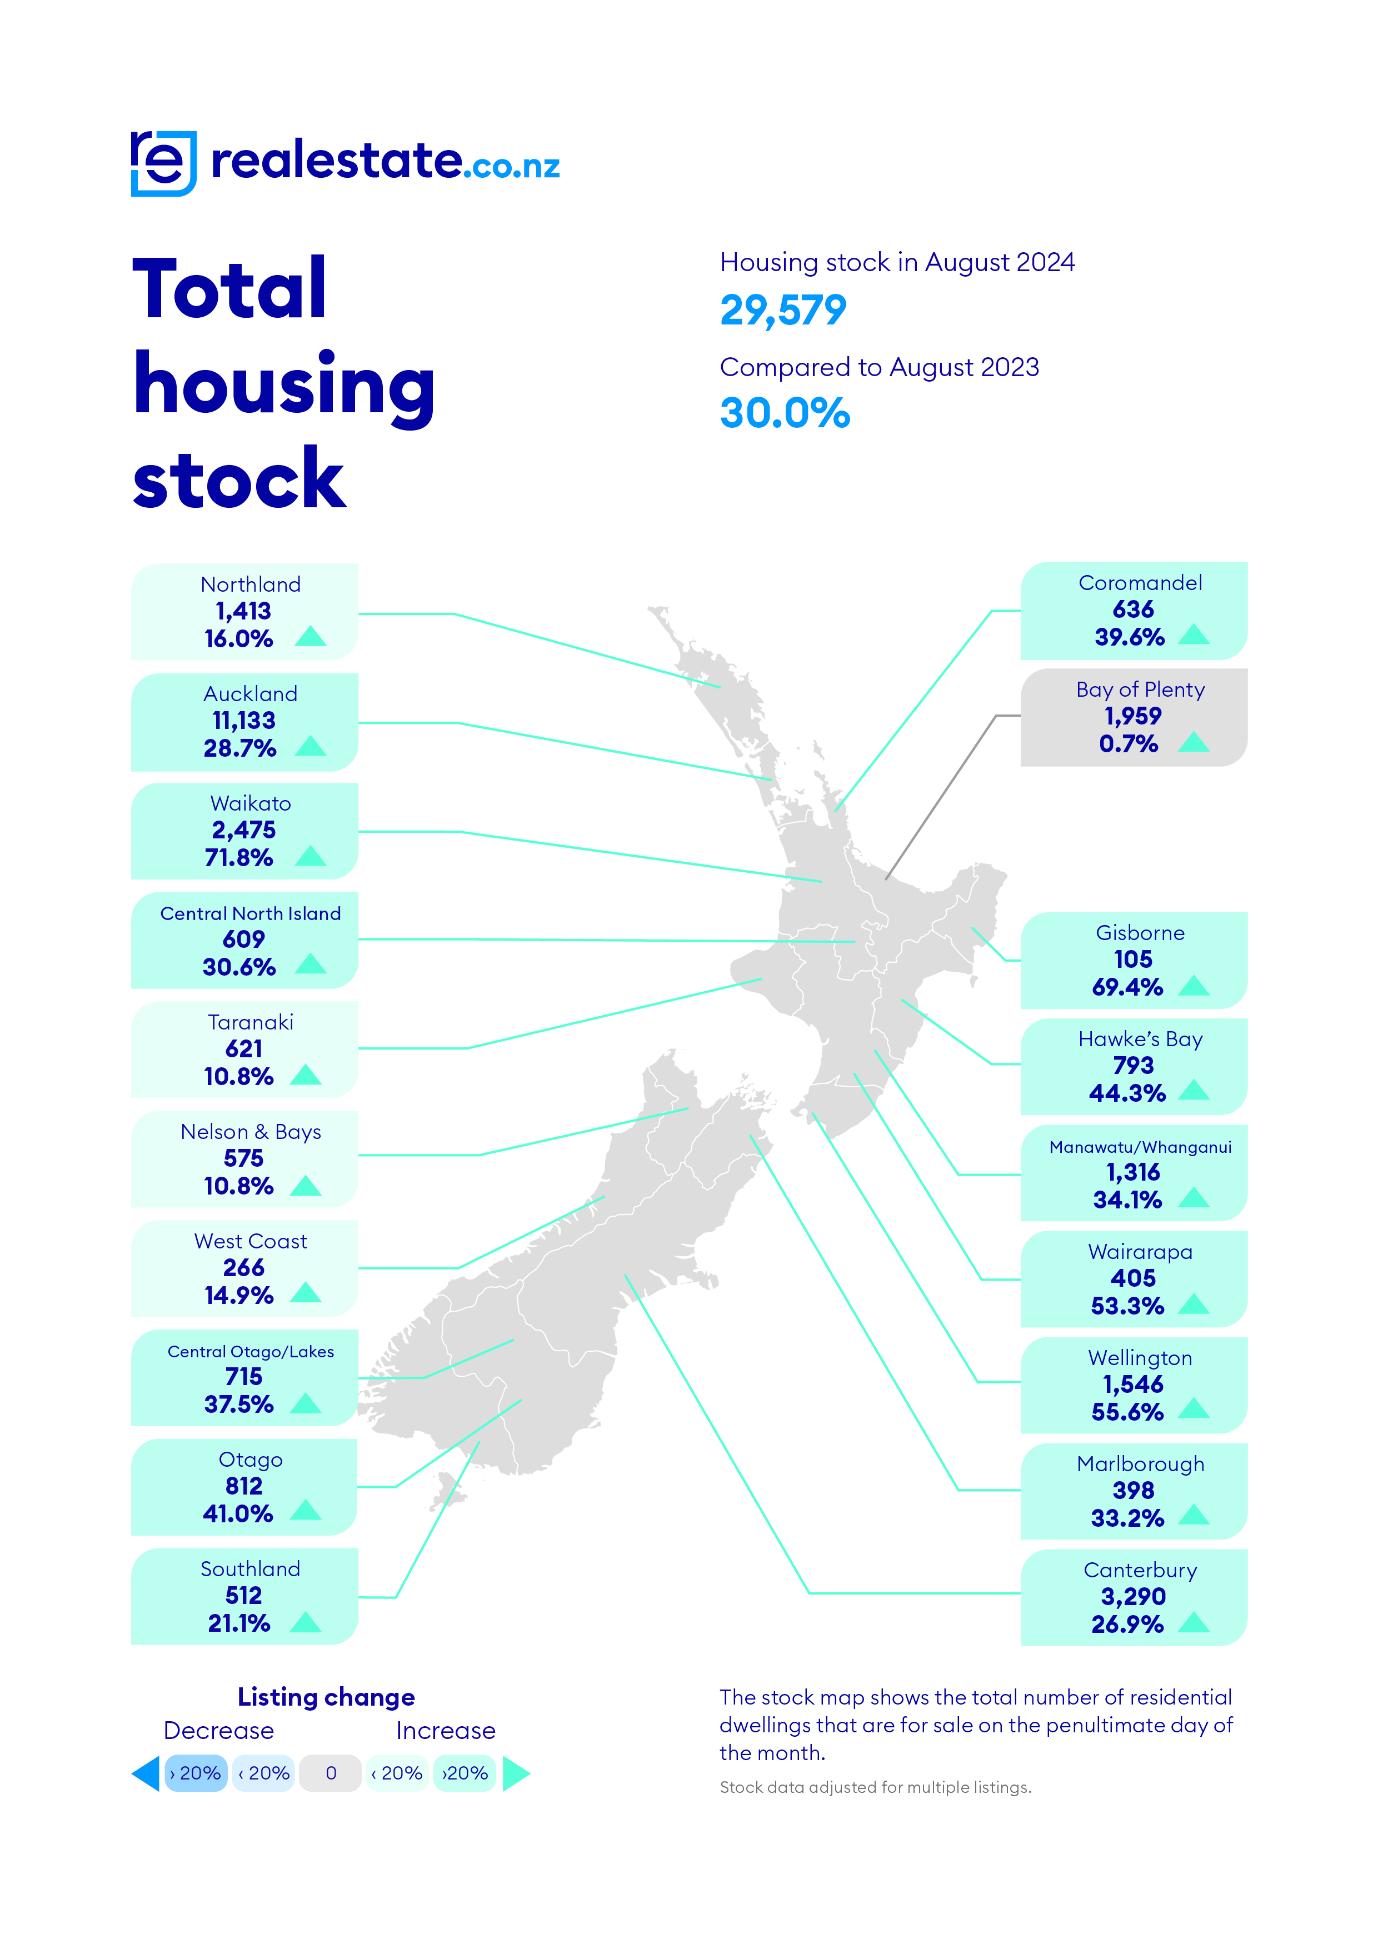
The national inventory level increased by 30.0% (+6,830) in August, from 22,750 to 29,579 year-on-year and decreased by 3.2% (-977) from 30,556 month-on-month. For New Zealand ex Auckland, inventory levels increased 30.8% (+4,348) year-on-year from 14,099 to 18,447 and decreased 2.4% (-460) compared to June 2024.
Compared to August 2023, the median days to sell increased by eight days, from 42 to 50 days nationally. For New Zealand, excluding Auckland, median days to sell increased by six days, from 43 to 49 year-on-year. Five regions had fewer days to sell in August 2024 than in August 2023. Northland had the highest median days to sell at 71 days, an increase of 10 days year-on-year.
“We continue to see an increase in the average number of properties listed. Although the inventory is down slightly compared to last month, the volume of properties for sale continues to provide a lot of choice for buyers,” adds Baird.
There were 656 auctions nationally in August 2024 (11.5% of all sales), compared to 799 (10.9% of all sales) in August 2023. The Auckland region called 335 auctions in August 2024 (18.6% of all sales), compared to 492 auctions or 25.5% of all sales in August 2023.
“There is an expectation that rates will fall further towards the end of this year, providing the much-needed relief to property owners and those in the position to buy, which may increase sales volumes nationwide,” comments Baird.
The HPI for New Zealand stood at 3,563 in August 2024, a 0.8% decrease from August 2023. There was no change compared to July 2024. The average annual growth in the New Zealand HPI over the past five years has been 5.0% per annum, and it is currently 16.7% below the market peak reached in 2021. Southland is the top-ranked region in August, with a +3.0% increase year-on-year.
The Real Estate Institute of New Zealand (REINZ) has the latest and most accurate real estate data in New Zealand.
For more information and data on national and regional activity visit the REINZ’s website
Media contact:
Laura Wilmot Head of Communications and Engagement, REINZ Mobile: 021 953 308 communications@reinz.co.nz
Market Snapshot – August 2024
MEDIAN HOUSE PRICE YEAR-ON-YEAR
REINZ HOUSE PRICE INDEX YEAR-ON-YEAR SALES COUNT YEAR-ON-YEAR
q National$765,000-0.6%
p NZ excl Akl$681,0001.6%
q Auckland$960,000-4.0%
q National5,685-0.7% p NZ excl Akl3,8842.4% q Auckland1,801-6.8%
MEDIAN HOUSE PRICE MONTH-ON-MONTH SALES COUNT MONTH-ON-MONTH
p National$765,0001.3%
p NZ excl Akl$681,0001.8% p Auckland$960,0001.1% q National5,685-5.1% q NZ excl Akl3,884-5.5% q Auckland1,801-4.4%
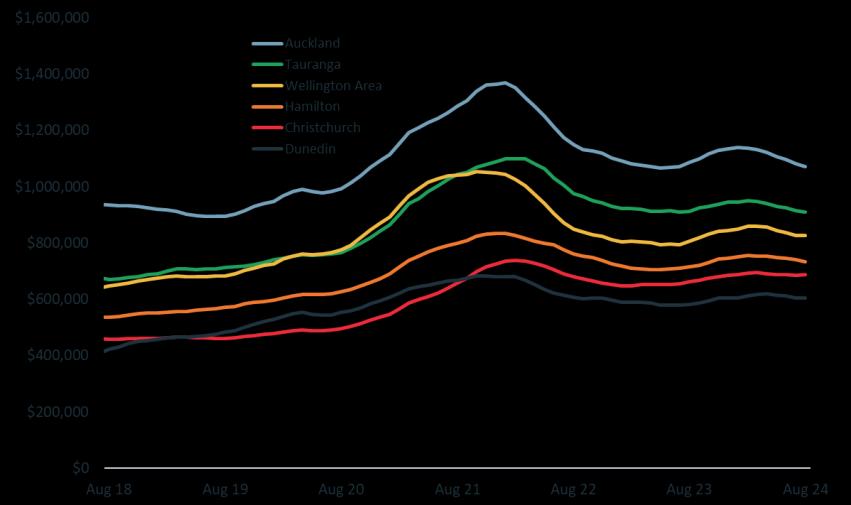
Moreover,followingrevisionsto previousmonths’dataasthe index capturesmore information (July nowdown -1.0%), thisnowtakesthetotalfallsinceFebruaryto3.7%nationally,oraround$31,100lower.
The median value acrosssall stocknowsitsat $811,583,which remains about17% above pre-COVIDlevels.Butit’s also about17% lowerthanthe January2022peak.
August’sresultsare the secondrelease to use the newhedonic methodology,whichimprovesthe timeliness and accuracyin measurementof changesto the residential real estatemarket The increasedweightingon recentsales evidenceis clearly showingthe re-emergenceof softhousingmarketconditionsacrossthe country.
Indeed,apartfromChristchurch(upby0.2%),therewerefallsinvaluesacrosseachofthemaincentresinAugust, with Aucklanddroppingby another1.0%(taking itsfall since apeak in Januaryto 6.0%)andHamilton by 0.8%. The falls in Tauranga,Dunedin, andWellington weremore modestatless thanhalfa percentoverthe month.
“Nodoubtmanyhouseholdswill be feelinghappiernow thatthe official cashrate is falling andmortgage ratesare headedlowertoo This sentimenteffect,aswellasthe direct boostto borrowers’finances,couldsupporthousingin the nearterm.”
“Yetthe latest, actualfall in valuesis atimely reminderthatthe market still facesconsiderablechallenges too.Fora start,housingaffordability is still stretched,while at the same time the labourmarketdownturnis fully underway.Even if people haven’tlosttheir jobs,the increased feelingsof insecurity will still tendto flow throughto less enthusiasmto trade propertyor pay top-dollar.”
“It’salso clearthatthe bargaining powerlies with buyersin a market wherethe stockof available listings is sitting atmulti-yearhighs.But that’sstill only for the more limited pool ofbuyerswhocan actually securethe finance.”
“This all addsupto likely further restrainton propertyvaluesin the comingmonths,althoughthe potential impactof lowermortgage ratescan’tbe ignored."
CoreLogic HVI – Main Centres
IndexresultsforAugust2024–nationalandmaincentres
NZ Hedonic Home Value Index
Auckland
Each of Auckland’ssub-marketsregisteredafall in propertyvaluesin August,ranging from0.5-0.9%in Franklin, Waitakere,Manukau,Rodney,andNorth Shore, downto more notable weaknessin AucklandCity (-1.4%)andPapakura (-1.7%).
That said,comparedto ayearago,AucklandCityhasheld upalittle betterthanelsewhere,only downby 0.6%, versus falls ofaround2% or more in Manukau,Waitakere,Rodney,andPapakura.
Puttingaside thesevariationsfrom areato area, however,MrDavidsonnotedthatthe bigger picture for Auckland’s housingmarketisone of generally renewedweakness.
“Eachpartof Aucklandhasdroppedby 3% or moresince the latestmini-peak forvalues,andalthoughmortgagerates are nowfalling, affordability challengesstill persist.Meanwhile,an elevatedstockof listings givesbuyersthe pricing power,andthe continuedflow of new-buildshitting the marketonly addsto thoseeffects."
Wellington
The Wellington areaflattenedouta little in August,aftersomeweakerresultsin the prior fewmonths.To be fair, Kapiti Coastrecordedanotherdropin values(0.9%), while Lower HuttandPoriruaalsofell. Butthe UpperHutt marketheld steadyin August,andWellington City actually recordedamodest0.2% lift in values.
The falls in previousmonthsmeanthat valuesremain lowerthanthree monthsago in eachof thosesub-markets,as well astheirmini-peaksearlier in the year.Indeed,those latterfalls are 4% ormore in Porirua,Kapiti Coast,andLower Hutt.
MrDavidsonnoted,"the negative sentimentthat’scirculating aroundpublic sectoremploymentatpresentwill be tendingto weigh on widerWellington propertyvalues.Butjustlike in Auckland,there are otherfactorsat play too, such asthe factthatevenafterrecentfalls, there probably aren’ttoo many whowouldcall Wellington’smarket‘cheap’,and affordability pressurescould linger for some time."
Regionalresults
There weresome variedresultsacross‘provincialmarkets’in August,with Whanganui,Invercargill, andQueenstownall rising by atleast 0.5%.NelsonandRotoruaalsoedgedhigher, while NewPlymouthwasflat. However,marketssuchas Whangarei(-0.6%)andPalmerstonNorth (-0.7%)werenoticeably weaker.
MrDavidsonnotedthatwhile all areasacrossNZ face similar pressuresfrom keydriverssuchaselevatedlistingsand still-high (albeit falling) mortgagerates,local factorscan still play avery importantrole.
“Morefavourable affordability, with lowerpropertyvalues,is no doubtplayinginto someof the resilience in markets suchasWhanganuiandInvercargill. While very fewpeople wouldsaythe samefor Queenstown,it’sclearly gotits own benefits,suchasthe pull of tourismandthe appealto wealthy buyersfrom inside andoutsidethe area.”
NZ Hedonic Home Value Index
Propertymarketoutlook
Lookingahead,Mr Davidsonsuggestedthatwhilstjoblossesare tough to handle, weshouldn’tgetunduly pessimistic aboutthelabourmarket.Even so,it’sobviously still arestrainton housingactivity andvaluesat present,andthe debt to income (DTI) ratio capsare newthis time aroundtoo.
"Nobodyis expectingemploymentto absolutelycrash,so although arise in the joblessnumbersis neverpleasantand will also tendto dampen housesales andprices,furthersignificant falls maynotnecessarilyeventuate.”
“That said,a freshpropertyboom is notourcentralexpectation either.Onemajorchangefrom previouscyclesis that we nowhaveformal limits on DTIs, andalthough they’renotbinding yet,there will be ameaningfuleffectdownthe track,evenonce youaccountforthe 20% speedlimit andthe exemption fornew-buildproperties.”
“Ourballpark estimate is thatmortgage ratesofaround5.5% orless will be low enoughforthe impact ofthe DTI rules to becomemore noticeable in termsof keepingloan sizes lowerthan people might havebeen expecting.That mark couldbe reachedby mid-2025,or evensooner,”he concluded.
CoreLogic is the largest independent provider of property information, analytics and property-related risk management services in Australia and New Zealand. Methodology
The CoreLogicHedonicHome Value Index (HVI) is calculatedusinga hedonicregressionmethodologythat addressesthe issueofcompositionalbias associatedwith median price andothermeasures.In simple terms, the index is calculatedusingrecentsales datacombinedwith information aboutthe attributes ofindividual propertiessuchas the numberofbedroomsandbathrooms,landareaandgeographicalcontextofthe dwelling.By separatingeach propertyinto its variousformationalandlocational attributes,observedsales valuesfor eachpropertycan be distinguishedbetweenthoseattributedto the property’sattributesandthose resultingfrom changesin the underlyingresidentialproperty market.Additionally, by understandingthe value associatedwith eachattribute of agiven property,this methodologycan be usedto estimatethe value of dwellings with knowncharacteristicsfor whichthere is no recentsales price by observingthe characteristicsand sales pricesof otherdwellings whichhave recentlytransacted.It then follows thatchangesin the marketvalue ofthe entire residentialproperty stockcan be accuratelytrackedthrough time.
The detailed‘frequentlyaskedquestions’andmethodologicalinformation can be foundat: https://www.corelogic.co.nz/our-data/hedonic-index
CoreLogicis able to produceaconsistentlyaccurateandrobustHedonic Index due to its extensiveproperty relateddatabase,which includes transactiondataforeveryhome sale in everyregion andterritorial authority. CoreLogicaugmentsthis datawith recentsalesadvice from real estateindustryprofessionals,listings information andattribute data collectedfrom avariety ofsources.
The resultscan be shownin index form andas a median dollar value.The median value is the middle estimated value ofall residential propertiesderivedthroughthe hedonic regressionmethodologythatunderlies the CoreLogicHedonic HomeValue Index.
Increased activity by property seekers indicates a boost in buyer confidence after the OCR announcement and falling interest rates.
The OCR dropped during August for the first time in four years, and new data from realestate.co.nz indicates that the market is already responding. In the 14 days immediately following the OCR announcement, there was a noticeable uptick in buyer activity compared to the two weeks prior. During this period, residential listing enquiries increased by 8.5%, the number of saved properties rose by 5.5%, and 6.2% more people saved a search so they would be notified about listings.
• August marks a return to seasonal listing trends as vendor confidence grows
• Stock levels soften, hinting at a market shift
• Average asking prices vary regionally, but Southland hits a new peak price
Sarah Wood, CEO of realestate.co.nz, suggests people have been waiting for the right moment to act:
“Kiwis have a love affair with property, and while economic factors can sometimes dampen that enthusiasm, it never truly fades. We’ve heard that people have been waiting in the wings, and our data supports that.”
Wood adds that now is an opportune time to transact, with healthy stock levels starting to soften, potentially signalling market movement:
"Those selling can capitalise on increased buyer interest, while those looking to buy still have plenty of choice. Both buyers and sellers can benefit from the relative stability in prices.”
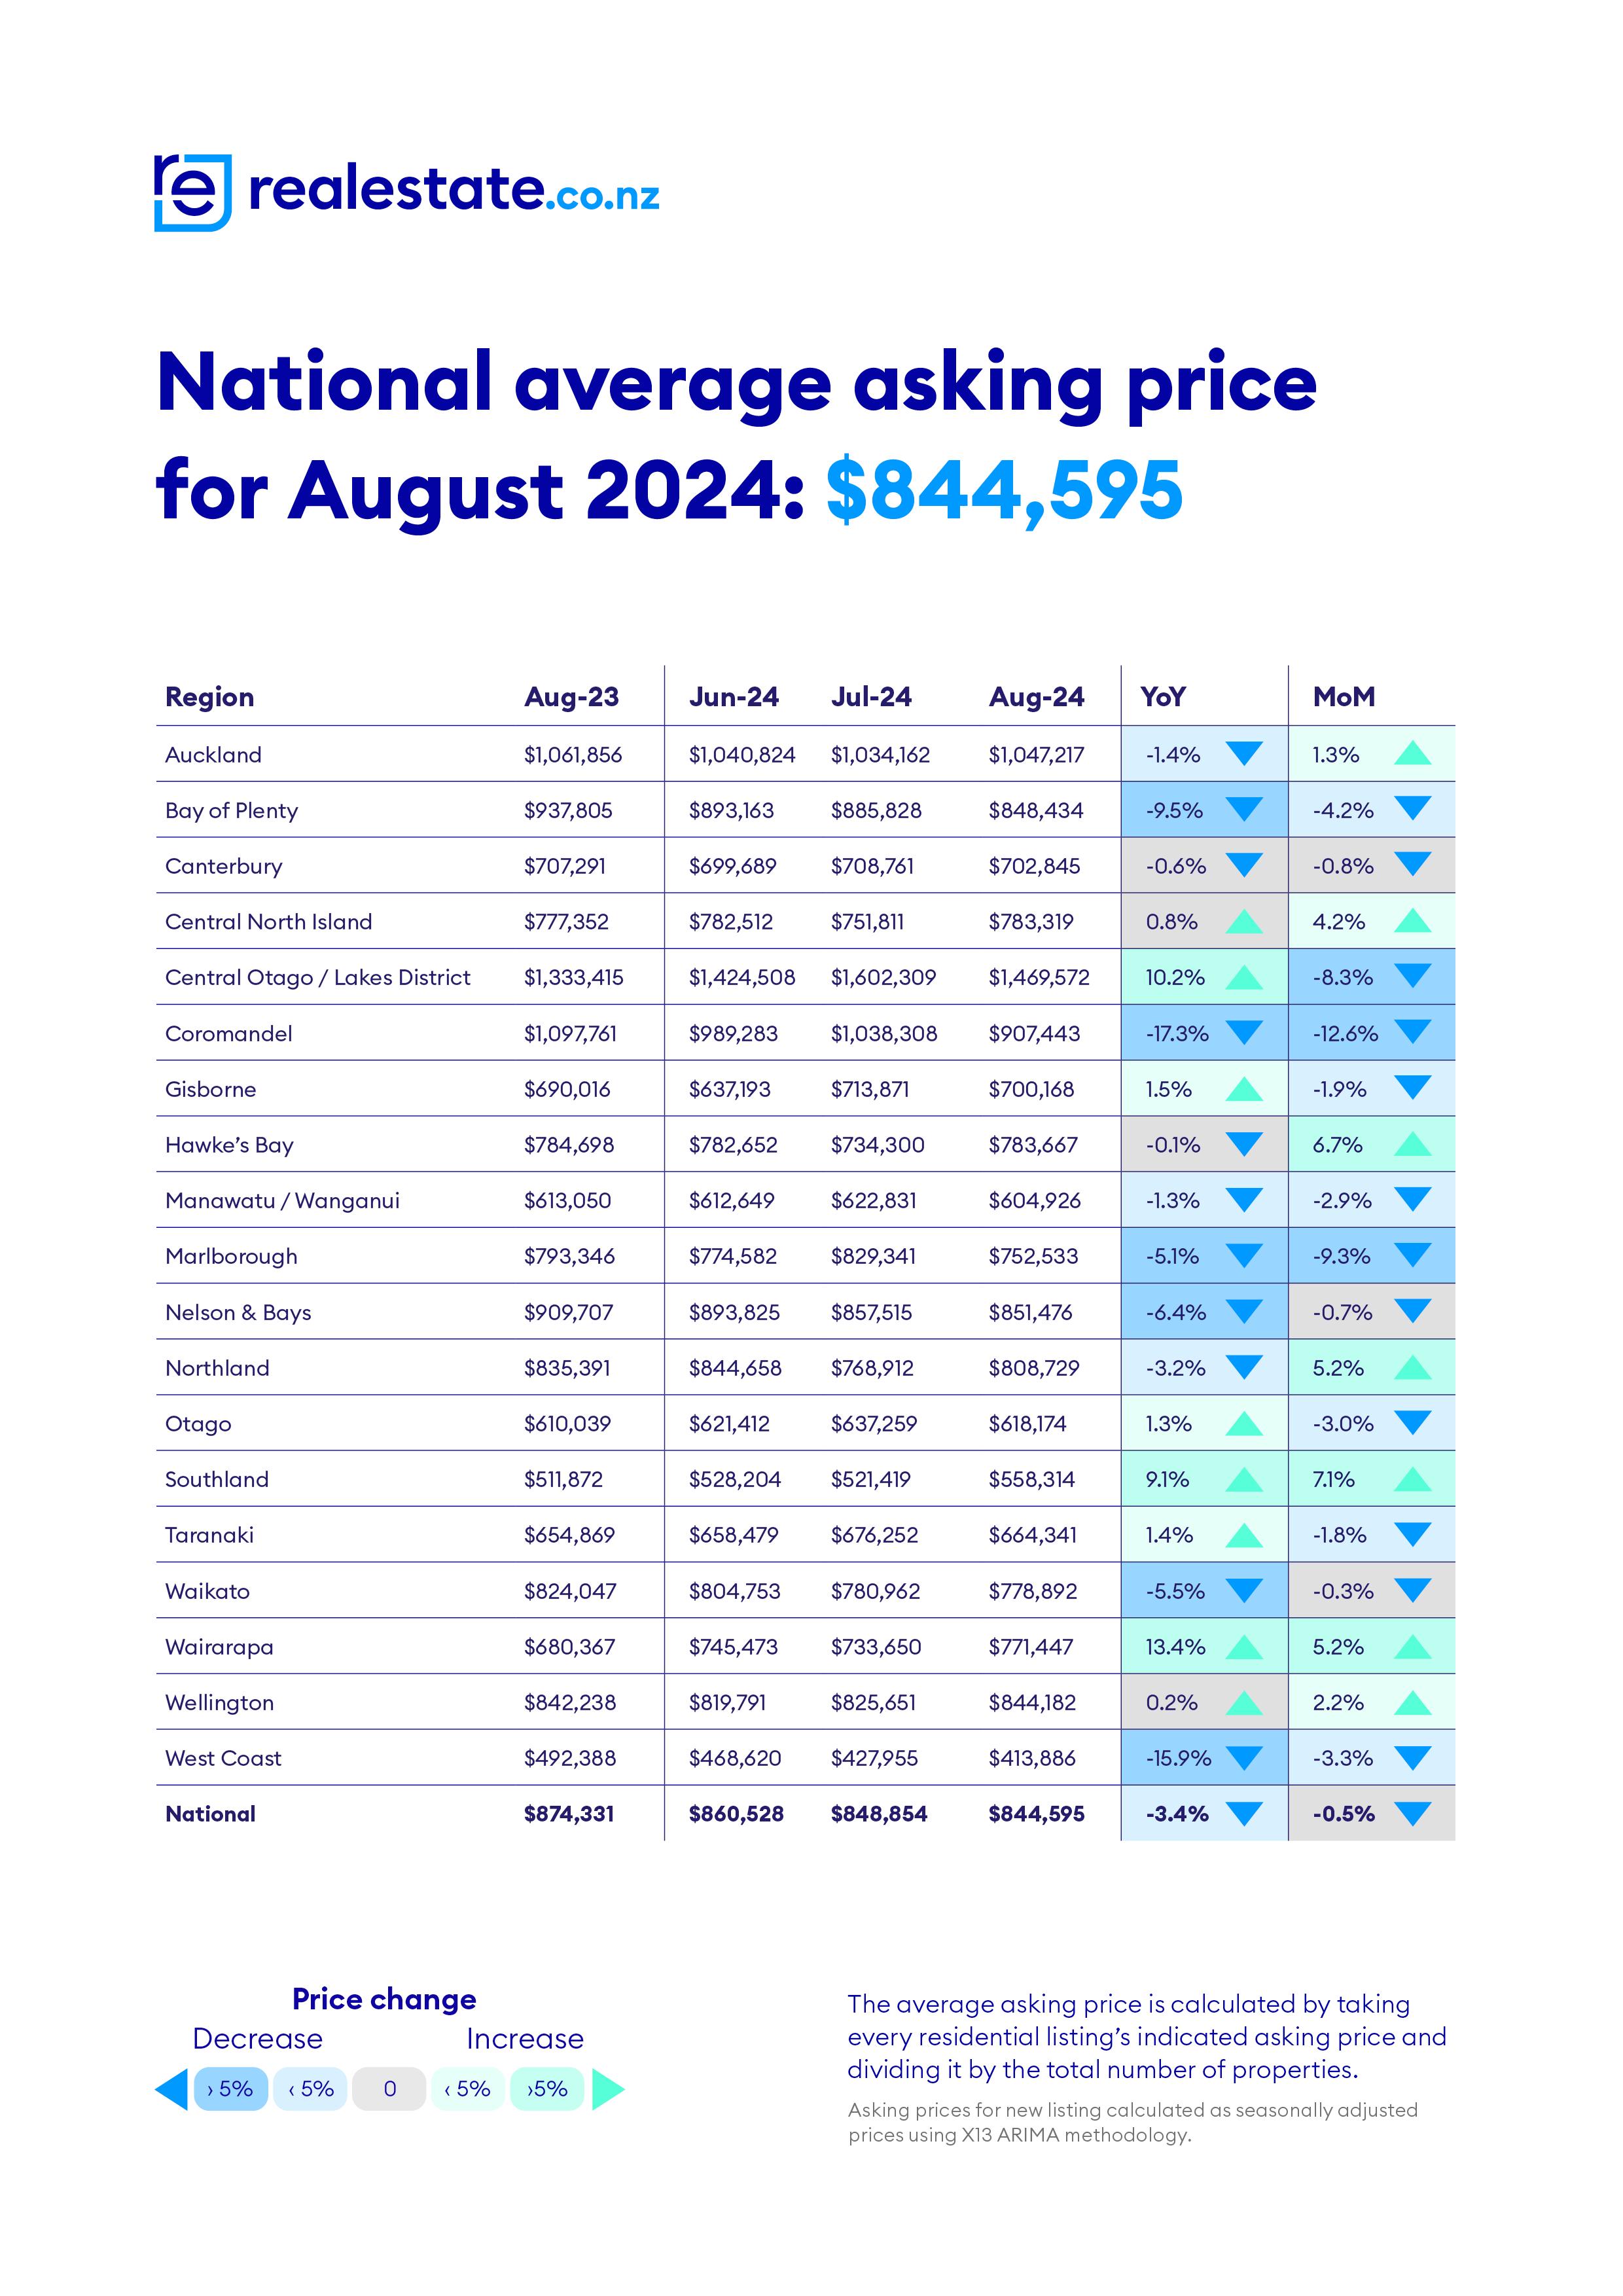
The national average asking price dipped to $844,595 in August, the lowest in three and a half years. However, this is only a 0.5% decrease from July and a 3.4% decrease from August 2023.
“This is not a significant dip. Prices remain stable around the mid $800,000 mark, continuing the flat trend observed over the past 18 months,” adds Wood.
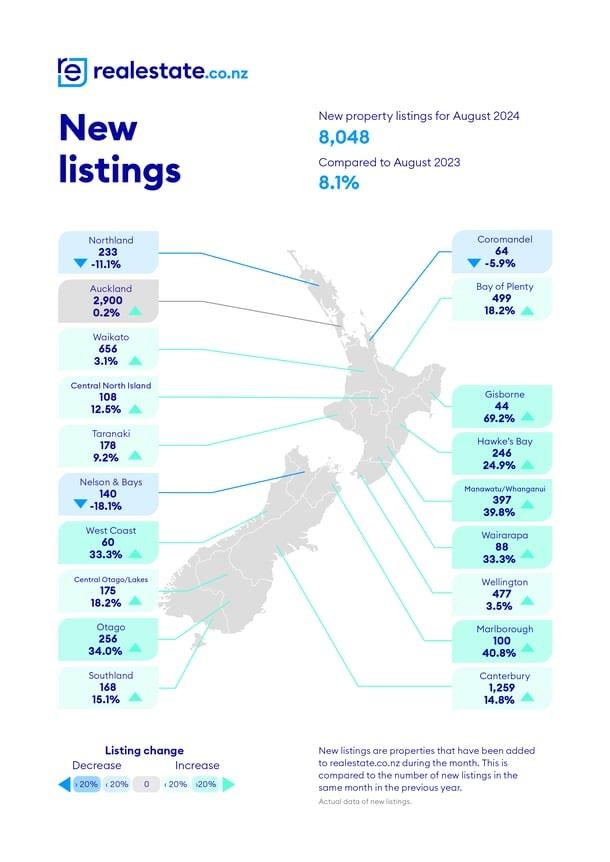
August marks a return to seasonal listing trends as vendor confidence grows
New listings increased by 8.1% year-on-year in August, which reflects a trend that we'd normally expect at this time of year. “Historically, the market has seen a steady rise in new listings during August, but this pattern has been notably absent since 2020. The return of this seasonal trend could indicate that we are entering a new phase of the cycle,” explains Wood.
In August, 16 of 19 regions saw an increase in new listings. Only Nelson & Bays, Northland, and Coromandel bucked the trend, with decreases of 18.1%, 11.1%, and 5.9%, respectively.
“The rise in new listings suggests that vendors view this as a favourable time to sell, likely in response to a more positive sentiment in the market and increased buyer activity,” says Wood
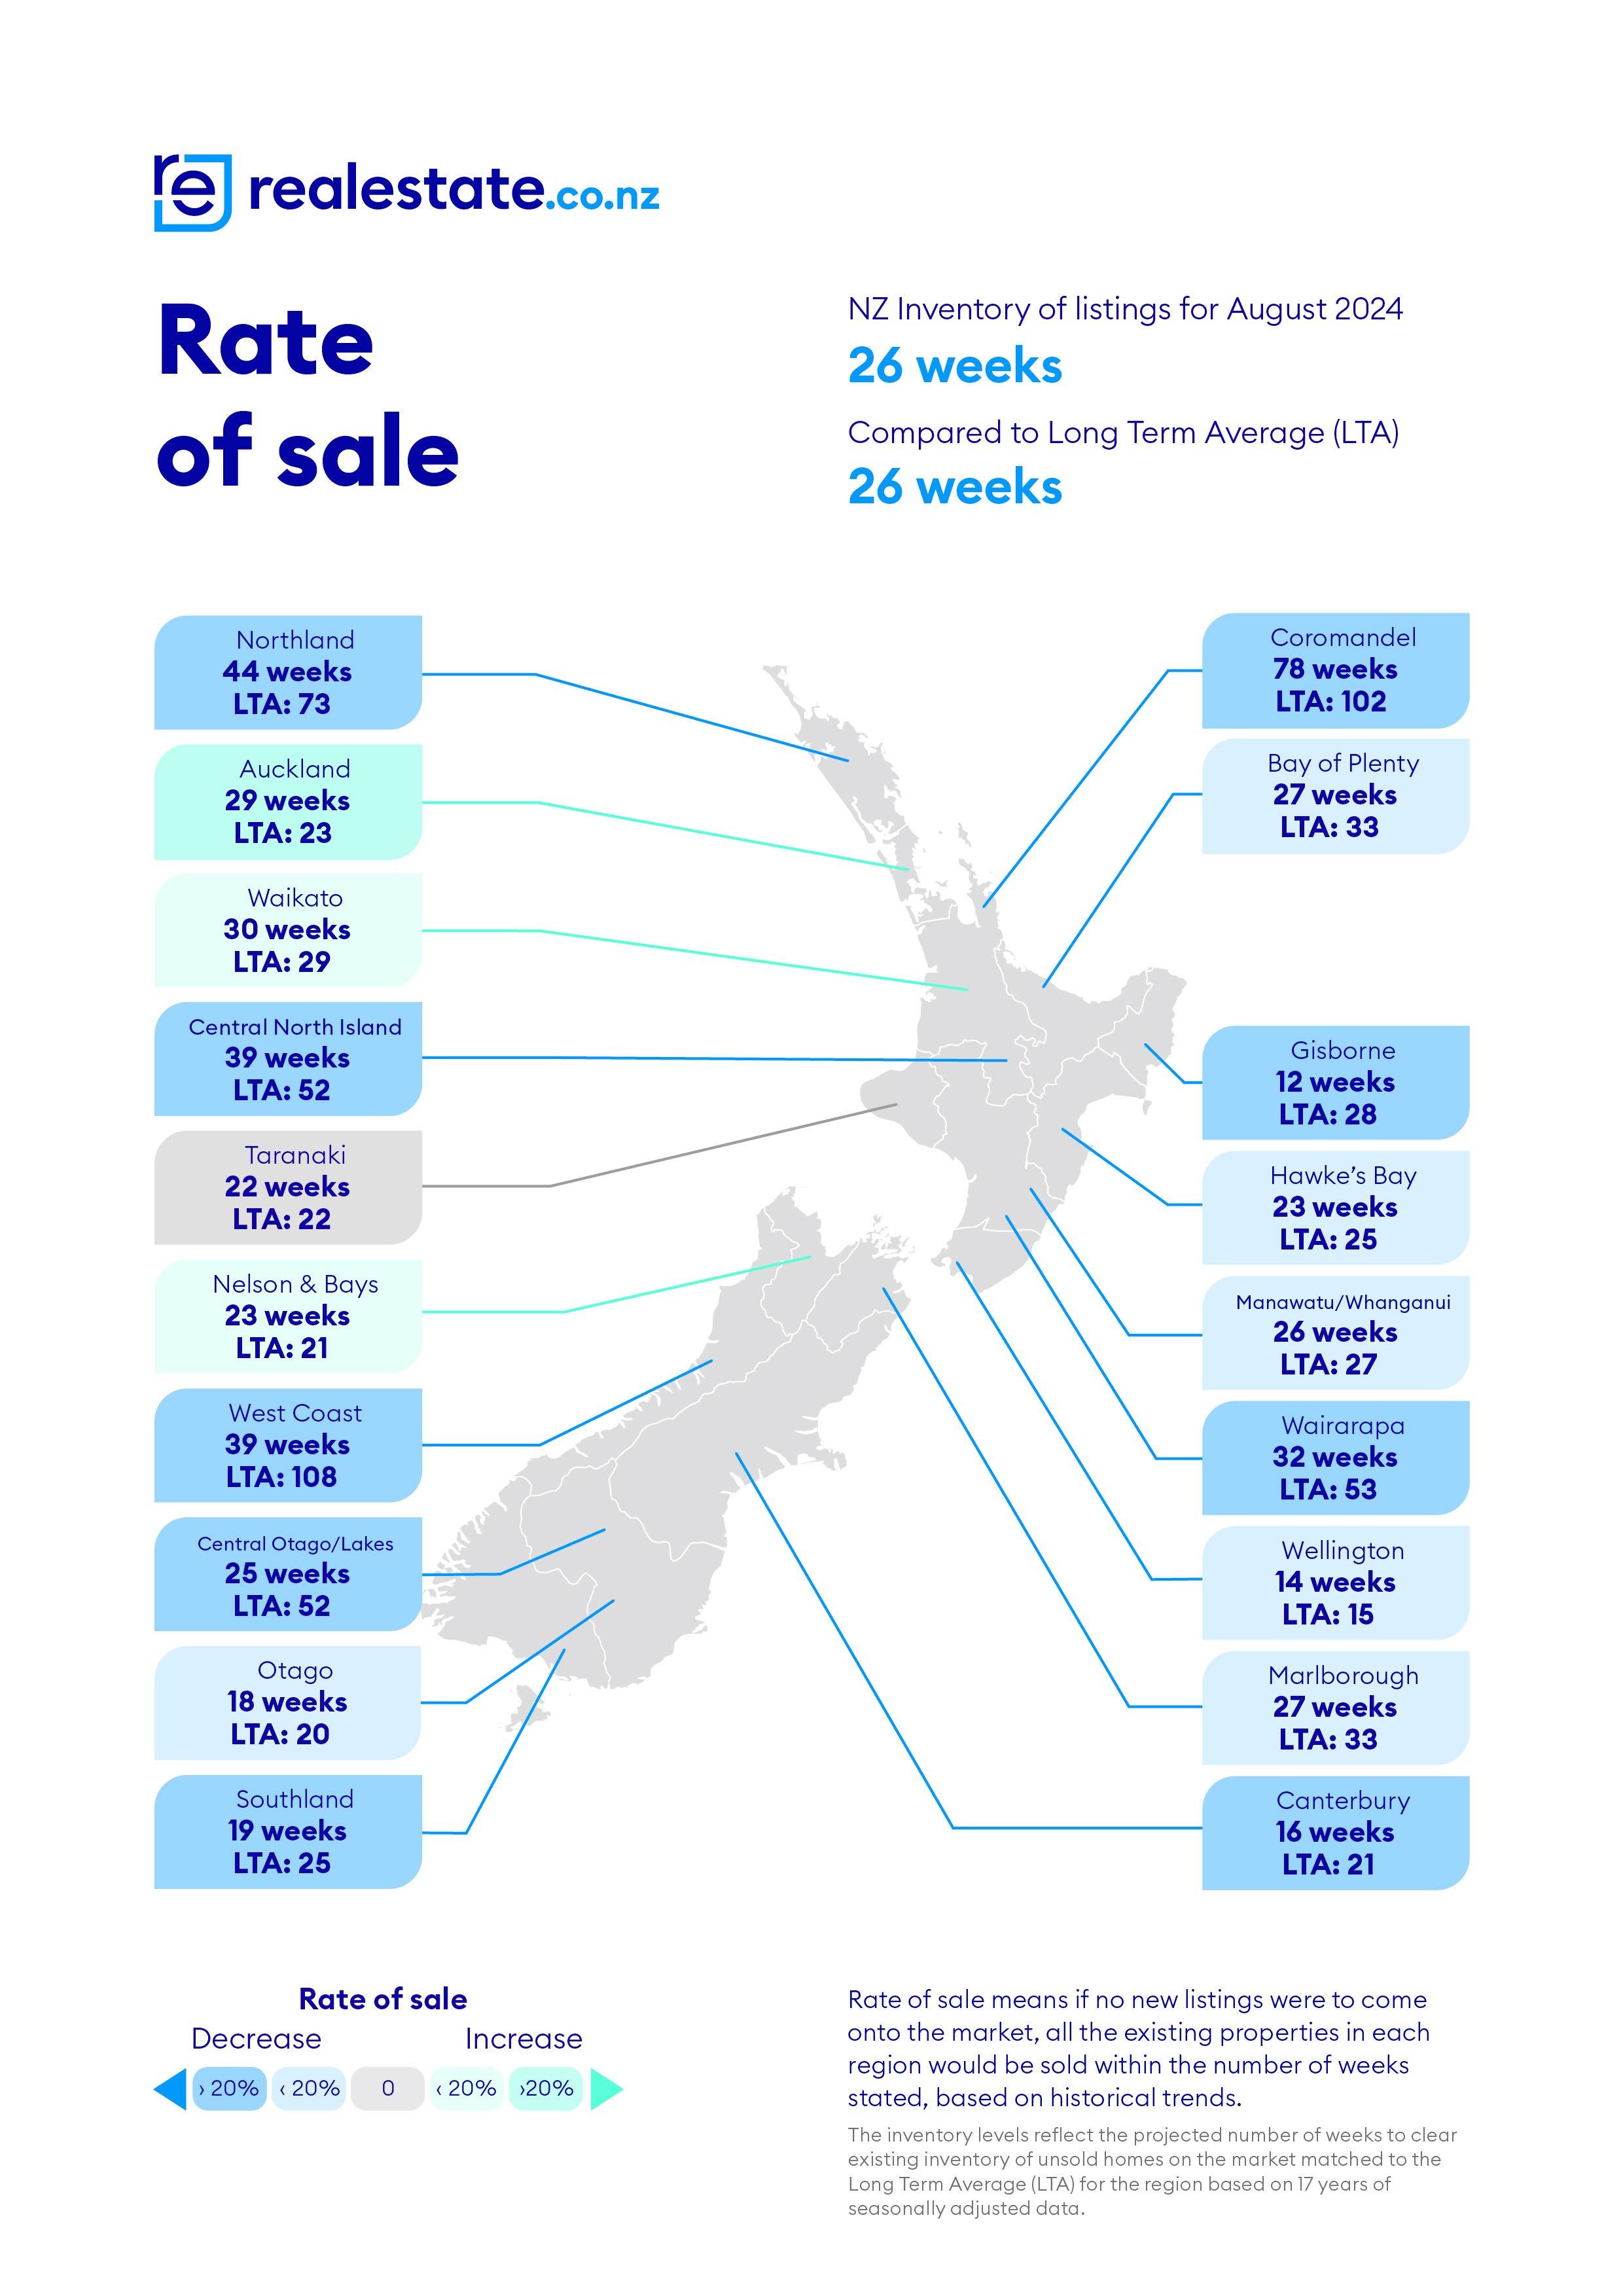
Stock levels soften, hinting at a market shift
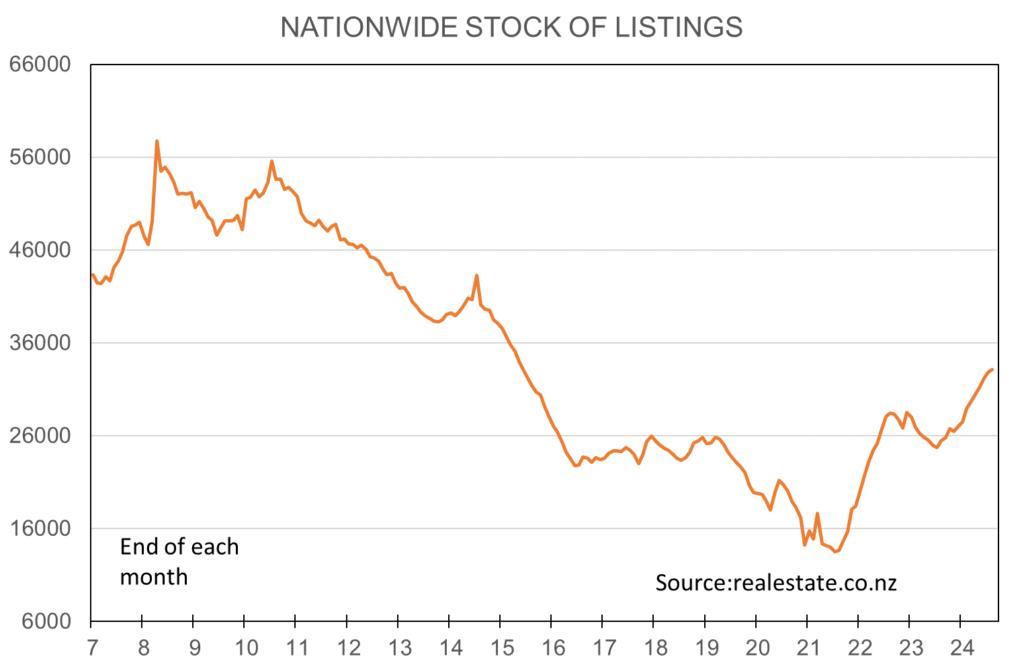
Reflecting the increase in new listings, stock nationally was up 30.0% year-on-year in August. However, stock levels dipped below 30,000 homes for the first time in six months.
“This slight softening in stock levels could signal increased market activity, as declining interest rates and the OCR announcement boost buyer confidence,” says Wood.
The number of listings on the site for less than 30 days also rose by 11.6% compared to July, suggesting that properties are moving through the market more quickly
Wood notes that while there’s still plenty of stock available to keep the market steady for now, these could be early signs of a shift ahead.
Last month, 18 of 19 regions saw double-digit stock growth year-on-year, with the Bay of Plenty as the only exception, where stock remained flat, increasing by just 0.7%.
Average asking prices vary regionally, but Southland hits new price peak
In August, the national average asking price declined slightly, dropping 0.5% month-on-month and 3.4% year-onyear. While this continues a trend of flat asking prices, this figure marks the lowest we’ve seen our nation’s prices in 3.5 years. Southland defied this trend by surpassing the $550,000 mark for the first time since records began, reaching a 17-year high of $558,314.
Southland was one of only two regions to experience growth both month-on-month (up 7.1%) and year-on-year (up 9.1%). The other region was Wairarapa, which saw a 5.2% increase compared to July and a 14.4% rise on the same time last year
In contrast, Bay of Plenty, Coromandel, Manawatu/Whanganui, Marlborough, and West Coast all saw their average asking prices decline month-on-month and year-on-year.
Auckland saw a slight increase in its average asking price, month-on-month, for the first time since April. This could signal a shift in market dynamics for the City of Sails, but Wood warns it is too early to say for sure: “Every region is unique, so it’s crucial to research the area you’re buying or selling in
Written by Liz Studholme
02 Sep 2024
Town&Country
Finance & Lending
19 September 2024
Input to your Strategy for Adapting to Challenges House prices bottoming out
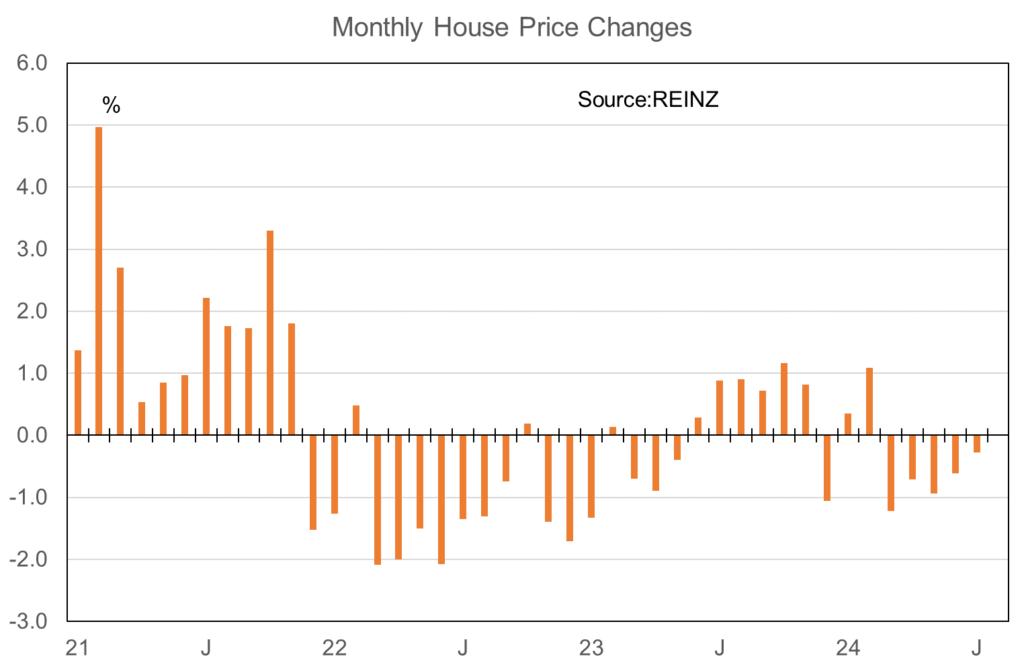
This week REINZ released their monthly data. One of the main things we can see from their numbers is that the pace with which prices are falling on average around the country has slowed and may even have stopped.
In August their nationwide House Price Index was unchanged from July after falling 0.3% in July, 0.6% in June, and 0.9% in May. The graph here shows the waning strength of the monthly decline towards the far right.
At this stage, given the strong rises in most of the measures gathered in my surveys of real estate agents and mortgage brokers I expect average prices to start consistently rising each month very shortly. Are they already in fact trending up anywhere?
It’s no good doing my usual calculation of the most recent three months versus the previous three months as the big declines 2-3 months ago cover up the more recent improvement. That calculation shows a three month nationwide decline of 1.7% from 1.2% in the three months to May.
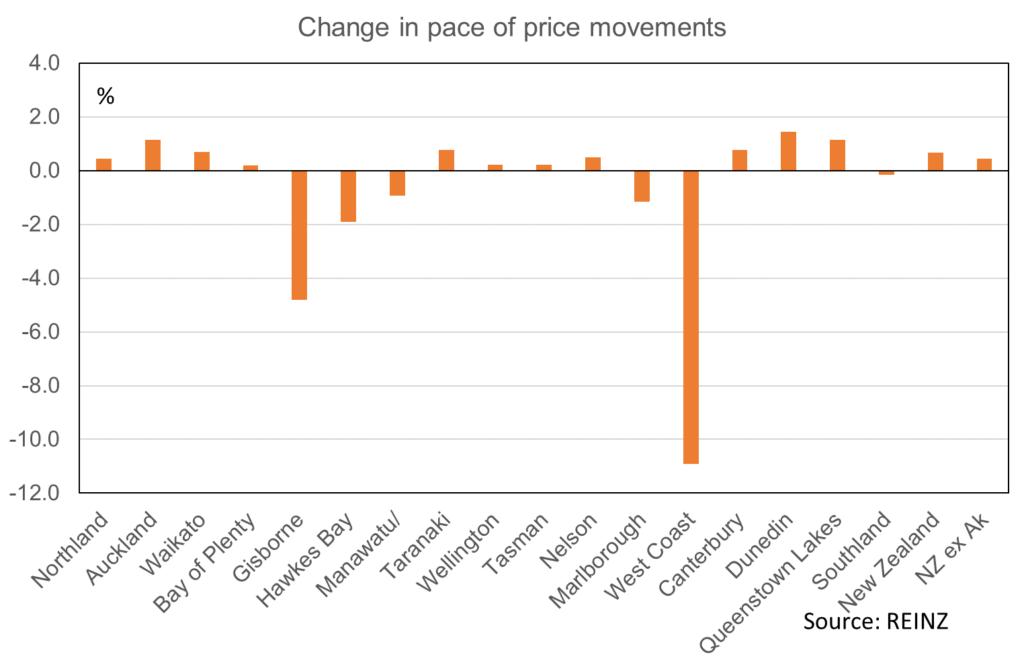
But if we just average the monthly change in the past three months we get -0.3% versus -1% in the three months to May and that seems to be the best way to see what is happening right at this moment.
This following graph shows the difference between these calculations and nationwide for instance gives an observation of +0.7% being the -0.3% less the -1.0%. The positive orange column means price movements are improving nationwide.
We can see that things are improving in Northland, Auckland, Waikato and Bay of Plenty, but still getting worse in Gisborne, Hawke’s Bay, and Manawatu-Wanganui. We also see improvement in Taranaki, Wellington, Nelson, Tasman, Canterbury, Dunedin City, and Queenstown Lakes. But there is still a worsening of price changes in Marlborough, West Coast, and slightly in Southland.
We are at a turning point in the house price cycle and one thing we all have learned from past cycles is that not all regions turn at the same time. So I make no extrapolation from the graph into what prices are likely to do for the coming year let alone the cycle overall. All we can see is where opportunities for buyers seeking a market still in their pricing favour may lie and where buyers may need to be more willing to meet improving vendor price expectations.
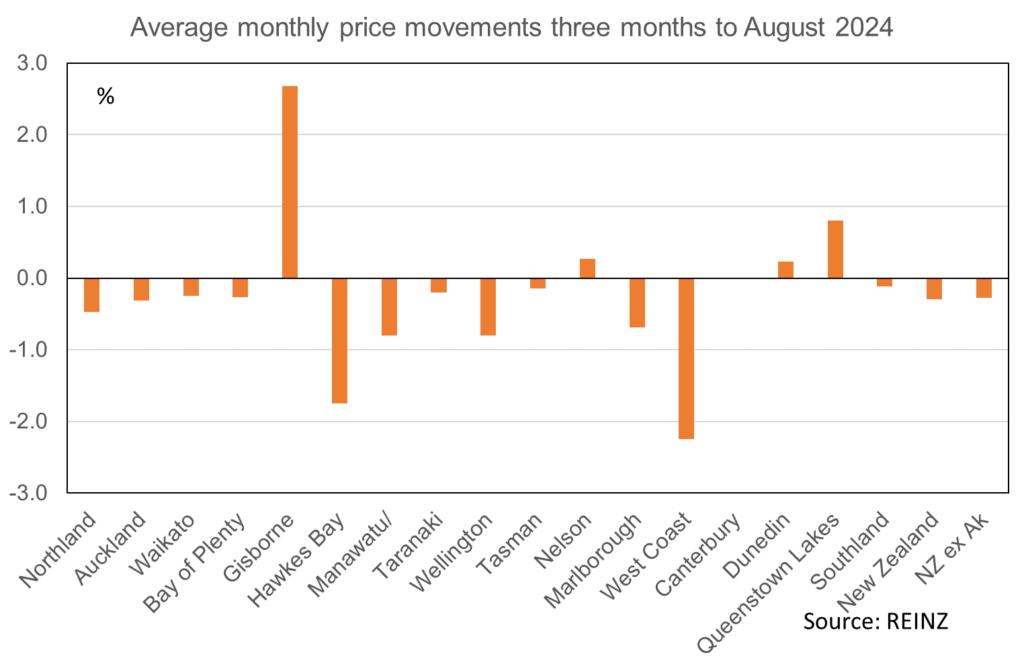
For completeness, this graph shows average monthly house price changes for the three months to August.
Because I am interested in the turning of the price cycle I see little point in discussing how prices compare with a year ago. That tells us about the past year as a whole and not what has been happening since interest rate confidence improved which is what we’re all mainly interested in now.
With regard to that confidence element, as noted here in recent week’s the upticks in sentiment measures since interest rate worries shifted have been quite severe.
For instance, the net proportion of people planning to raise their spending levels in the next 3-6 months has gone from -42% three months ago to -13% now. Last year exactly the same shift to reduced pessimism happened, but it took seven months.
The ANZ’s monthly Business Outlook Survey has recorded a two-month surge in confidence about the economy over the coming year to a net 51% positive from just 6%.
The many measures I glean from my monthly survey of real estate agents have also soared. But these focus on what agents are seeing rather than just what they or the buyers are feeling. In that regard I feel there is a solidity to the real estate market recovery which is not necessarily apparent in the rest of the economy as yet.
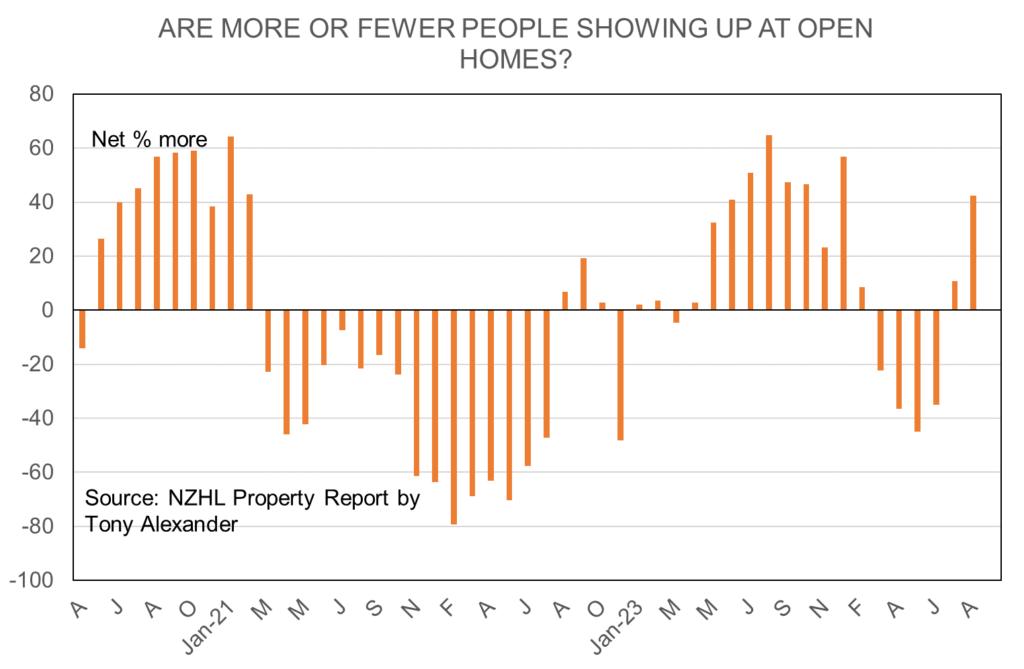
For instance, a net 42% of agents say that they are seeing more people attending open homes and a net 12% say more people are at auctions. Two months ago these readings were -35% and -37% respectively.
But before anyone over-extrapolates this surging buyer interest into newly soaring prices, it pays to remember what happened when the market turned for the better last year. Sellers eventually appeared in droves.
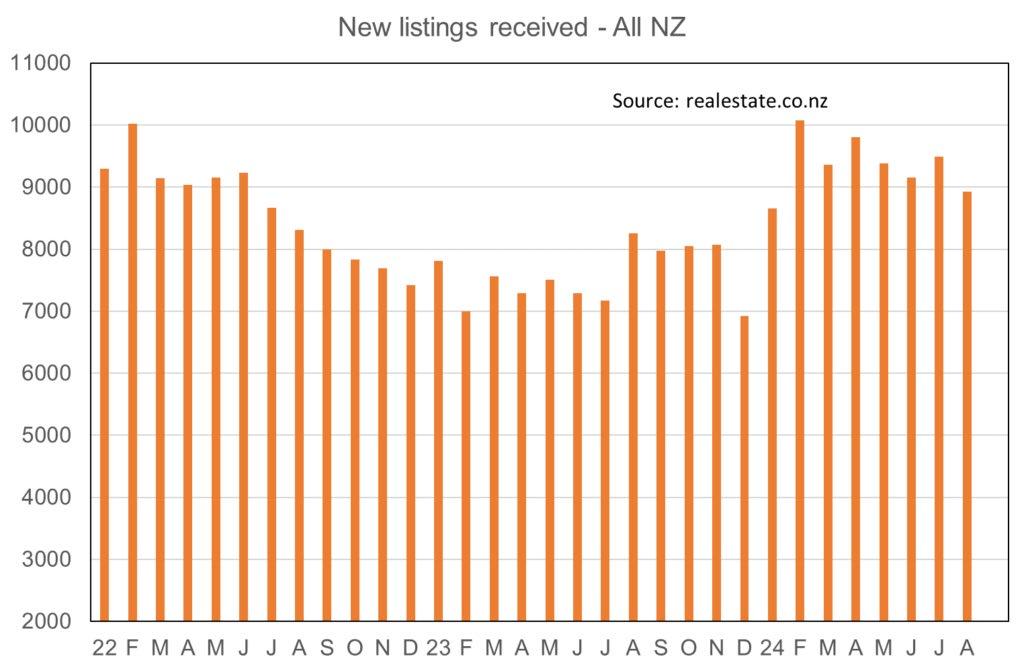
In January and February this year the number of fresh property listings received by agents around the country soared in seasonally adjusted terms by 25% and 16% respectively.
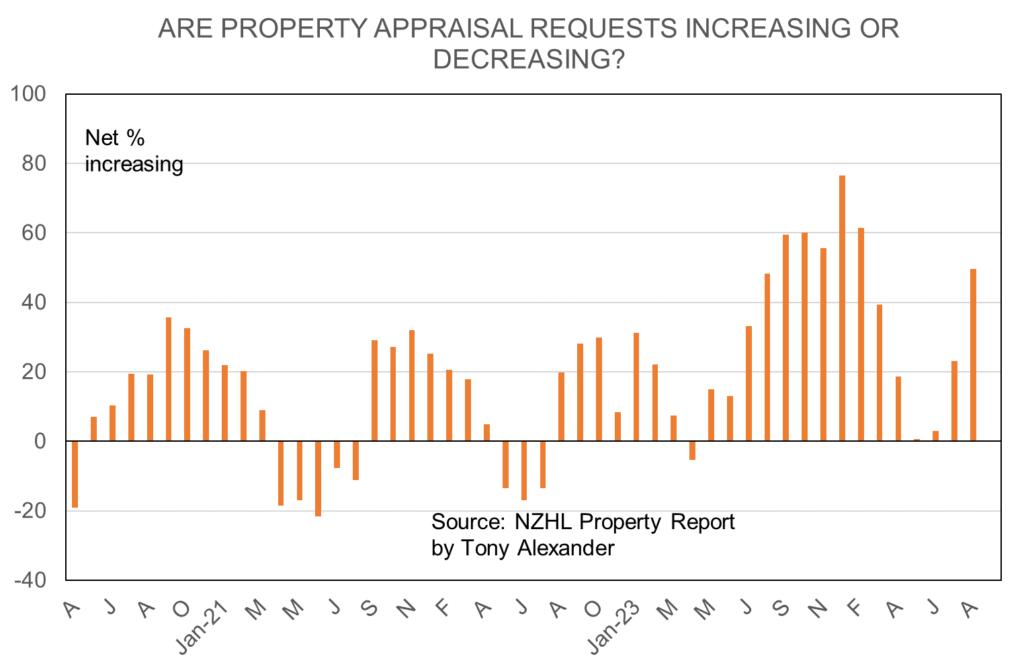
From my real estate agent survey with NZHL a net 50% of agents from just 3% two months ago say that they are receiving more requests for property appraisals.
So, both demand and supply are rising at the same time. And it pays to remember that the stock of listings is about 30% higher than a year ago and at the highest level since 2015.
Also, keep in mind that compared with previous housing cycles this one is characterised by a structurally higher level of house construction. Going into the GFC annual dwelling consent numbers nationwide were about 27,000. They fell to 13,500 come 2011 which was the lowest total since the 1960s. This time around numbers have gone from 51,000 a couple of years ago to 34,000 and will probably bottom out near 30,000 driven mainly by falling consents for townhouses. If I recall rightly Treasury assumed 32,000 in the May Budget.
Also, note that net migration flows are falling away rapidly. However that these flows are impossible to accurately forecast so a year from now we could just as easily be surprised by a still high net inflow as a big negative one.
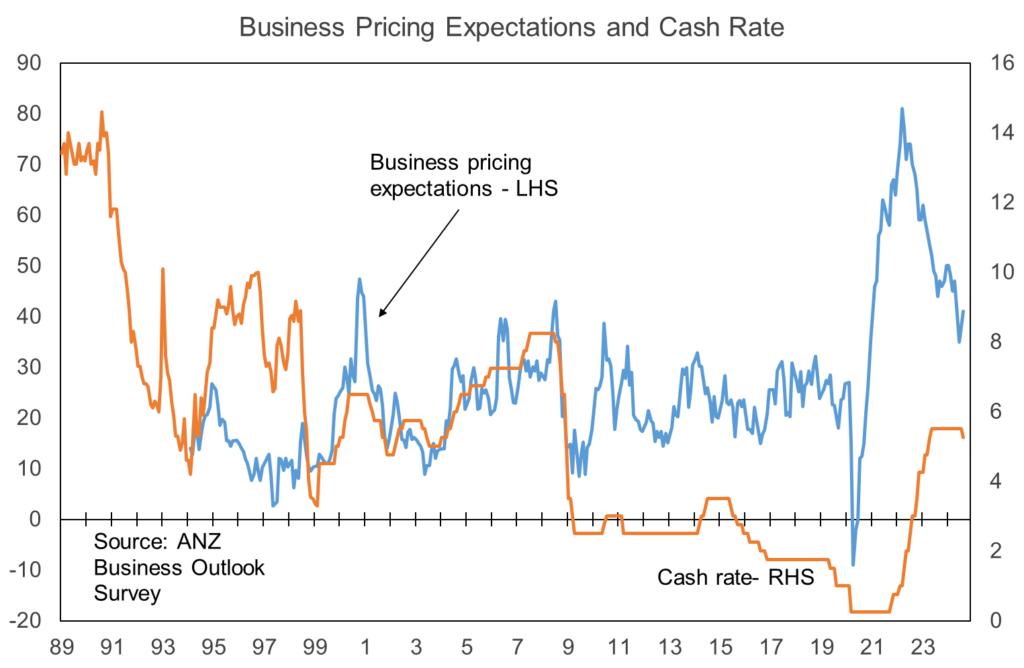
Finally, watch out for excessive optimism about where mortgage rates are headed. Falls are underway with more to come. But I remain concerned that business pricing plans are still much too high.
A net 42% of businesses still say they plan raising their prices in the coming year whereas the average level consistent with 2.3% inflation for the past three decades has been 26%.
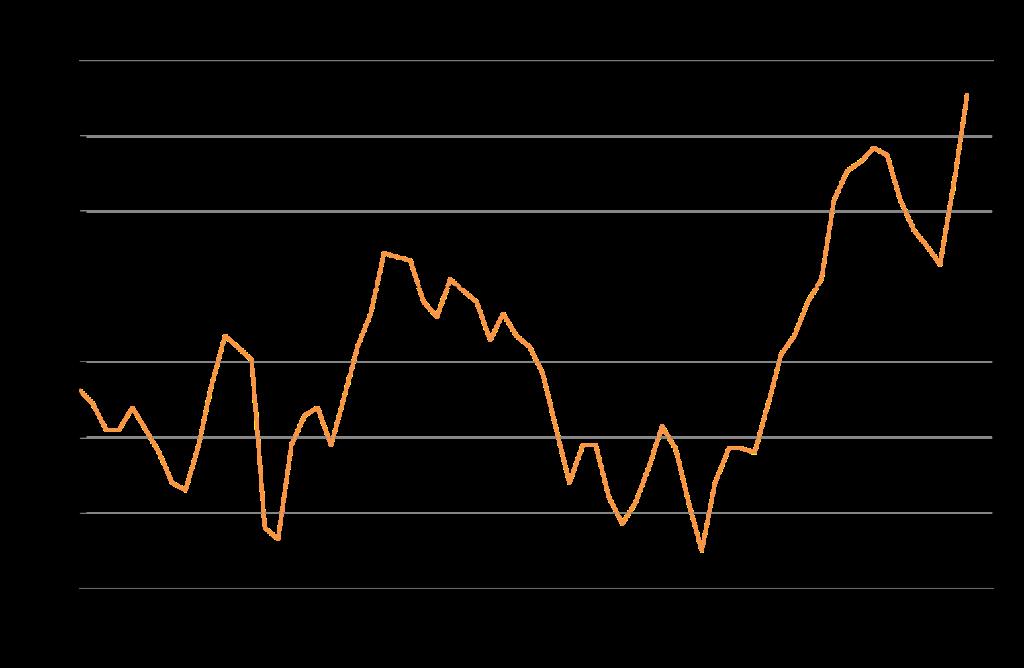
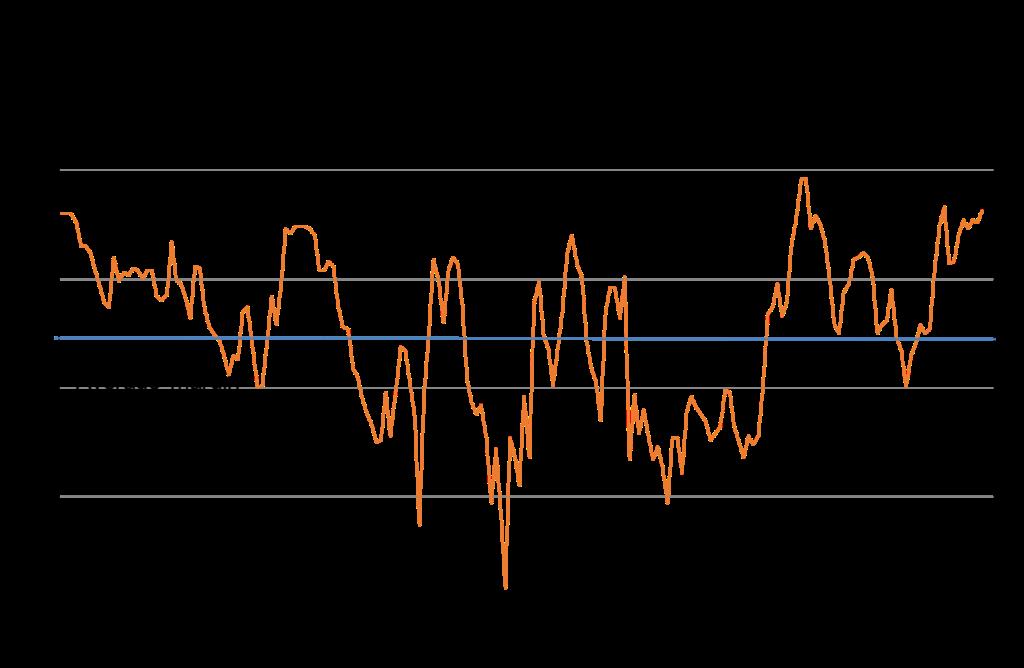
This next graph shows the cash rate level as the orange line and the pricing intentions measure as the blue line. If these expectations go back to average then the experience since the GFC ended would suggest a cash rate near 3% is a perfectly reasonable expectation.
However, the post-GFC global environment was one of inflation failing to spark as expected, resulting eventually in deflation concerns come 2019 which encouraged the Reserve Bank to cut the cash rate to 1%. This was lower than the GFC’s 2.5% level despite firm economic growth and a near 4% unemployment rate.
Are we still in such a deflation-risk environment? If you feel the answer is yes then expecting the cash rate to fall potentially below 3% while the pace of economic growth in NZ accelerates is not an unreasonable expectation.
But if you feel the deflation risk is removed by factors such as
• climate change costs,
• supply chain difficulties,
• rising central and local government charges,
• reduced money printing (perverse but it seems to work that way), and
• lower productivity growth,
then a sub-3% OCR seems like a brave call without recession returning.
If I were a borrower, what would I do?
Wholesale interest rates have decreased by amounts less than 0.1% this week, mainly in response to lower rates in the United States as expectations grew of the Federal Reserve commencing their easing cycle with a big bang 0.5% rate cut rather than the previously expected 0.25%.
In the event, last night they did cut the rate by 0.5% with their focus seeming to have shifted a lot towards concerns about the weak labour market and meeting their dual mandate of low inflation and firm employment.
The NZ one-year swap rate which forms a base from which banks add other costs and a margin to get their one year fixed mortgage rates fell to around 4.17% from 4.25% last week and 5.25% at the start of this year.
The three year swap rate has edged down to near 3.48% from 3.53% last week and 4.3% at the start of the year.
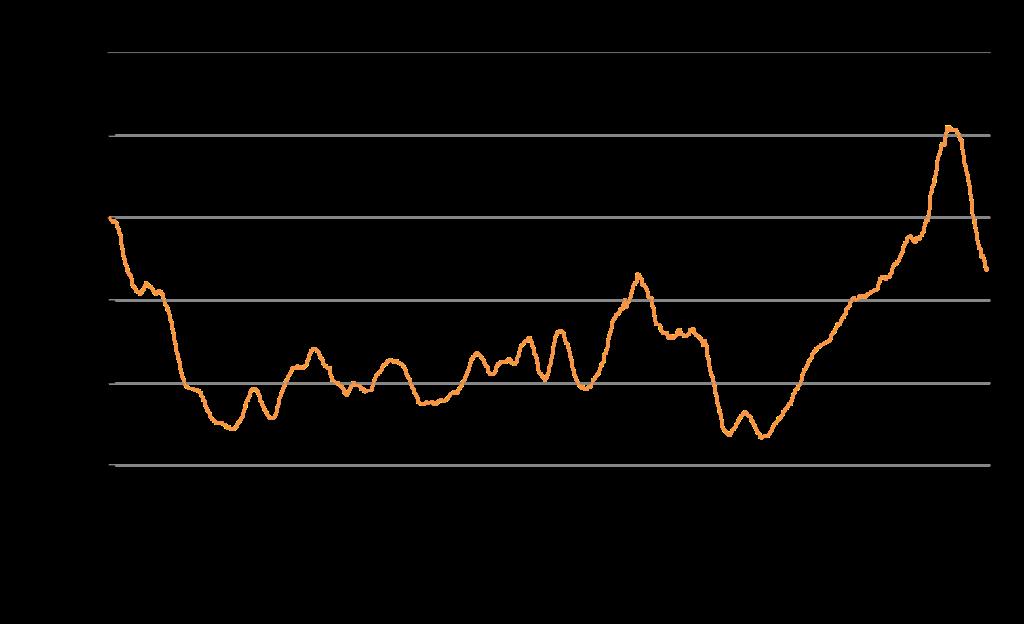
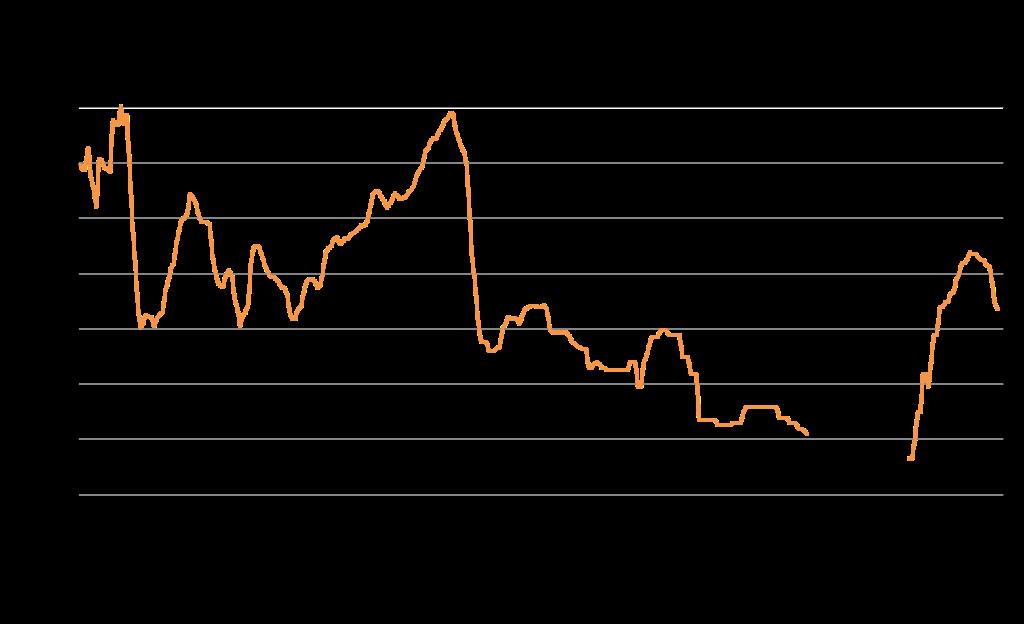
This graph shows the three year swap rate from 1995. Ignore the observations before the GFC as there was a structural decline in interest rates around that time. I have also blotted out 2019-21 because rates then were unusually low due to worries about deflation and then the pandemic.
What we get left with is the current three year swap rate of about 3.5% sitting above the average since 2009 of 3.4%. I reckon it is reasonable to expect another 1% decline based on the 2009-18 experience.
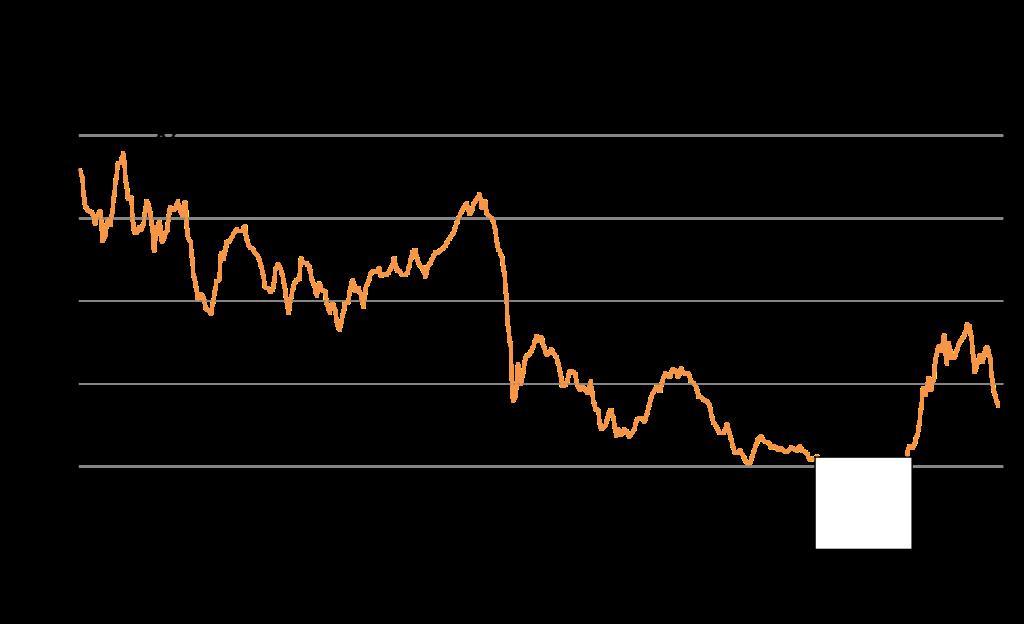
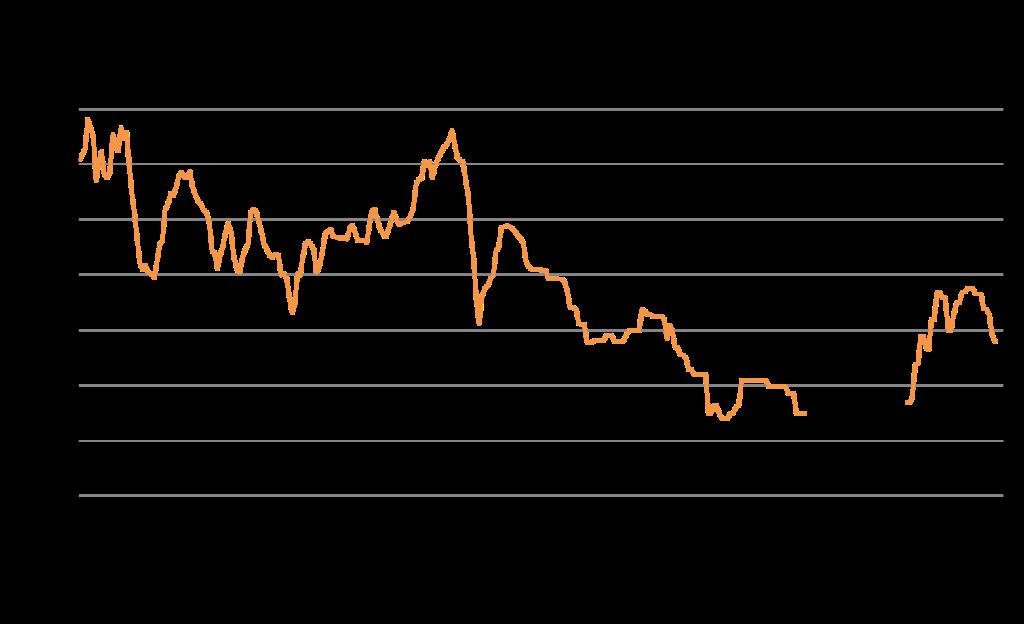
This graph shows the roughly calculated margin on three year fixed rate mortgage lending being earned by banks in NZ. There is scope for this and all other term fixed rates to decline without any further decline in wholesale borrowing costs.
Note however that this visual calculation does not include all mortgage lending costs and especially not the upwardly trending ones in recent years of extra capital requirements, extra investment needed in technology etc. The graph can simply serve as a broad guide and we cannot know for instance when one bank will blink and cut their rates firmly to achieve market share growth.
Based on experiences of recent years it is likely their cutting will initial be out of the limelight and this seems to be the case currently for some discounted 18 month rates being made available to customers.
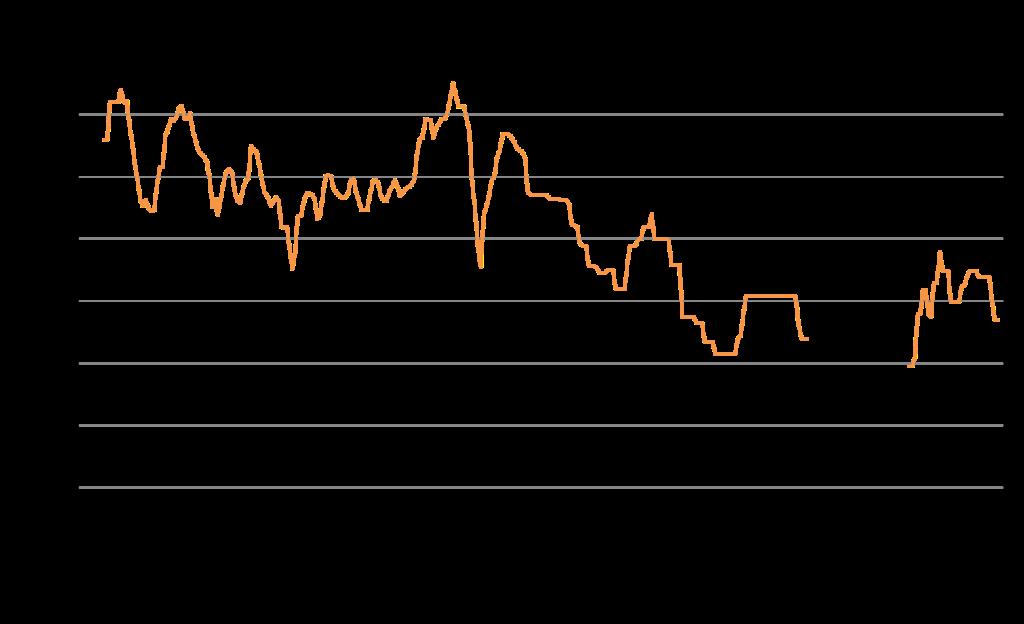
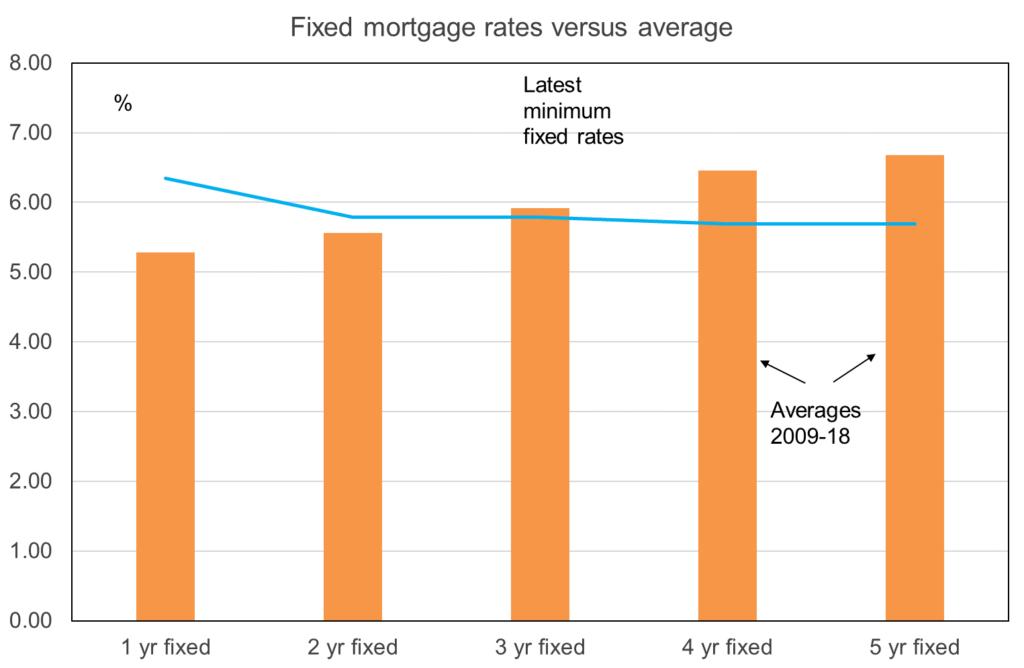
These three graphs show levels of the one, three, and five year fixed mortgage rates over the past few years excluding the 2019-21 period when rates were absurdly low because of worries about deflation and then the effects of the pandemic.
This graph shows how current rates compare with averages from 2009-19.
Nothing I write here or anywhere else in this publication is intended to be personal advice. You should discuss your financing options with a professional.
Sign up for free at www.tonyalexander.nz
Town&Country
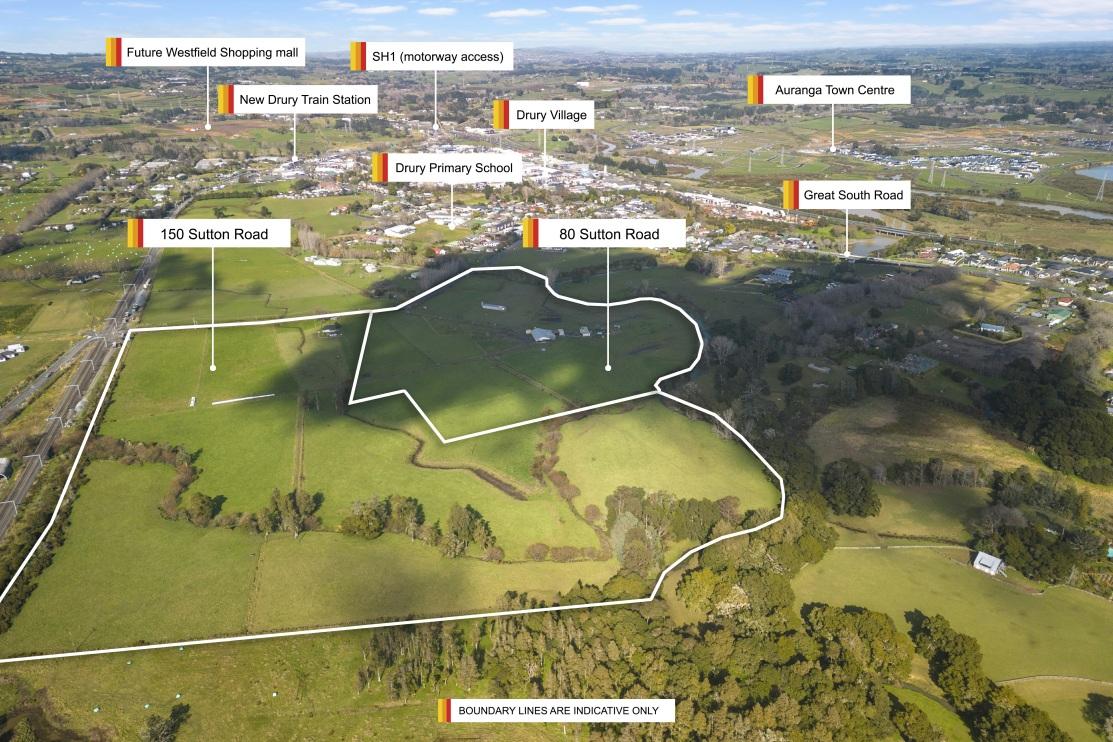
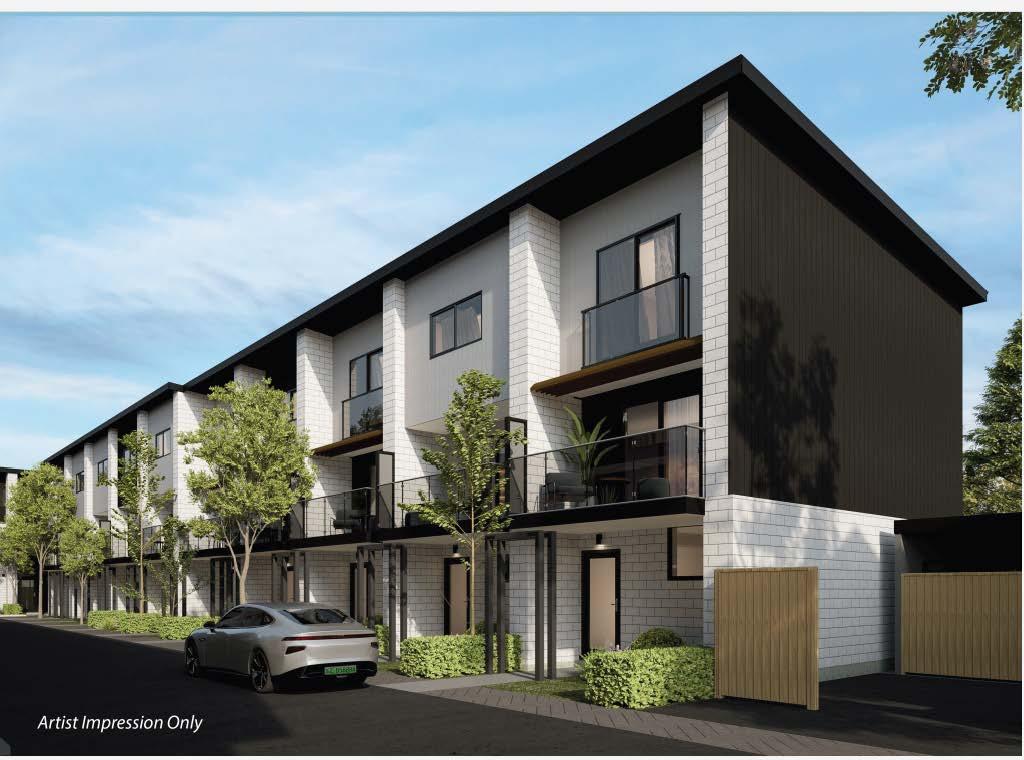
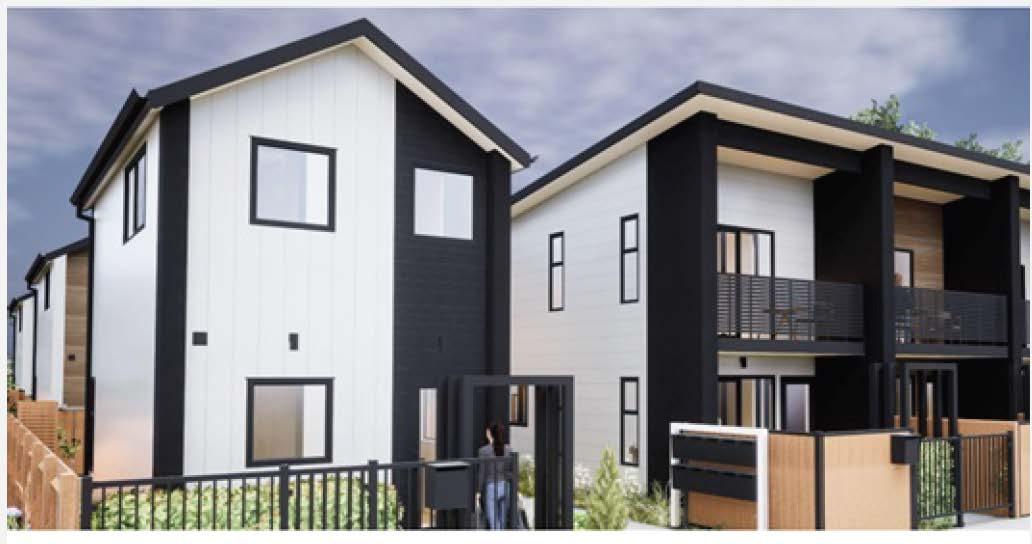
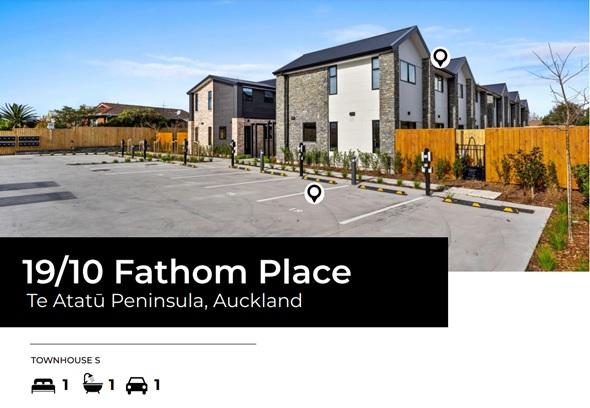
Properties
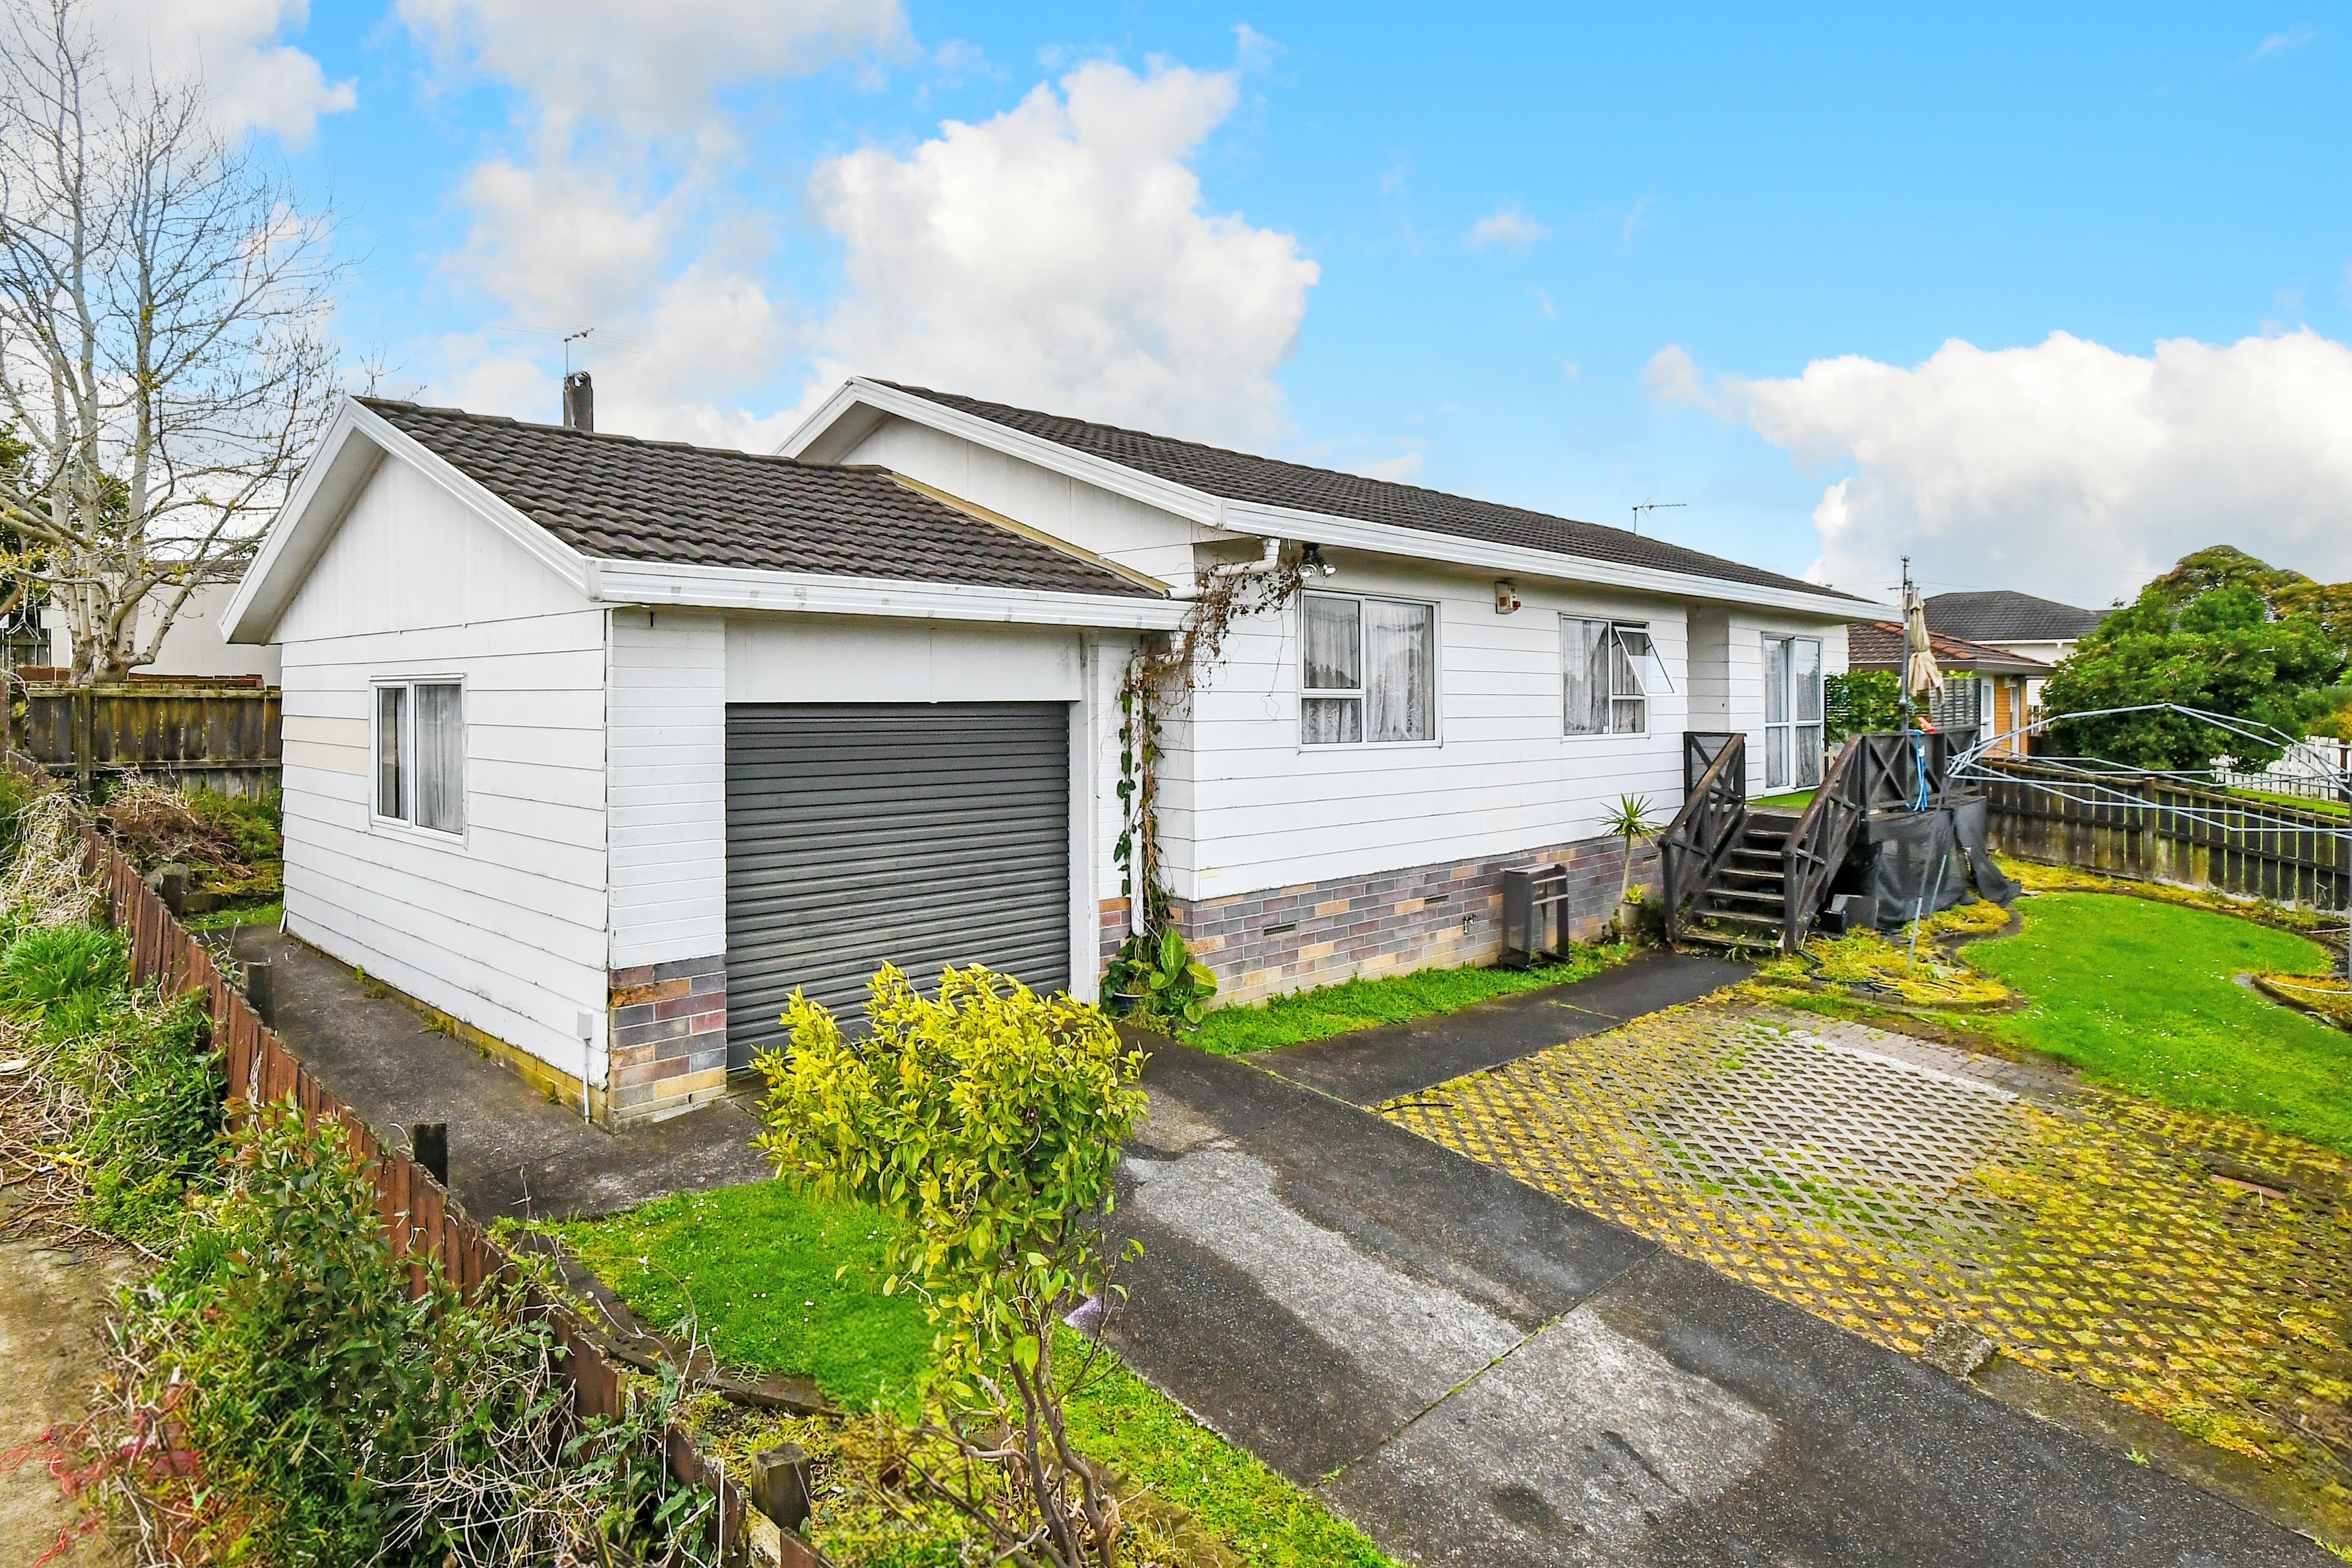
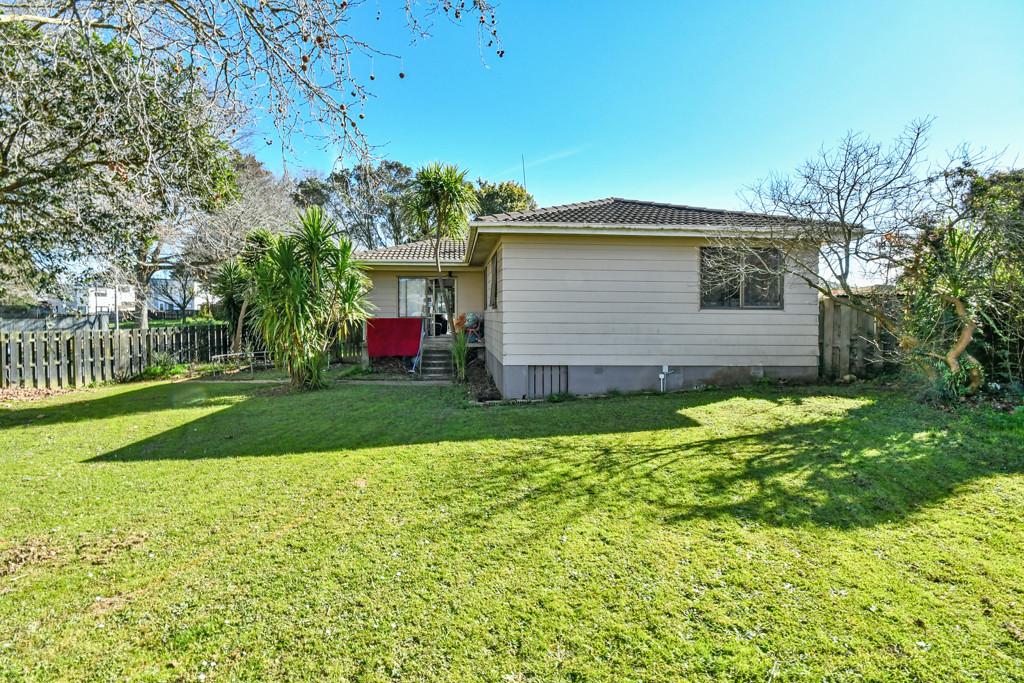
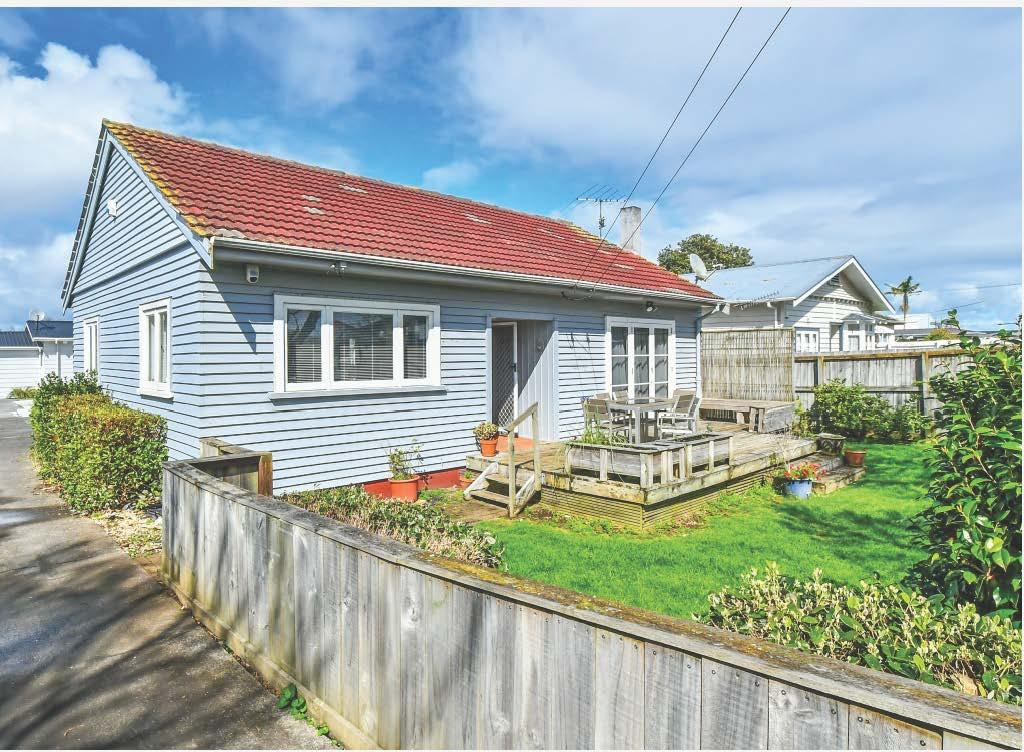
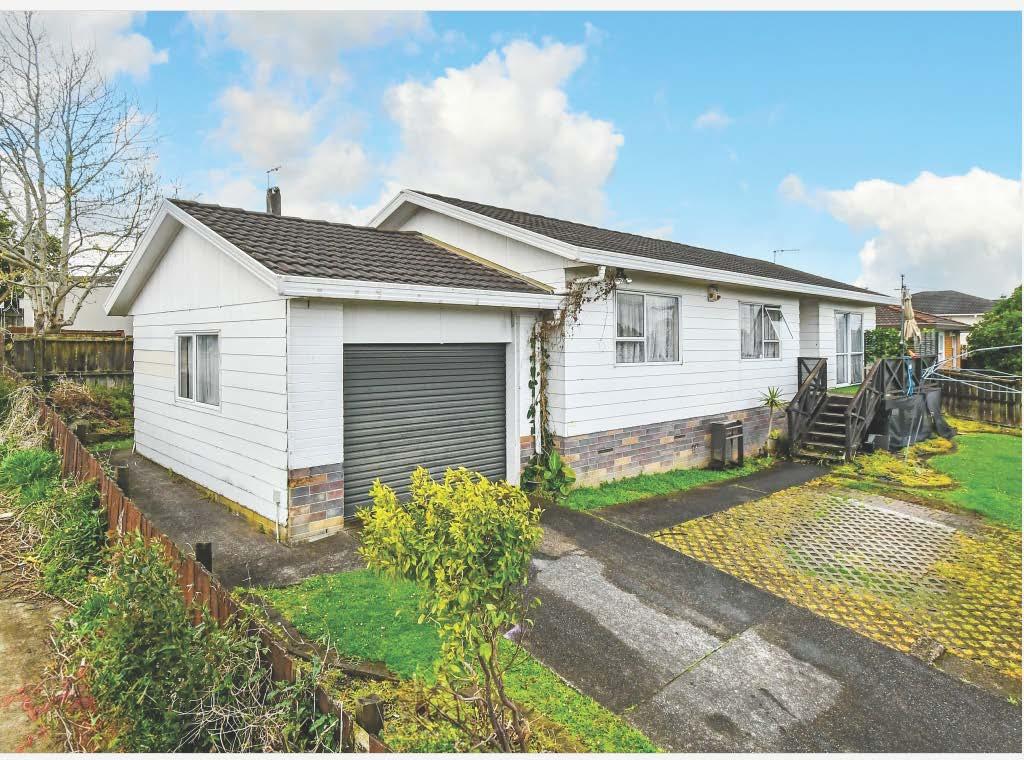
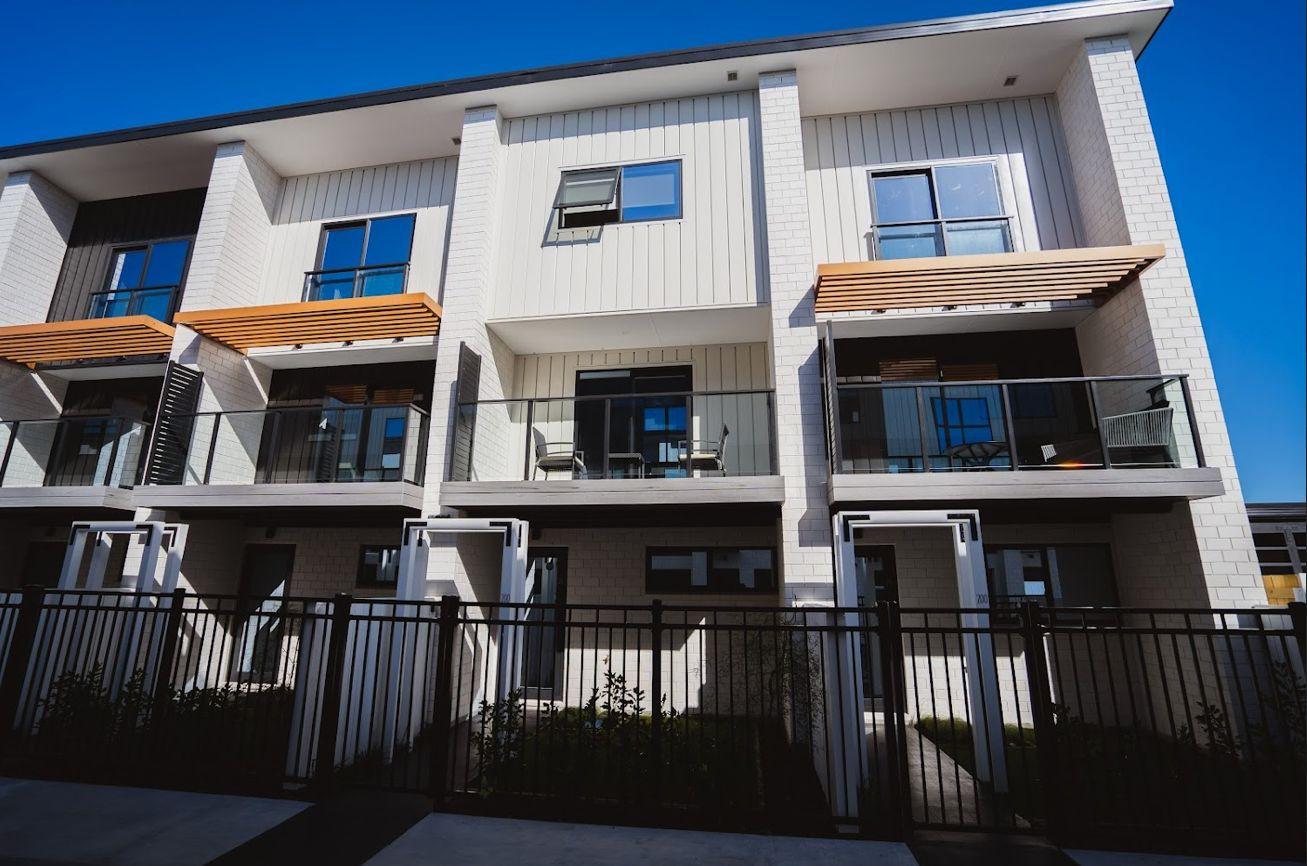
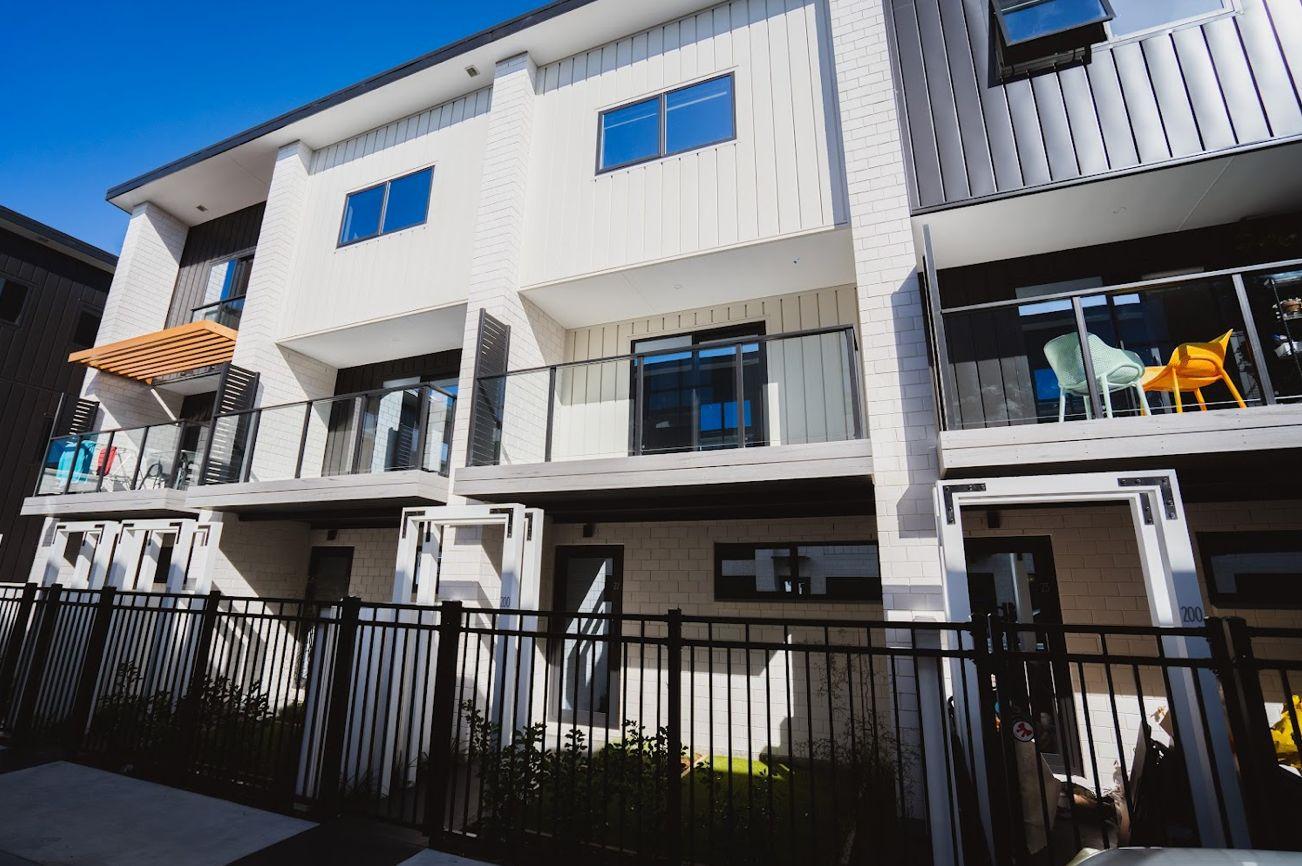
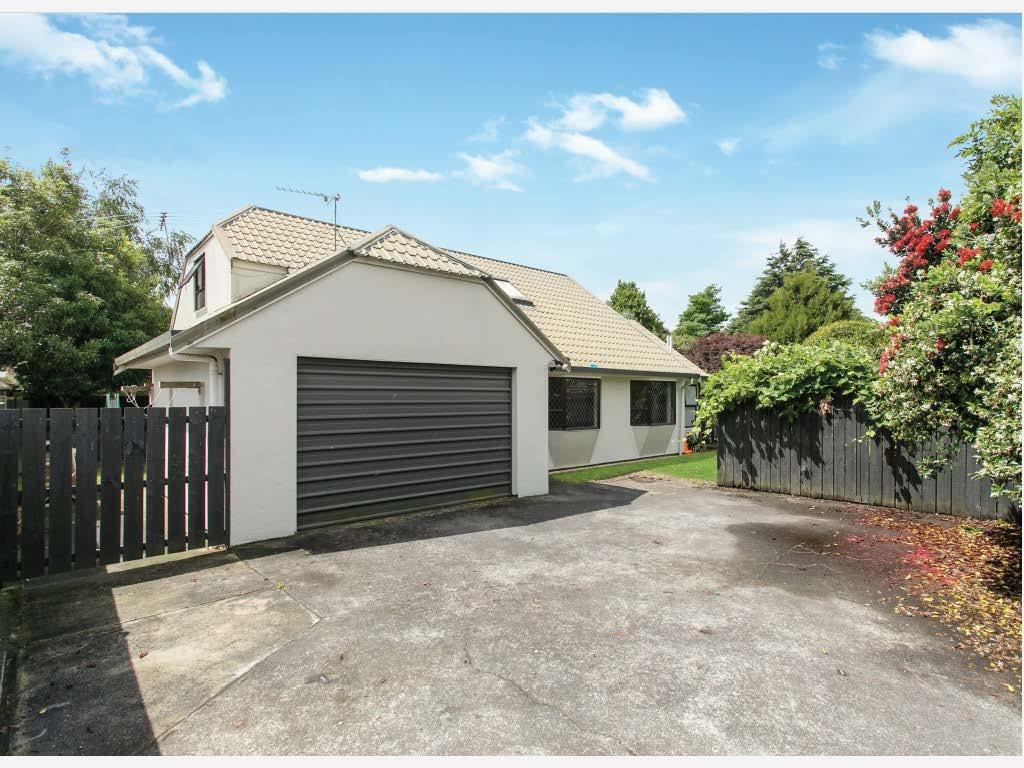
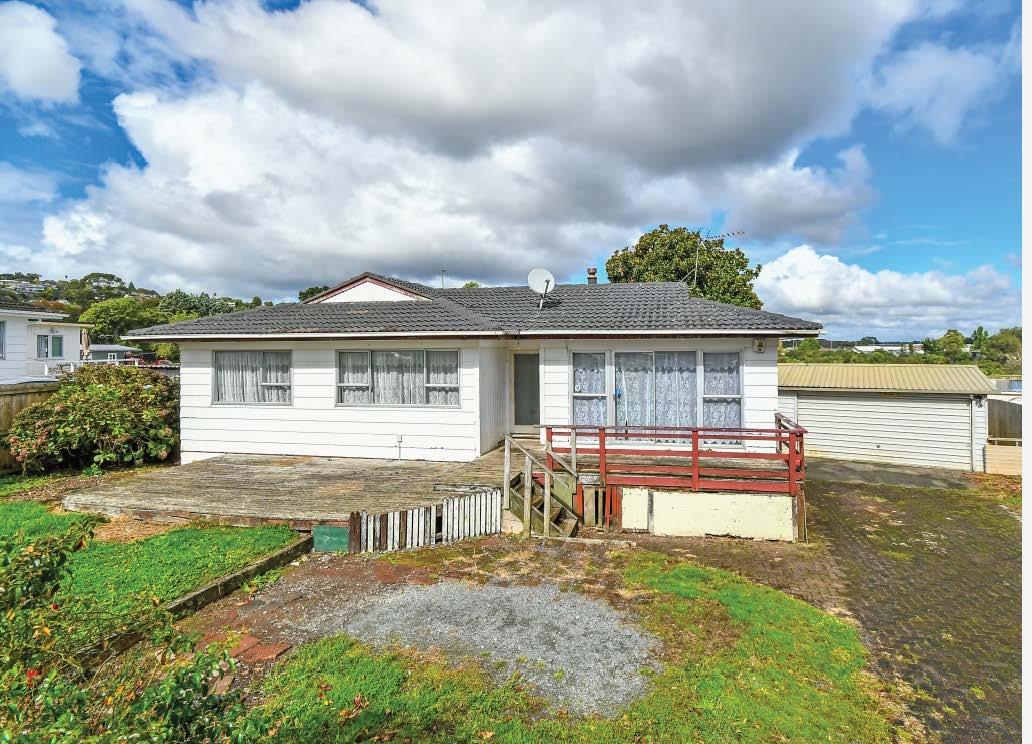
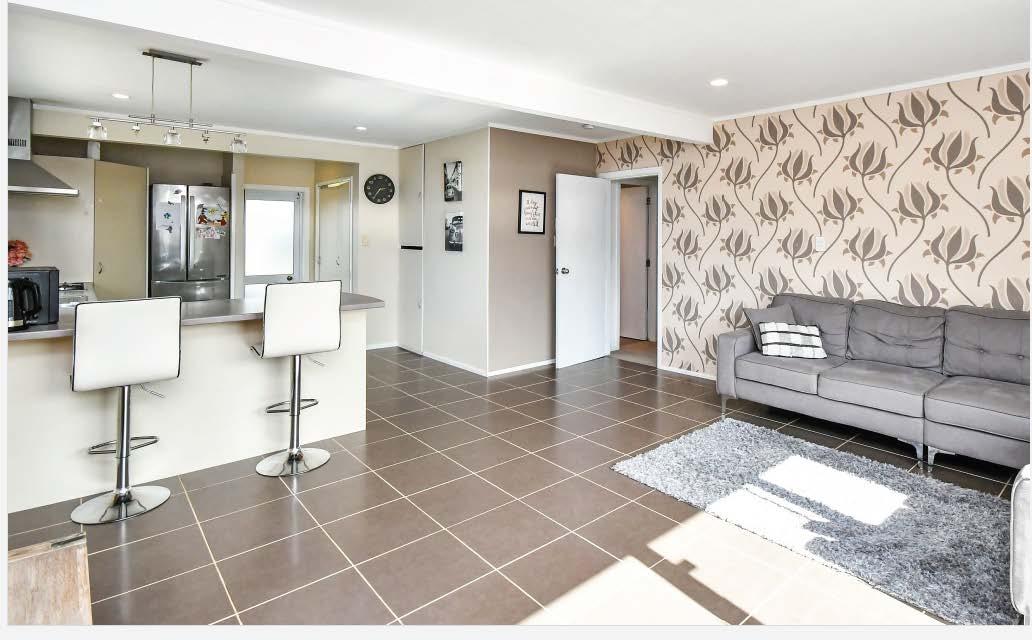
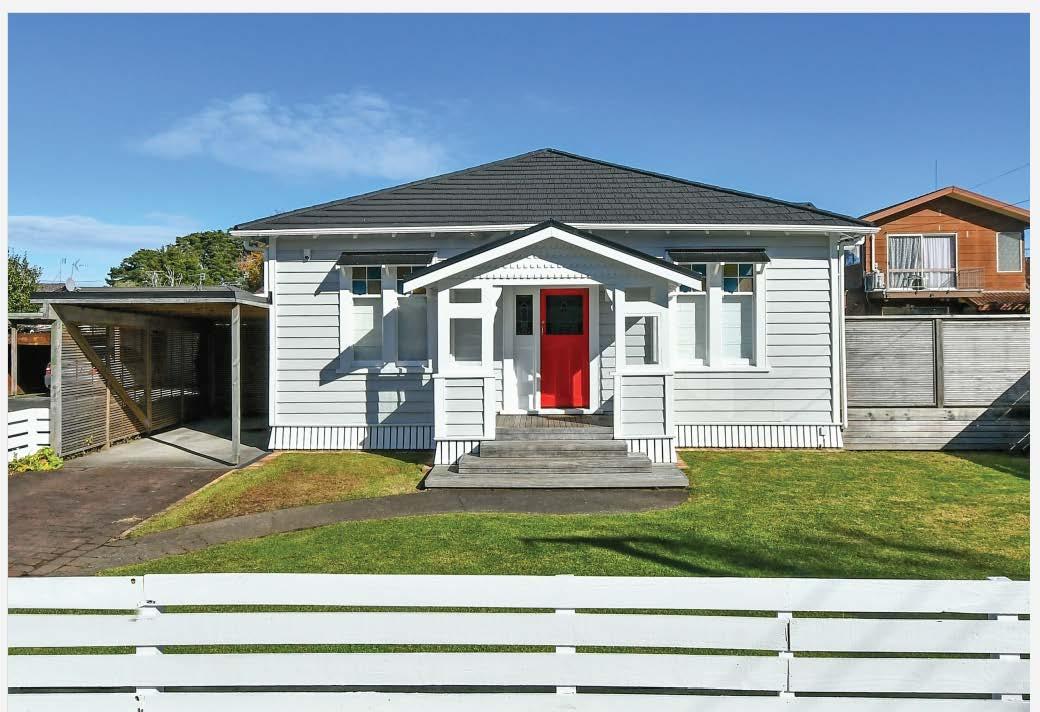
DO-UPOPPORTUNITY
Renovator’s opportunity in a prime location.
3 bedrooms, open-plan living, sunny deck.
Internal garage, 3 x OSP, and road appeal.
Close to town, shops, schools, and transport.
Perfect for "do-up and sell" or make it your home.
The owners instruction is SELL! Don't dilly-dally.
Come, view and make your offer. There will be a winner.
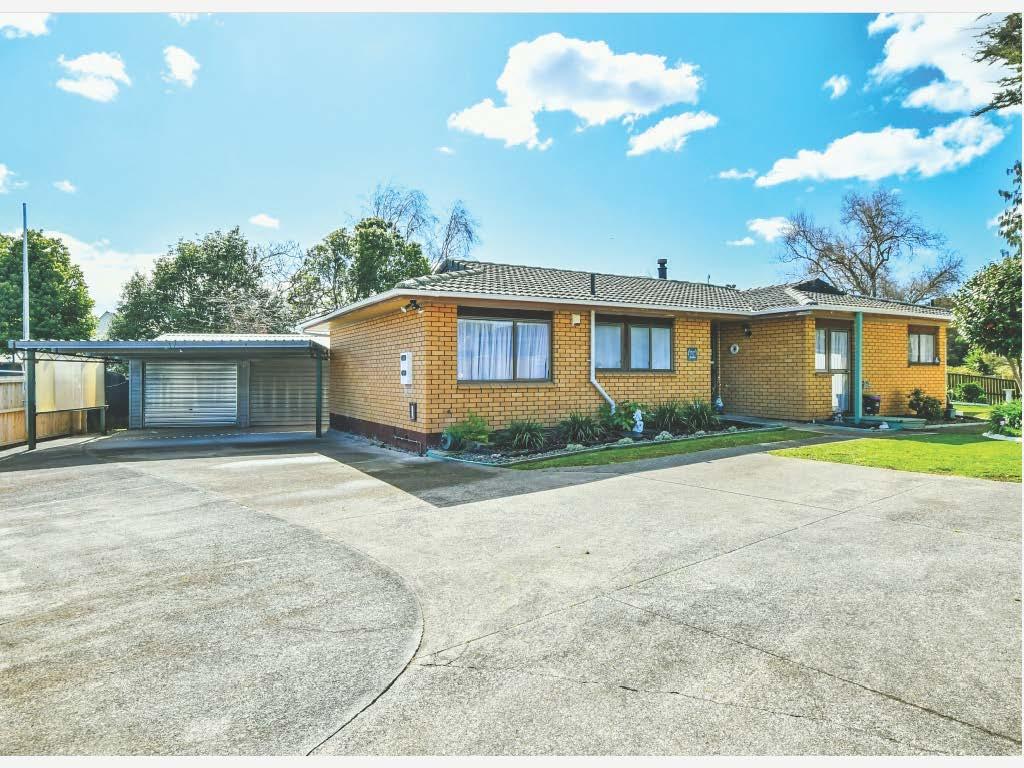
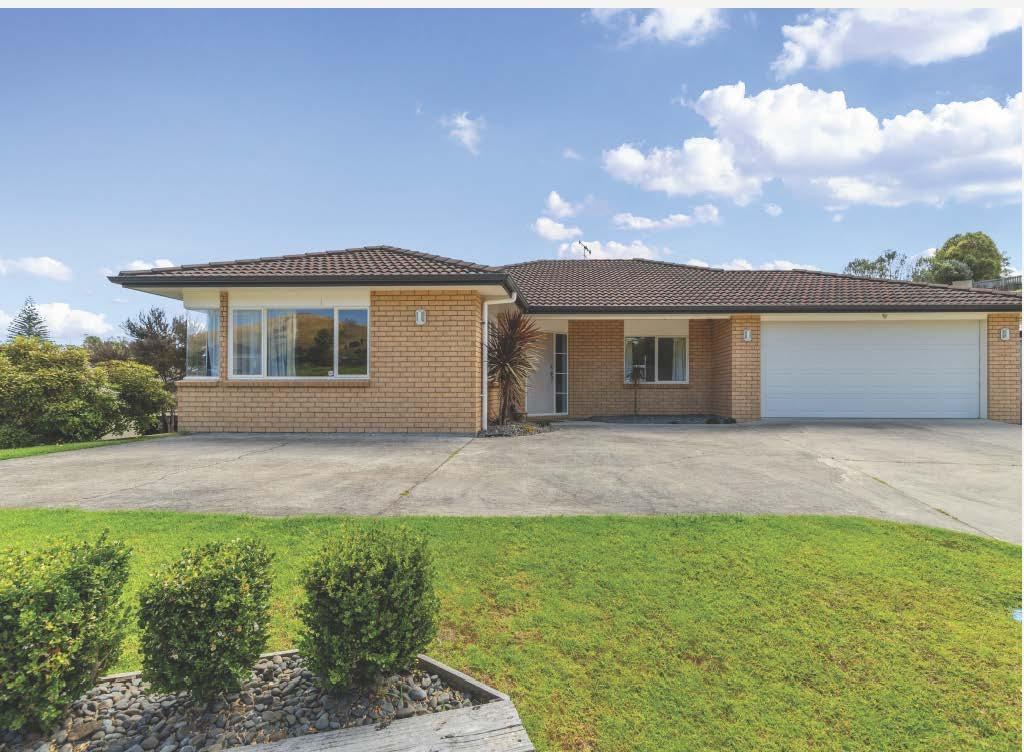
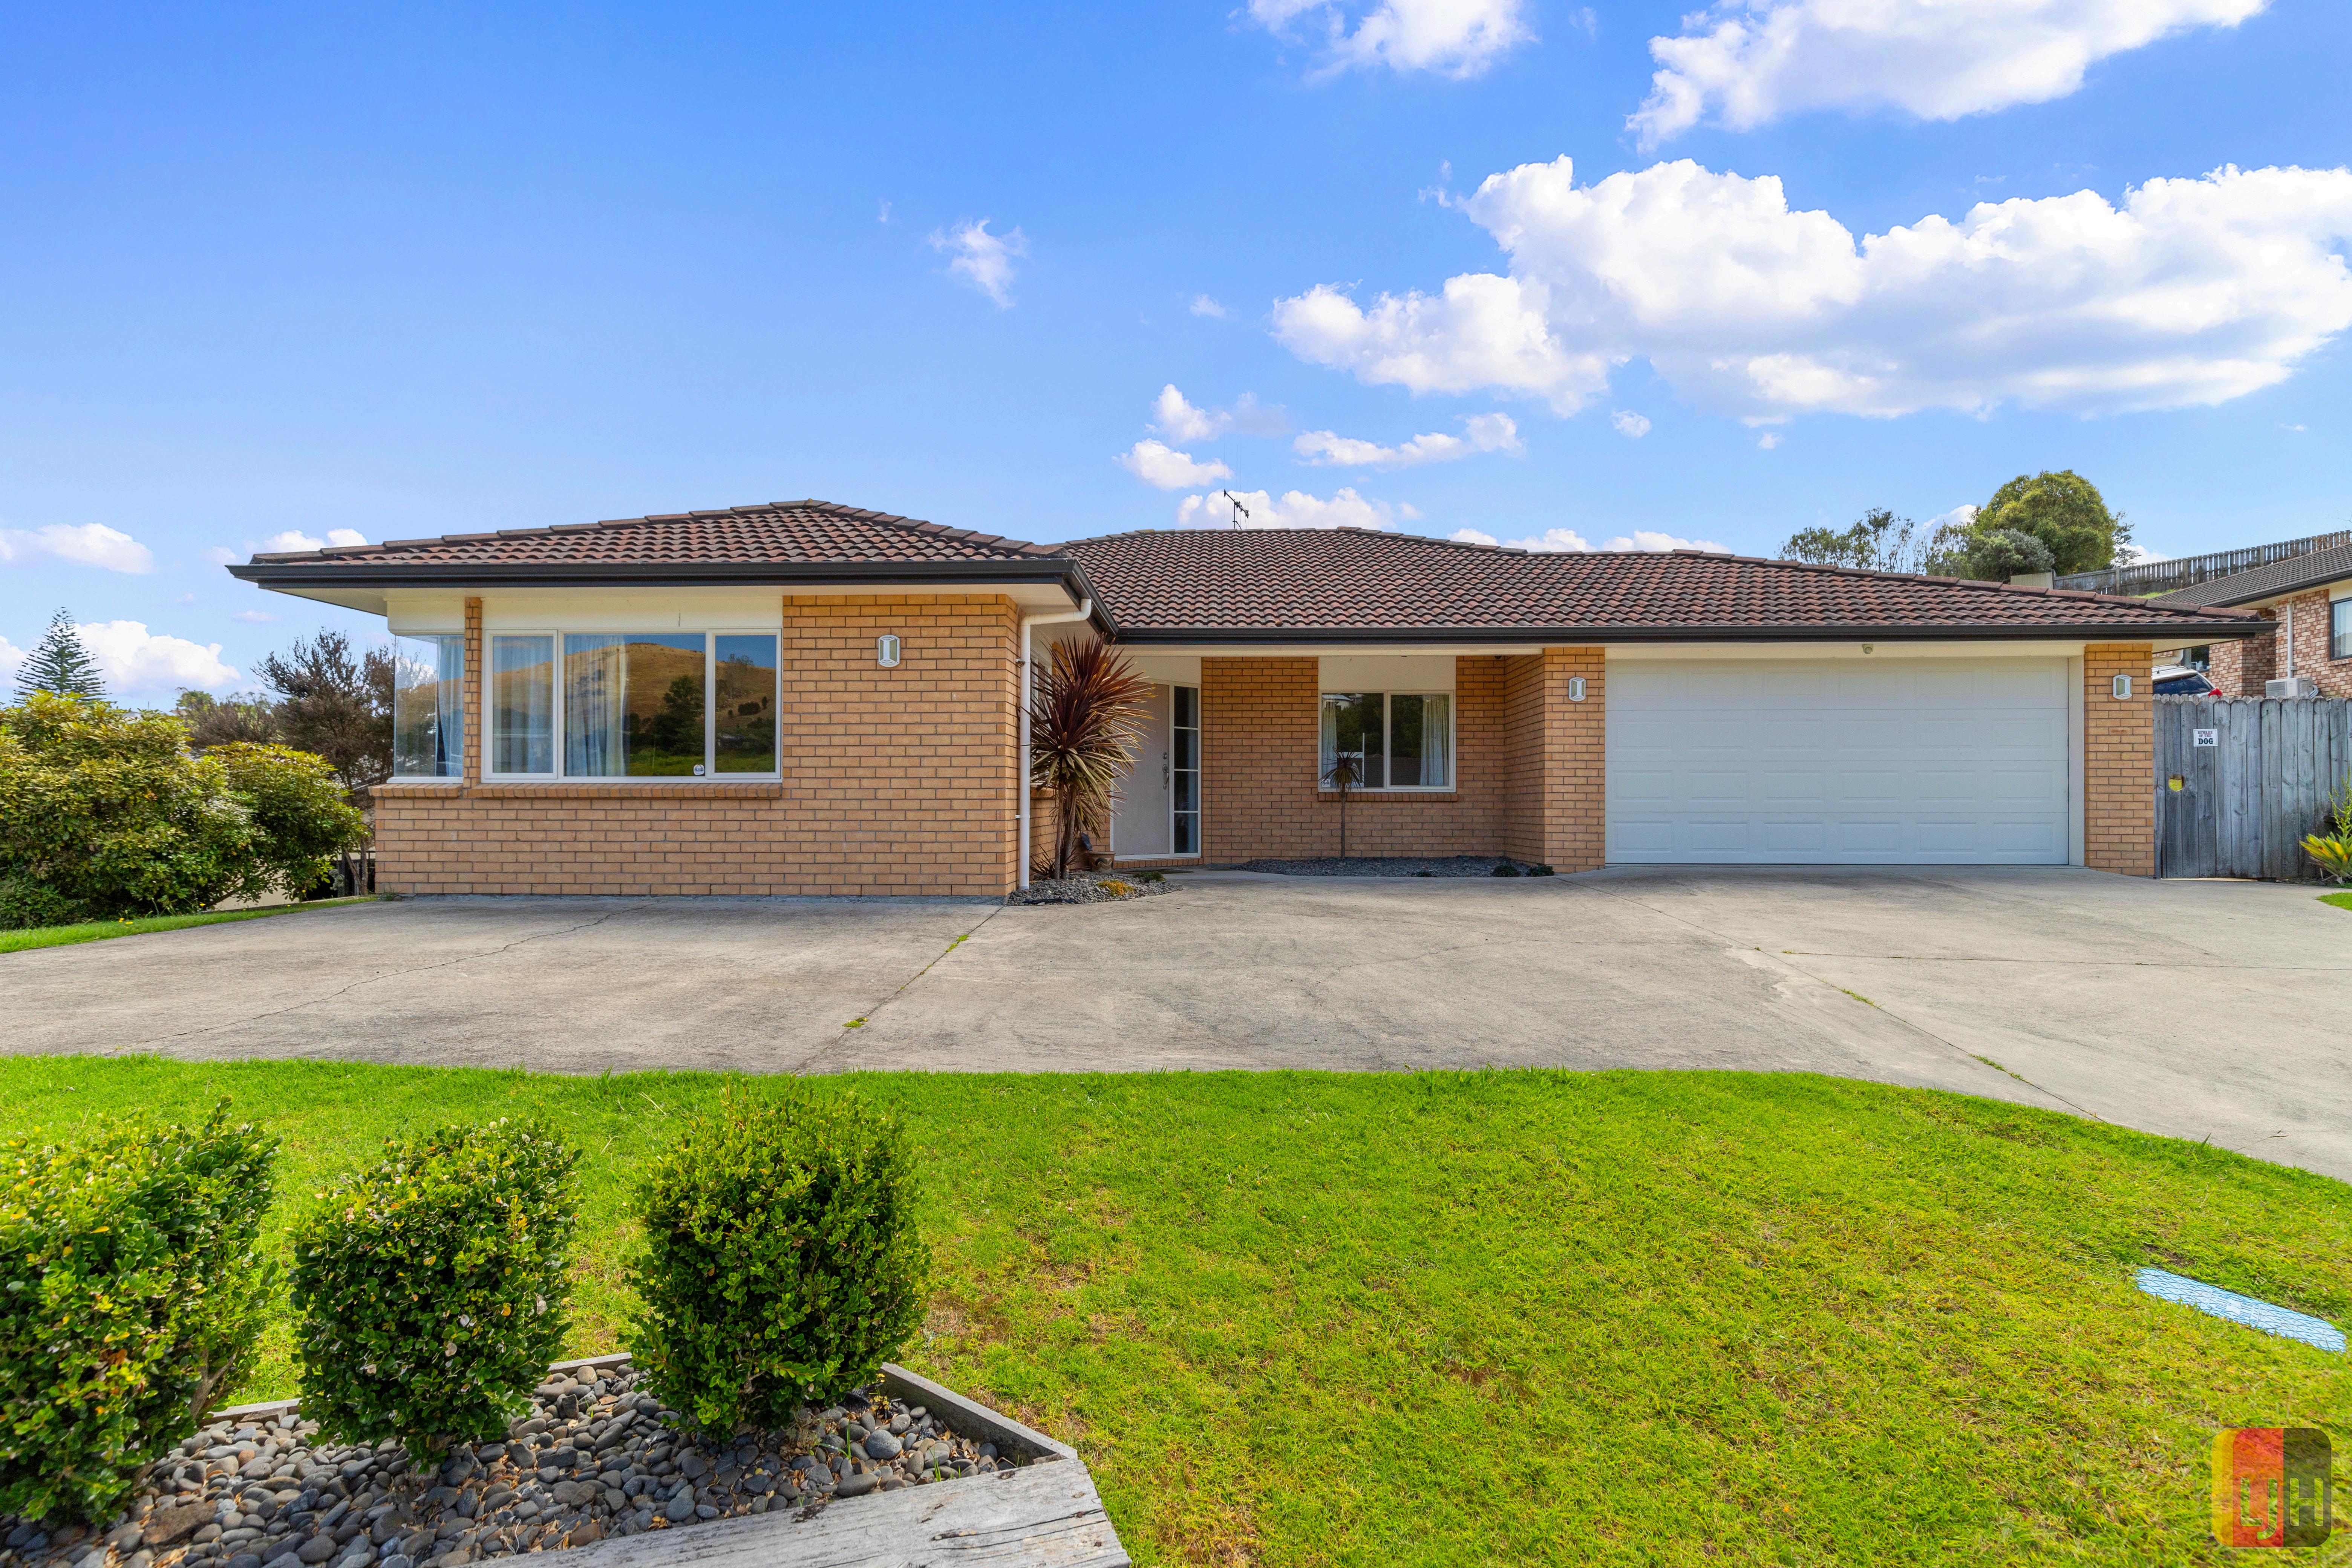
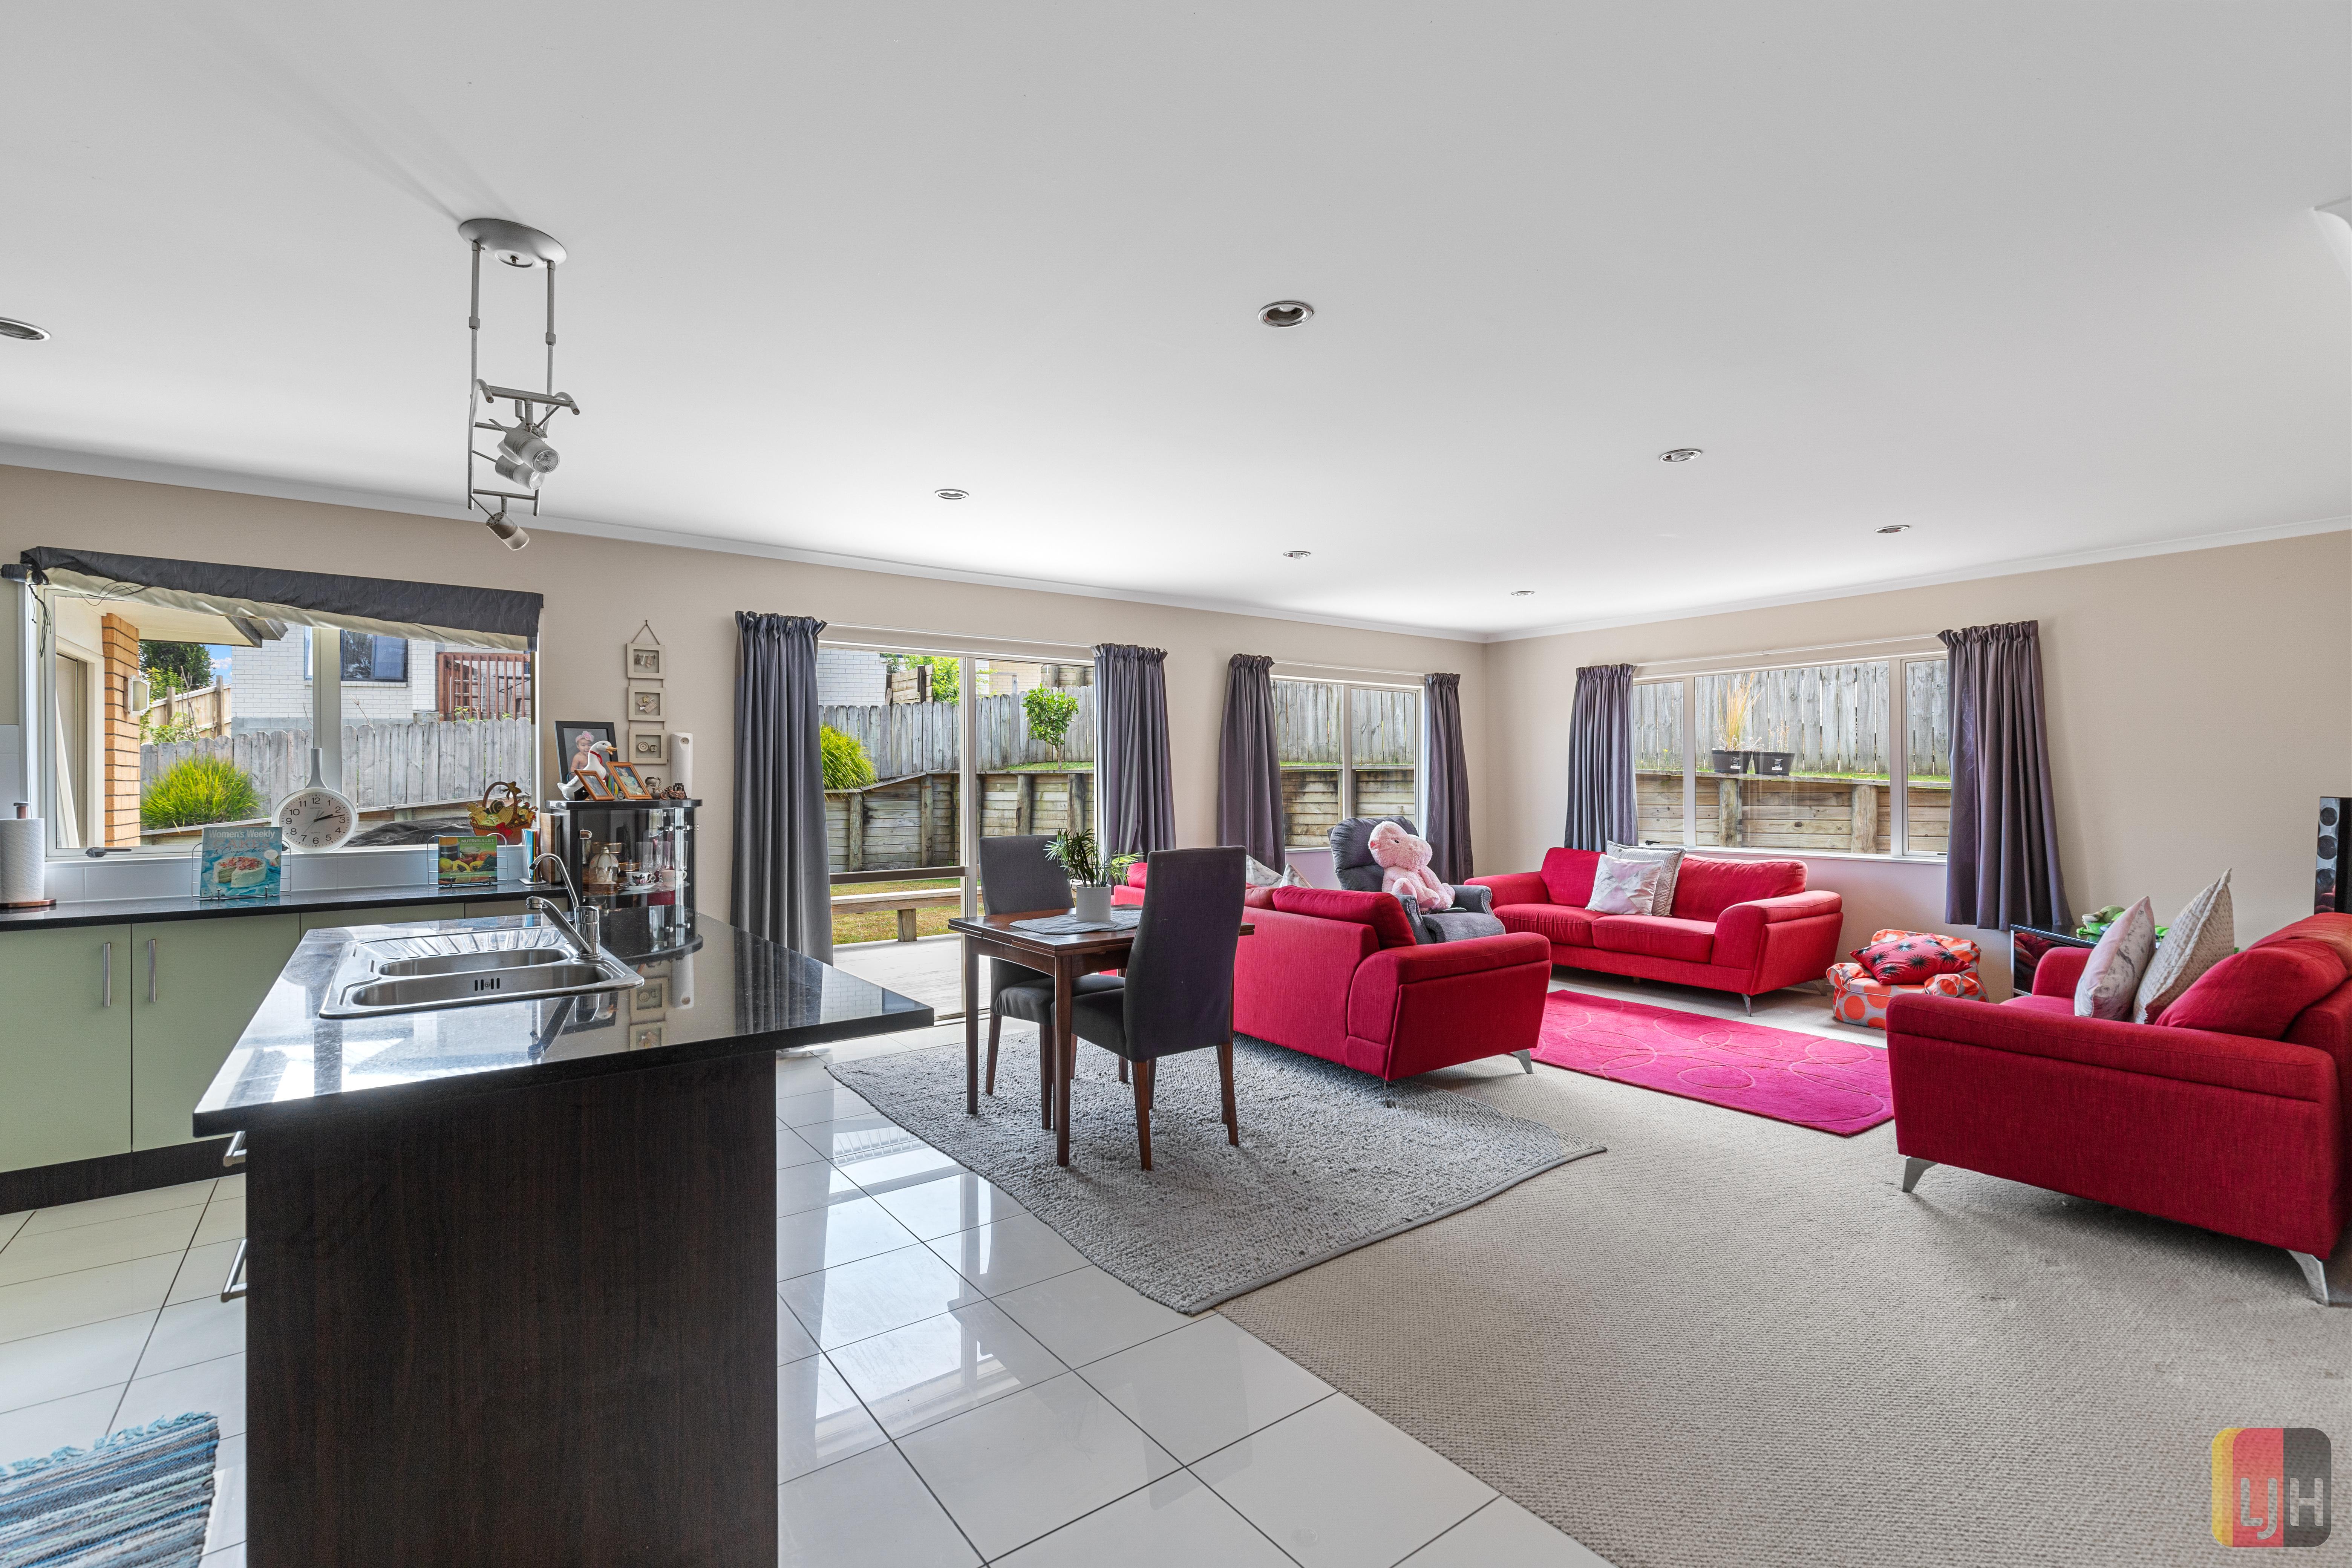
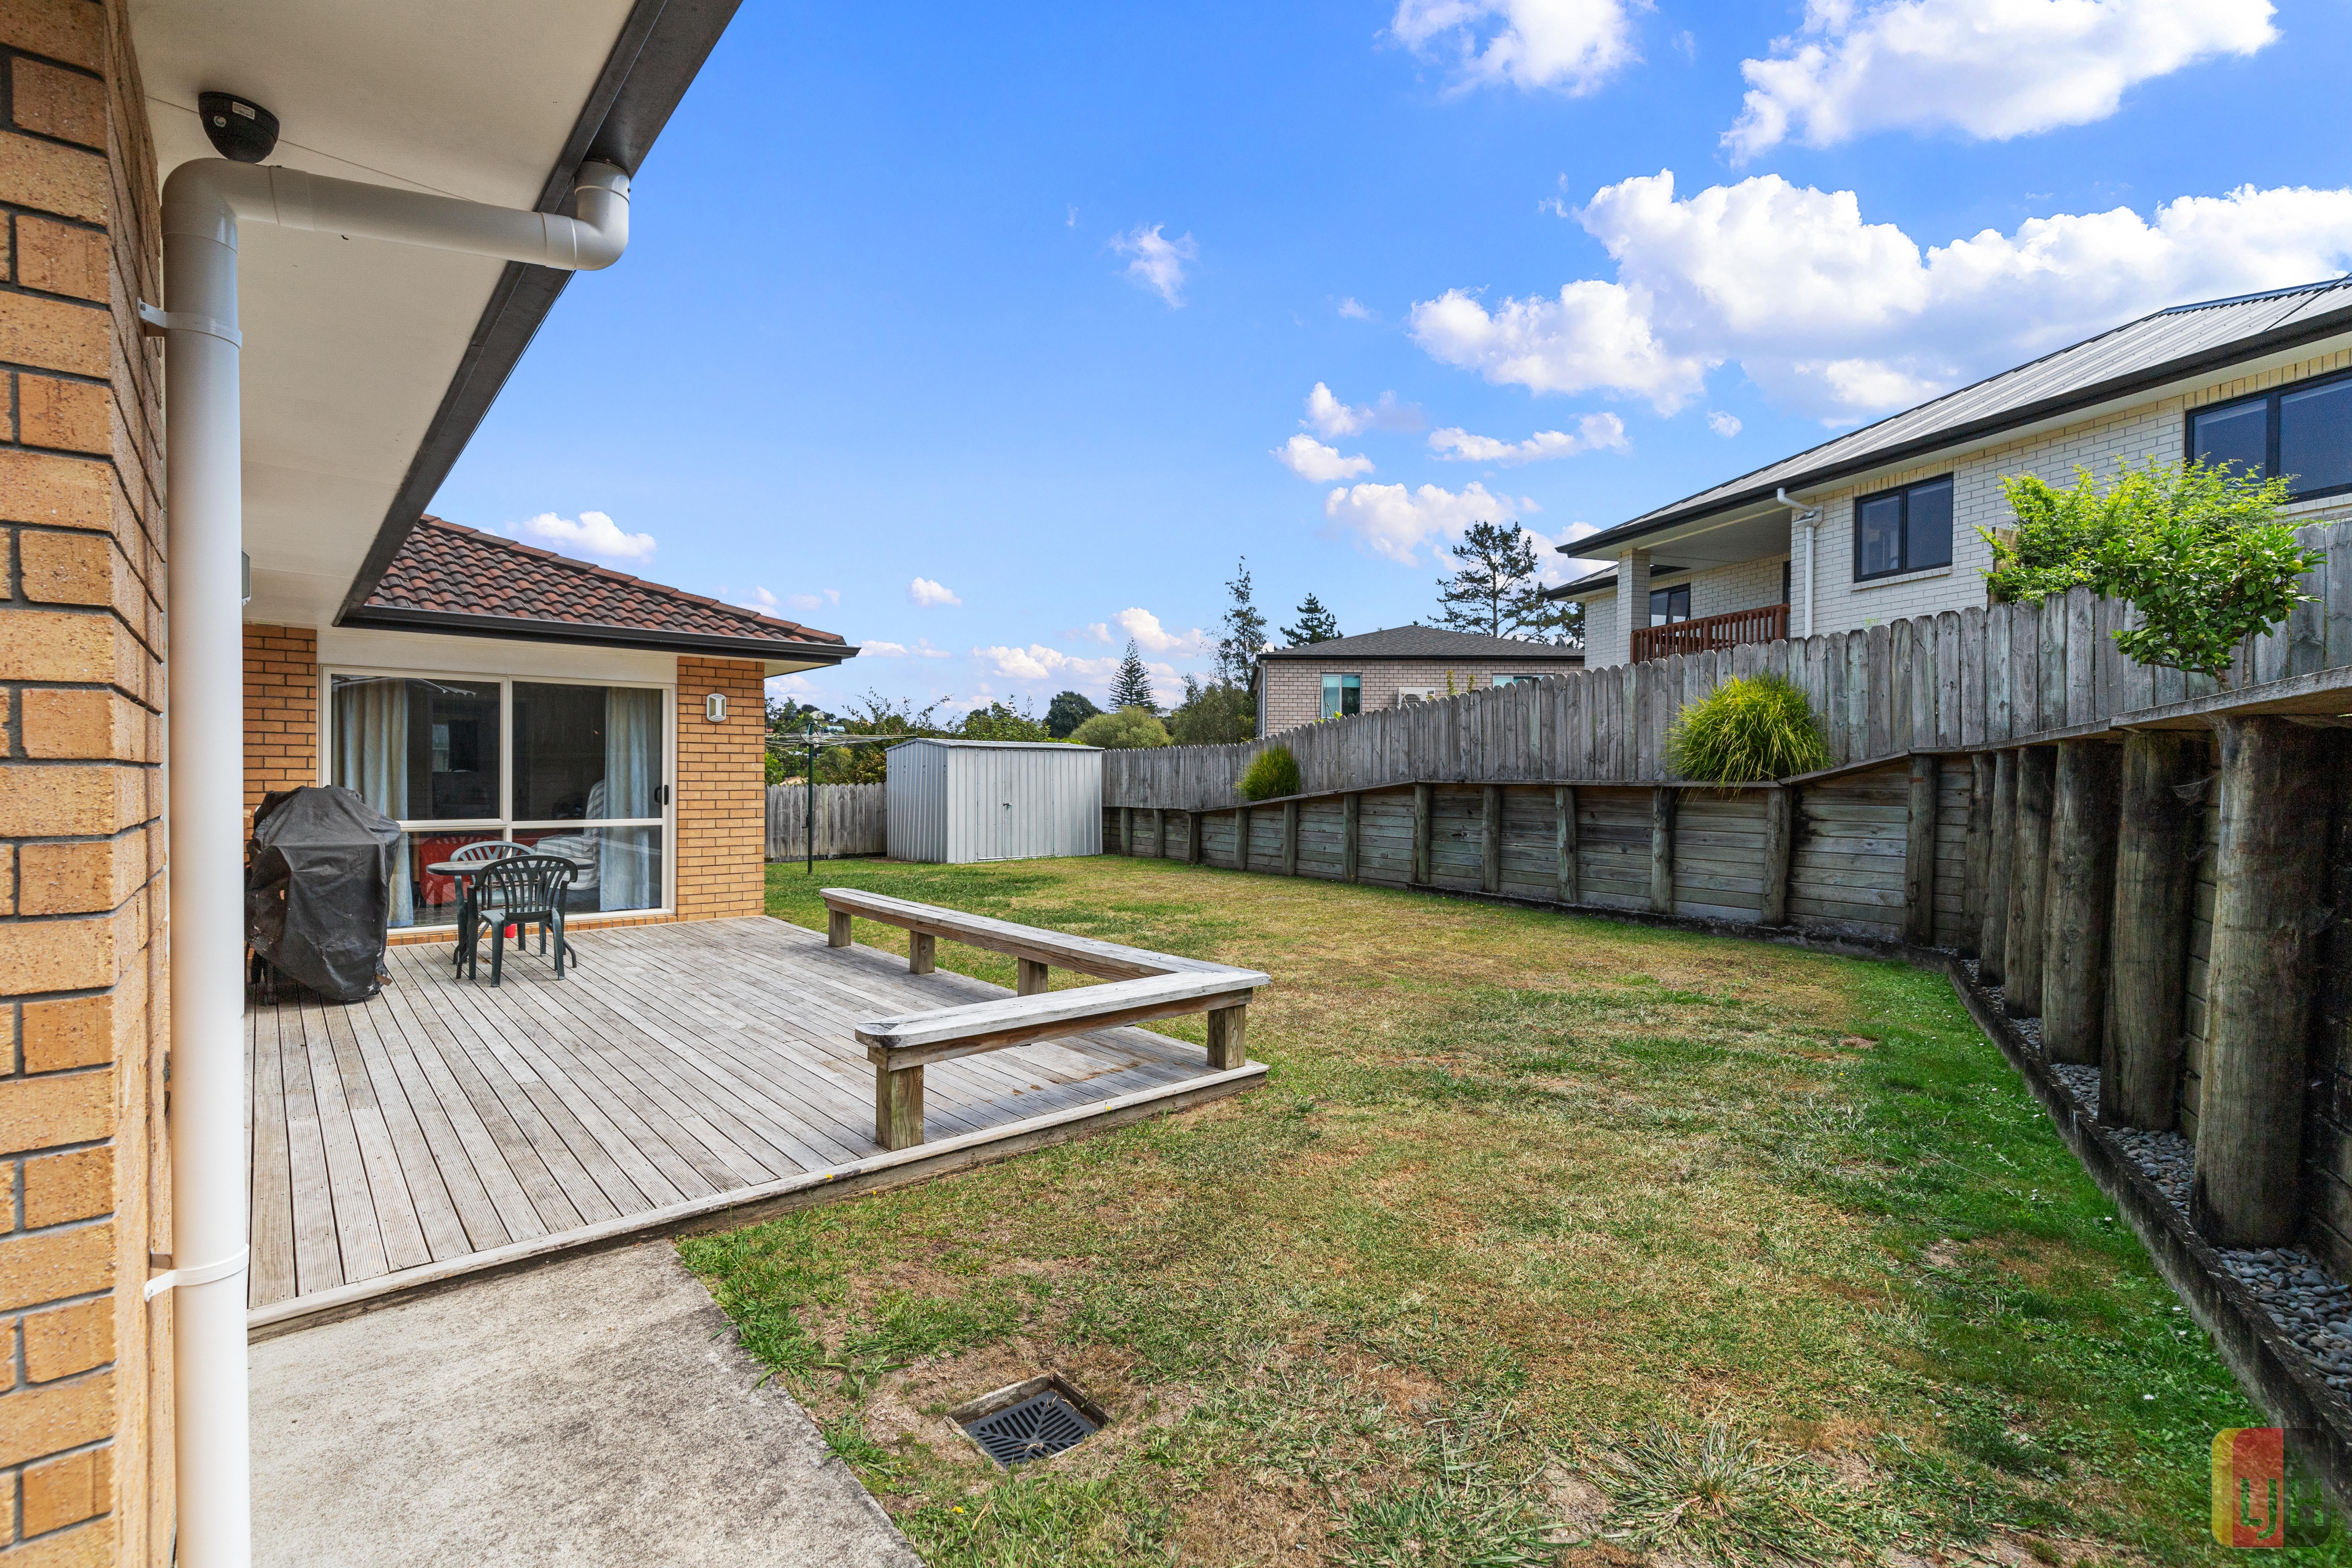
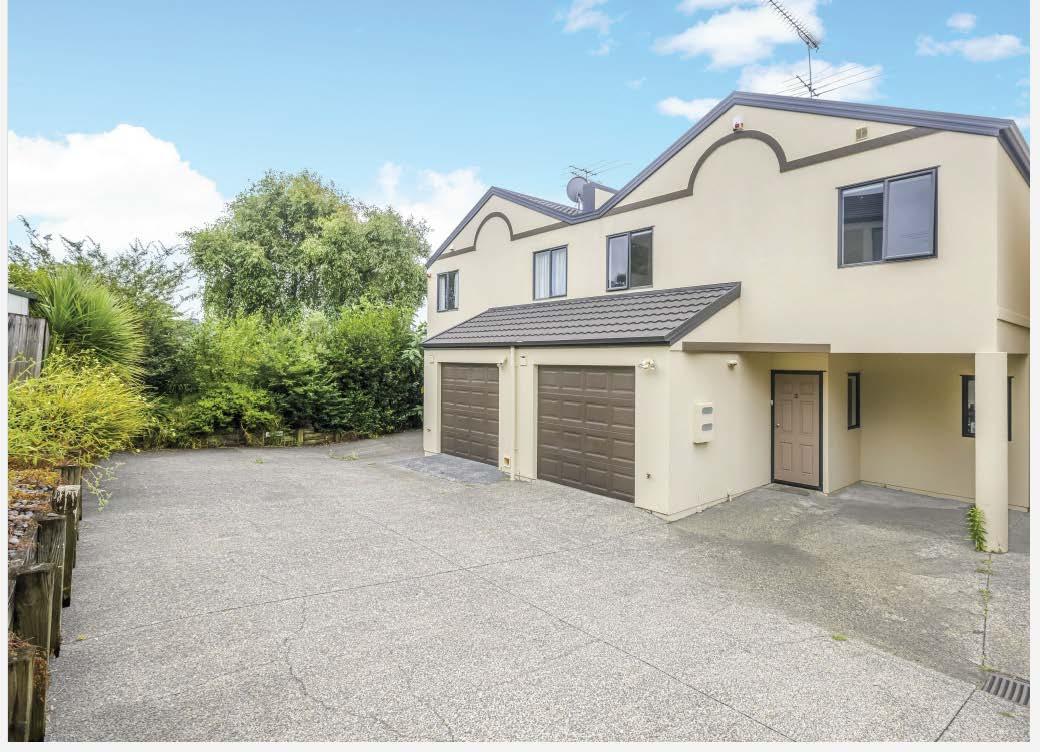
This 200m (mol) 4 bedroom, low maintenance family home with 2 bathrooms and 2 living areas is nestled on a 646m (mol) section in a quite cul-desac.
The double internal garage and loads of off street parking complete the package and will no doubt provide the perfect opportunity to settle into a safe and secure lifestyle.
Best in location, loads of potential and real value for money.
LJHooker
Town&Country
RecentlySold
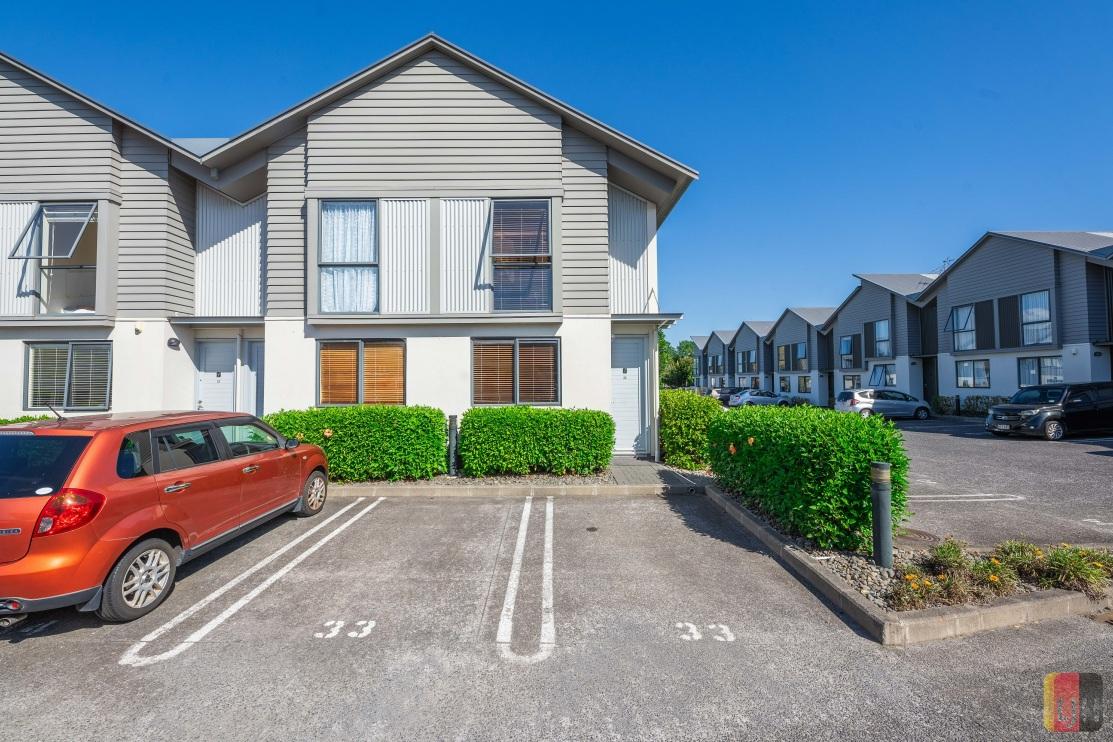
2/11Beach Road, Pahurehure
§3 bl �1
More Than meets the eye
Nestled in the heart ofconvenience,this 193m2 residenceis more than just a house, its anembodime...
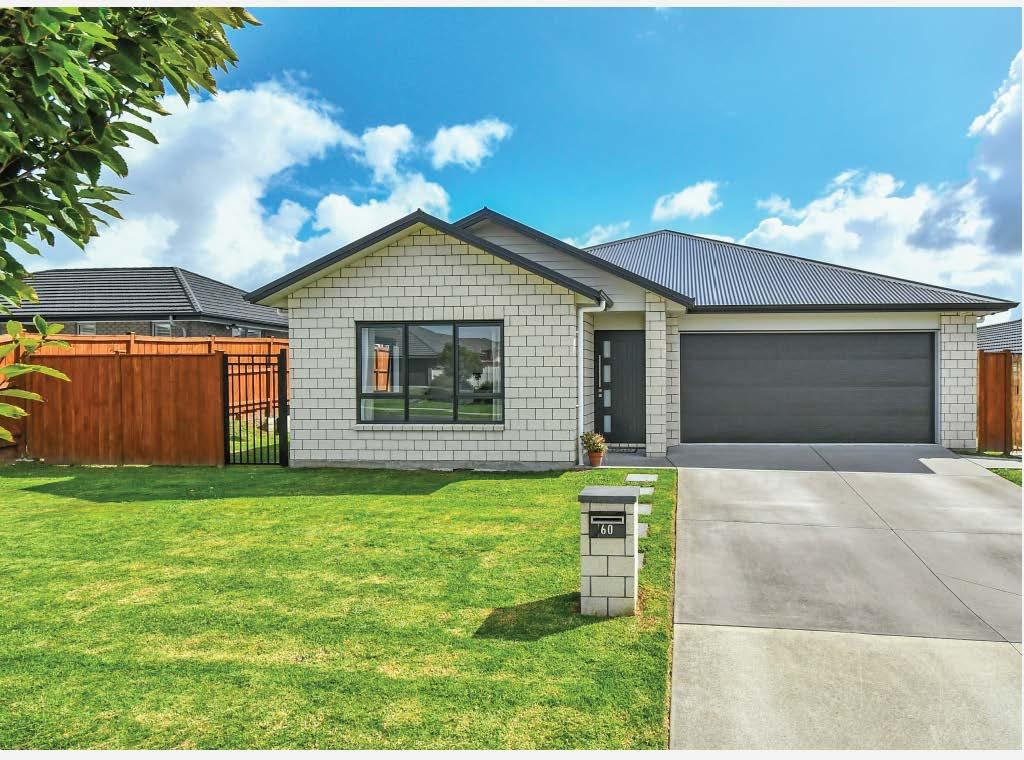
60 Harriet Johnston Drive, Pokeno §4 b3 �2
Paradise In Pokeno - Room for Mum & Dad
Enjoy coming home to the very best of executive style living by residing in this sophisticated, 4 ye...
Sold Venita Attrill 021 286 7792 venita.attrill@ljhooker.co.nz
Sold
Paula Cox 0213 96 9 77 paula.cox@ljhooker.co.nz
17Fairdale Avenue, Red Hill
§3 bl �2
Renovate, and Reap the Rewards Lots to do; and lots on offer.
Zoned "residential-mixed housing suburban" this is
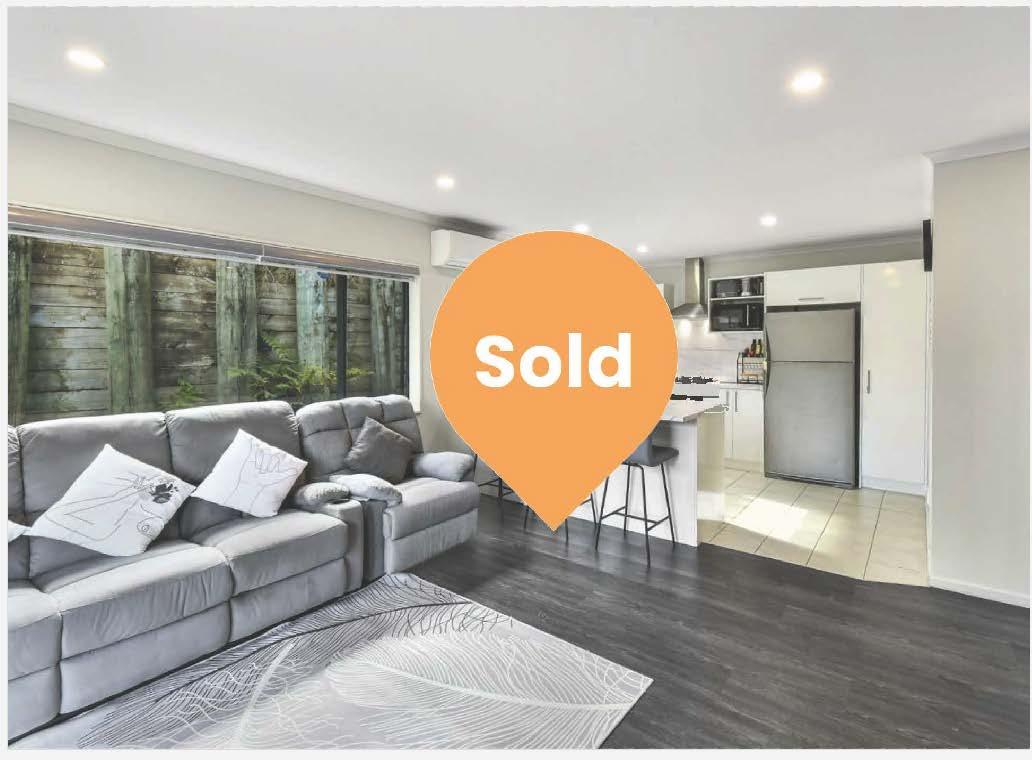
9 Greenhaven Avenue, Opaheke
§3 bl �2
RED HOT STARTER IN OPAHEKE
Priced to sell; first home buyers, investors or downsizers will love thisamazingopportunity. Truly...
Sold
Steve Reilly 021930352 steve.reilly@ljhooker.co.nz
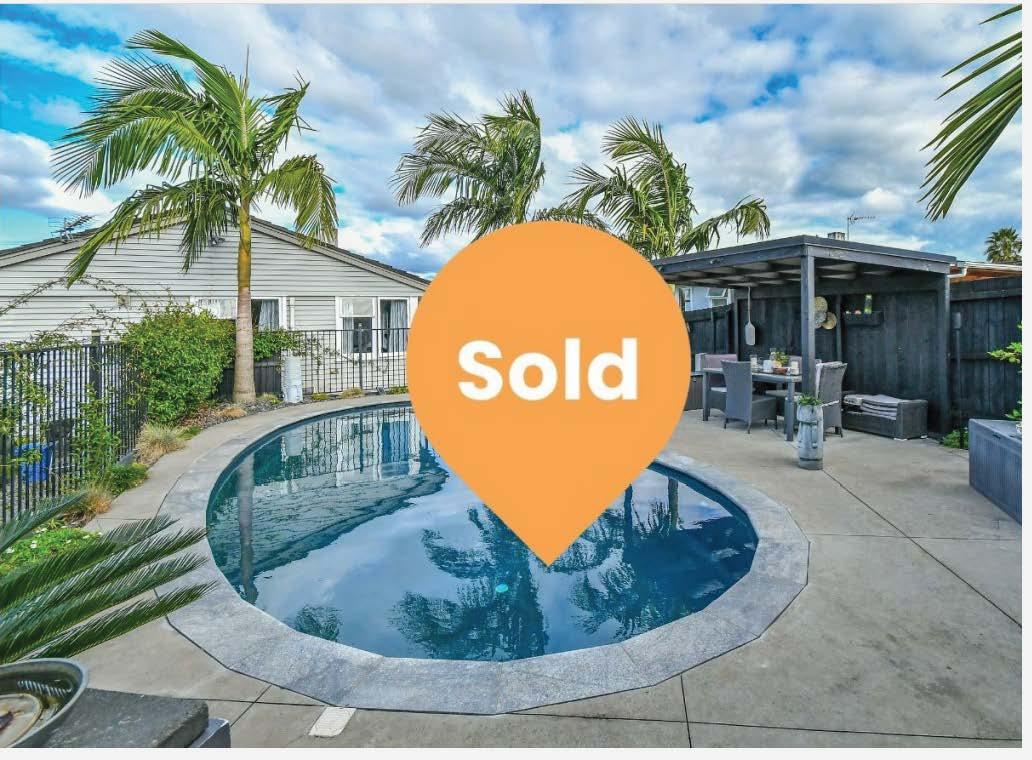
22 Old Wairoa Road, Papakura §3 bl �1
YourVery Own Club Med
Enjoy fabulous resort style living at this striking 3 double bedroomwarm and inviting home. An abun...
Sold
Steve Reilly 021930352 steve.reilly@ljhooker.co.nz
17A KeriVista Rise, Papakura §2 bl �1
VENDOR HAS PURCHASED ELSEWHERE-MUST SELL
Nestled high on the hill, this charming and affordable two bedroom brick and tile single-level dwell...
Sold
Paula Cox 0213 96 9 77 paula.cox@ljhooker.co.nz
Sold
View By Appointment Anu Jay 022 35 77554 anu.jay@ljhooker.co.nz
With an impressive career spanning over three decades, Venita began her journey in Real Estate sales in 1996 with the esteemed LJ Hooker/Harveys Group. Throughout hertenure,Venitahasbeenrecognizedwithnumerousnationalawards,atestamentto herunwavering dedication to her clients. In fact, approximately 90% of Venita's sales are derived from her past clients and client referrals, showcasing the exceptional level oftrustandsatisfactionsheconsistentlydelivers.
Selecting the right agent is crucial, and there is no better way to make that decision thanbyevaluatingtheirsuccessandthemannerinwhichtheyachieveit.Venita'svast clientele,whorepeatedlyseekherservices,skill,andadvice,standasatruetestament toherabilitytoexceedexpectations.
While Venita boasts extensive experience and a track record of success, she remains drivenandcommittedtogoingaboveandbeyondtoachieveapremiumoutcomefor every client. Her dedication to continuous improvement ensures that she remains at theforefrontoftheindustry,offeringyouunparalleledserviceandexpertise.
When you choose Venita as your agent, you can rest assured that you have a trusted partner by your side, who will tirelessly work to secure the best possible results for you. WithVenita,yourrealestatejourneyisinsafehands,backedbyalegacyofexcellence andarelentlesspursuitofsuccess.
Contact Venita today and experience firsthand the difference a seasoned and determinedprofessionalcanmakeinyourrealestateendeavours.
Whenyouknow,youknow. ™
JohnnyBright
AUCTIONEER
Johnny is proud to be a part of the team at Apollo Auctions NZ. Entering real estate in 2014, he has developed and honed his craft of auctioneering and negotiating skills to a level that now sees him as an industry leader. Johnny has worked and collaborated with some of the most notable agents, business owners and auctioneers across New Zealand.
With the fusion of his knowledge and skill together with his personable approach, Johnny creates the ultimate auction experience . He implements drive and dedication to each and every property that he calls - regardless of value, location or personal circumstances. Johnny’s performance style and welcoming nature allows him to capture the audience and motivate buyers. He will guide you through the process and create a solid platform to achieve the best possible outcome for your auction.
Johnny also has a passion for acting. With a Bachelor of Performing and Screen Arts, he has appeared in several TV commercials and films, his most widely recognized being ‘Falling Inn Love’, an American Netflix production which was filmed in New Zealand. He has also worked with the Auckland Theatre Company on a number of occasions.
He currently resides in Beachlands with his wife and two young children.
It’s rare in life that we get something for nothing with no strings attached, especially if it genuinely adds value. Nevertheless, that’s precisely I will give you. Expert home loan advice which has reliably proven to offer significant long-term financial advantage. I keep strict tabs on the country’s largest network of banks plus numerous smaller and second-tier lenders, so you don’t have to. What’s more, this comes at no cost to you because your chosen bank pays for the privilege. You have nothing to lose, yet have a higher chance of securing better terms. Rest assured - if there’s a superior deal out there for you, I’ll find it.
In the typically stoical world of finance, I offer a point of difference. Not only will you receive excellent independent and impartial advice, but you’ll have fun doing it. Even after 15 years in the mortgage arena, my enthusiasm for objectives and commitment to clients shines through at every turn. Endorsement comes from countless glowing testimonials and in my own words: “I’m at my happiest helping people navigate through difficult situations, giving hope and concrete opportunity where they previously had none.”
Prior experience as sales manager in the fields of telecommunications and pharmaceuticals, then later, a small business owner and private property investor, provided me with considerable business acumen across many industries. My customer-focused approach and personable demeanor also reflect a lifetime of experience in client relations. I credit travel to distant locations for creating an enduring interest in different cultures and honing my ability to relate well to the needs of the broader population. In particular, I soundly empathise with people relocating from other countries to make New Zealand their home.
To continue giving my professional best, I maintain balance by travelling and participating in seasonal sports such as paddle boarding and skiing. I enjoy indulging in my creative side; with landscaping, painting watercolours or improving my guitar playing prowess. Additionally, I actively support my community through Christians Against Poverty (CAPNZ), but above all, my wife and our five shared children always take centre stage.
There's little that I haven't seen in my time in the industry, priding myself on an ability to deal with the trickiest of scenarios, never turning anyone away. My philosophy of treating people how I'd like to be treated results in a 360-degree perspective which sets myself apart.
Get in touch if you need any expert guidance. Regards