GARETT HUBER AREA MARKET REPORT


 Garett Huber
Compass
Cell Phone: (850) 830-1801
https://huberluxurygroup.com
Area 17 - 30A West, Area 18 - 30A East
Published: August 2023*
Property Types: Residential - Detached Single Family Price Range:
30AAreaReport-Single-FamilyHomes
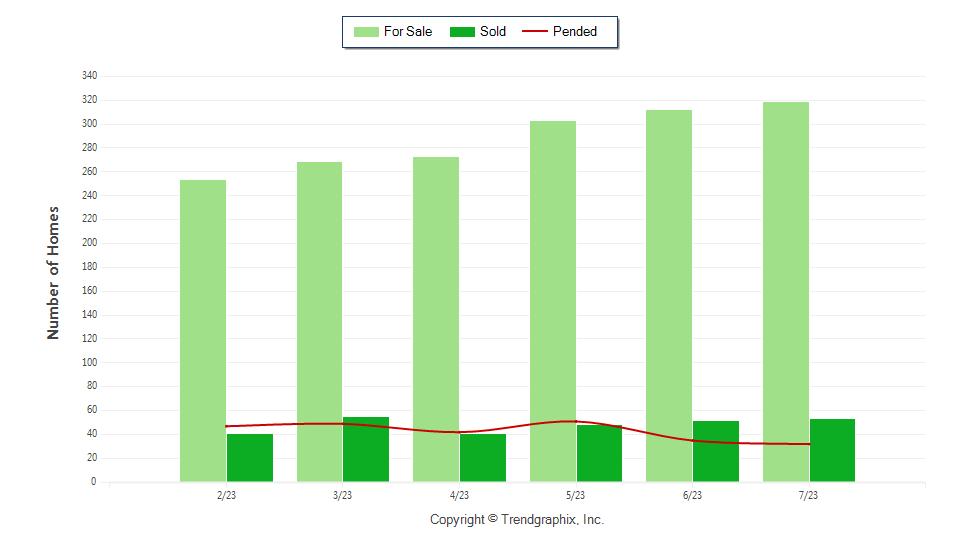
July 2023 was a Buyer's market! The number of for sale listings was up 9.2% from the previous month. The number of sold listings decreased 22.1% month over month. The number of under contract listings was down 28.4% compared to previous month. The Months of Inventory based on Closed Sales was 9.3.

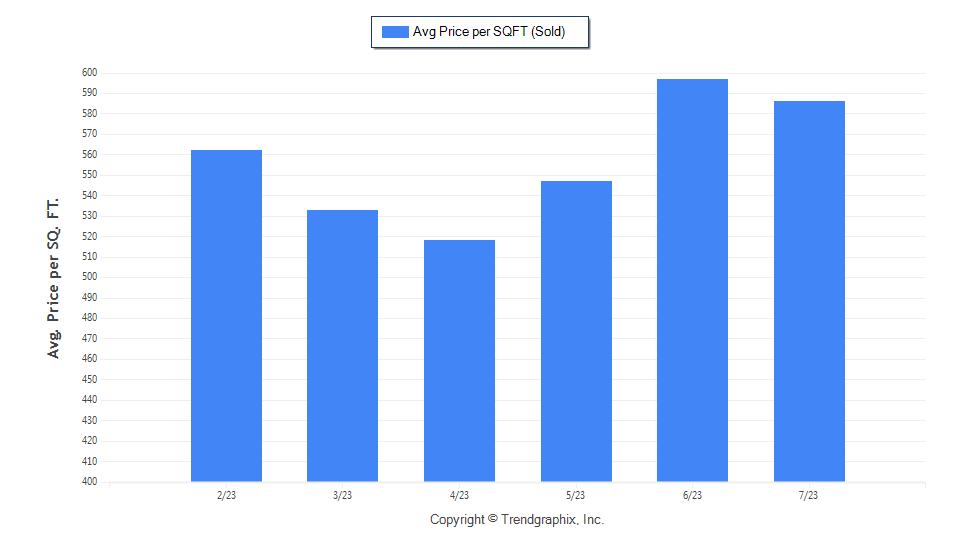
The Average Sold Price per Square Footage was the same as compared to previous month. The Median Sold Price decreased by 1.4% from last month. The Average Sold Price also decreased by 1.7% from last month. Based on the 6 month trend, the Average Sold Price trend was "Neutral" and the Median Sold Price trend was "Neutral".
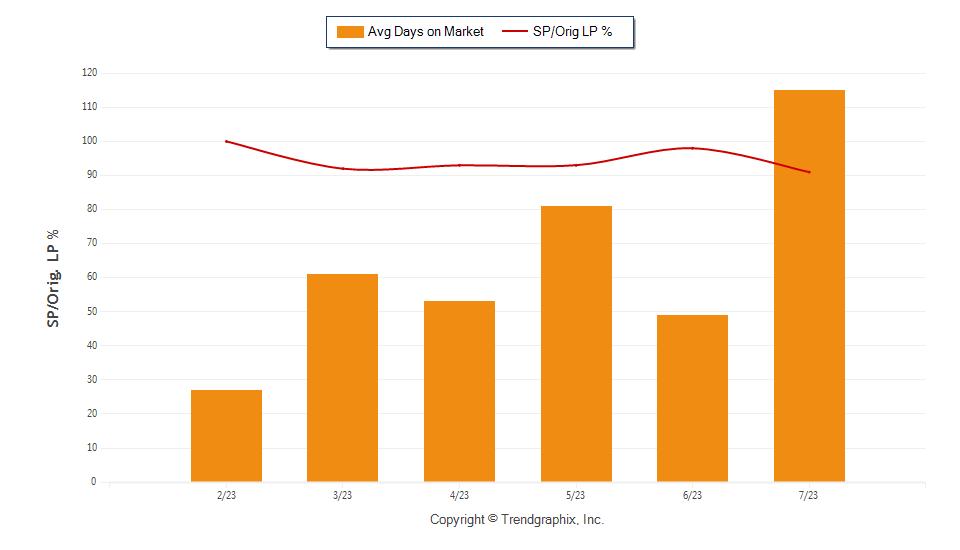
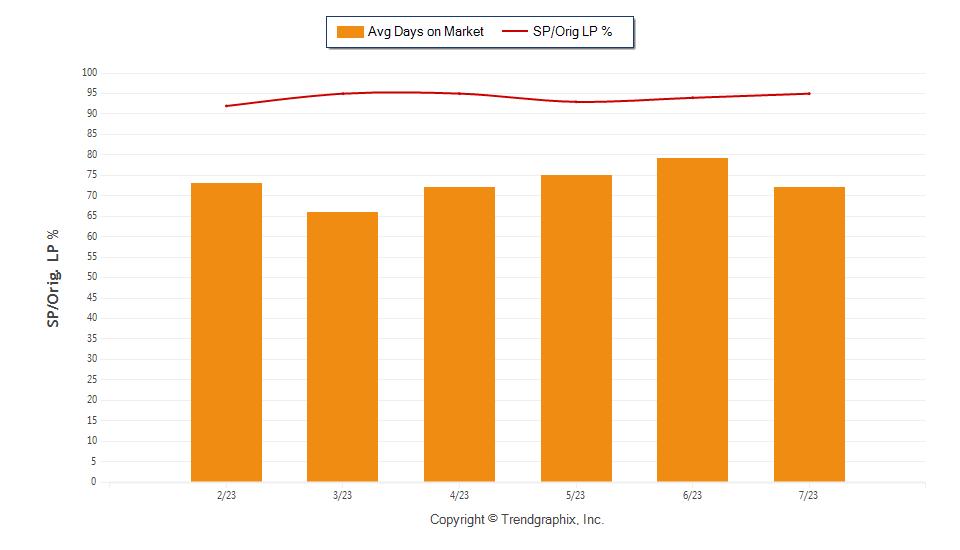
The Average Days on Market showed a neutral trend. The ratio of Sold Price vs. Original List Price was 94%.

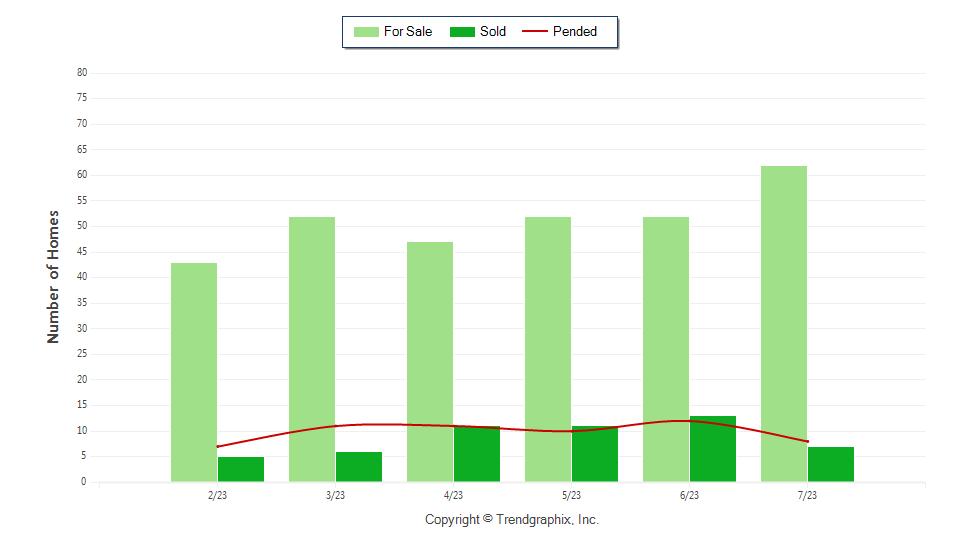
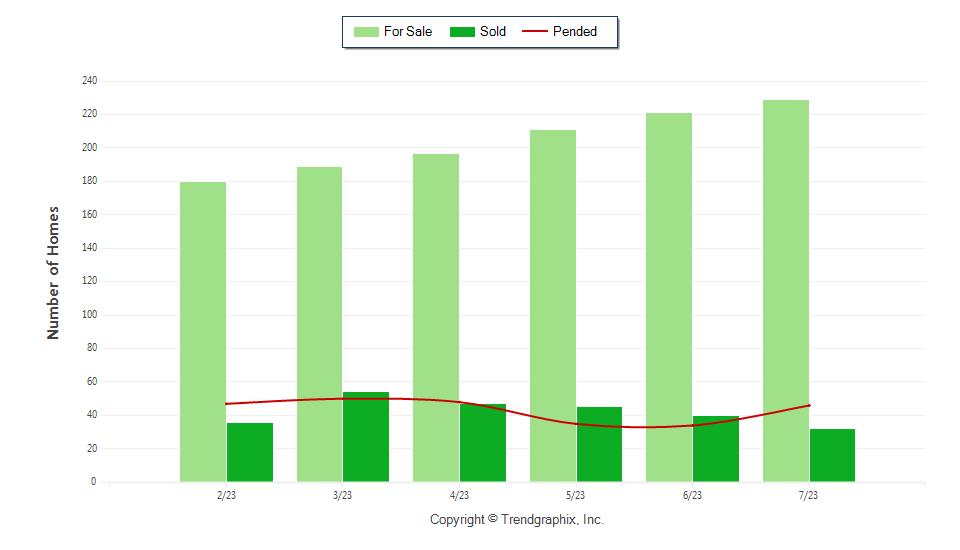
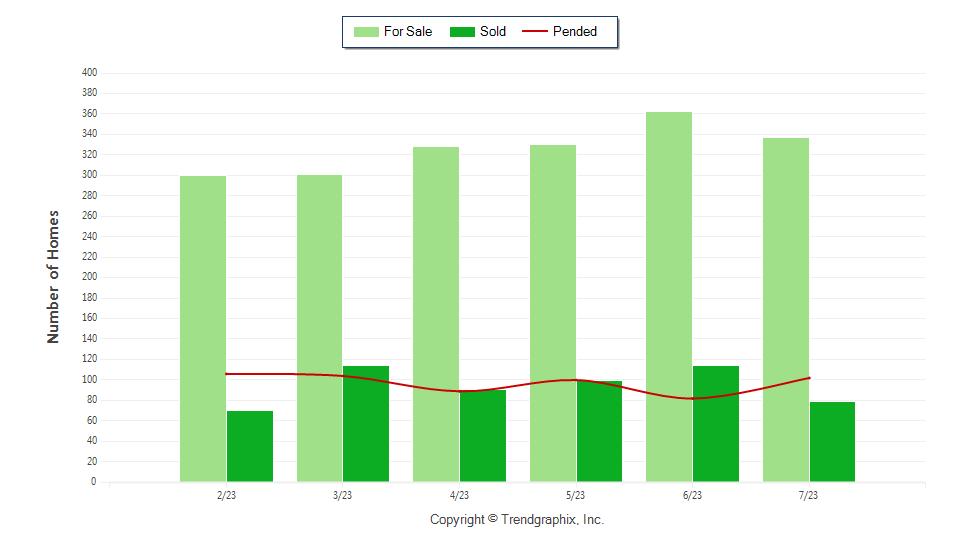
It was a Buyer's Market
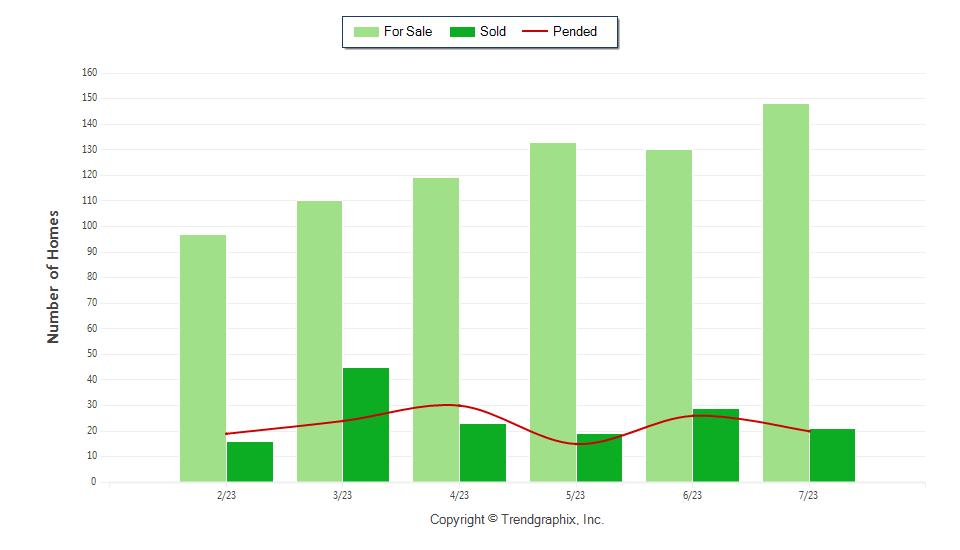
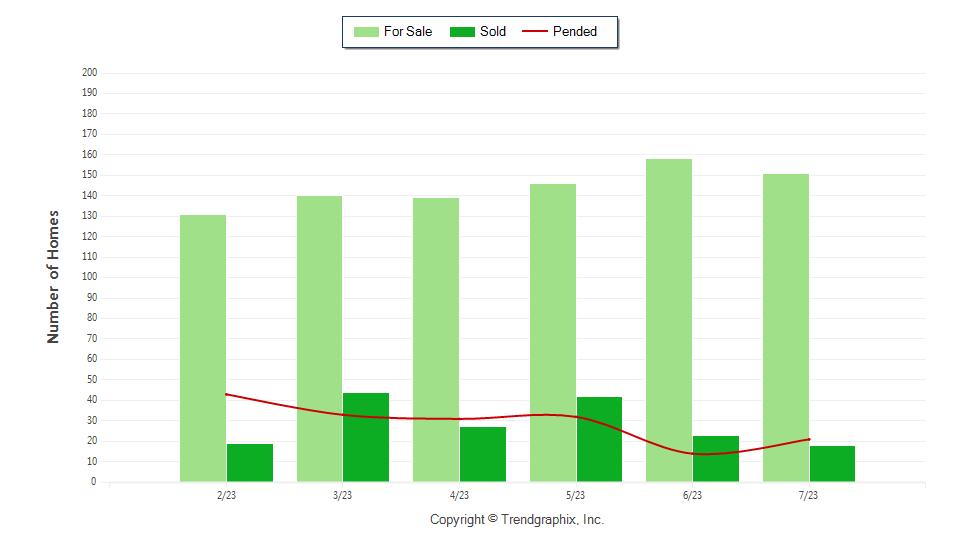
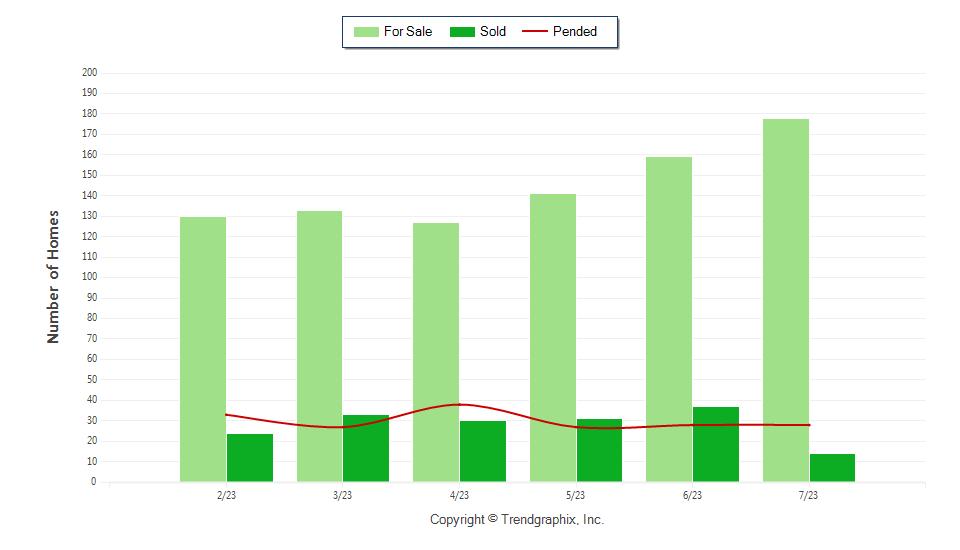
Property Sales (Sold)
July property sales were 67, 22.1% lower than the 86 sales last month.
Current Inventory (For Sale)
The total number of homes available this month was 626. The number of current inventory was up 9.2% compared to the previous month.
Property Under Contract (Pended)
There was a decrease of 28.4% in the pended properties in July, with 58 properties versus 81 last month.
Limit SQFT
0 - No Limit
0 - No Limit Full Baths: 0 - No Limit Half Baths: 0 - No Limit Year Built: 0 - No Limit
$0 - No
Range:
Bedrooms:
All reports are published August 2023, based on data available at the end of July 2023, except for the today’s stats. This representation is based in whole or in part on data supplied by the Central Panhandle AOR, Emerald Coast AOR or its MLS. Neither the Boards nor its MLS guarantees or is in any way responsibles for its accuracy. Data maintained by the Board or its MLSs may not reflect all real estate activity in the market. Report reflects activity by all brokers participated in the MLS.
Garett Huber
Compass
Cell Phone: (850) 830-1801
https://huberluxurygroup.com
Area 17 - 30A
West, Area 18 - 30A East
Published: August 2023*
Property Types: Residential - Detached Single Family
Price Range: $0 - No Limit SQFT Range: 0 - No Limit
Bedrooms: 0 - No Limit
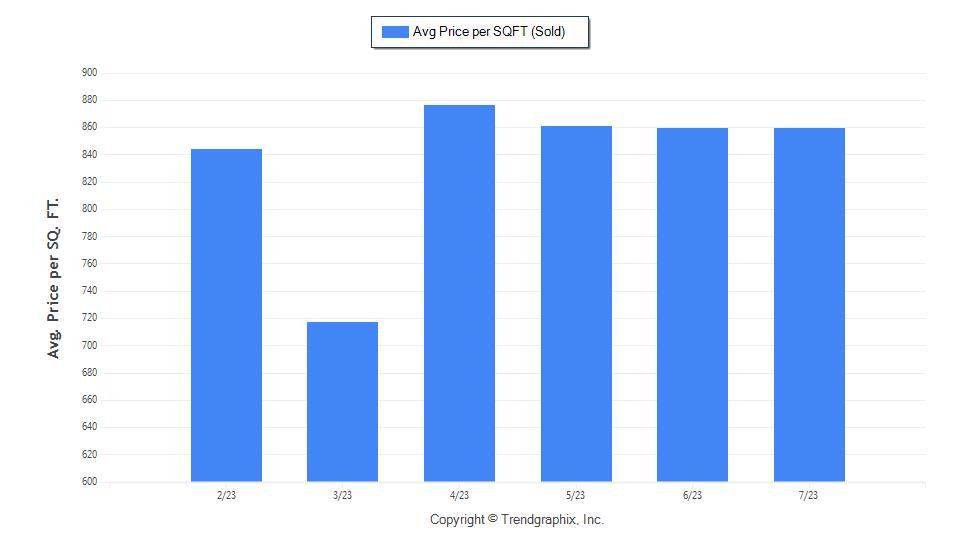
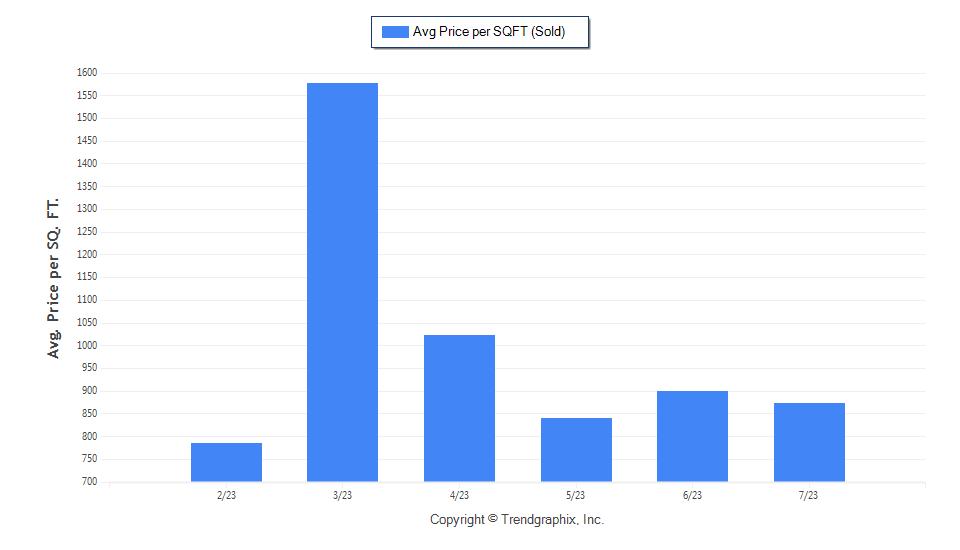
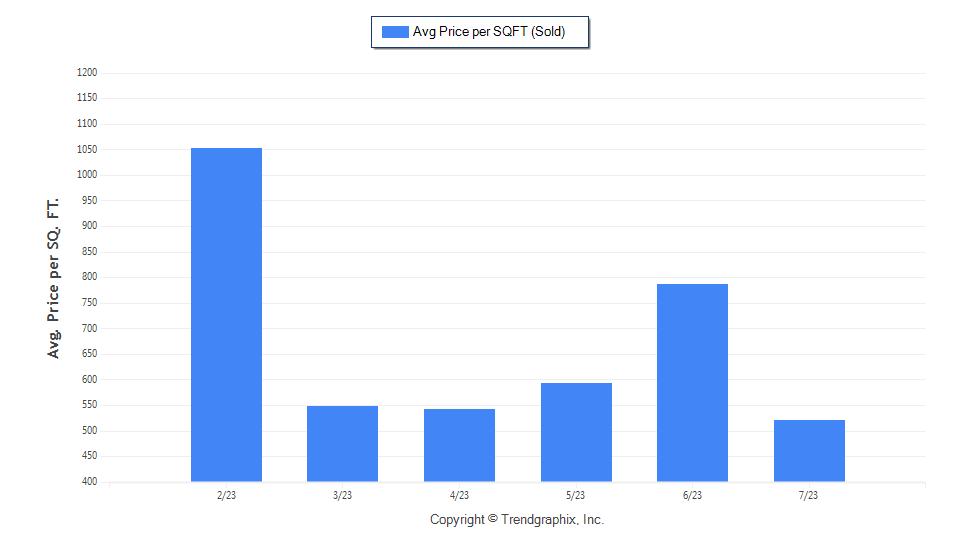
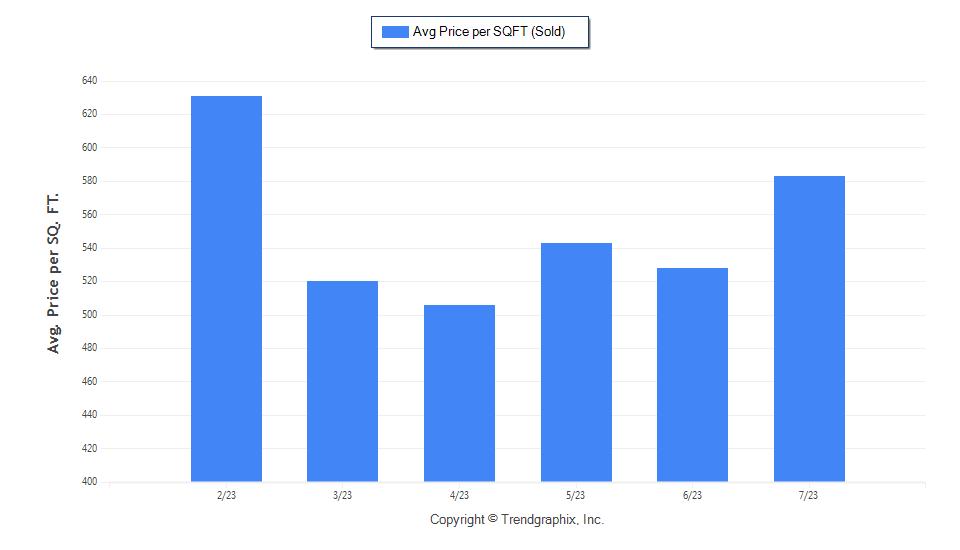
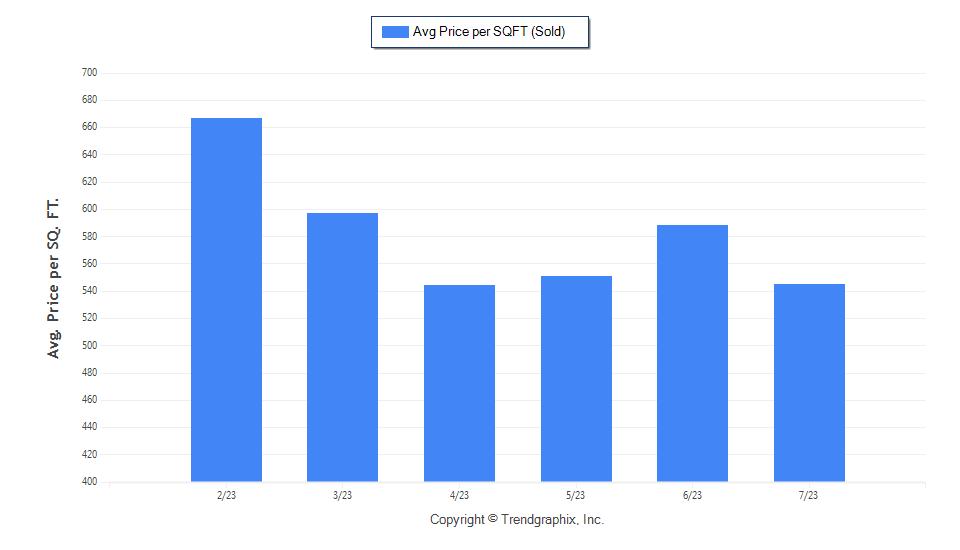
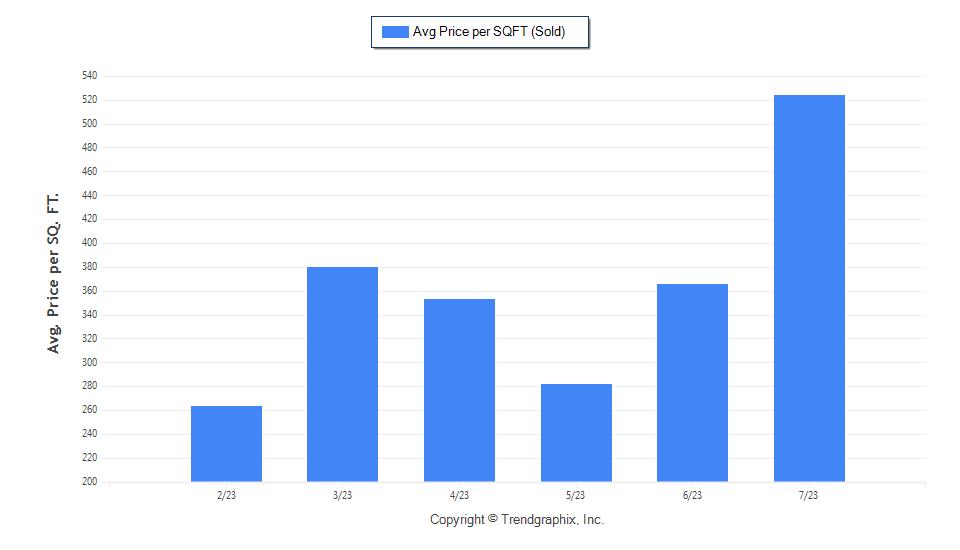
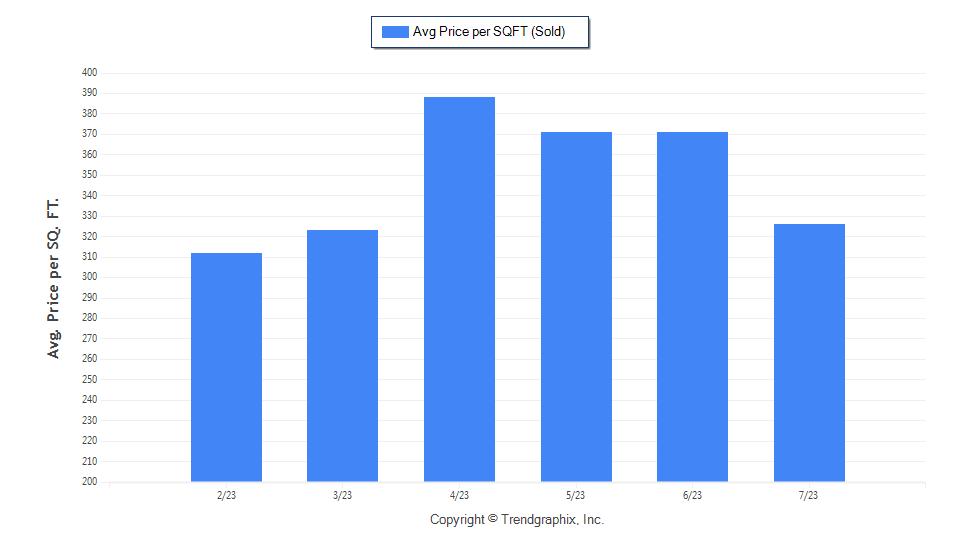
The Average Sold Price per Square Footage was Neutral*
The Average Sold Price per Square Footage is a great indicator for the direction of property values. Since Median Sold Price and Average Sold Price can be impacted by the 'mix' of high or low end properties in the market, the Average Sold Price per Square Footage is a more normalized indicator on the direction of property values. The July 2023 Average Sold Price per Square Footage of $859 was the same as last month.
*Based on 6 month trend – Appreciating/Depreciating/Neutral
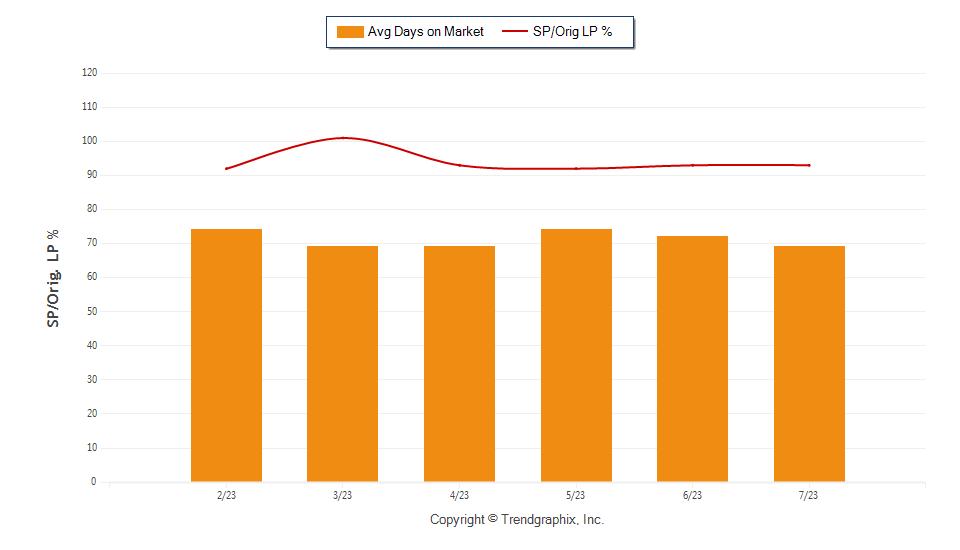
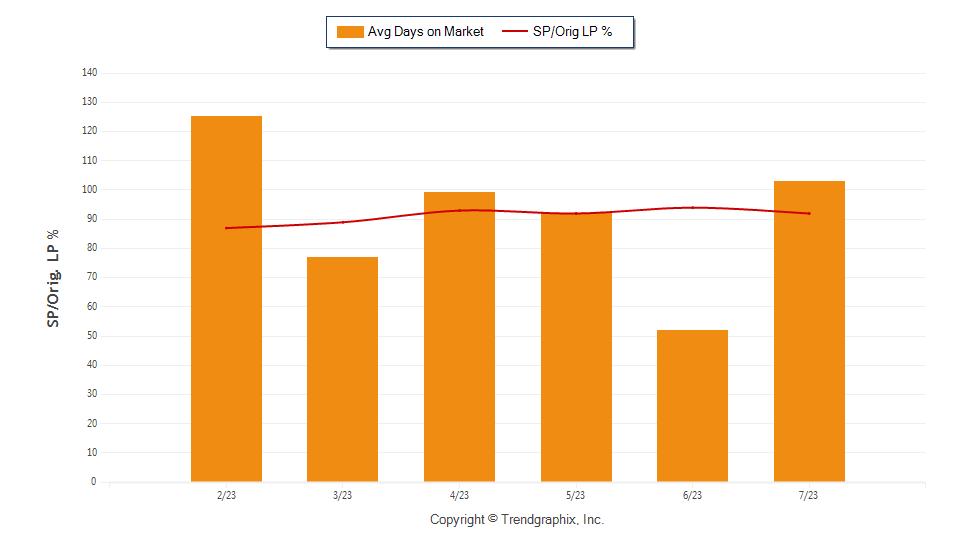
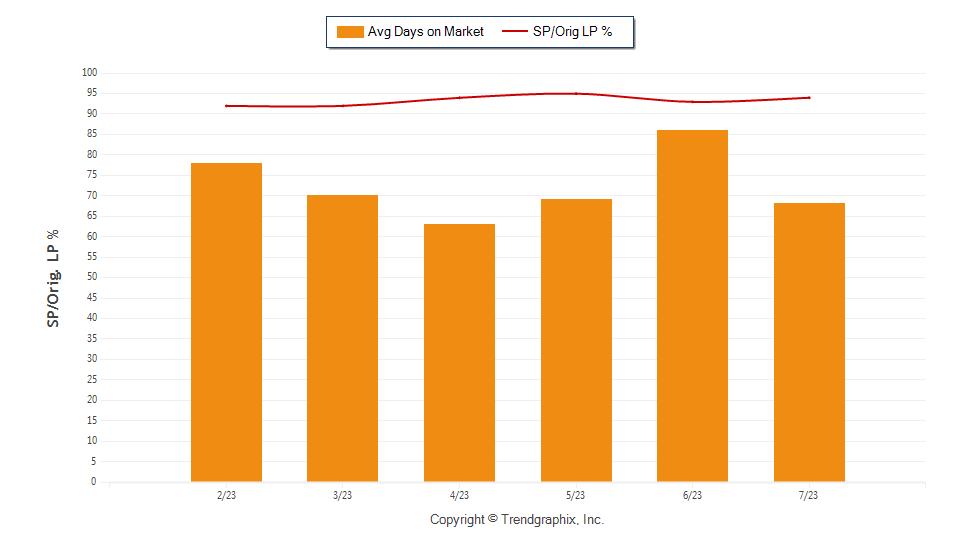
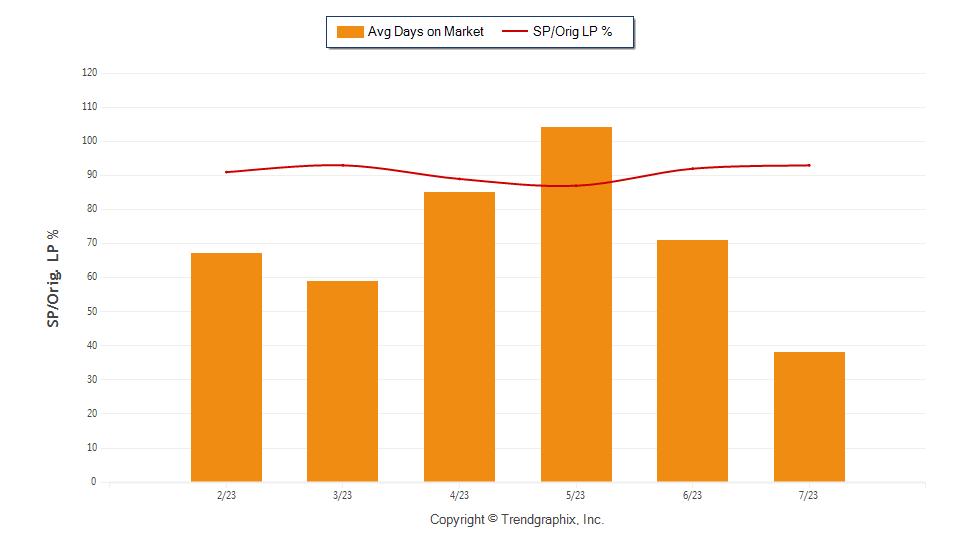
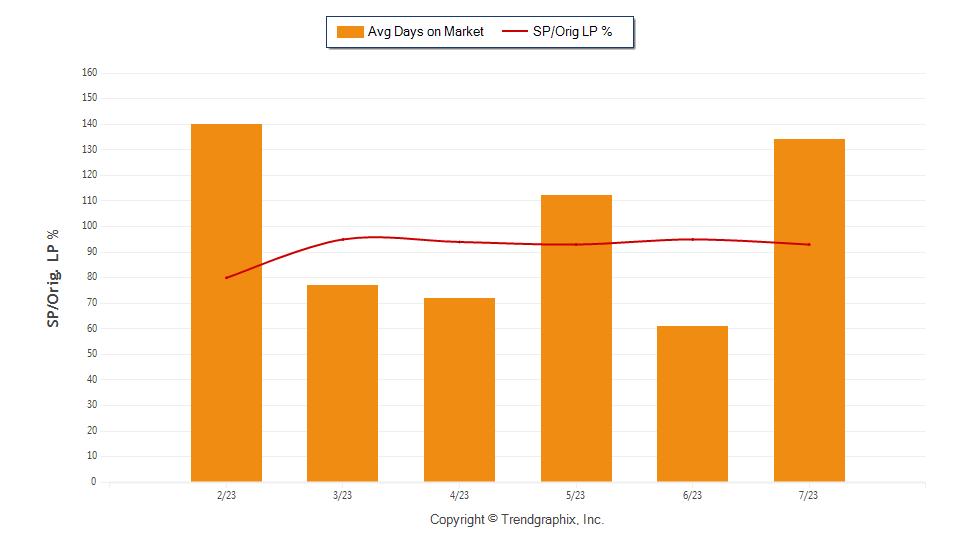
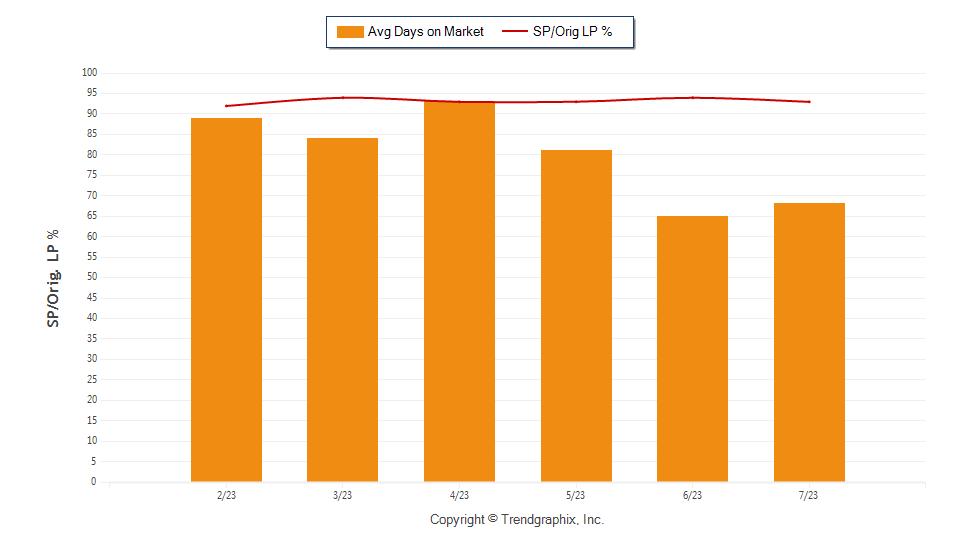
The Days on Market Showed Neutral Trend*
The average Days on Market (DOM) shows how many days the average property is on the market before it sells. An upward trend in DOM trends to indicate a move towards more of a Buyer’s market, a downward trend indicates a move towards more of a Seller’s market. The DOM for July 2023 was 59, down 18.1% from 72 days last month.
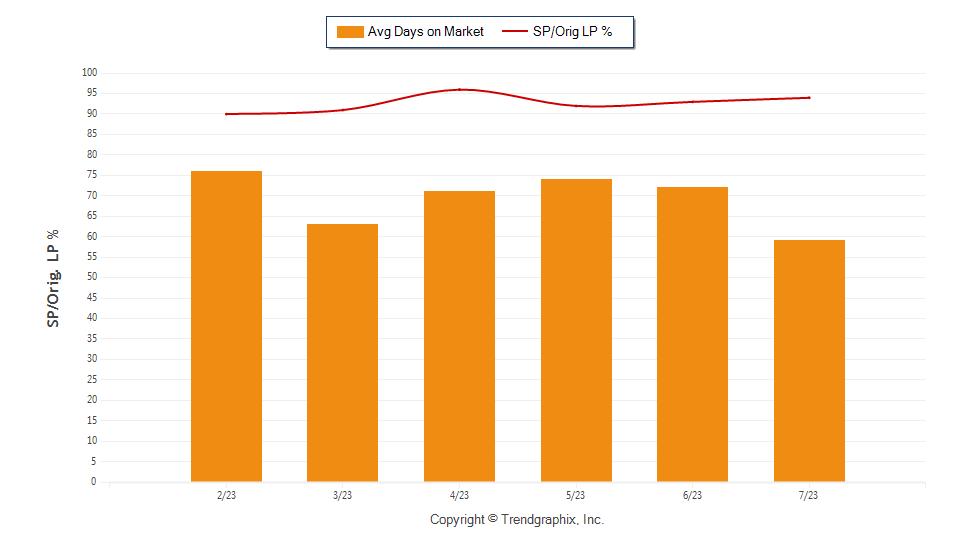
The Sold/Original List Price Ratio was Rising**
The Sold Price vs. Original List Price reveals the average amount that sellers are agreeing to come down from their original list price. The lower the ratio is below 100% the more of a Buyer’s market exists, a ratio at or above 100% indicates more of a Seller’s market. This month Sold Price vs. Original List Price of 94% was up 1.1% % from last month.
*Based on 6 month trend – Upward/Downward/Neutral
** Based on 6 month trend – Rising/Falling/Remains Steady
Full
Limit Year
Baths: 0 - No Limit Half Baths: 0 - No
Built: 0 - No Limit
All reports are published August 2023, based on data available at the end of July 2023, except for the today’s stats. This representation is based in whole or in part on data supplied by the Central Panhandle AOR, Emerald Coast AOR or its MLS. Neither the Boards nor its MLS guarantees or is in any way responsibles for its accuracy. Data maintained by the Board or its MLSs may not reflect all real estate activity in the market. Report reflects activity by all brokers participated in the MLS.
Garett Huber
Compass
Cell Phone: (850) 830-1801
https://huberluxurygroup.com
Area 17 - 30A
West, Area 18 - 30A East
Published: August 2023*
Property Types: Residential - Detached Single Family
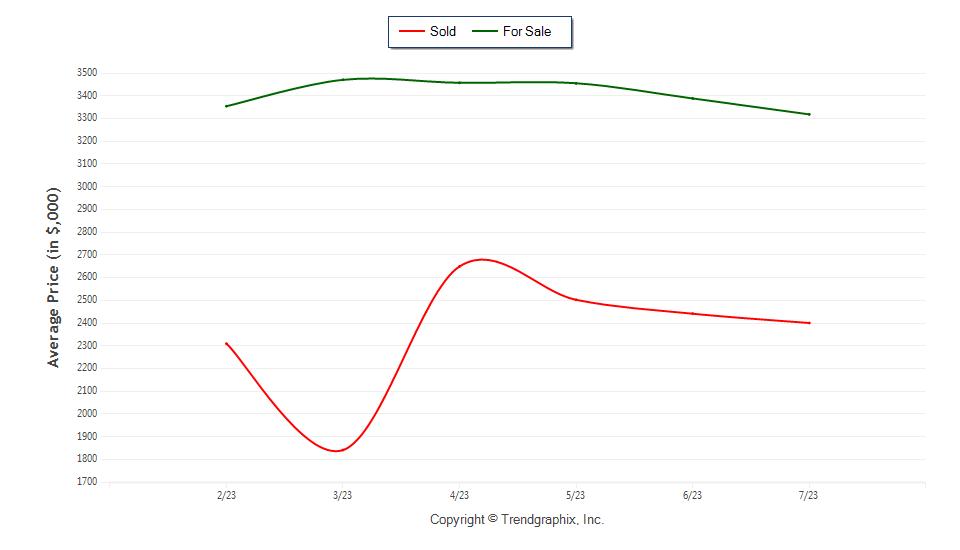
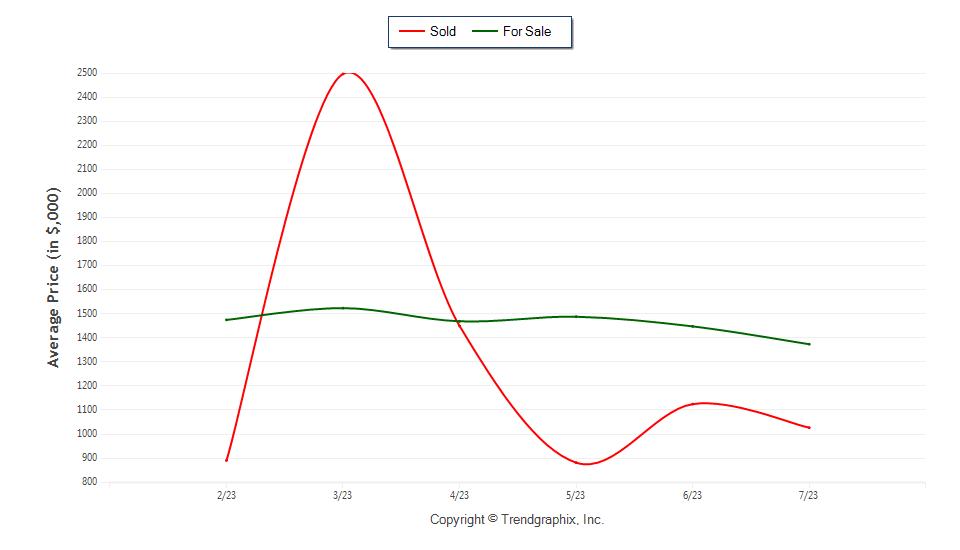
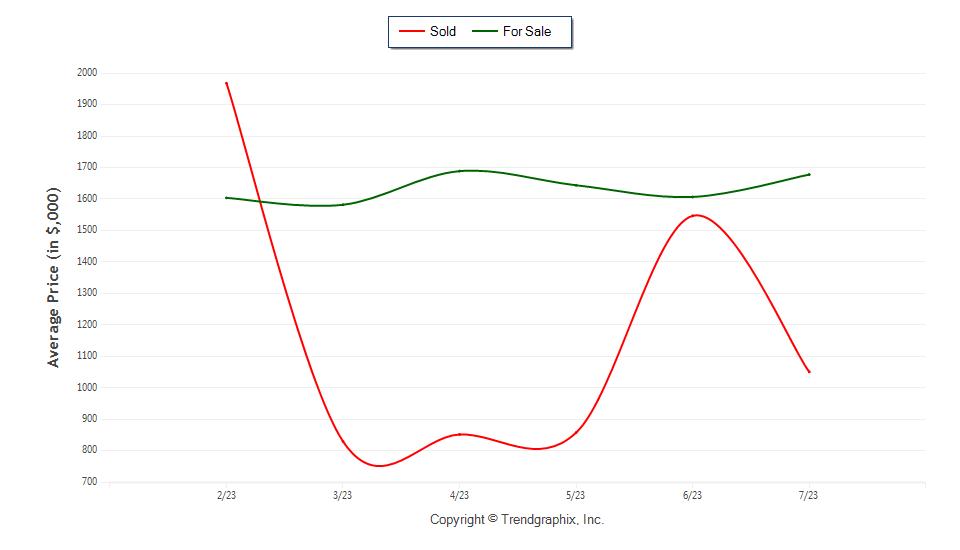
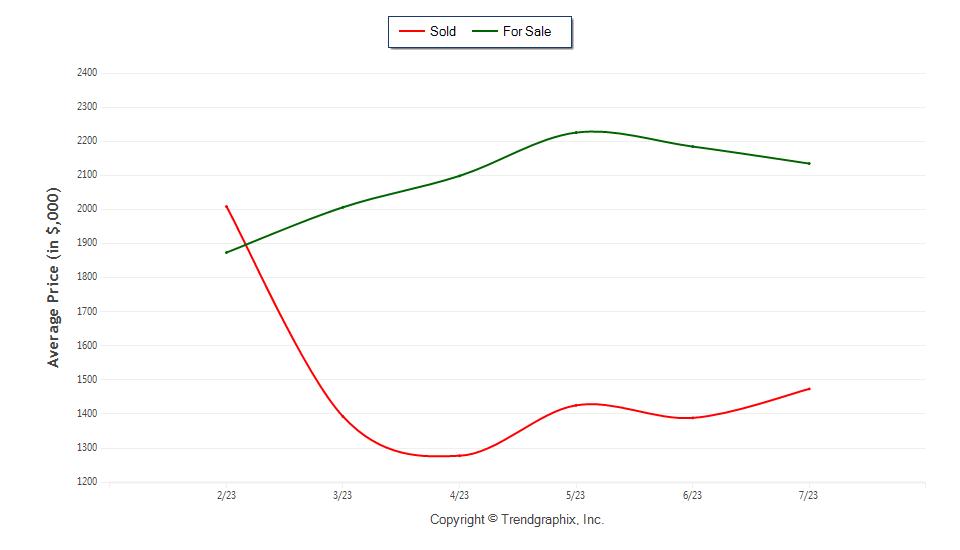
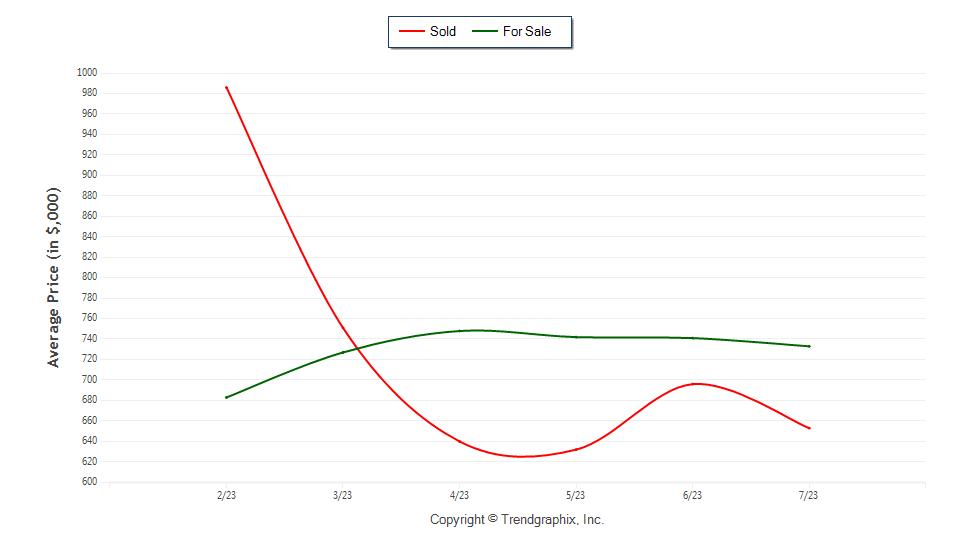
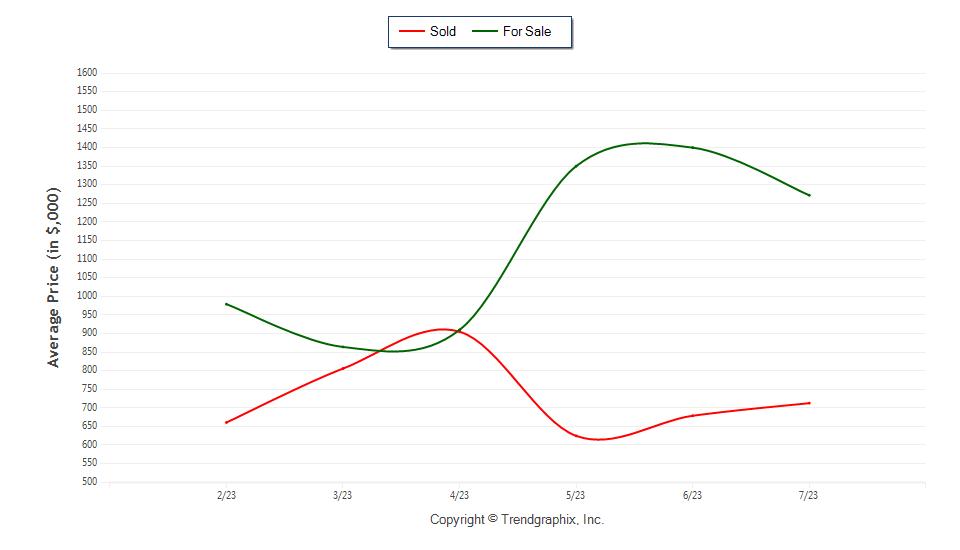
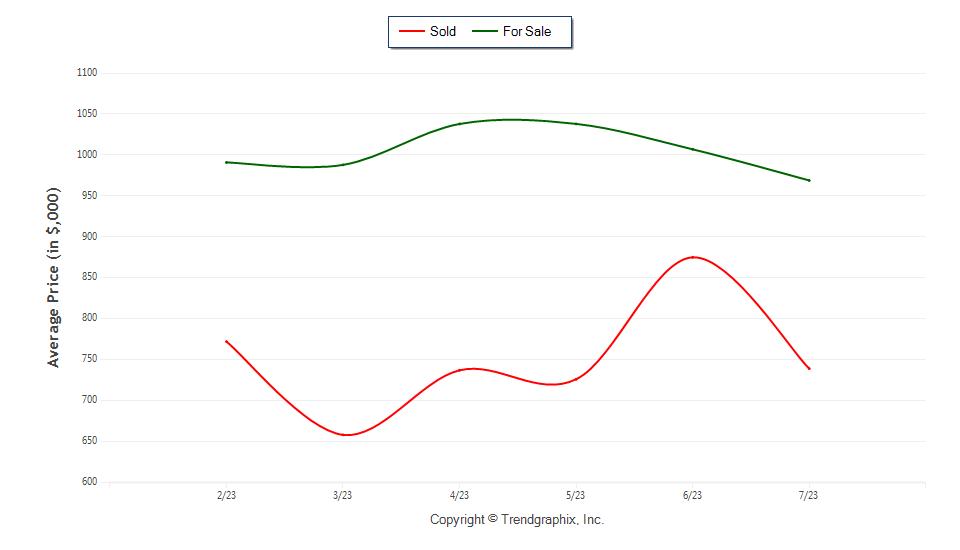
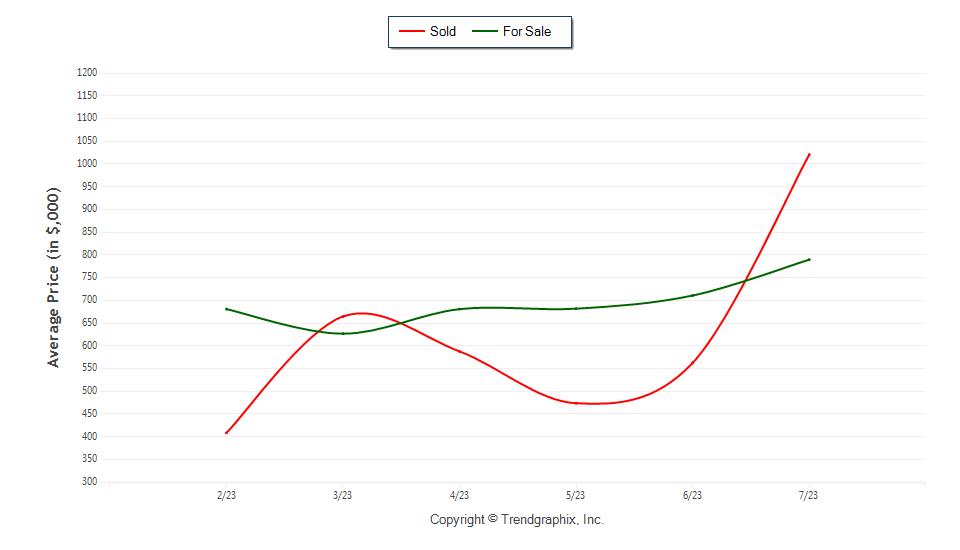
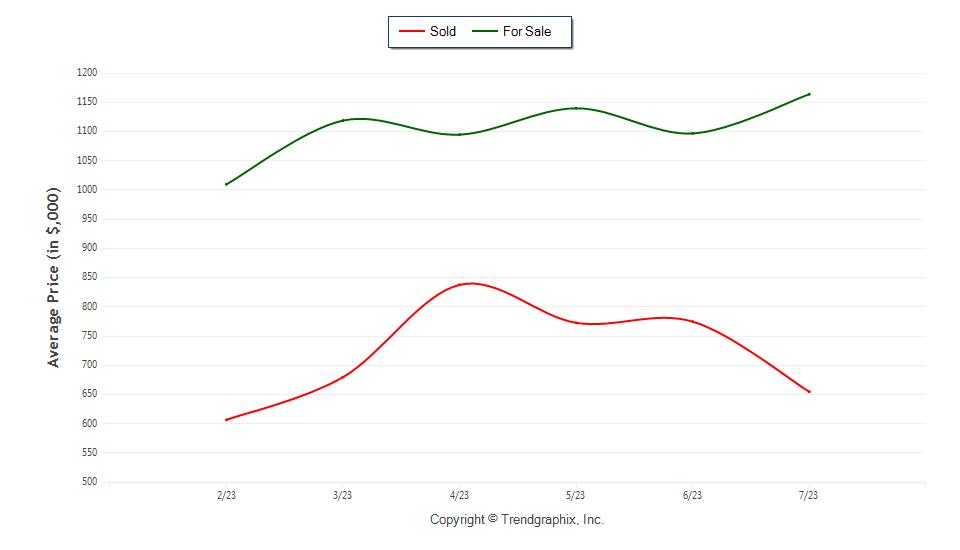
The Average For Sale Price was Depreciating*
The Average For Sale Price in July was $3,319,000, down 2.1% from $3,389,000 last month.
The Average Sold Price was Neutral*
The Average Sold Price in July was $2,401,000, down 1.7% from $2,442,000 last month.
The Median Sold Price was Neutral*
The Median Sold Price in July was $1,600,000, down 1.4% from $1,623,000 last month.
*Based on 6 month trend – Appreciating/Depreciating/Neutral
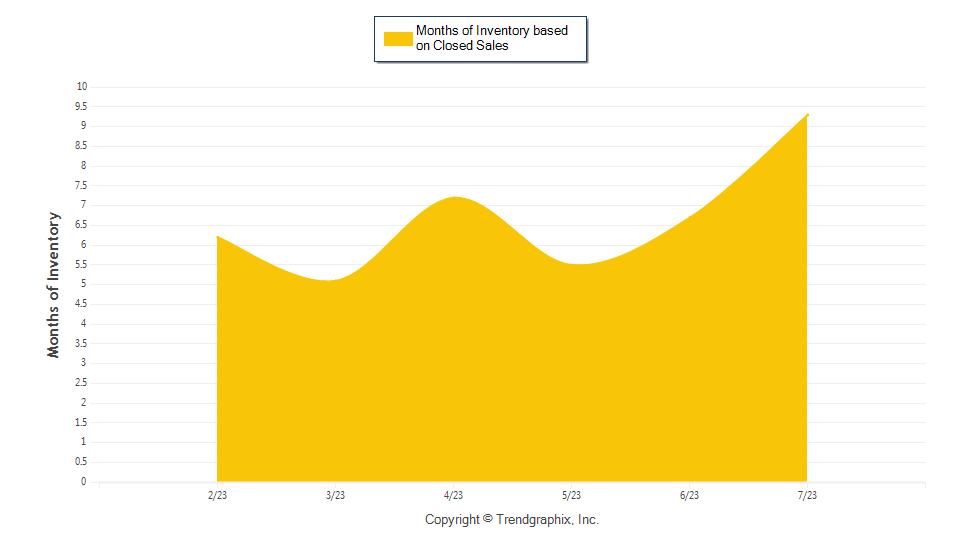
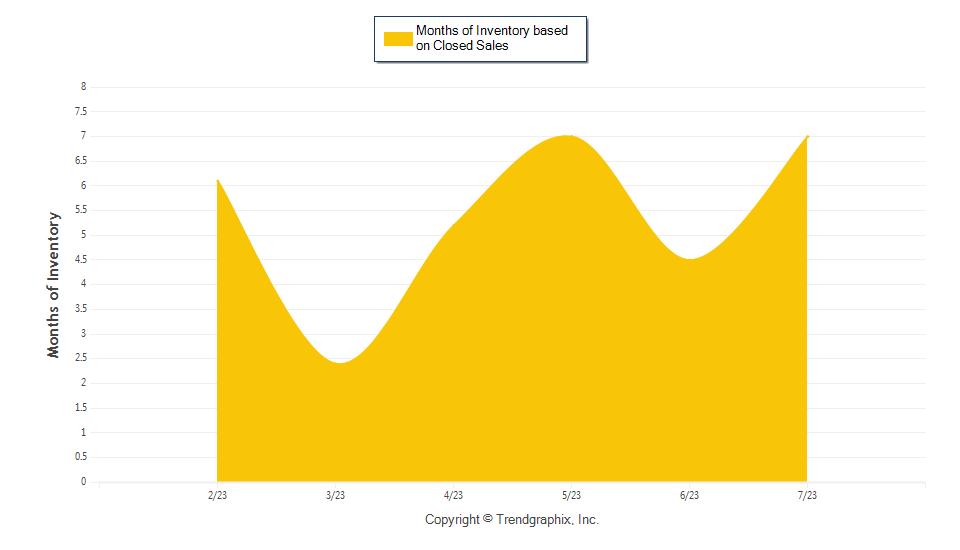
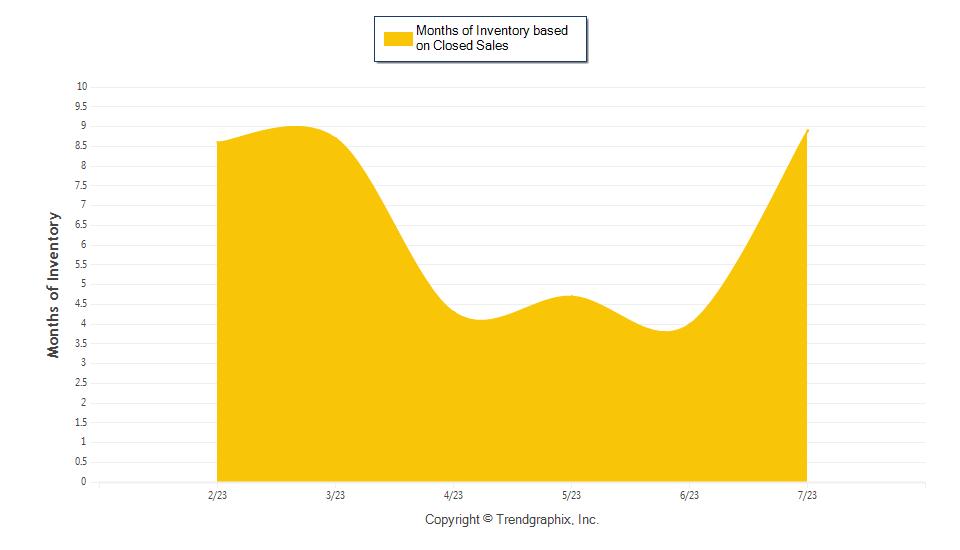
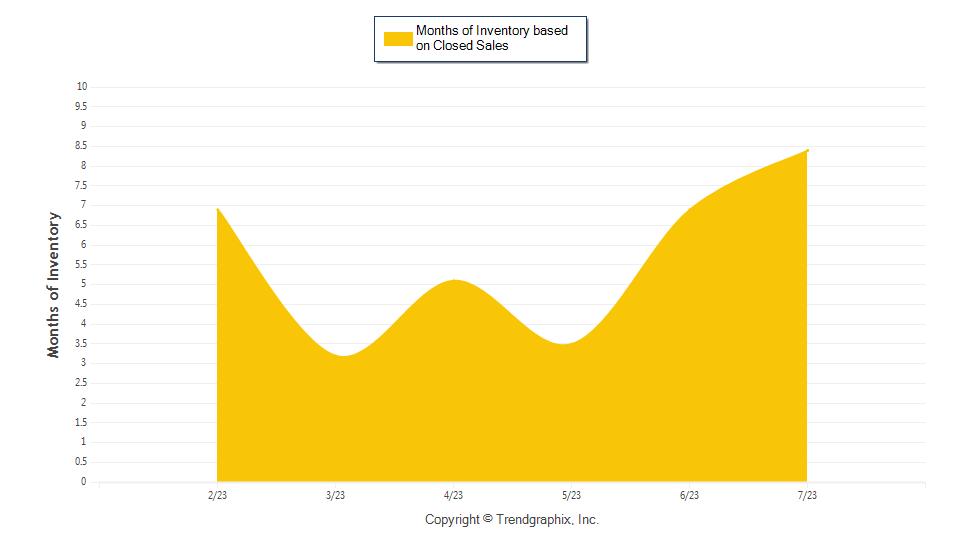
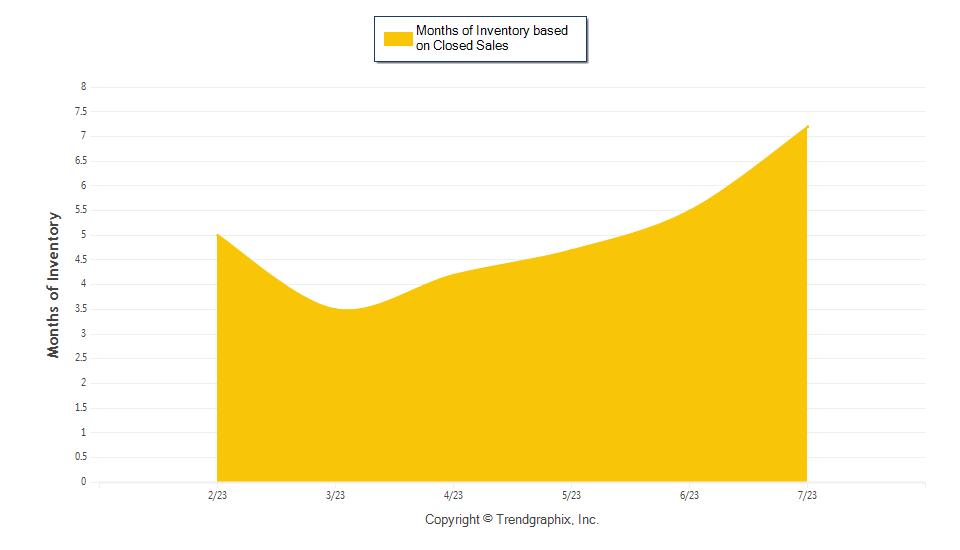
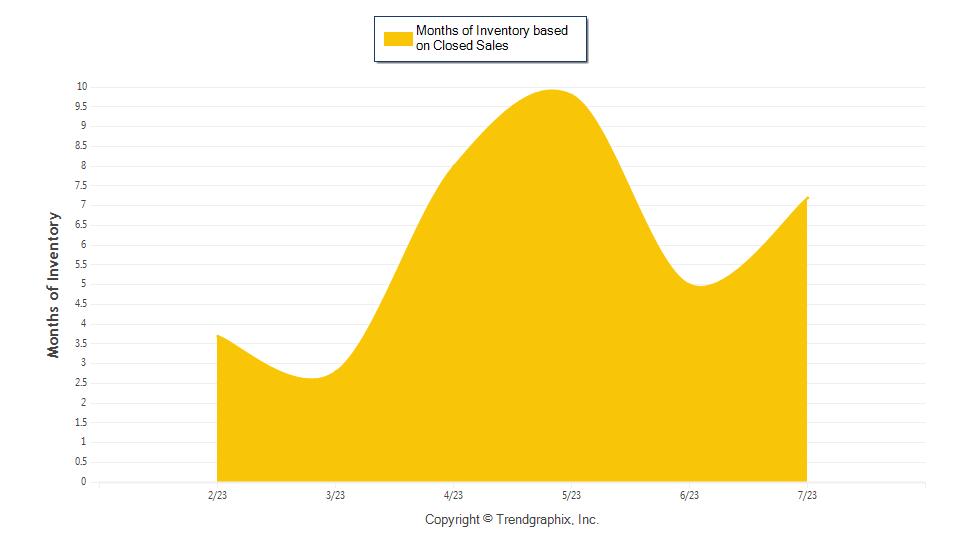
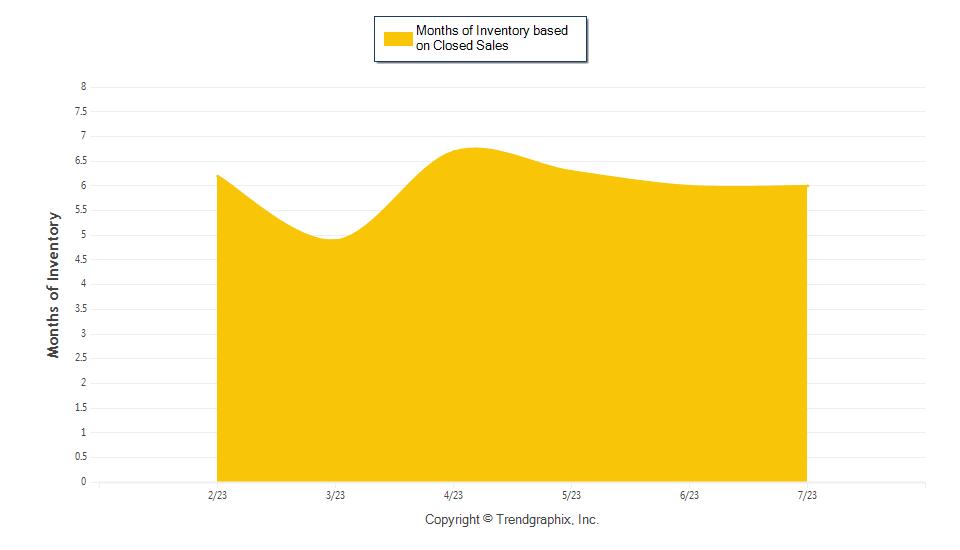
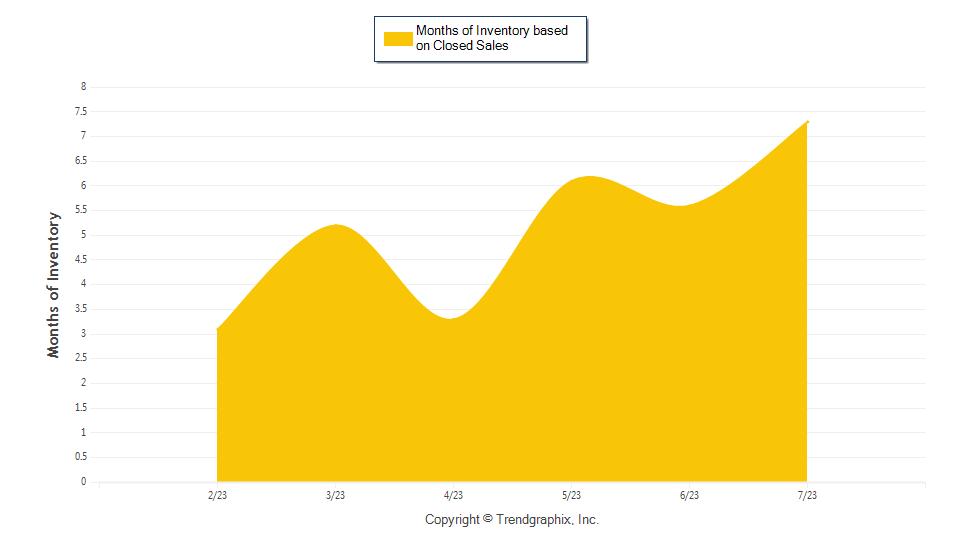
It was a Buyer's Market*
A comparatively lower Months of Inventory is more beneficial for sellers while a higher months of inventory is better for buyers.
*Buyer’s market: more than 6 months of inventory
Seller’s market: less than 3 months of inventory
Neutral market: 3 – 6 months of inventory
Months of Inventory based on Closed Sales
The July 2023 Months of Inventory based on Closed Sales of 9.3 was up 39% compared to last month. July 2023 was Buyer's market.
Months of Inventory based on Pended Sales
The July 2023 Months of Inventory based on Pended Sales of 10.8 was up 52.3% compared to last month. July 2023 was Buyer's market.
Limit SQFT Range:
No Limit Bedrooms:
Limit Full Baths: 0 - No Limit Half Baths: 0 - No Limit Year Built: 0 - No Limit
Price Range: $0 - No
0 -
0 - No
All reports are published August 2023, based on data available at the end of July 2023, except for the today’s stats. This representation is based in whole or in part on data supplied by the Central Panhandle AOR, Emerald Coast AOR or its MLS. Neither the Boards nor its MLS guarantees or is in any way responsibles for its accuracy. Data maintained by the Board or its MLSs may not reflect all real estate activity in the market. Report reflects activity by all brokers participated in the MLS.
Garett Huber
Compass
Cell Phone: (850) 830-1801
https://huberluxurygroup.com
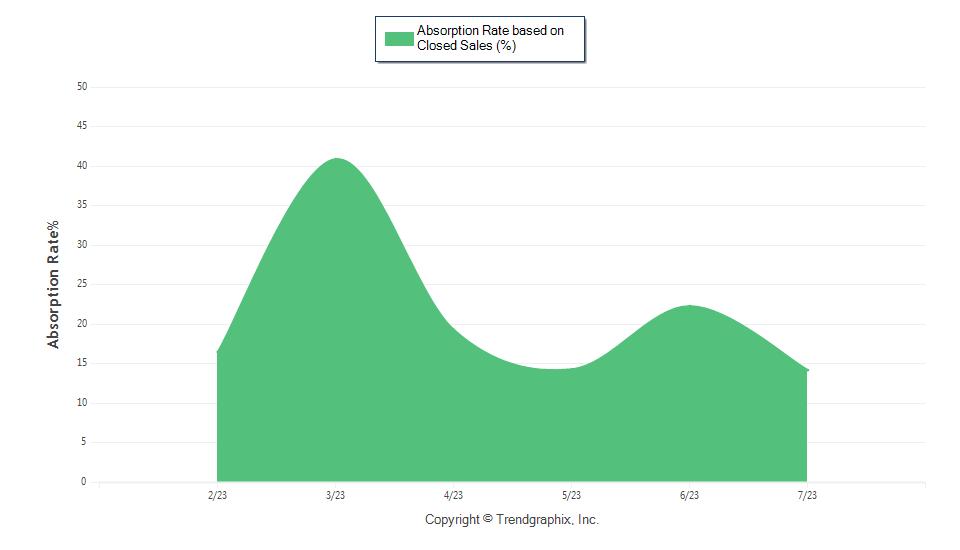
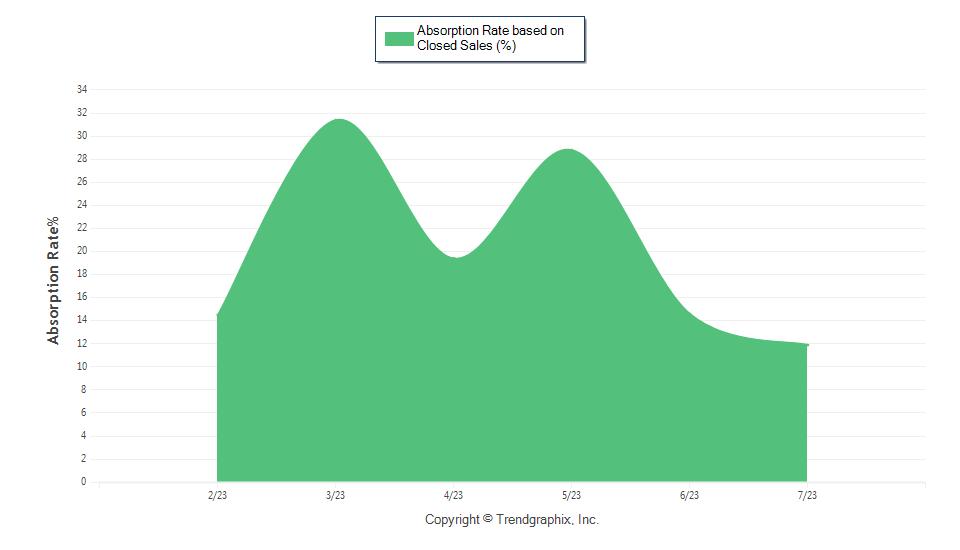
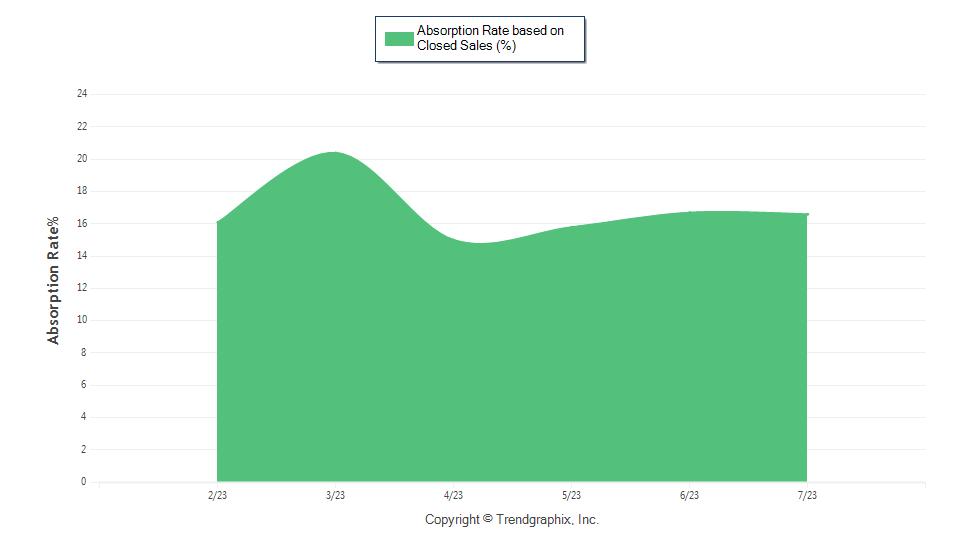
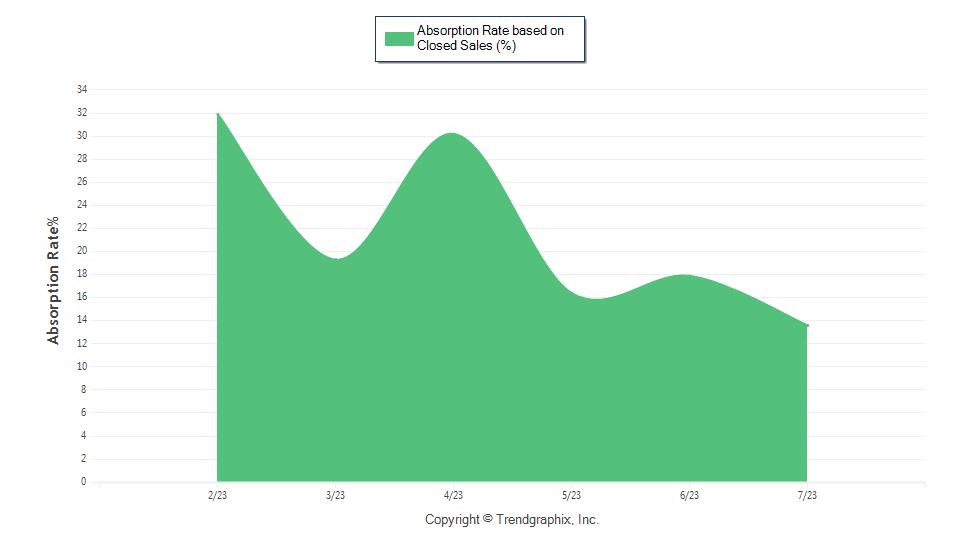
It was a Buyer's Market*
Area 17 - 30A
West, Area 18 - 30A East
Published: August 2023*
Property Types: Residential - Detached Single Family
Price Range: $0 - No Limit SQFT Range: 0 - No Limit
Bedrooms: 0 - No Limit Full Baths: 0 - No Limit
Half Baths: 0 - No
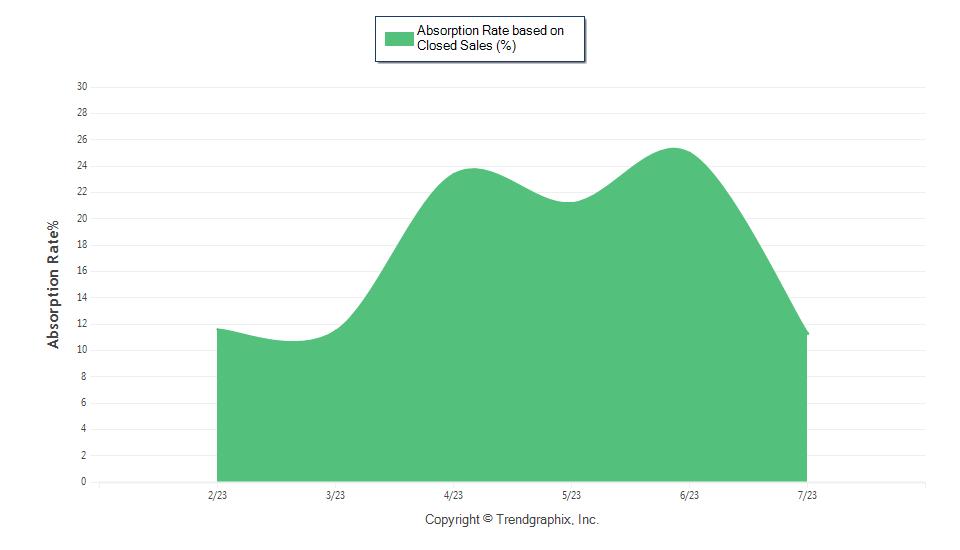
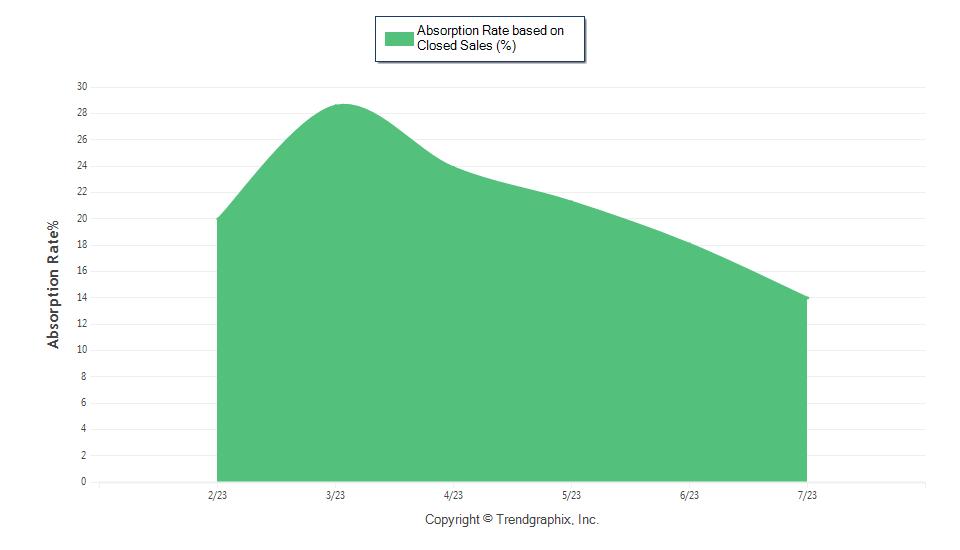
Absorption Rate measures the inverse of Months of Inventory and represents how much of the current active listings (as a percentage) are being absorbed each month.
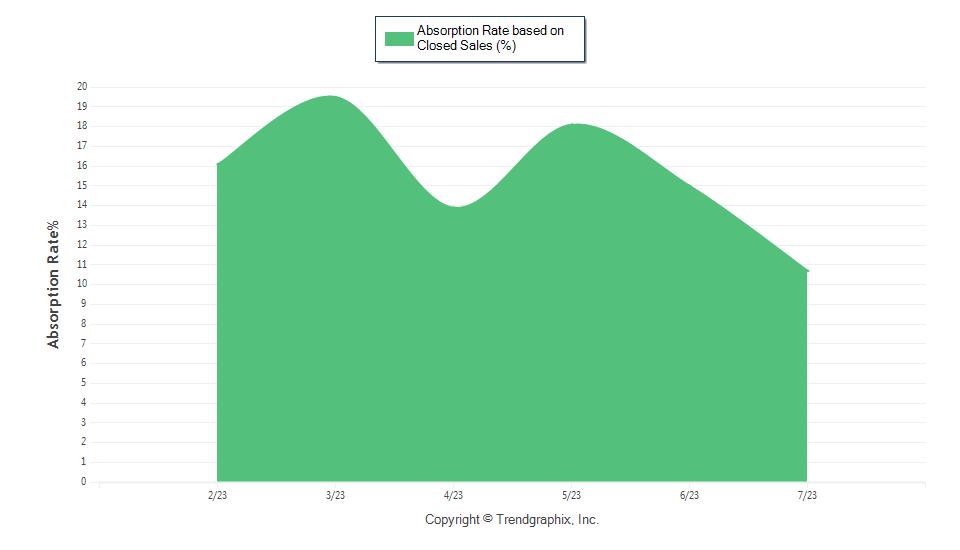
*Buyer’s market: 16.67% and below
Seller’s market: 33.33% and above
Neutral market: 16.67% - 33.33%
Absorption Rate based on Closed Sales
The July 2023 Absorption Rate based on Closed Sales of 10.7 was down 28.6% compared to last month.
Absorption Rate based on Pended Sales
The July 2023 Absorption Rate based on Pended Sales of 9.3 was down 34% compared to last month.
Limit
Limit
Year Built: 0 - No
All reports are published August 2023, based on data available at the end of
Boards nor its MLS guarantees or is in any way responsibles for
July 2023,
except for the today’s stats. This representation is based in whole or in part on data supplied by the Central Panhandle AOR, Emerald Coast AOR or its MLS. Neither the
its
accuracy. Data maintained by the Board or its MLSs may not reflect all real estate activity in the market. Report reflects activity by all brokers participated in the MLS.
Garett Huber
Compass
Cell Phone: (850) 830-1801
https://huberluxurygroup.com
Area 17 - 30A West, Area 18 - 30A East
Published: August 2023*
Property Types: Residential - Condo
30A Area Report - Condo
July 2023 was a Buyer's market! The number of for sale listings was up 13.8% from the previous month. The number of sold listings decreased 27.6% month over month. The number of under contract listings was down 23.1% compared to previous month. The Months of Inventory based on Closed Sales was 7.
The Average Sold Price per Square Footage was down 2.9% compared to previous month. The Median Sold Price decreased by 17.2% from last month. The Average Sold Price also decreased by 8.7% from last month. Based on the 6 month trend, the Average Sold Price trend was "Neutral" and the Median Sold Price trend was "Neutral".
The Average Days on Market showed a neutral trend. The ratio of Sold Price vs. Original List Price was 93%.
It was a Buyer's Market
Property Sales (Sold)
July property sales were 21, 27.6% lower than the 29 sales last month.
Current Inventory (For Sale)
The total number of homes available this month was 148. The number of current inventory was up 13.8% compared to the previous month.
Property Under Contract (Pended)
There was a decrease of 23.1% in the pended properties in July, with 20 properties versus 26 last month.
SQFT
Limit
No Limit Full Baths: 0 - No Limit
Baths: 0 - No Limit Year Built: 0 - No Limit
Price Range: $0 - No Limit
Range: 0 - No
Bedrooms: 0 -
Half
All reports are published August 2023, based on data available at the end of July 2023, except for the today’s stats. This representation is based in whole or in part on data supplied by the Central Panhandle AOR, Emerald Coast AOR or its MLS. Neither the Boards nor its MLS guarantees or is in any way responsibles for its accuracy. Data maintained by the Board or its MLSs may not reflect all real estate activity in the market. Report reflects activity by all brokers participated in the MLS.
Garett Huber
Compass
Cell Phone: (850) 830-1801
https://huberluxurygroup.com
Area 17 - 30A
West, Area 18 - 30A East
Published: August 2023*
Property Types: Residential - Condo
Price Range: $0 - No Limit
Bedrooms: 0 - No
The Average Sold Price per Square Footage was Neutral*
The Average Sold Price per Square Footage is a great indicator for the direction of property values. Since Median Sold Price and Average Sold Price can be impacted by the 'mix' of high or low end properties in the market, the Average Sold Price per Square Footage is a more normalized indicator on the direction of property values. The July 2023 Average Sold Price per Square Footage of $874 was down 2.9% from $900 last month.
*Based on 6 month trend – Appreciating/Depreciating/Neutral
SQFT Range: 0 - No Limit
The Days on Market Showed Neutral Trend*
The average Days on Market (DOM) shows how many days the average property is on the market before it sells. An upward trend in DOM trends to indicate a move towards more of a Buyer’s market, a downward trend indicates a move towards more of a Seller’s market. The DOM for July 2023 was 69, down 4.2% from 72 days last month.
The Sold/Original List Price Ratio Remains Steady**
The Sold Price vs. Original List Price reveals the average amount that sellers are agreeing to come down from their original list price. The lower the ratio is below 100% the more of a Buyer’s market exists, a ratio at or above 100% indicates more of a Seller’s market. This month Sold Price vs. Original List Price of 93% was the same as last month.
*Based on 6 month trend – Upward/Downward/Neutral
** Based on 6 month trend – Rising/Falling/Remains Steady
Full
Limit
Baths: 0 - No Limit
Limit Year
Limit
Half Baths: 0 - No
Built: 0 - No
All reports are published August 2023, based on data available at the end of July 2023, except for the today’s stats. This representation is based in whole or in part on data supplied by the Central Panhandle AOR, Emerald Coast AOR or its MLS. Neither the Boards nor its MLS guarantees or is in any way responsibles for its accuracy. Data maintained by the Board or its MLSs may not reflect all real estate activity in the market. Report reflects activity by all brokers participated in the MLS.
Garett Huber
Compass
Cell Phone: (850) 830-1801
https://huberluxurygroup.com
Area 17 - 30A
West, Area 18 - 30A East
Published: August 2023*
Property Types: Residential - Condo Price Range: $0 - No
The Average For Sale Price was Depreciating*
The Average For Sale Price in July was $1,374,000, down 5.1% from $1,448,000 last month.
The Average Sold Price was Neutral*
The Average Sold Price in July was $1,027,000, down 8.7% from $1,125,000 last month.
The Median Sold Price was Neutral*
The Median Sold Price in July was $795,000, down 17.2% from $960,000 last month.
*Based on 6 month trend – Appreciating/Depreciating/Neutral
It was a Buyer's Market*
A comparatively lower Months of Inventory is more beneficial for sellers while a higher months of inventory is better for buyers.
*Buyer’s market: more than 6 months of inventory
Seller’s market: less than 3 months of inventory
Neutral market: 3 – 6 months of inventory
Months of Inventory based on Closed Sales
The July 2023 Months of Inventory based on Closed Sales of 7 was up 55.8% compared to last month. July 2023 was Buyer's market.
Months of Inventory based on Pended Sales
The July 2023 Months of Inventory based on Pended Sales of 7.4 was up 48% compared to last month. July 2023 was Buyer's market.
Limit
Limit Full Baths:
- No Limit
Baths: 0
Limit Year Built: 0 - No Limit
Limit SQFT Range: 0 - No
Bedrooms: 0 - No
0
Half
- No
All reports are published August 2023, based on data available at the end of July 2023, except for the today’s stats. This representation is based in whole or in part on data supplied by the Central Panhandle AOR, Emerald Coast AOR or its MLS. Neither the Boards nor its MLS guarantees or is in any way responsibles for its accuracy. Data maintained by the Board or its MLSs may not reflect all real estate activity in the market. Report reflects activity by all brokers participated in the MLS.
Garett Huber
Compass
Cell Phone: (850) 830-1801
https://huberluxurygroup.com
It was a Buyer's Market*
Area 17 - 30A
West, Area 18 - 30A East
Published: August 2023*
Property Types: Residential - Condo
Price Range: $0 - No Limit
SQFT Range: 0 - No Limit
Bedrooms: 0 - No Limit Full Baths: 0 - No Limit
Half Baths: 0 - No
Absorption Rate measures the inverse of Months of Inventory and represents how much of the current active listings (as a percentage) are being absorbed each month.
*Buyer’s market: 16.67% and below
Seller’s market: 33.33% and above
Neutral market: 16.67% - 33.33%
Absorption Rate based on Closed Sales
The July 2023 Absorption Rate based on Closed Sales of 14.2 was down 36.3% compared to last month.
Absorption Rate based on Pended Sales
The July 2023 Absorption Rate based on Pended Sales of 13.5 was down 32.5% compared to last month.
Limit Year Built: 0 - No Limit
All reports are published August 2023, based on data available at the end of
Boards nor its MLS guarantees or is in any way responsibles for
July 2023,
except for the today’s stats. This representation is based in whole or in part on data supplied by the Central Panhandle AOR, Emerald Coast AOR or its MLS. Neither the
its
accuracy. Data maintained by the Board or its MLSs may not reflect all real estate activity in the market. Report reflects activity by all brokers participated in the MLS.
Garett Huber
Compass
Cell Phone: (850) 830-1801
https://huberluxurygroup.com
Area 17 - 30A West, Area 18 - 30A East
Published: August 2023*
Property Types: Residential - Attached Single
30A Area Report - Townhome
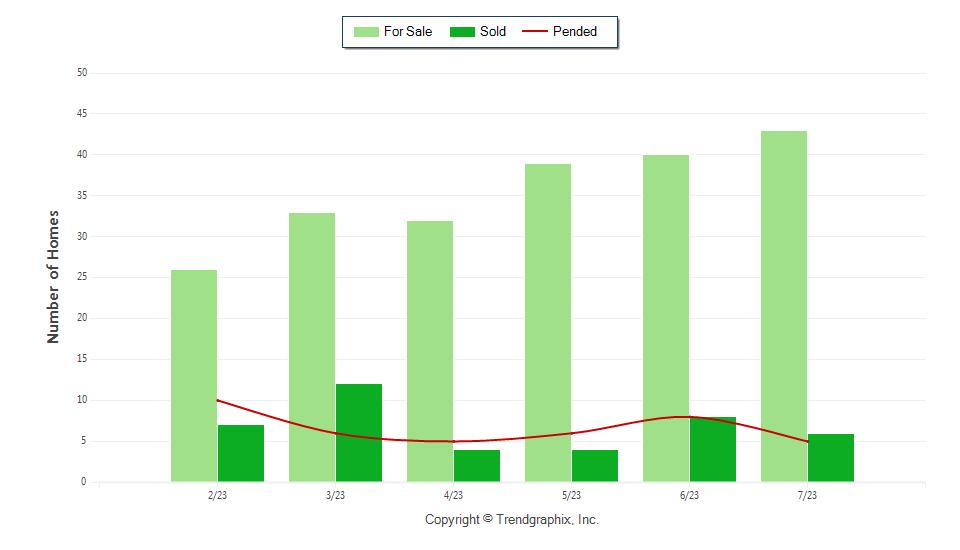
July 2023 was a Buyer's market! The number of for sale listings was up 19.2% from the previous month. The number of sold listings decreased 46.2% month over month. The number of under contract listings was down 33.3% compared to previous month. The Months of Inventory based on Closed Sales was 8.9.
The Average Sold Price per Square Footage was down 33.8% compared to previous month. The Median Sold Price decreased by 6.5% from last month. The Average Sold Price also decreased by 32.1% from last month. Based on the 6 month trend, the Average Sold Price trend was "Neutral" and the Median Sold Price trend was "Neutral".
The Average Days on Market showed a upward trend. The ratio of Sold Price vs. Original List Price was 91%.
It was a Buyer's Market
Property Sales (Sold)
July property sales were 7, 46.2% lower than the 13 sales last month.
Current Inventory (For Sale)
The total number of homes available this month was 62. The number of current inventory was up 19.2% compared to the previous month.
Property Under Contract (Pended)
There was a decrease of 33.3% in the pended properties in July, with 8 properties versus 12 last month.
Unit
$0 - No Limit SQFT Range: 0 - No Limit
0 - No Limit Full Baths: 0 - No Limit
Baths: 0 - No Limit Year Built: 0 - No Limit
Price Range:
Bedrooms:
Half
All reports are published August 2023, based on data available at the end of July 2023, except for the today’s stats. This representation is based in whole or in part on data supplied by the Central Panhandle AOR, Emerald Coast AOR or its MLS. Neither the Boards nor its MLS guarantees or is in any way responsibles for its accuracy. Data maintained by the Board or its MLSs may not reflect all real estate activity in the market. Report reflects activity by all brokers participated in the MLS.
Garett Huber
Compass
Cell Phone: (850) 830-1801
https://huberluxurygroup.com
Area 17 - 30A
West, Area 18 - 30A East
Published: August 2023*
Property Types: Residential - Attached Single Unit
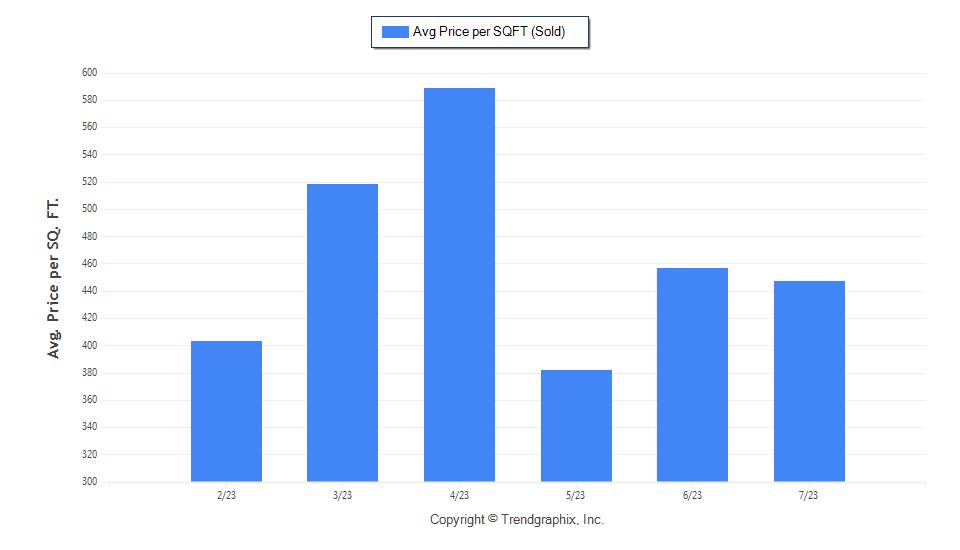
The Average Sold Price per Square Footage was Depreciating*
The Average Sold Price per Square Footage is a great indicator for the direction of property values. Since Median Sold Price and Average Sold Price can be impacted by the 'mix' of high or low end properties in the market, the Average Sold Price per Square Footage is a more normalized indicator on the direction of property values. The July 2023 Average Sold Price per Square Footage of $521 was down 33.8% from $787 last month.
*Based on 6 month trend – Appreciating/Depreciating/Neutral
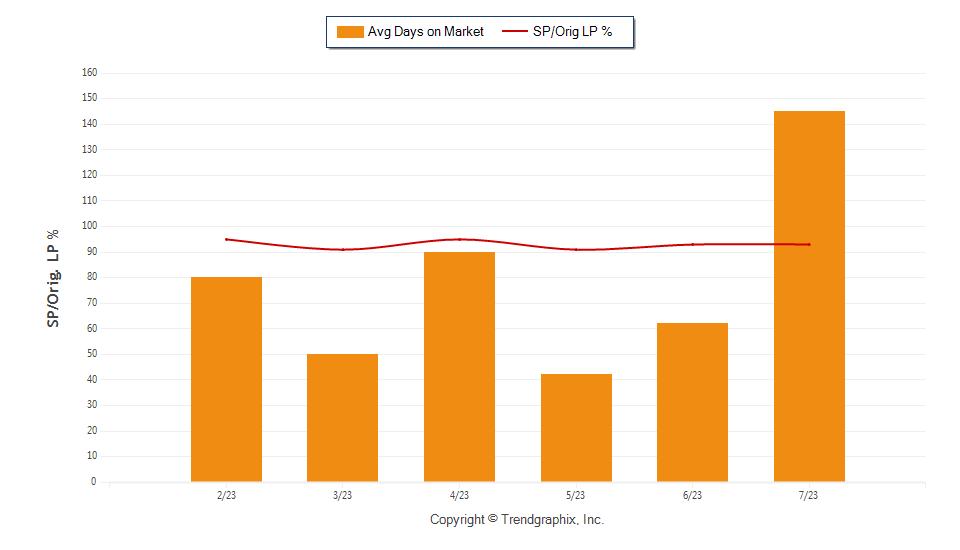
The Days on Market Showed Upward Trend*
The average Days on Market (DOM) shows how many days the average property is on the market before it sells. An upward trend in DOM trends to indicate a move towards more of a Buyer’s market, a downward trend indicates a move towards more of a Seller’s market. The DOM for July 2023 was 115, up 134.7% from 49 days last month.
The Sold/Original List Price Ratio Remains Steady**
The Sold Price vs. Original List Price reveals the average amount that sellers are agreeing to come down from their original list price. The lower the ratio is below 100% the more of a Buyer’s market exists, a ratio at or above 100% indicates more of a Seller’s market. This month Sold Price vs. Original List Price of 91% was down 7.1% % from last month.
*Based on 6 month trend – Upward/Downward/Neutral
** Based on 6 month trend – Rising/Falling/Remains Steady
Limit SQFT
Limit
Limit Full Baths: 0 - No Limit
Baths: 0 - No Limit Year Built: 0 - No Limit
Price Range: $0 - No
Range: 0 - No
Bedrooms: 0 - No
Half
All reports are published August 2023, based on data available at the end of July 2023, except for the today’s stats. This representation is based in whole or in part on data supplied by the Central Panhandle AOR, Emerald Coast AOR or its MLS. Neither the Boards nor its MLS guarantees or is in any way responsibles for its accuracy. Data maintained by the Board or its MLSs may not reflect all real estate activity in the market. Report reflects activity by all brokers participated in the MLS.
Garett Huber
Compass
Cell Phone: (850) 830-1801
https://huberluxurygroup.com
Area 17 - 30A
West, Area 18 - 30A East
Published: August 2023*
Property Types: Residential - Attached Single Unit
The Average For Sale Price was Appreciating*
The Average For Sale Price in July was $1,678,000, up 4.4% from $1,607,000 last month.
The Average Sold Price was Neutral*
The Average Sold Price in July was $1,051,000, down 32.1% from $1,547,000 last month.
The Median Sold Price was Neutral*
The Median Sold Price in July was $1,000,000, down 6.5% from $1,070,000 last month.
*Based on 6 month trend – Appreciating/Depreciating/Neutral
It was a Buyer's Market*
A comparatively lower Months of Inventory is more beneficial for sellers while a higher months of inventory is better for buyers.
*Buyer’s market: more than 6 months of inventory
Seller’s market: less than 3 months of inventory
Neutral market: 3 – 6 months of inventory
Months of Inventory based on Closed Sales
The July 2023 Months of Inventory based on Closed Sales of 8.9 was up 122.5% compared to last month. July 2023 was Buyer's market.
Months
of Inventory based on Pended Sales
The July 2023 Months of Inventory based on Pended Sales of 7.8 was up 80.8% compared to last month. July 2023 was Buyer's market.
Limit SQFT Range:
No Limit Bedrooms:
Limit Full Baths: 0 - No Limit Half Baths: 0 - No Limit Year Built: 0 - No Limit
Price Range: $0 - No
0 -
0 - No
All reports are published August 2023, based on data available at the end of July 2023, except for the today’s stats. This representation is based in whole or in part on data supplied by the Central Panhandle AOR, Emerald Coast AOR or its MLS. Neither the Boards nor its MLS guarantees or is in any way responsibles for its accuracy. Data maintained by the Board or its MLSs may not reflect all real estate activity in the market. Report reflects activity by all brokers participated in the MLS.
Garett Huber
Compass
Cell Phone: (850) 830-1801
https://huberluxurygroup.com
It was a Buyer's Market*
Area 17 - 30A
West, Area 18 - 30A East
Published: August 2023*
Property Types: Residential - Attached Single Unit
Price Range: $0 - No Limit
Bedrooms: 0 - No
Range: 0 - No
Absorption Rate measures the inverse of Months of Inventory and represents how much of the current active listings (as a percentage) are being absorbed each month.
*Buyer’s market: 16.67% and below
Seller’s market: 33.33% and above
Neutral market: 16.67% - 33.33%
Absorption Rate based on Closed Sales
The July 2023 Absorption Rate based on Closed Sales of 11.3 was down 54.8% compared to last month.
Absorption Rate based on Pended Sales
The July 2023 Absorption Rate based on Pended Sales of 12.9 was down 44.2% compared to last month.
SQFT
Limit
Full Baths:
Limit
Limit Year Built:
Limit
Limit
0 - No
Half Baths: 0 - No
0 - No
All reports are published August 2023, based on data available at the end of July
Boards nor its MLS guarantees or is in any way responsibles for its
2023, except for the today’s stats. This representation is based in whole or in part on data supplied by the Central Panhandle AOR, Emerald Coast AOR or its MLS. Neither the
accuracy.
Data maintained by the Board or its MLSs may not reflect all real estate activity in the market. Report reflects activity by all brokers participated in the MLS.
Garett Huber
Compass
Cell Phone: (850) 830-1801
https://huberluxurygroup.com
Sub Area 1501 - Miramar Beach North, Sub Area 1502 - Miramar Beach S. of 98
w/exception of Sandestin Resort, Sub Area 1503 - Sandestin Resort
Published: August 2023* Property
Miramar Beach - Single-Family Homes
July 2023 was a Buyer's market! The number of for sale listings was down 4.4% from the previous month. The number of sold listings decreased 21.7% month over month. The number of under contract listings was up 50% compared to previous month. The Months of Inventory based on Closed Sales was 8.4.
The Average Sold Price per Square Footage was up 10.4% compared to previous month. The Median Sold Price decreased by 0.6% from last month. The Average Sold Price also increased by 6.1% from last month. Based on the 6 month trend, the Average Sold Price trend was "Neutral" and the Median Sold Price trend was "Neutral".
The Average Days on Market showed a neutral trend. The ratio of Sold Price vs. Original List Price was 92%.
It was a Buyer's Market
Property Sales (Sold)
July property sales were 18, 21.7% lower than the 23 sales last month.
Current Inventory (For Sale)
The total number of homes available this month was 151. The number of current inventory was down 4.4% compared to the previous month.
Property Under Contract (Pended)
There was an increase of 50% in the pended properties in July, with 21 properties versus 14 last month.
Types: Residential - Detached Single Family Price Range: $0 - No Limit SQFT Range: 0 - No Limit Bedrooms: 0 - No Limit Full Baths: 0 - No Limit Half Baths: 0 - No Limit Year Built: 0 - No Limit
All reports are published August 2023, based on data available at the end of July 2023, except for the today’s stats. This representation is based in whole or in part on data supplied by the Central Panhandle AOR, Emerald Coast AOR or its MLS. Neither the Boards nor its MLS guarantees or is in any way responsibles for its accuracy. Data maintained by the Board or its MLSs may not reflect all real estate activity in the market. Report reflects activity by all brokers participated in the MLS.
Compass Cell Phone: (850) 830-1801
https://huberluxurygroup.com
Sub Area 1501 - Miramar Beach North, Sub Area 1502 - Miramar Beach S. of 98 w/exception of Sandestin Resort, Sub Area 1503 - Sandestin Resort
The Average Sold Price per Square Footage was Appreciating*
The Average Sold Price per Square Footage is a great indicator for the direction of property values. Since Median Sold Price and Average Sold Price can be impacted by the 'mix' of high or low end properties in the market, the Average Sold Price per Square Footage is a more normalized indicator on the direction of property values. The July 2023 Average Sold Price per Square Footage of $583 was up 10.4% from $528 last month.
*Based on 6 month trend – Appreciating/Depreciating/Neutral
The Days on Market Showed Neutral Trend*
The average Days on Market (DOM) shows how many days the average property is on the market before it sells. An upward trend in DOM trends to indicate a move towards more of a Buyer’s market, a downward trend indicates a move towards more of a Seller’s market. The DOM for July 2023 was 103, up 98.1% from 52 days last month.
The Sold/Original List Price Ratio Remains Steady**
The Sold Price vs. Original List Price reveals the average amount that sellers are agreeing to come down from their original list price. The lower the ratio is below 100% the more of a Buyer’s market exists, a ratio at or above 100% indicates more of a Seller’s market. This month Sold Price vs. Original List Price of 92% was down 2.1% % from last month.
*Based on 6 month trend – Upward/Downward/Neutral
** Based on 6 month trend – Rising/Falling/Remains Steady
Garett Huber
Published: August 2023* Property Types: Residential - Detached Single Family Price Range: $0 - No Limit SQFT Range: 0 - No Limit Bedrooms: 0 - No Limit Full Baths: 0 - No Limit Half Baths: 0 - No Limit Year Built: 0 - No Limit
All reports are published August 2023, based on data available at the end of July 2023, except for the today’s stats. This representation is based in whole or in part on data supplied by the Central Panhandle AOR, Emerald Coast AOR or its MLS. Neither the Boards nor its MLS guarantees or is in any way responsibles for its accuracy. Data maintained by the Board or its MLSs may not reflect all real estate activity in the market. Report reflects activity by all brokers participated in the MLS.
Garett Huber
Compass Cell Phone: (850) 830-1801
https://huberluxurygroup.com
Sub Area 1501 - Miramar Beach North, Sub Area 1502 - Miramar Beach S. of 98
w/exception of Sandestin Resort, Sub Area 1503 - Sandestin Resort
The
Average For Sale Price was Neutral*
The Average For Sale Price in July was $2,135,000, down 2.3% from $2,185,000 last month.
The Average Sold Price was Neutral*
The Average Sold Price in July was $1,474,000, up 6.1% from $1,389,000 last month.
The Median Sold Price was Neutral*
The Median Sold Price in July was $1,193,000, down 0.6% from $1,200,000 last month.
*Based on 6 month trend – Appreciating/Depreciating/Neutral
It was a Buyer's Market*
A comparatively lower Months of Inventory is more beneficial for sellers while a higher months of inventory is better for buyers.
*Buyer’s market: more than 6 months of inventory
Seller’s market: less than 3 months of inventory
Neutral market: 3 – 6 months of inventory
Months of Inventory based on Closed Sales
The July 2023 Months of Inventory based on Closed Sales of 8.4 was up 21.8% compared to last month. July 2023 was Buyer's market.
Months of Inventory based on Pended Sales
The July 2023 Months of Inventory based on Pended Sales of 7.2 was down 36.3% compared to last month. July 2023 was Buyer's market.
August 2023* Property Types: Residential - Detached Single Family Price Range: $0 - No Limit SQFT Range: 0 - No Limit Bedrooms: 0 - No Limit Full Baths: 0 - No Limit Half Baths: 0 - No Limit Year Built: 0 - No Limit
Published:
All reports are published August 2023,
on data
the
its MLS
based
available at
end of July 2023,
except for the today’s stats. This representation is based in whole or in part on data supplied by the Central Panhandle AOR, Emerald Coast AOR or its MLS. Neither the Boards nor
guarantees or is in any way responsibles for its accuracy. Data maintained by the Board or its MLSs may not reflect all real estate activity in the market. Report reflects activity by all brokers participated in the MLS.
Garett Huber
Compass Cell Phone: (850) 830-1801
https://huberluxurygroup.com
Sub Area 1501 - Miramar Beach North, Sub Area 1502 - Miramar Beach S. of 98
w/exception of Sandestin Resort, Sub Area 1503 - Sandestin Resort
It was a Buyer's Market*
Absorption Rate measures the inverse of Months of Inventory and represents how much of the current active listings (as a percentage) are being absorbed each month.
*Buyer’s market: 16.67% and below
Seller’s market: 33.33% and above
Neutral market: 16.67% - 33.33%
Absorption Rate based on Closed Sales
The July 2023 Absorption Rate based on Closed Sales of 11.9 was down 18.5% compared to last month.
Absorption Rate based on Pended Sales
The July 2023 Absorption Rate based on Pended Sales of 13.9 was up 56.4% compared to last month.
Published: August 2023* Property Types: Residential - Detached Single Family Price Range: $0 - No Limit SQFT Range: 0 - No Limit Bedrooms: 0 - No Limit Full Baths: 0 - No Limit Half Baths: 0 - No Limit Year Built: 0 - No Limit
All reports are published August 2023, based on data available at the end of July 2023, except for the today’s stats. This representation is based in whole or in part on data supplied by the Central Panhandle AOR, Emerald Coast AOR or its MLS. Neither the Boards nor its MLS guarantees or is in any way responsibles for its accuracy. Data maintained by the Board or its MLSs may not reflect all real estate activity in the market. Report reflects activity by all brokers participated in the MLS.
Garett Huber
Compass
Cell Phone: (850) 830-1801
https://huberluxurygroup.com
Sub Area 1501 - Miramar Beach North, Sub Area 1502 - Miramar Beach S. of 98
w/exception of Sandestin Resort, Sub Area 1503 - Sandestin Resort
Published: August 2023*
Property
Miramar Beach Area Report - Condo
July 2023 was a Buyer's market! The number of for sale listings was up 3.6% from the previous month. The number of sold listings decreased 20% month over month. The number of under contract listings was up 35.3% compared to previous month. The Months of Inventory based on Closed Sales was 7.2.
The Average Sold Price per Square Footage was down 7.3% compared to previous month. The Median Sold Price decreased by 2.3% from last month. The Average Sold Price also decreased by 6.2% from last month. Based on the 6 month trend, the Average Sold Price trend was "Neutral" and the Median Sold Price trend was "Neutral".
The Average Days on Market showed a neutral trend. The ratio of Sold Price vs. Original List Price was 94%.
It was a Buyer's Market
Property Sales (Sold)
July property sales were 32, 20% lower than the 40 sales last month.
Current Inventory (For Sale)
The total number of homes available this month was 229. The number of current inventory was up 3.6% compared to the previous month.
Property Under Contract (Pended)
There was an increase of 35.3% in the pended properties in July, with 46 properties versus 34 last month.
Types: Residential - Condo Price Range: $0 - No Limit SQFT Range: 0 - No Limit Bedrooms: 0 - No Limit Full Baths: 0 - No Limit Half Baths: 0 - No Limit Year Built: 0 - No Limit
All reports are published August 2023, based on data available at the end of July 2023, except for the today’s stats. This representation is based in whole or in part on data supplied by the Central Panhandle AOR, Emerald Coast AOR or its MLS. Neither the Boards nor its MLS guarantees or is in any way responsibles for its accuracy. Data maintained by the Board or its MLSs may not reflect all real estate activity in the market. Report reflects activity by all brokers participated in the MLS.
Garett Huber
Compass Cell Phone: (850) 830-1801
https://huberluxurygroup.com
Sub Area 1501 - Miramar Beach North, Sub Area 1502 - Miramar Beach S. of 98 w/exception of Sandestin Resort, Sub Area 1503 - Sandestin Resort
The Average Sold Price per Square Footage was Depreciating*
The Average Sold Price per Square Footage is a great indicator for the direction of property values. Since Median Sold Price and Average Sold Price can be impacted by the 'mix' of high or low end properties in the market, the Average Sold Price per Square Footage is a more normalized indicator on the direction of property values. The July 2023 Average Sold Price per Square Footage of $545 was down 7.3% from $588 last month.
*Based on 6 month trend – Appreciating/Depreciating/Neutral
The Days on Market Showed Neutral Trend*
The average Days on Market (DOM) shows how many days the average property is on the market before it sells. An upward trend in DOM trends to indicate a move towards more of a Buyer’s market, a downward trend indicates a move towards more of a Seller’s market. The DOM for July 2023 was 68, down 20.9% from 86 days last month.
The Sold/Original List Price Ratio Remains Steady**
The Sold Price vs. Original List Price reveals the average amount that sellers are agreeing to come down from their original list price. The lower the ratio is below 100% the more of a Buyer’s market exists, a ratio at or above 100% indicates more of a Seller’s market. This month Sold Price vs. Original List Price of 94% was up 1.1% % from last month.
*Based on 6 month trend – Upward/Downward/Neutral
** Based on 6 month trend – Rising/Falling/Remains Steady
Published: August 2023* Property Types: Residential - Condo Price Range: $0 - No Limit SQFT Range: 0 - No Limit Bedrooms: 0 - No Limit Full Baths: 0 - No Limit Half Baths: 0 - No Limit Year Built: 0 - No Limit
All reports are published August 2023, based on data available at the end of July 2023, except for the today’s stats. This representation is based in whole or in part on data supplied by the Central Panhandle AOR, Emerald Coast AOR or its MLS. Neither the Boards nor its MLS guarantees or is in any way responsibles for its accuracy. Data maintained by the Board or its MLSs may not reflect all real estate activity in the market. Report reflects activity by all brokers participated in the MLS.
Garett Huber
Compass
Cell Phone: (850) 830-1801
https://huberluxurygroup.com
Sub Area 1501 - Miramar Beach North, Sub Area 1502 - Miramar Beach S. of 98
w/exception of Sandestin Resort, Sub Area 1503 - Sandestin Resort
The Average For Sale Price was Neutral*
The Average For Sale Price in July was $733,000, down 1.1% from $741,000 last month.
The Average Sold Price was Neutral*
The Average Sold Price in July was $653,000, down 6.2% from $696,000 last month.
The Median Sold Price was Neutral*
The Median Sold Price in July was $560,000, down 2.3% from $573,000 last month.
*Based on 6 month trend – Appreciating/Depreciating/Neutral
It was a Buyer's Market*
A comparatively lower Months of Inventory is more beneficial for sellers while a higher months of inventory is better for buyers.
*Buyer’s market: more than 6 months of inventory
Seller’s market: less than 3 months of inventory
Neutral market: 3 – 6 months of inventory
Months of Inventory based on Closed Sales
The July 2023 Months of Inventory based on Closed Sales of 7.2 was up 30.8% compared to last month. July 2023 was Buyer's market.
Months of Inventory based on Pended Sales
The July 2023 Months of Inventory based on Pended Sales of 5 was down 23.1% compared to last month. July 2023 was Neutral market.
August 2023* Property Types: Residential - Condo Price Range: $0 - No Limit SQFT Range: 0 - No Limit Bedrooms: 0 - No Limit Full Baths: 0 - No Limit Half Baths: 0 - No Limit Year Built: 0 - No Limit
Published:
All reports are published August 2023,
on data available
the end
based
at
of July
2023, except for the today’s stats. This representation is based in whole or in part on data supplied by the Central Panhandle AOR, Emerald Coast AOR or its MLS. Neither the Boards nor
its
MLS guarantees or is in any way responsibles for its accuracy. Data maintained by the Board or its MLSs may not reflect all real estate activity in the market. Report reflects activity by all brokers participated in the MLS.
Garett Huber
Compass
Cell Phone: (850) 830-1801
https://huberluxurygroup.com
Sub Area 1501 - Miramar Beach North, Sub Area 1502 - Miramar Beach S. of 98
w/exception of Sandestin Resort, Sub Area 1503 - Sandestin Resort
It was a Buyer's Market*
Absorption Rate measures the inverse of Months of Inventory and represents how much of the current active listings (as a percentage) are being absorbed each month.
*Buyer’s market: 16.67% and below
Seller’s market: 33.33% and above
Neutral market: 16.67% - 33.33%
Absorption Rate based on Closed Sales
The July 2023 Absorption Rate based on Closed Sales of 14 was down 22.7% compared to last month.
Absorption Rate based on Pended Sales
The July 2023 Absorption Rate based on Pended Sales of 20.1 was up 30.5% compared to last month.
August 2023* Property Types: Residential - Condo Price Range: $0 - No Limit SQFT Range: 0 - No Limit Bedrooms: 0 - No Limit Full Baths: 0 - No Limit Half Baths: 0 - No Limit Year Built: 0 - No Limit
Published:
All reports are published August 2023, based on data available at the end of July 2023, except for the today’s stats. This representation is based in whole or in part on data supplied by the Central Panhandle AOR, Emerald Coast AOR or its MLS. Neither the Boards nor its MLS guarantees or is in any way responsibles for its accuracy. Data maintained by the Board or its MLSs may not reflect all real estate activity in the market. Report reflects activity by all brokers participated in the MLS.
Garett Huber
Compass
Cell Phone: (850) 830-1801
https://huberluxurygroup.com
Sub Area 1501 - Miramar Beach North, Sub Area 1502 - Miramar Beach S. of 98 w/exception of Sandestin Resort, Sub Area 1503 - Sandestin Resort
Published: August 2023* Property
Miramar Beach Area Report - Townhome
July 2023 was a Buyer's market! The number of for sale listings was up 7.5% from the previous month. The number of sold listings decreased 25% month over month. The number of under contract listings was down 37.5% compared to previous month. The Months of Inventory based on Closed Sales was 7.2.
The Average Sold Price per Square Footage was down 2.2% compared to previous month. The Median Sold Price increased by 11.3% from last month. The Average Sold Price also increased by 5% from last month. Based on the 6 month trend, the Average Sold Price trend was "Neutral" and the Median Sold Price trend was "Appreciating".
The Average Days on Market showed a upward trend. The ratio of Sold Price vs. Original List Price was 93%.
It was a Buyer's Market
Property Sales (Sold)
July property sales were 6, 25% lower than the 8 sales last month.
Current Inventory (For Sale)
The total number of homes available this month was 43. The number of current inventory was up 7.5% compared to the previous month.
Property Under Contract (Pended)
There was a decrease of 37.5% in the pended properties in July, with 5 properties versus 8 last month.
Types: Residential - Attached Single Unit Price Range: $0 - No Limit SQFT Range: 0 - No Limit Bedrooms: 0 - No Limit Full Baths: 0 - No Limit Half Baths: 0 - No Limit Year Built: 0 - No Limit
All reports are published August 2023, based on data available at the end of July 2023, except for the today’s stats. This representation is based in whole or in part on data supplied by the Central Panhandle AOR, Emerald Coast AOR or its MLS. Neither the Boards nor its MLS guarantees or is in any way responsibles for its accuracy. Data maintained by the Board or its MLSs may not reflect all real estate activity in the market. Report reflects activity by all brokers participated in the MLS.
Garett Huber
Compass
Cell Phone: (850) 830-1801
https://huberluxurygroup.com
Sub Area 1501 - Miramar Beach North, Sub Area 1502 - Miramar Beach S. of 98 w/exception of Sandestin Resort, Sub Area 1503 - Sandestin Resort
The Average Sold Price per Square Footage was Neutral*
The Average Sold Price per Square Footage is a great indicator for the direction of property values. Since Median Sold Price and Average Sold Price can be impacted by the 'mix' of high or low end properties in the market, the Average Sold Price per Square Footage is a more normalized indicator on the direction of property values. The July 2023 Average Sold Price per Square Footage of $447 was down 2.2% from $457 last month.
*Based on 6 month trend – Appreciating/Depreciating/Neutral
The Days on Market Showed Upward Trend*
The average Days on Market (DOM) shows how many days the average property is on the market before it sells. An upward trend in DOM trends to indicate a move towards more of a Buyer’s market, a downward trend indicates a move towards more of a Seller’s market. The DOM for July 2023 was 145, up 133.9% from 62 days last month.
The Sold/Original List Price Ratio Remains Steady**
The Sold Price vs. Original List Price reveals the average amount that sellers are agreeing to come down from their original list price. The lower the ratio is below 100% the more of a Buyer’s market exists, a ratio at or above 100% indicates more of a Seller’s market. This month Sold Price vs. Original List Price of 93% was the same as last month.
*Based on 6 month trend – Upward/Downward/Neutral
** Based on 6 month trend – Rising/Falling/Remains Steady
Published: August 2023* Property Types: Residential - Attached Single Unit Price Range: $0 - No Limit SQFT Range: 0 - No Limit Bedrooms: 0 - No Limit Full Baths: 0 - No Limit Half Baths: 0 - No Limit Year Built: 0 - No Limit
All reports are published August 2023, based on data available at the end of July 2023, except for the today’s stats. This representation is based in whole or in part on data supplied by the Central Panhandle AOR, Emerald Coast AOR or its MLS. Neither the Boards nor its MLS guarantees or is in any way responsibles for its accuracy. Data maintained by the Board or its MLSs may not reflect all real estate activity in the market. Report reflects activity by all brokers participated in the MLS.
Garett Huber
Compass
Cell Phone: (850) 830-1801
https://huberluxurygroup.com
Sub Area 1501 - Miramar Beach North, Sub Area 1502 - Miramar Beach S. of 98
w/exception of Sandestin Resort, Sub Area 1503 - Sandestin Resort
The Average For Sale Price was Neutral*
The Average For Sale Price in July was $1,272,000, down 9.1% from $1,400,000 last month.
The Average Sold Price was Neutral*
The Average Sold Price in July was $713,000, up 5% from $679,000 last month.
The Median Sold Price was Appreciating*
The Median Sold Price in July was $707,000, up 11.3% from $635,000 last month.
*Based on 6 month trend – Appreciating/Depreciating/Neutral
It was a Buyer's Market*
A comparatively lower Months of Inventory is more beneficial for sellers while a higher months of inventory is better for buyers.
*Buyer’s market: more than 6 months of inventory
Seller’s market: less than 3 months of inventory
Neutral market: 3 – 6 months of inventory
Months of Inventory based on Closed Sales
The July 2023 Months of Inventory based on Closed Sales of 7.2 was up 44% compared to last month. July 2023 was Buyer's market.
Months of Inventory based on Pended Sales
The July 2023 Months of Inventory based on Pended Sales of 8.6 was up 72% compared to last month. July 2023 was Buyer's market.
August 2023* Property Types: Residential - Attached Single Unit Price Range: $0 - No Limit SQFT Range: 0 - No Limit Bedrooms: 0 - No Limit Full Baths: 0 - No Limit Half Baths: 0 - No Limit Year Built: 0 - No Limit
Published:
All reports are published August 2023,
based
on
data available at
the
end of July 2023, except for the today’s stats. This representation is based in whole or in part on data supplied by the Central Panhandle AOR, Emerald Coast AOR or its MLS. Neither the Boards nor
its MLS
guarantees or is in any way responsibles for its accuracy. Data maintained by the Board or its MLSs may not reflect all real estate activity in the market. Report reflects activity by all brokers participated in the MLS.
Garett Huber
Compass
Cell Phone: (850) 830-1801
https://huberluxurygroup.com
Sub Area 1501 - Miramar Beach North, Sub Area 1502 - Miramar Beach S. of 98
w/exception of Sandestin Resort, Sub Area 1503 - Sandestin Resort
It was a Buyer's Market*
Absorption Rate measures the inverse of Months of Inventory and represents how much of the current active listings (as a percentage) are being absorbed each month.

*Buyer’s market: 16.67% and below
Seller’s market: 33.33% and above
Neutral market: 16.67% - 33.33%
Absorption Rate based on Closed Sales
The July 2023 Absorption Rate based on Closed Sales of 14 was down 30% compared to last month.
Absorption Rate based on Pended Sales
The July 2023 Absorption Rate based on Pended Sales of 11.6 was down 42% compared to last month.
Published: August 2023* Property Types: Residential - Attached Single Unit Price Range: $0 - No Limit SQFT Range: 0 - No Limit Bedrooms: 0 - No Limit Full Baths: 0 - No Limit Half Baths: 0 - No Limit Year Built: 0 - No Limit
All reports are published August 2023, based on data available at the end of July 2023, except for the today’s stats. This representation is based in whole or in part on data supplied by the Central Panhandle AOR, Emerald Coast AOR or its MLS. Neither the Boards nor its MLS guarantees or is in any way responsibles for its accuracy. Data maintained by the Board or its MLSs may not reflect all real estate activity in the market. Report reflects activity by all brokers participated in the MLS.
Garett Huber
Compass
Cell Phone: (850) 830-1801
https://huberluxurygroup.com
Area 14 - Destin
Published: August 2023*
Property Types: Residential - Detached
Destin Area Report - Single-Family Homes
July 2023 was a Buyer's market! The number of for sale listings was up 11.9% from the previous month. The number of sold listings decreased 62.2% month over month. The number of under contract listings was the same compared to previous month. The Months of Inventory based on Closed Sales was 12.7.
The Average Sold Price per Square Footage was down 9.8% compared to previous month. The Median Sold Price decreased by 24.2% from last month. The Average Sold Price also decreased by 21.7% from last month. Based on the 6 month trend, the Average Sold Price trend was "Depreciating" and the Median Sold Price trend was "Depreciating".
The Average Days on Market showed a neutral trend. The ratio of Sold Price vs. Original List Price was 93%.
It was a Buyer's Market
Property Sales (Sold)
July property sales were 14, 62.2% lower than the 37 sales last month.
Current
Inventory
(For Sale)
The total number of homes available this month was 178. The number of current inventory was up 11.9% compared to the previous month.
Property Under Contract (Pended)
There was the same number of pended properties in July, 28 properties.
Family Price
$0
Limit SQFT Range: 0 - No Limit Bedrooms: 0 - No Limit Full Baths: 0 - No Limit Half Baths: 0 - No Limit Year Built: 0 - No Limit
Single
Range:
- No
All reports are published August 2023, based on data available at the end of July 2023, except for the today’s stats. This representation is based in whole or in part on data supplied by the Central Panhandle AOR, Emerald Coast AOR or its MLS. Neither the Boards nor its MLS guarantees or is in any way responsibles for its accuracy. Data maintained by the Board or its MLSs may not reflect all real estate activity in the market. Report reflects activity by all brokers participated in the MLS.
Garett Huber
Compass
Cell Phone: (850) 830-1801
https://huberluxurygroup.com
Area 14 - Destin
Published: August 2023*
Property Types: Residential - Detached Single Family Price Range: $0 - No
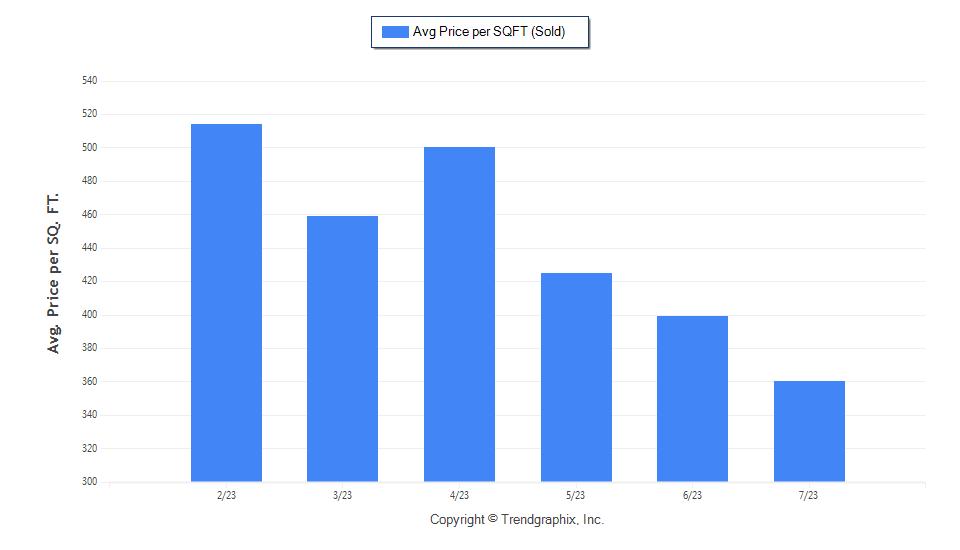
The Average Sold Price per Square Footage was Depreciating*
The Average Sold Price per Square Footage is a great indicator for the direction of property values. Since Median Sold Price and Average Sold Price can be impacted by the 'mix' of high or low end properties in the market, the Average Sold Price per Square Footage is a more normalized indicator on the direction of property values. The July 2023 Average Sold Price per Square Footage of $360 was down 9.8% from $399 last month.
*Based on 6 month trend – Appreciating/Depreciating/Neutral
The Days on Market Showed Neutral Trend*
The average Days on Market (DOM) shows how many days the average property is on the market before it sells. An upward trend in DOM trends to indicate a move towards more of a Buyer’s market, a downward trend indicates a move towards more of a Seller’s market. The DOM for July 2023 was 38, down 46.5% from 71 days last month.
The Sold/Original List Price Ratio Remains Steady**
The Sold Price vs. Original List Price reveals the average amount that sellers are agreeing to come down from their original list price. The lower the ratio is below 100% the more of a Buyer’s market exists, a ratio at or above 100% indicates more of a Seller’s market. This month Sold Price vs. Original List Price of 93% was up 1.1% % from last month.
*Based on 6 month trend – Upward/Downward/Neutral
** Based on 6 month trend – Rising/Falling/Remains Steady
SQFT
Limit
Limit Full Baths:
No Limit Half Baths: 0
Limit Year Built: 0 - No Limit
Limit
Range: 0 - No
Bedrooms: 0 - No
0 -
- No
All reports are published August 2023, based on data available at the end of July 2023, except for the today’s stats. This representation is based in whole or in part on data supplied by the Central Panhandle AOR, Emerald Coast AOR or its MLS. Neither the Boards nor its MLS guarantees or is in any way responsibles for its accuracy. Data maintained by the Board or its MLSs may not reflect all real estate activity in the market. Report reflects activity by all brokers participated in the MLS.
Garett Huber
Compass
Cell Phone: (850) 830-1801
https://huberluxurygroup.com
Area 14 - Destin
Published: August 2023*
Property Types: Residential - Detached Single Family
The Average For Sale Price was Neutral*
The Average For Sale Price in July was $2,007,000, up 0.8% from $1,991,000 last month.
The Average Sold Price was Depreciating*
The Average Sold Price in July was $778,000, down 21.7% from $994,000 last month.
The Median Sold Price was Depreciating*
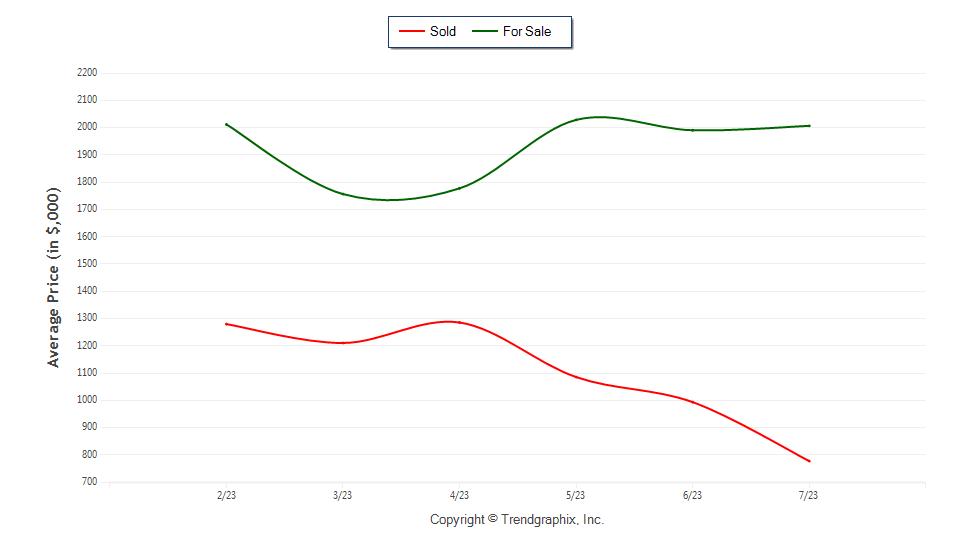
The Median Sold Price in July was $682,000, down 24.2% from $900,000 last month.
*Based on 6 month trend – Appreciating/Depreciating/Neutral
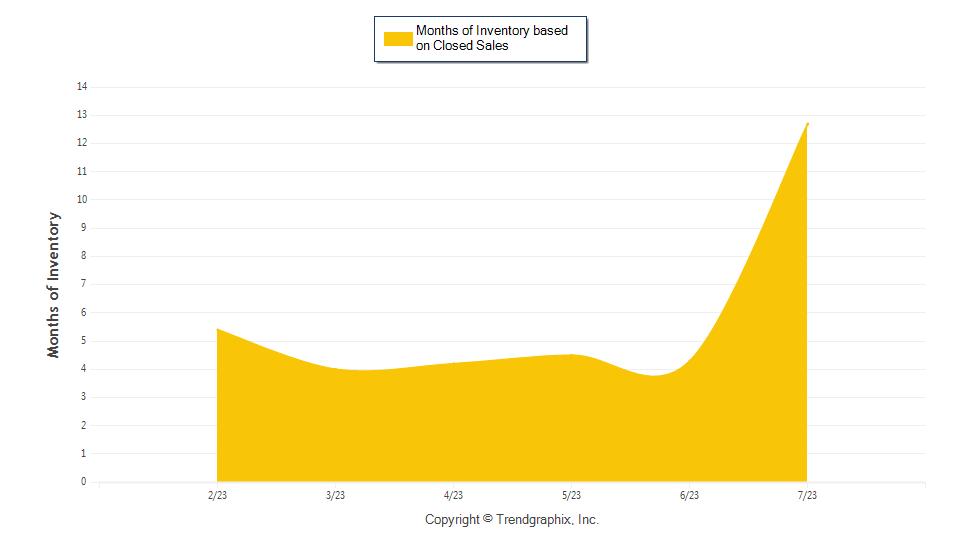
It was a Buyer's Market*
A comparatively lower Months of Inventory is more beneficial for sellers while a higher months of inventory is better for buyers.
*Buyer’s market: more than 6 months of inventory
Seller’s market: less than 3 months of inventory
Neutral market: 3 – 6 months of inventory
Months of Inventory based on Closed Sales
The July 2023 Months of Inventory based on Closed Sales of 12.7 was up 195.5% compared to last month. July 2023 was Buyer's market.
Months of Inventory based on Pended Sales
The July 2023 Months of Inventory based on Pended Sales of 6.4 was up 12.3% compared to last month. July 2023 was Buyer's market.
Price
Limit SQFT Range:
- No Limit
Limit Full Baths: 0 - No Limit Half Baths: 0 - No Limit Year Built: 0 - No Limit
Range: $0 - No
0
Bedrooms: 0 - No
All reports are published August 2023, based on data available at the end of July 2023, except for the today’s stats. This representation is based in whole or in part on data supplied by the Central Panhandle AOR, Emerald Coast AOR or its MLS. Neither the Boards nor its MLS guarantees or is in any way responsibles for its accuracy. Data maintained by the Board or its MLSs may not reflect all real estate activity in the market. Report reflects activity by all brokers participated in the MLS.
Garett Huber
Compass
Cell Phone: (850) 830-1801
https://huberluxurygroup.com
Area 14 - Destin
Published: August 2023*
Property Types: Residential - Detached Single Family
Price Range: $0 - No Limit SQFT Range: 0 - No Limit
Bedrooms: 0 - No Limit Full Baths: 0 - No Limit Half Baths: 0 - No
It was a Buyer's Market*
Absorption Rate measures the inverse of Months of Inventory and represents how much of the current active listings (as a percentage) are being absorbed each month.
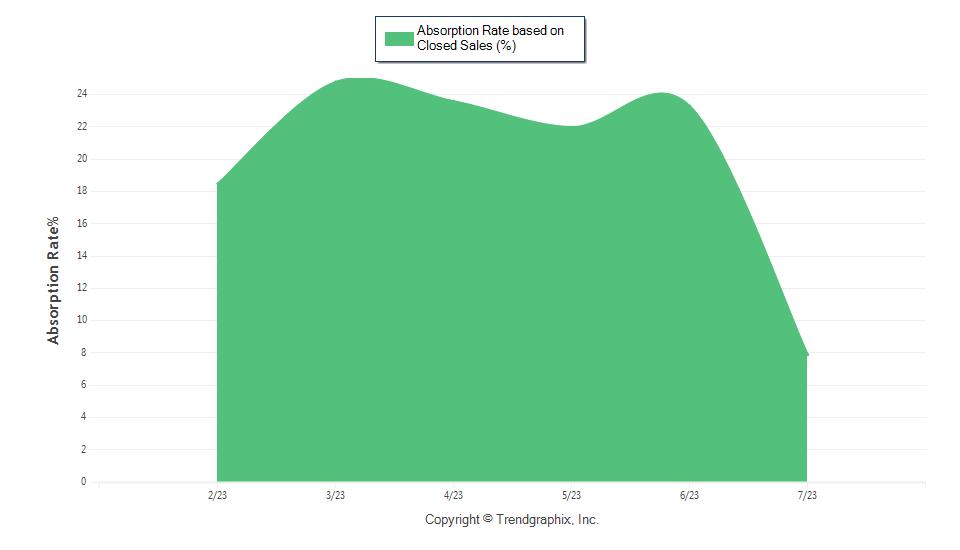
*Buyer’s market: 16.67% and below
Seller’s market: 33.33% and above
Neutral market: 16.67% - 33.33%
Absorption Rate based on Closed Sales
The July 2023 Absorption Rate based on Closed Sales of 7.9 was down 66.2% compared to last month.
Absorption Rate based on Pended Sales
The July 2023 Absorption Rate based on Pended Sales of 15.7 was down 10.8% compared to last month.
Year
Limit
Limit
Built: 0 - No
All reports are published August 2023, based on data available at the end of July
Boards nor its MLS guarantees or is in any way responsibles for
2023,
except for the today’s stats. This representation is based in whole or in part on data supplied by the Central Panhandle AOR, Emerald Coast AOR or its MLS. Neither the
its
accuracy. Data maintained by the Board or its MLSs may not reflect all real estate activity in the market. Report reflects activity by all brokers participated in the MLS.
Garett Huber
Compass
Cell Phone: (850) 830-1801
https://huberluxurygroup.com
Destin Area Report - Condo
Area 14 - Destin
Published: August 2023*
Property Types: Residential - Condo
July 2023 was a Buyer's market! The number of for sale listings was up 2.2% from the previous month. The number of sold listings increased 1.9% month over month. The number of under contract listings was down 8.6% compared to previous month. The Months of Inventory based on Closed Sales was 6.
The Average Sold Price per Square Footage was down 1.8% compared to previous month. The Median Sold Price decreased by 7.9% from last month. The Average Sold Price also decreased by 15.5% from last month. Based on the 6 month trend, the Average Sold Price trend was "Neutral" and the Median Sold Price trend was "Neutral".
The Average Days on Market showed a neutral trend. The ratio of Sold Price vs. Original List Price was 95%.
It was a Buyer's Market
Property Sales (Sold)
July property sales were 53, 1.9% higher than the 52 sales last month.
Current Inventory (For Sale)
The total number of homes available this month was 319. The number of current inventory was up 2.2% compared to the previous month.
Property Under Contract (Pended)
There was a decrease of 8.6% in the pended properties in July, with 32 properties versus 35 last month.
$0
Limit SQFT Range: 0 - No Limit Bedrooms: 0 - No Limit Full Baths: 0 - No Limit Half Baths: 0 - No Limit Year Built: 0 - No Limit
Price Range:
- No
All reports are published August 2023, based on data available at the end of July 2023, except for the today’s stats. This representation is based in whole or in part on data supplied by the Central Panhandle AOR, Emerald Coast AOR or its MLS. Neither the Boards nor its MLS guarantees or is in any way responsibles for its accuracy. Data maintained by the Board or its MLSs may not reflect all real estate activity in the market. Report reflects activity by all brokers participated in the MLS.
Garett Huber
Compass
Cell Phone: (850) 830-1801
https://huberluxurygroup.com
Area 14 - Destin
Published: August 2023*
Property Types: Residential - Condo
Price Range: $0 - No Limit SQFT Range: 0 - No Limit
Bedrooms: 0 - No Limit
The Average Sold Price per Square Footage was Neutral*
The Average Sold Price per Square Footage is a great indicator for the direction of property values. Since Median Sold Price and Average Sold Price can be impacted by the 'mix' of high or low end properties in the market, the Average Sold Price per Square Footage is a more normalized indicator on the direction of property values. The July 2023 Average Sold Price per Square Footage of $586 was down 1.8% from $597 last month.
*Based on 6 month trend – Appreciating/Depreciating/Neutral
0 - No Limit
The Days on Market Showed Neutral Trend*
The average Days on Market (DOM) shows how many days the average property is on the market before it sells. An upward trend in DOM trends to indicate a move towards more of a Buyer’s market, a downward trend indicates a move towards more of a Seller’s market. The DOM for July 2023 was 72, down 8.9% from 79 days last month.
The Sold/Original List Price Ratio Remains Steady**
The Sold Price vs. Original List Price reveals the average amount that sellers are agreeing to come down from their original list price. The lower the ratio is below 100% the more of a Buyer’s market exists, a ratio at or above 100% indicates more of a Seller’s market. This month Sold Price vs. Original List Price of 95% was up 1.1% % from last month.
*Based on 6 month trend – Upward/Downward/Neutral
** Based on 6 month trend – Rising/Falling/Remains Steady
Limit Year
Limit
Full Baths:
Half Baths: 0 - No
Built: 0 - No
All reports are published August 2023, based on data available at the end of July 2023, except for the today’s stats. This representation is based in whole or in part on data supplied by the Central Panhandle AOR, Emerald Coast AOR or its MLS. Neither the Boards nor its MLS guarantees or is in any way responsibles for its accuracy. Data maintained by the Board or its MLSs may not reflect all real estate activity in the market. Report reflects activity by all brokers participated in the MLS.
Garett Huber
Compass
Cell Phone: (850) 830-1801
https://huberluxurygroup.com
Area 14 - Destin
Published: August 2023*
Property Types: Residential - Condo
Range: $0 - No
The Average For Sale Price was Depreciating*
The Average For Sale Price in July was $969,000, down 3.8% from $1,007,000 last month.
The Average Sold Price was Neutral*
The Average Sold Price in July was $739,000, down 15.5% from $875,000 last month.
The Median Sold Price was Neutral*
The Median Sold Price in July was $700,000, down 7.9% from $760,000 last month.
*Based on 6 month trend – Appreciating/Depreciating/Neutral
It was a Buyer's Market*
A comparatively lower Months of Inventory is more beneficial for sellers while a higher months of inventory is better for buyers.
*Buyer’s market: more than 6 months of inventory
Seller’s market: less than 3 months of inventory
Neutral market: 3 – 6 months of inventory
Months of Inventory based on Closed Sales
The July 2023 Months of Inventory based on Closed Sales of 6 was the same compared to last month. July 2023 was Buyer's market.
Months of Inventory based on Pended Sales
The July 2023 Months of Inventory based on Pended Sales of 10 was up 12.3% compared to last month. July 2023 was Buyer's market.
SQFT Range:
Limit
Limit Full Baths:
- No Limit Half Baths: 0 - No Limit Year Built: 0 - No Limit
Price
Limit
0 - No
Bedrooms: 0 - No
0
All reports are published August 2023, based on data available at the end of July 2023, except for the today’s stats. This representation is based in whole or in part on data supplied by the Central Panhandle AOR, Emerald Coast AOR or its MLS. Neither the Boards nor its MLS guarantees or is in any way responsibles for its accuracy. Data maintained by the Board or its MLSs may not reflect all real estate activity in the market. Report reflects activity by all brokers participated in the MLS.
Garett Huber
Compass
Cell Phone: (850) 830-1801
https://huberluxurygroup.com
Area 14 - Destin
Published: August 2023*
Property Types: Residential - Condo
Price Range: $0 - No Limit
Bedrooms: 0 - No Limit
It was a Buyer's Market*
SQFT Range: 0 - No Limit
Full Baths: 0 - No Limit
Half Baths: 0 - No Limit Year Built: 0 - No Limit
Absorption Rate measures the inverse of Months of Inventory and represents how much of the current active listings (as a percentage) are being absorbed each month.
*Buyer’s market: 16.67% and below
Seller’s market: 33.33% and above
Neutral market: 16.67% - 33.33%
Absorption Rate based on Closed Sales
The July 2023 Absorption Rate based on Closed Sales of 16.6 was down 0.6% compared to last month.
Absorption Rate based on Pended Sales
The July 2023 Absorption Rate based on Pended Sales of 10 was down 10.7% compared to last month.
All reports are published August 2023, based on data available at the end of July
Boards nor its MLS guarantees or is in any way
2023, except
for the today’s stats. This representation is based in whole or in part on data supplied by the Central Panhandle AOR, Emerald Coast AOR or its MLS. Neither the
responsibles for its
accuracy. Data maintained by the Board or its MLSs may not reflect all real estate activity in the market. Report reflects activity by all brokers participated in the MLS.
Garett Huber
Compass
Cell Phone: (850) 830-1801
https://huberluxurygroup.com
Area 14 - Destin
Published: August 2023* Property Types: Residential -
Destin Area Report - Townhome
July 2023 was a Buyer's market! The number of for sale listings was down 21.4% from the previous month. The number of sold listings decreased 40% month over month. The number of under contract listings was up 162.5% compared to previous month. The Months of Inventory based on Closed Sales was 7.3.
The Average Sold Price per Square Footage was up 43.2% compared to previous month. The Median Sold Price increased by 8.6% from last month. The Average Sold Price also increased by 81.3% from last month. Based on the 6 month trend, the Average Sold Price trend was "Appreciating" and the Median Sold Price trend was "Appreciating".
The Average Days on Market showed a neutral trend. The ratio of Sold Price vs. Original List Price was 93%.

It was a Buyer's Market
Property Sales (Sold)
July property sales were 6, 40% lower than the 10 sales last month.
Current
Inventory
(For Sale)
The total number of homes available this month was 44. The number of current inventory was down 21.4% compared to the previous month.
Property Under Contract (Pended)
There was an increase of 162.5% in the pended properties in July, with 21 properties versus 8 last month.
Single Unit Price
$0 - No Limit SQFT Range: 0 - No Limit Bedrooms: 0 - No Limit Full Baths: 0 - No Limit Half Baths: 0 - No Limit Year Built: 0 - No Limit
Attached
Range:
All reports are published August 2023, based on data available at the end of July 2023, except for the today’s stats. This representation is based in whole or in part on data supplied by the Central Panhandle AOR, Emerald Coast AOR or its MLS. Neither the Boards nor its MLS guarantees or is in any way responsibles for its accuracy. Data maintained by the Board or its MLSs may not reflect all real estate activity in the market. Report reflects activity by all brokers participated in the MLS.
Garett Huber
Compass
Cell Phone: (850) 830-1801
https://huberluxurygroup.com
Area 14 - Destin
Published: August 2023*
The Average Sold Price per Square Footage was Appreciating*
The Average Sold Price per Square Footage is a great indicator for the direction of property values. Since Median Sold Price and Average Sold Price can be impacted by the 'mix' of high or low end properties in the market, the Average Sold Price per Square Footage is a more normalized indicator on the direction of property values. The July 2023 Average Sold Price per Square Footage of $524 was up 43.2% from $366 last month.
*Based on 6 month trend – Appreciating/Depreciating/Neutral
The Days on Market Showed Neutral Trend*
The average Days on Market (DOM) shows how many days the average property is on the market before it sells. An upward trend in DOM trends to indicate a move towards more of a Buyer’s market, a downward trend indicates a move towards more of a Seller’s market. The DOM for July 2023 was 134, up 119.7% from 61 days last month.
The Sold/Original List Price Ratio Remains Steady**
The Sold Price vs. Original List Price reveals the average amount that sellers are agreeing to come down from their original list price. The lower the ratio is below 100% the more of a Buyer’s market exists, a ratio at or above 100% indicates more of a Seller’s market. This month Sold Price vs. Original List Price of 93% was down 2.1% % from last month.
*Based on 6 month trend – Upward/Downward/Neutral
** Based on 6 month trend – Rising/Falling/Remains Steady
Limit SQFT Range: 0
No Limit
No Limit Full Baths: 0 - No Limit Half Baths: 0 - No Limit Year Built: 0 - No Limit
Property Types: Residential - Attached Single Unit Price Range: $0 - No
-
Bedrooms: 0 -
All reports are published August 2023, based on data available at the end of July 2023, except for the today’s stats. This representation is based in whole or in part on data supplied by the Central Panhandle AOR, Emerald Coast AOR or its MLS. Neither the Boards nor its MLS guarantees or is in any way responsibles for its accuracy. Data maintained by the Board or its MLSs may not reflect all real estate activity in the market. Report reflects activity by all brokers participated in the MLS.
Garett Huber
Compass
Cell Phone: (850) 830-1801
https://huberluxurygroup.com
Area 14 - Destin
Published: August 2023*
Property Types: Residential - Attached Single Unit
The Average For Sale Price was Appreciating*
The Average For Sale Price in July was $790,000, up 11.1% from $711,000 last month.
The Average Sold Price was Appreciating*
The Average Sold Price in July was $1,021,000, up 81.3% from $563,000 last month.
The Median Sold Price was Appreciating*
The Median Sold Price in July was $530,000, up 8.6% from $488,000 last month.
*Based on 6 month trend – Appreciating/Depreciating/Neutral
It was a Buyer's Market*
A comparatively lower Months of Inventory is more beneficial for sellers while a higher months of inventory is better for buyers.
*Buyer’s market: more than 6 months of inventory
Seller’s market: less than 3 months of inventory
Neutral market: 3 – 6 months of inventory
Months of Inventory based on Closed Sales
The July 2023 Months of Inventory based on Closed Sales of 7.3 was up 30.4% compared to last month. July 2023 was Buyer's market.
Months of Inventory based on Pended Sales
The July 2023 Months of Inventory based on Pended Sales of 2.1 was down 70% compared to last month. July 2023 was Seller's market.
Limit SQFT Range:
No Limit Bedrooms:
Limit Full Baths: 0 - No Limit Half Baths: 0 - No Limit Year Built: 0 - No Limit
Price Range: $0 - No
0 -
0 - No
All reports are published August 2023, based on data available at the end of July 2023, except for the today’s stats. This representation is based in whole or in part on data supplied by the Central Panhandle AOR, Emerald Coast AOR or its MLS. Neither the Boards nor its MLS guarantees or is in any way responsibles for its accuracy. Data maintained by the Board or its MLSs may not reflect all real estate activity in the market. Report reflects activity by all brokers participated in the MLS.
Garett Huber
Compass
Cell Phone: (850) 830-1801
https://huberluxurygroup.com
Area 14 - Destin
Published: August 2023*
Property Types: Residential - Attached Single Unit
Price Range: $0 - No Limit
Bedrooms: 0 - No Limit
0 - No
It was a Buyer's Market*
Absorption Rate measures the inverse of Months of Inventory and represents how much of the current active listings (as a percentage) are being absorbed each month.
*Buyer’s market: 16.67% and below
Seller’s market: 33.33% and above
Neutral market: 16.67% - 33.33%
Absorption Rate based on Closed Sales
The July 2023 Absorption Rate based on Closed Sales of 13.6 was down 24.1% compared to last month.
Absorption Rate based on Pended Sales
The July 2023 Absorption Rate based on Pended Sales of 47.7 was up 233.8% compared to last month.
Range: 0 - No Limit
0 - No
SQFT
Full
Limit Year Built:
Limit
Baths:
Limit Half Baths:
0 - No
All reports are published August 2023, based on data available at the end of July
Boards nor its MLS guarantees or is in any way responsibles
2023,
except for the today’s stats. This representation is based in whole or in part on data supplied by the Central Panhandle AOR, Emerald Coast AOR or its MLS. Neither the
for its
accuracy. Data maintained by the Board or its MLSs may not reflect all real estate activity in the market. Report reflects activity by all brokers participated in the MLS.
Garett Huber
Compass
Cell Phone: (850) 830-1801
https://huberluxurygroup.com
03 - Bay County - Beach
Published: August 2023*
Property Types: Residential - Detached
Panama City Beach Area Report - Single-Family Homes
July 2023 was a Neutral market! The number of for sale listings was down 6.9% from the previous month. The number of sold listings decreased 30.7% month over month. The number of under contract listings was up 24.4% compared to previous month. The Months of Inventory based on Closed Sales was 4.3.
The Average Sold Price per Square Footage was down 12.1% compared to previous month. The Median Sold Price decreased by 0.2% from last month. The Average Sold Price also decreased by 15.5% from last month. Based on the 6 month trend, the Average Sold Price trend was "Neutral" and the Median Sold Price trend was "Neutral".
The Average Days on Market showed a neutral trend. The ratio of Sold Price vs. Original List Price was 93%.
It was a Neutral Market
Property Sales (Sold)
July property sales were 79, 30.7% lower than the 114 sales last month.
Current Inventory (For Sale)
The total number of homes available this month was 337. The number of current inventory was down 6.9% compared to the previous month.
Property Under Contract (Pended)
There was an increase of 24.4% in the pended properties in July, with 102 properties versus 82 last month.
Price
$0 - No Limit SQFT Range: 0 - No Limit Bedrooms: 0 - No Limit Full Baths: 0 - No Limit Half Baths: 0 - No Limit Year Built: 0 - No Limit
Range:
All reports are published August 2023, based on data available at the end of July 2023, except for the today’s stats. This representation is based in whole or in part on data supplied by the Central Panhandle AOR, Emerald Coast AOR or its MLS. Neither the Boards nor its MLS guarantees or is in any way responsibles for its accuracy. Data maintained by the Board or its MLSs may not reflect all real estate activity in the market. Report reflects activity by all brokers participated in the MLS.
Garett Huber
Compass
Cell Phone: (850) 830-1801
https://huberluxurygroup.com
03 - Bay County - Beach
Published: August 2023*
Property Types: Residential - Detached Price Range: $0 - No
The Average Sold Price per Square Footage was Neutral*
The Average Sold Price per Square Footage is a great indicator for the direction of property values. Since Median Sold Price and Average Sold Price can be impacted by the 'mix' of high or low end properties in the market, the Average Sold Price per Square Footage is a more normalized indicator on the direction of property values. The July 2023 Average Sold Price per Square Footage of $326 was down 12.1% from $371 last month.
*Based on 6 month trend – Appreciating/Depreciating/Neutral
The Days on Market Showed Neutral Trend*
The average Days on Market (DOM) shows how many days the average property is on the market before it sells. An upward trend in DOM trends to indicate a move towards more of a Buyer’s market, a downward trend indicates a move towards more of a Seller’s market. The DOM for July 2023 was 68, up 4.6% from 65 days last month.
The Sold/Original List Price Ratio Remains Steady**
The Sold Price vs. Original List Price reveals the average amount that sellers are agreeing to come down from their original list price. The lower the ratio is below 100% the more of a Buyer’s market exists, a ratio at or above 100% indicates more of a Seller’s market. This month Sold Price vs. Original List Price of 93% was down 1.1% % from last month.
*Based on 6 month trend – Upward/Downward/Neutral
** Based on 6 month trend – Rising/Falling/Remains Steady
Limit SQFT
No Limit
No Limit Full Baths: 0 - No Limit Half Baths: 0 - No Limit Year Built: 0 - No Limit
Range: 0 -
Bedrooms: 0 -
All reports are published August 2023, based on data available at the end of July 2023, except for the today’s stats. This representation is based in whole or in part on data supplied by the Central Panhandle AOR, Emerald Coast AOR or its MLS. Neither the Boards nor its MLS guarantees or is in any way responsibles for its accuracy. Data maintained by the Board or its MLSs may not reflect all real estate activity in the market. Report reflects activity by all brokers participated in the MLS.
Garett Huber
Compass
Cell Phone: (850) 830-1801
https://huberluxurygroup.com
03 - Bay County - Beach
Published: August 2023*
The Average For Sale Price was Appreciating*
The Average For Sale Price in July was $1,164,000, up 6.1% from $1,097,000 last month.
The Average Sold Price was Neutral*
The Average Sold Price in July was $655,000, down 15.5% from $775,000 last month.
The Median Sold Price was Neutral*
The Median Sold Price in July was $520,000, down 0.2% from $521,000 last month.
*Based on 6 month trend – Appreciating/Depreciating/Neutral
It was a Neutral Market*
A comparatively lower Months of Inventory is more beneficial for sellers while a higher months of inventory is better for buyers.
*Buyer’s market: more than 6 months of inventory
Seller’s market: less than 3 months of inventory
Neutral market: 3 – 6 months of inventory
Months of Inventory based on Closed Sales
The July 2023 Months of Inventory based on Closed Sales of 4.3 was up 34.6% compared to last month. July 2023 was Neutral market.
Months of Inventory based on Pended Sales
The July 2023 Months of Inventory based on Pended Sales of 3.3 was down 24.9% compared to last month. July 2023 was Neutral market.
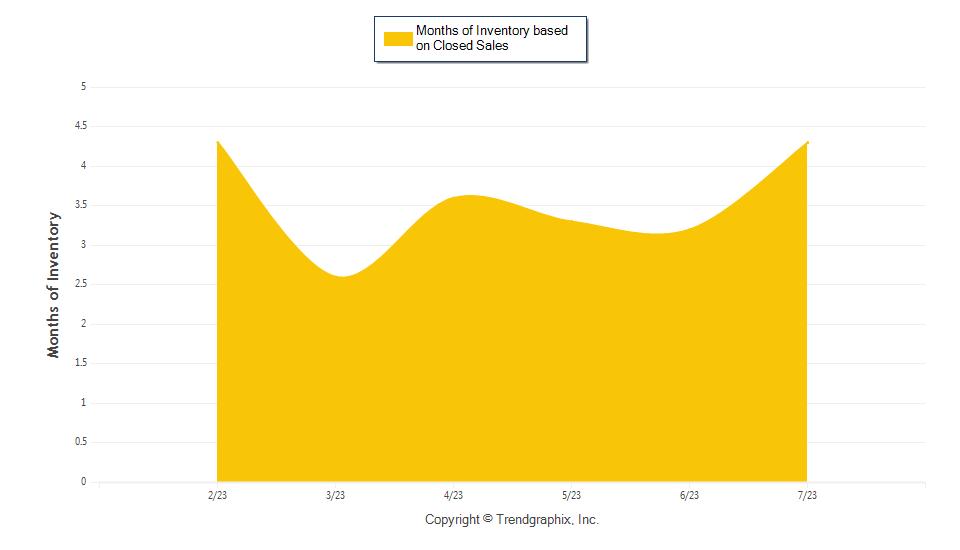
Limit SQFT Range: 0 - No Limit
0 - No Limit Full Baths: 0 - No Limit Half Baths: 0 - No Limit Year Built: 0 - No Limit
Property Types: Residential - Detached Price Range: $0 - No
Bedrooms:
All reports are published August 2023, based on data available at the end of July 2023, except for the today’s stats. This representation is based in whole or in part on data supplied by the Central Panhandle AOR, Emerald Coast AOR or its MLS. Neither the Boards nor its MLS guarantees or is in any way responsibles for its accuracy. Data maintained by the Board or its MLSs may not reflect all real estate activity in the market. Report reflects activity by all brokers participated in the MLS.
Compass
Cell Phone: (850) 830-1801
https://huberluxurygroup.com
03 - Bay County - Beach
Published: August 2023*
Property Types: Residential - Detached
Price Range: $0 - No Limit
Bedrooms: 0 - No
It was a Neutral Market*
Absorption Rate measures the inverse of Months of Inventory and represents how much of the current active listings (as a percentage) are being absorbed each month.
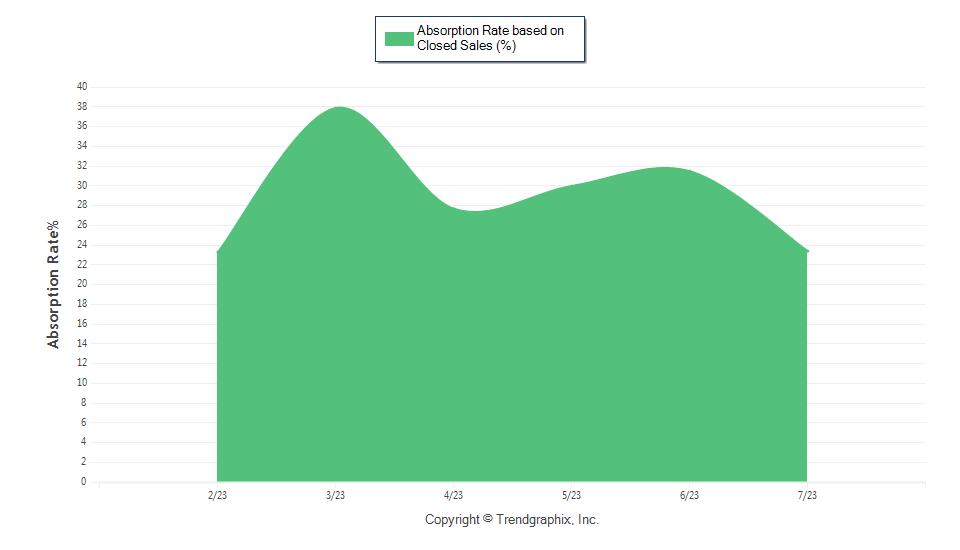
*Buyer’s market: 16.67% and below
Seller’s market: 33.33% and above
Neutral market: 16.67% - 33.33%
Absorption Rate based on Closed Sales
The July 2023 Absorption Rate based on Closed Sales of 23.4 was down 25.7% compared to last month.
Absorption Rate based on Pended Sales
The July 2023 Absorption Rate based on Pended Sales of 30.3 was up 33.6% compared to last month.
Range: 0 - No
Garett Huber
SQFT
Limit
Limit Full Baths:
Limit Half Baths:
Limit Year Built: 0 - No Limit
0 - No
0 - No
All reports are published August 2023, based on data available at the end of July 2023,
Boards nor its MLS guarantees or is in any way
except for
the today’s stats. This representation is based in whole or in part on data supplied by the Central Panhandle AOR, Emerald Coast AOR or its MLS. Neither the
responsibles for its accuracy.
Data maintained by the Board or its MLSs may not reflect all real estate activity in the market. Report reflects activity by all brokers participated in the MLS.
Garett Huber
Compass
Cell Phone: (850) 830-1801
https://huberluxurygroup.com
03 - Bay County - Beach
Published: August 2023*
Property Types: Residential - Condominium Price
Panama City Beach Area Report - Condo
July 2023 was a Buyer's market! The number of for sale listings was down 4% from the previous month. The number of sold listings decreased 42.3% month over month. The number of under contract listings was up 16% compared to previous month. The Months of Inventory based on Closed Sales was 8.6.
The Average Sold Price per Square Footage was down 8.2% compared to previous month. The Median Sold Price decreased by 6.1% from last month. The Average Sold Price also increased by 3.2% from last month. Based on the 6 month trend, the Average Sold Price trend was "Neutral" and the Median Sold Price trend was "Depreciating".
The Average Days on Market showed a neutral trend. The ratio of Sold Price vs. Original List Price was 93%.
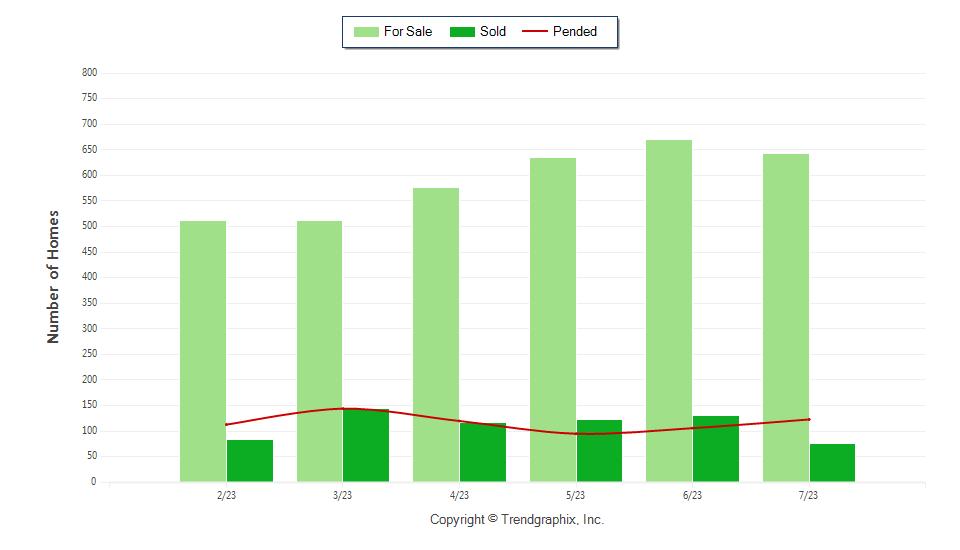
It was a Buyer's Market
Property Sales (Sold)
July property sales were 75, 42.3% lower than the 130 sales last month.
Current Inventory (For Sale)
The total number of homes available this month was 643. The number of current inventory was down 4% compared to the previous month.
Property Under Contract (Pended)
There was an increase of 16% in the pended properties in July, with 123 properties versus 106 last month.
$0
Limit SQFT Range: 0 - No Limit
0 - No Limit Full Baths: 0 - No Limit Half Baths: 0 - No Limit Year Built: 0 - No Limit
Range:
- No
Bedrooms:
All reports are published August 2023, based on data available at the end of July 2023, except for the today’s stats. This representation is based in whole or in part on data supplied by the Central Panhandle AOR, Emerald Coast AOR or its MLS. Neither the Boards nor its MLS guarantees or is in any way responsibles for its accuracy. Data maintained by the Board or its MLSs may not reflect all real estate activity in the market. Report reflects activity by all brokers participated in the MLS.
Compass
Cell Phone: (850) 830-1801
https://huberluxurygroup.com
03 - Bay County - Beach
Published: August 2023*
Property Types: Residential - Condominium Price Range: $0 - No
The Average Sold Price per Square Footage was Depreciating*
The Average Sold Price per Square Footage is a great indicator for the direction of property values. Since Median Sold Price and Average Sold Price can be impacted by the 'mix' of high or low end properties in the market, the Average Sold Price per Square Footage is a more normalized indicator on the direction of property values. The July 2023 Average Sold Price per Square Footage of $393 was down 8.2% from $428 last month.
*Based on 6 month trend – Appreciating/Depreciating/Neutral
The Days on Market Showed Neutral Trend*
The average Days on Market (DOM) shows how many days the average property is on the market before it sells. An upward trend in DOM trends to indicate a move towards more of a Buyer’s market, a downward trend indicates a move towards more of a Seller’s market. The DOM for July 2023 was 68, up 13.3% from 60 days last month.
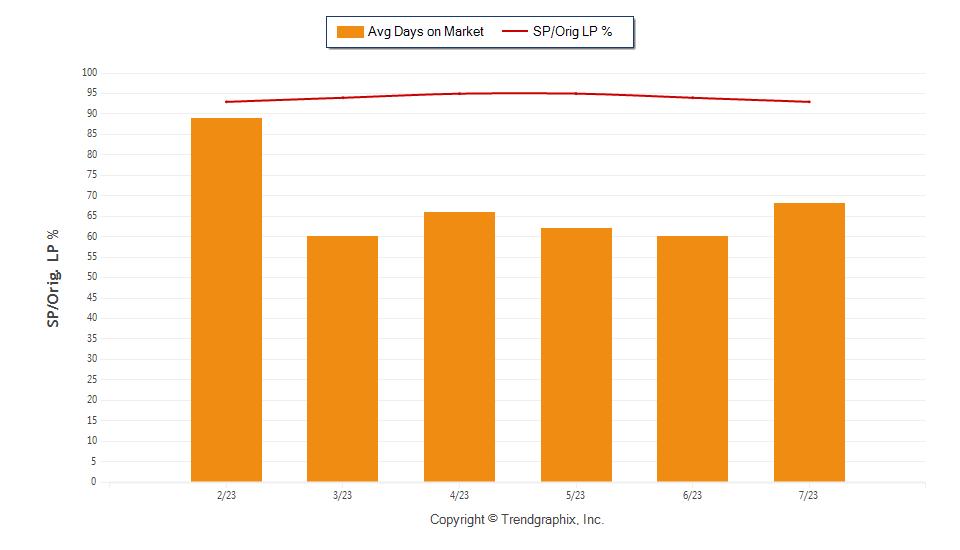
The Sold/Original List Price Ratio Remains Steady**
The Sold Price vs. Original List Price reveals the average amount that sellers are agreeing to come down from their original list price. The lower the ratio is below 100% the more of a Buyer’s market exists, a ratio at or above 100% indicates more of a Seller’s market. This month Sold Price vs. Original List Price of 93% was down 1.1% % from last month.
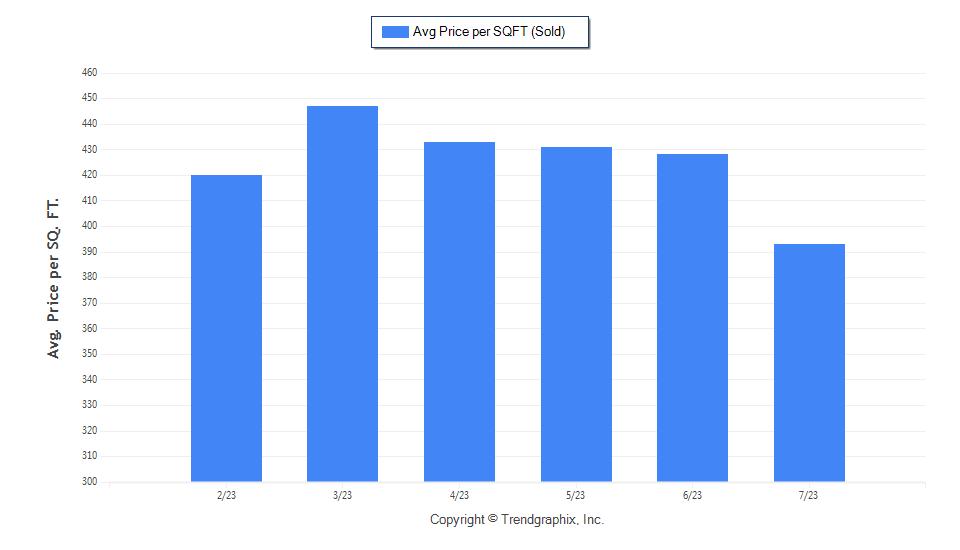
*Based on 6 month trend – Upward/Downward/Neutral
** Based on 6 month trend – Rising/Falling/Remains Steady
Garett Huber
SQFT
Limit
Limit Full Baths:
No Limit Half Baths: 0 - No Limit Year Built: 0 - No Limit
Limit
Range: 0 - No
Bedrooms: 0 - No
0 -
All reports are published August 2023, based on data available at the end of July 2023, except for the today’s stats. This representation is based in whole or in part on data supplied by the Central Panhandle AOR, Emerald Coast AOR or its MLS. Neither the Boards nor its MLS guarantees or is in any way responsibles for its accuracy. Data maintained by the Board or its MLSs may not reflect all real estate activity in the market. Report reflects activity by all brokers participated in the MLS.
Garett Huber
Compass
Cell Phone: (850) 830-1801
https://huberluxurygroup.com
03 - Bay County - Beach
Published: August 2023*
The Average For Sale Price was Appreciating*
The Average For Sale Price in July was $534,000, up 0.6% from $531,000 last month.
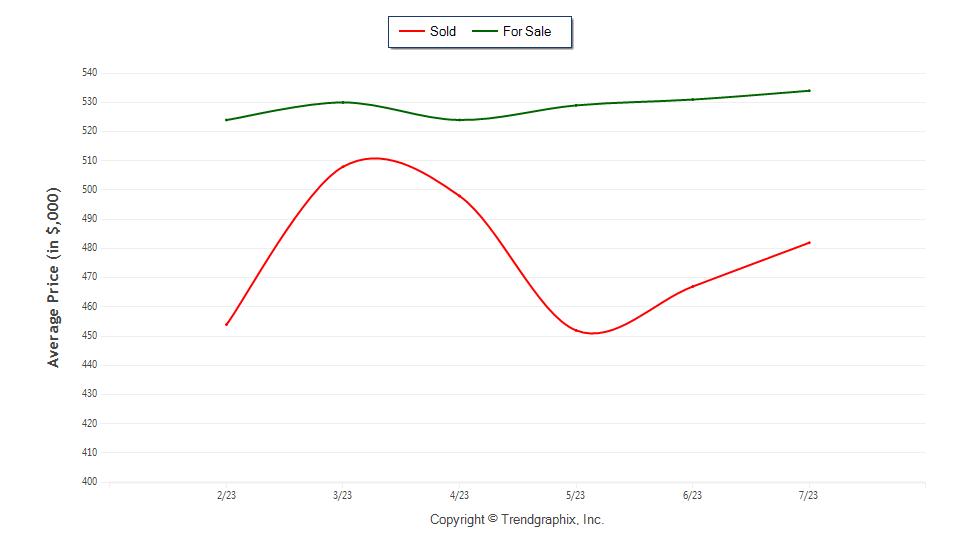
The Average Sold Price was Neutral*
The Average Sold Price in July was $482,000, up 3.2% from $467,000 last month.
The Median Sold Price was Depreciating*
The Median Sold Price in July was $398,000, down 6.1% from $424,000 last month.
*Based on 6 month trend – Appreciating/Depreciating/Neutral
It was a Buyer's Market*
A comparatively lower Months of Inventory is more beneficial for sellers while a higher months of inventory is better for buyers.
*Buyer’s market: more than 6 months of inventory
Seller’s market: less than 3 months of inventory
Neutral market: 3 – 6 months of inventory
Months of Inventory based on Closed Sales
The July 2023 Months of Inventory based on Closed Sales of 8.6 was up 66% compared to last month. July 2023 was Buyer's market.
Months of Inventory based on Pended Sales
The July 2023 Months of Inventory based on Pended Sales of 5.2 was down 17.4% compared to last month. July 2023 was Neutral market.
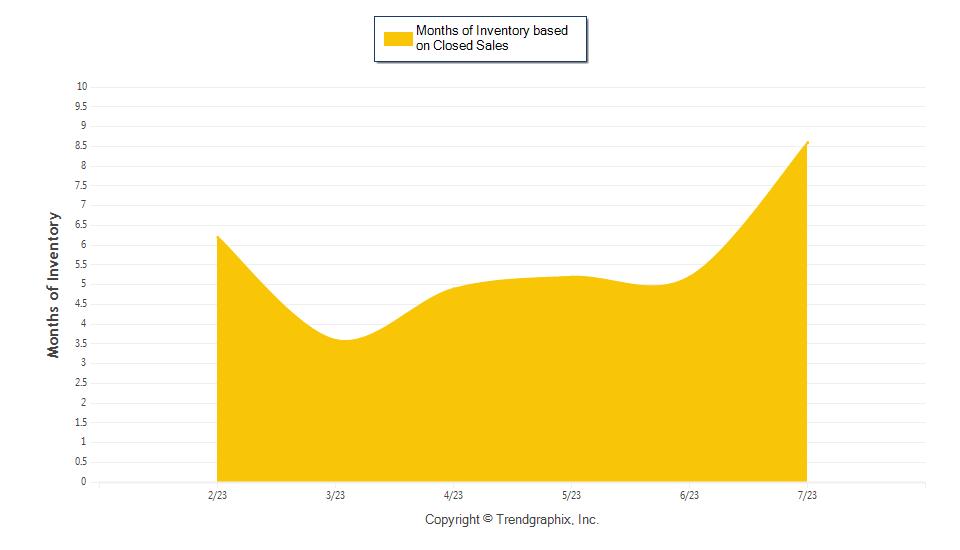
Limit SQFT Range: 0
No Limit
Limit Full Baths: 0 - No Limit Half Baths: 0 - No Limit Year Built: 0 - No Limit
Property Types: Residential - Condominium Price Range: $0 - No
-
Bedrooms: 0 - No
All reports are published August 2023, based on data available at the end of July 2023, except for the today’s stats. This representation is based in whole or in part on data supplied by the Central Panhandle AOR, Emerald Coast AOR or its MLS. Neither the Boards nor its MLS guarantees or is in any way responsibles for its accuracy. Data maintained by the Board or its MLSs may not reflect all real estate activity in the market. Report reflects activity by all brokers participated in the MLS.
Garett Huber
Compass
Cell Phone: (850) 830-1801
https://huberluxurygroup.com
03 - Bay County - Beach
Published: August 2023*
Property Types: Residential - Condominium
Price Range: $0 - No Limit SQFT Range: 0 - No
Bedrooms: 0 - No Limit Full
0 - No
It was a Buyer's Market*
Absorption Rate measures the inverse of Months of Inventory and represents how much of the current active listings (as a percentage) are being absorbed each month.
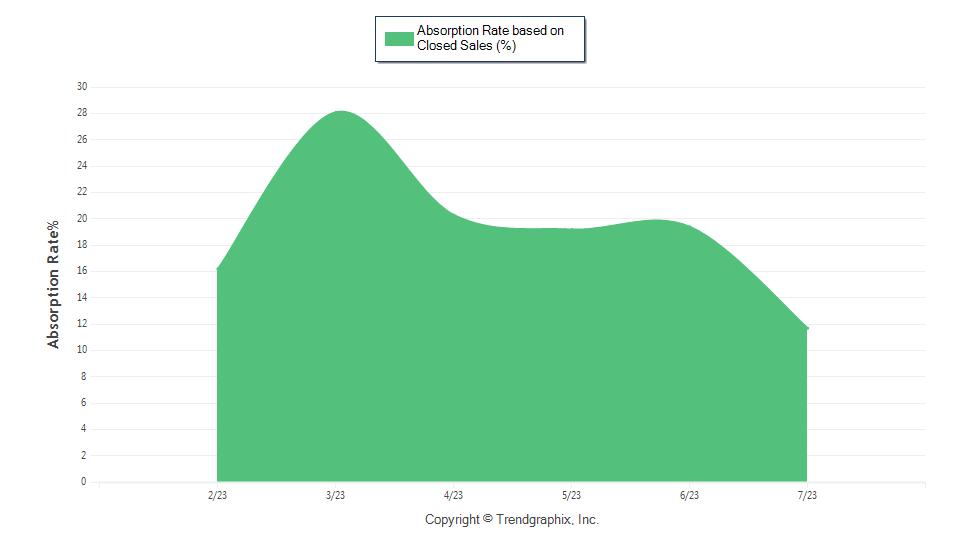
*Buyer’s market: 16.67% and below
Seller’s market: 33.33% and above
Neutral market: 16.67% - 33.33%
Absorption Rate based on Closed Sales
The July 2023 Absorption Rate based on Closed Sales of 11.7 was down 39.7% compared to last month.
Absorption Rate based on Pended Sales
The July 2023 Absorption Rate based on Pended Sales of 19.1 was up 20.9% compared to last month.
Limit
Limit Year Built:
Limit
Baths:
Limit Half Baths: 0 - No
0 - No
All reports are published August 2023, based on data available at the end of July
Boards nor its MLS guarantees or is in any way
2023,
except for the today’s stats. This representation is based in whole or in part on data supplied by the Central Panhandle AOR, Emerald Coast AOR or its MLS. Neither the
responsibles for its
accuracy. Data maintained by the Board or its MLSs may not reflect all real estate activity in the market. Report reflects activity by all brokers participated in the MLS.
Garett Huber
Compass
Cell Phone: (850) 830-1801
https://huberluxurygroup.com
03 - Bay County - Beach
Published: August 2023*
Property Types: Residential - Townhouse
Price Range: $0 - No Limit
Full Baths: 0 - No Limit
Year Built: 0 - No Limit
Bedrooms: 0 - No Limit
Half Baths: 0 - No Limit
Panama City Beach Area Report - Townhome
July 2023 was a Seller's market! The number of for sale listings . The number of sold listings . The number of under contract listings was 0. The Months of Inventory based on Closed Sales was 1.
The Average Sold Price per Square Footage was 0. The Median Sold Price was 0. The Average Sold Price was 0. Based on the 6 month trend, the Average Sold Price trend was "Depreciating" and the Median Sold Price trend was "Depreciating".
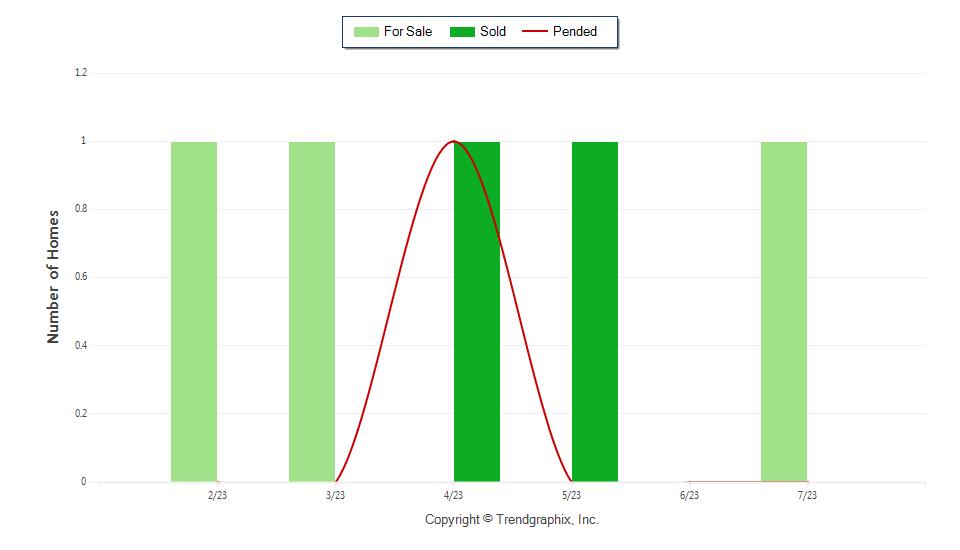
The Average Days on Market showed a downward trend. The ratio of Sold Price vs. Original List Price was 0%.
It was a Seller's Market
Property Sales (Sold)
July property sales were 0, .
Current Inventory (For Sale)
The total number of homes available this month was 1. The number of current inventory was the same as the previous month.
Property Under Contract (Pended)
The total number of homes pended in month was 0.
All reports are published August 2023, based on data available at the end of July 2023, except for the today’s stats. This representation is based in whole or in part on data supplied by the Central Panhandle AOR, Emerald Coast AOR or its MLS. Neither the Boards nor its MLS guarantees or is in any way responsibles for its accuracy. Data maintained by the Board or its MLSs may not reflect all real estate activity in the market. Report reflects activity by all brokers participated in the MLS.
Garett Huber
Compass
Cell Phone: (850) 830-1801
https://huberluxurygroup.com
03 - Bay County - Beach
Published: August 2023*
Property Types: Residential - Townhouse
Price Range: $0 - No Limit
Full Baths: 0 - No Limit
Year Built: 0 - No Limit
The Average Sold Price per Square Footage was Depreciating*
The Average Sold Price per Square Footage is a great indicator for the direction of property values. Since Median Sold Price and Average Sold Price can be impacted by the 'mix' of high or low end properties in the market, the Average Sold Price per Square Footage is a more normalized indicator on the direction of property values. The July 2023 Average Sold Price per Square Footage of $0.
*Based on 6 month trend – Appreciating/Depreciating/Neutral
Bedrooms: 0 - No Limit
Half Baths: 0 - No Limit
The Days on Market Showed Downward Trend*
The average Days on Market (DOM) shows how many days the average property is on the market before it sells. An upward trend in DOM trends to indicate a move towards more of a Buyer’s market, a downward trend indicates a move towards more of a Seller’s market. The DOM for July 2023 was 0.
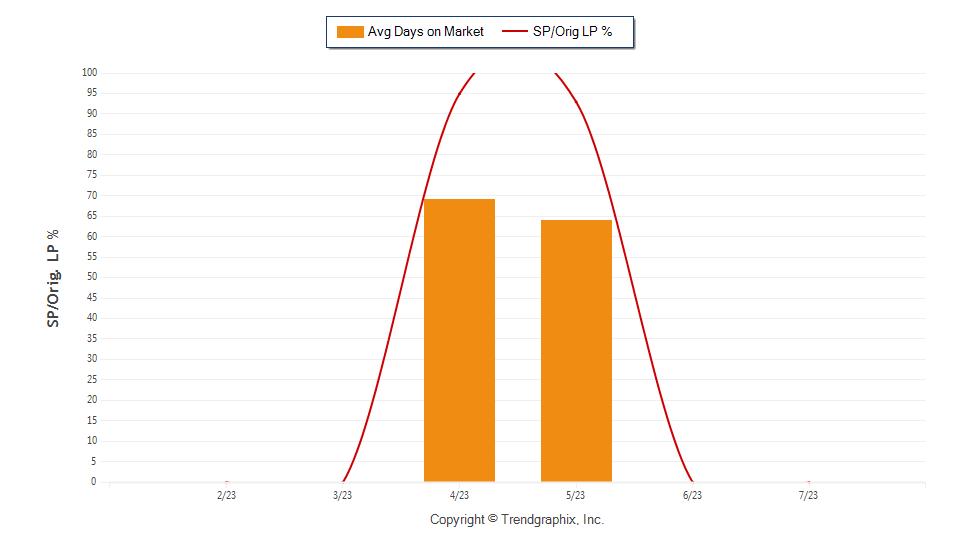
The Sold/Original List Price Ratio was Falling**
The Sold Price vs. Original List Price reveals the average amount that sellers are agreeing to come down from their original list price. The lower the ratio is below 100% the more of a Buyer’s market exists, a ratio at or above 100% indicates more of a Seller’s market. This month Sold Price vs. Original List Price was 0% .
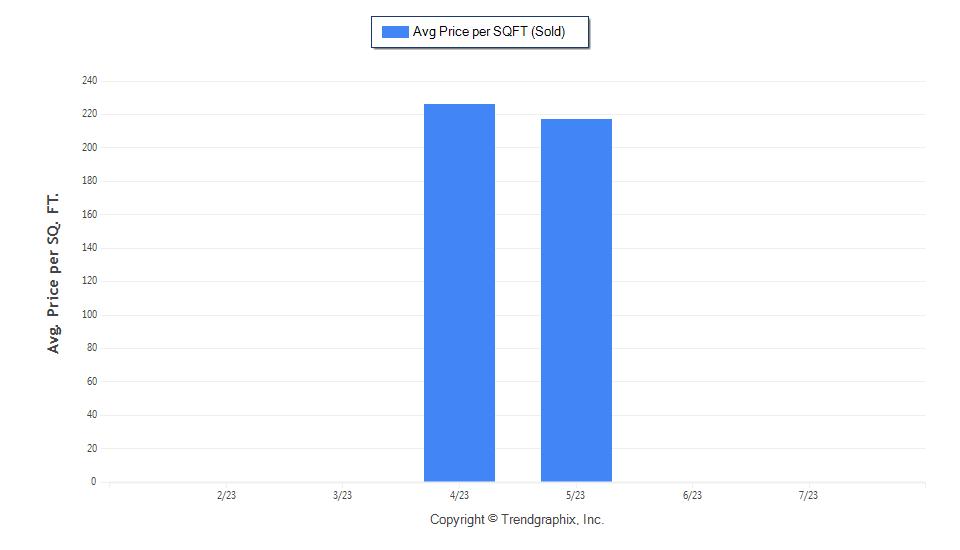
*Based on 6 month trend – Upward/Downward/Neutral
** Based on 6 month trend – Rising/Falling/Remains Steady
All reports
published August 2023,
are
based
on data available
at
the end
of
July
2023, except for the today’s stats. This representation is based in whole or in part on data supplied by the Central Panhandle AOR, Emerald Coast AOR or its MLS. Neither the Boards nor its MLS guarantees or is in any way responsibles for its accuracy. Data maintained by the Board or its MLSs may not reflect all real estate activity in the market. Report reflects activity by all brokers participated in the MLS.
Garett Huber
Compass
Cell Phone: (850) 830-1801
https://huberluxurygroup.com
03 - Bay County - Beach
Published: August 2023*
Property Types: Residential - Townhouse
Price Range: $0 - No Limit
Full Baths: 0 - No Limit
Year Built: 0 - No Limit
The Average For Sale Price was Appreciating*
The Average For Sale Price in July was $1,100,000.
The Average Sold Price was Depreciating*
The Average Sold Price in July was $0,000.
The Median Sold Price was Depreciating*
The Median Sold Price in July was $0,000.
*Based on 6 month trend – Appreciating/Depreciating/Neutral
Bedrooms: 0 - No Limit
Half Baths: 0 - No Limit
It was a Seller's Market*
A comparatively lower Months of Inventory is more beneficial for sellers while a higher months of inventory is better for buyers.
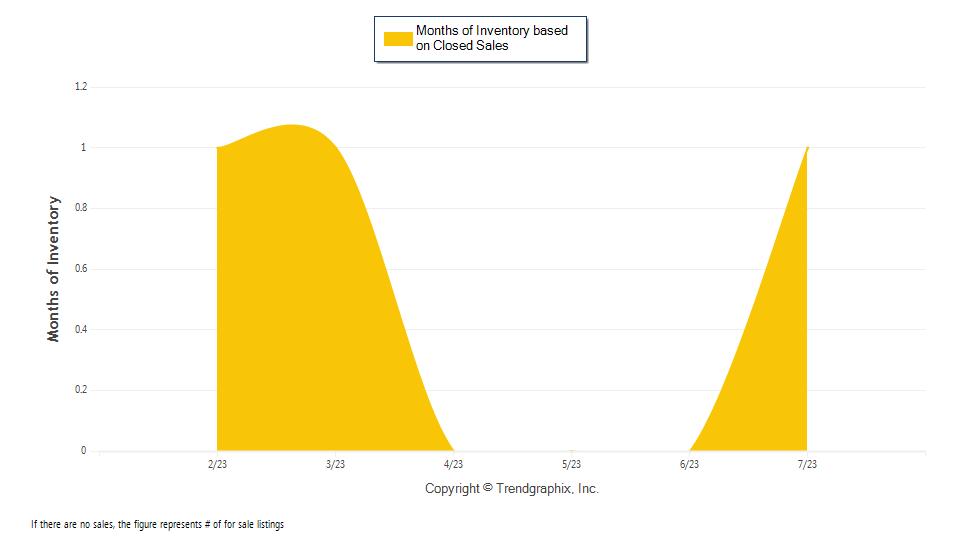
*Buyer’s market: more than 6 months of inventory
Seller’s market: less than 3 months of inventory
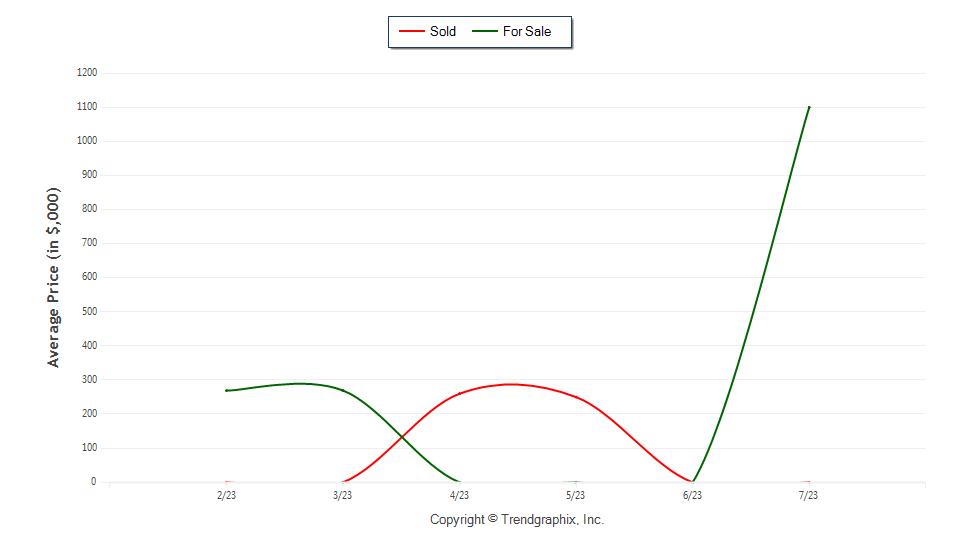
Neutral market: 3 – 6 months of inventory
Months of Inventory based on Closed Sales
The July 2023 Months of Inventory based on Closed Sales of 1 was and the same compared to last month. July 2023 was Seller's market.
Months of Inventory based on Pended Sales
The July 2023 Months of Inventory based on Pended Sales of 1 was and the same compared to last month. July 2023 was Seller's market.
All reports are published August 2023, based on data available at the end of July 2023, except for the today’s stats. This representation is based in whole or in part on data supplied by the Central Panhandle AOR, Emerald Coast AOR or its MLS. Neither the Boards nor its MLS guarantees or is in any way responsibles for its accuracy. Data maintained by the Board or its MLSs may not reflect all real estate activity in the market. Report reflects activity by all brokers participated in the MLS.
Garett Huber
Compass
Cell Phone: (850) 830-1801
https://huberluxurygroup.com
03 - Bay County - Beach
Published: August 2023*
Property Types: Residential - Townhouse
Price Range: $0 - No Limit
Full Baths: 0 - No Limit
Year Built: 0 - No Limit
It was a Buyer's Market*
Absorption Rate measures the inverse of Months of Inventory and represents how much of the current active listings (as a percentage) are being absorbed each month.
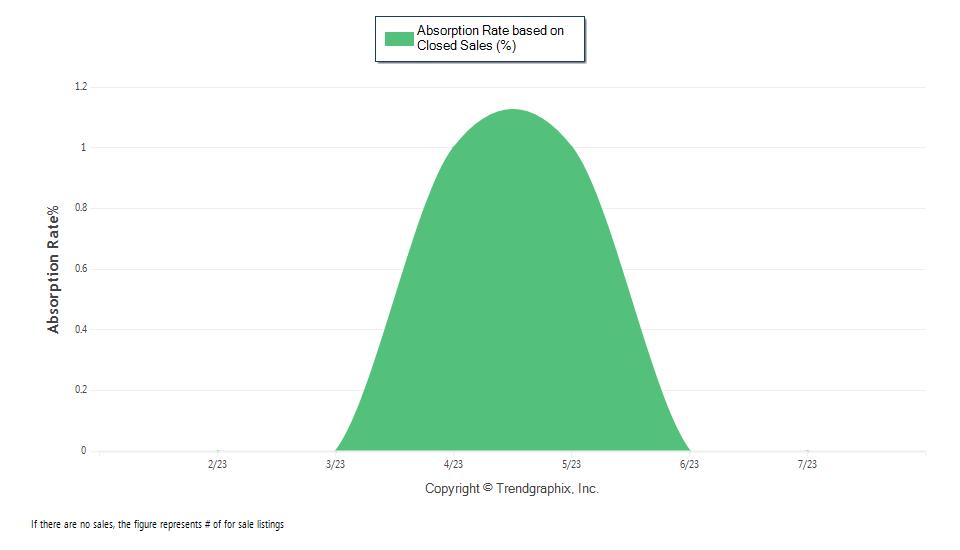
*Buyer’s market: 16.67% and below
Seller’s market: 33.33% and above
Neutral market: 16.67% - 33.33%
Absorption Rate based on Closed Sales
The July 2023 Absorption Rate based on Closed Sales of 0 was and the same compared to last month.
Absorption Rate based on Pended Sales
The July 2023 Absorption Rate based on Pended Sales of 0 was and the same compared to last month.
Bedrooms: 0 - No Limit
Half Baths: 0 - No Limit
All reports are published August 2023, based on data available at the end
Boards nor its MLS guarantees or is in any way
of
July 2023, except for the today’s stats. This representation is based in whole or in part on data supplied by the Central Panhandle AOR, Emerald Coast AOR or its MLS. Neither the
responsibles for its accuracy. Data maintained by the Board or its MLSs may not reflect all real estate activity in the market. Report reflects activity by all brokers participated in the MLS.
GARETTHUBER REALTOR®,CLHMS

850.830.1801
garett@livebythebeach.com
www.livebythebeach.com
DEDICATION | COMMITMENT | TRUST
A full-time Realtor within Santa Rosa Beach and surrounding areas, Garett offers a wealth of knowledge and experience that is unsurpassed. Garett’s keen insight into vacation homes, as well as investment properties, is why he is able to adapt to the ever-changing real estate market.


Garett’s experience is why his clients are excited to refer his services to their family, friends and colleagues. Garett’s strengths are prompt communication, service to his clients, as well as trust and commitment.
Originally from New Orleans, Garett moved to the South Waltan area over 25 years ago to start up a closet organization business during the housing boom in the early 2000’s. After many years as a successful business owner, Garett decided to enter into the real estate industry to continue working with homeowners where he has found great fulfillment.
COMPASS FL 2048 W County Hwy 30, Suite 107, Santa Rosa Beach, Florida 32459
“The Most Trusted Realtor Along The Emerald Coast”
