

Acknowledgement of Country
We acknowledge the Kaurna and Ngadjuri Peoples as the Traditional Owners of the country that makes up the Light Regional Council. We respect their spiritual relationship to their country and acknowledge that as Traditional Custodians, their cultural heritage and beliefs are still as important today.

A special thanks to Mayor Bill O’Brien for his captivating photography of our region. Some of his photos are featured throughout this document.
Terms used in this plan
ABP
CAD
CWMS
Developer
Fees and Charges
GHG
IAMP
Internally Generated Funds (IGR)

Annual Business Plan (this document)
Cash Advance Debenture (borrowing) – a borrowing instrument that can be repaid when surplus cash allows to reduce finance costs.
Community Waste-Water Management Scheme (common effluent scheme)
Land development, mostly residential subdivisons for private housing but will progressively involve further commercial developments.
In accordance with the Local Government Act councils annually review its many fees/charges – refer website for the register.
Greenhouse Gas (emissions) by LRC.
Infrastructure Asset Management Plan
Funds generated by providing for depreciation (non-cash) in the comprehensive income statement. Provided an operating surplus is forecast these funds are expected to be available to fund the renewal of the assets that are being depreciated
LRC Light Regional Council
LTFP Long Term Financial Plan
PPP
Strategic Management Plans
Public Private Partnership – a joint venture scheme between LRC and a private sector partner
Strategic Plan (revised in 2024), IAMP and LTFP
Transportation Infrastructure Roads (sealed and unsealed, kerbing, footpaths, stormwater drainage)
Website
Light Regional Council website www.light.sa.gov.au

MESSAGE FROM THE MAYOR

On behalf of all my Council colleagues I am pleased to present to you with the Annual Business Plan, Budget and Long-term financial plan for 2024-2025, a culmination of thorough planning and detailed analysis underlined by a commitment to serving the needs of our community while ensuring financial stability.
The Annual Business Plan and Budget is not just a financial document; it reflects our values, priorities and aspirations as a community. It represents a delicate balancing act, where we must consider the ever-growing costs of providing essential services and infrastructure by finding efficiencies, streamlining operations and exploring alternatives while also striving to minimise rate increases.
In preparing this Business Plan our commitment to financial responsibility does not come at the expense of meeting the needs and expectations of our community. We recognise and acknowledge that our residents and the business community across our vast region rely on us to provide essential services and maintain and improve infrastructure, while building a successful, resilient, and inclusive community where every resident and business have the opportunity to thrive.
In the year ahead your Council will continue to provide services and programs that are well considered and responsive to community needs, expectations and aspirations. Together, we will continue to navigate the challenges ahead and build a brighter future for all.
I extend my sincere gratitude to our dedicated and diligent staff, Elected Members and residents for their input, collaboration, and support throughout the year and to this budgetary process.
Bill O’Brien Mayor


HOW THE PLAN WAS PREPARED
The Annual Business Plan (ABP) process enables Council to review its annual and four (4) year financial plans and Long-Term Financial Plan. The process includes the review and refinement of budgetary considerations concerning the cost and level of service provision; management of Council’s assets; proposed infrastructure programs; economic development initiatives; and new projects and initiatives proposed. All initiatives and their expenditure are assessed against the financial impact on the community, ratepayers and Council.
Several economic and operational influences and assumptions were reviewed and revised to update existing financial plans.

Light Regional Council’s suite of strategic plans, listed below, are the underpinning documents from which the 2024/2025 Annual Business Plan (ABP) is formulated:
• Strategic Plan 2024-2028
• Infrastructure and Asset Management Plan (IAMP)
• Long Term Financial Plan (LTFP) 2024-2034
• Four (4) year Capital Works and Budget program.
During 2023/24 the IAMP’s ‘Transportation’ Infrastructure assets were reviewed, condition re-assessed and revalued. The review included a re-assessment of construction costs and useful lives. As a consequence there was a significant increase in forecast depreciation.
This plan proposes the 2024/2025 budget allocation and advises of the projects and services that are planned to be delivered to the community over the next 12 months and a four (4) year capital ‘works’ program. Activities to be undertaken included in this ABP:
• Summary of the long-term financial objectives
• An outline of Council’s objectives for the 2024/2025 financial year, including activities to be undertake to achieve those objectives and the targets (financial and non-financial) to be used to assess the performance against its objectives over the financial year
• Summary of proposed operating expenditure, capital expenditure and sources of revenue, whilst considering the financial requirements for the financial year
• Property rating structure and associated policies
• An assessment of the impact of the rates structure and policies on the community, based on analysis that has been undertaken.
Following the public consultation process, Council reviews public feedback received and will consider the final plan at the 25 June 2024 Ordinary Council Meeting.

(2023
Census)


COMMUNITY SERVICE AND PROGRAMS
What makes the region a great place to live, work and play.
Maintenance of Community Halls and Facilities
Includes: Town Institutes, Hewett Centre, Kapunda RSL, Men’s Shed, Herald Printing office, Kapunda Kindergarten.
Services for the Aged and Disabled
Provide home maintenance and support services through The Barossa Region Home Assist Scheme.
Children and Youth Services
Providing programs and services for young people, self-development opportunities, immunisation program and youth sponsorship.
Community Transport
Services to assist those in the community who are transport disadvantaged, such as the aged and younger disabled residents without access to transport.

Library Services
Three branch libraries plus outreach locations. Programs and resources to support lifelong learning, literacy, social connectivity, and skill development.
Community Development
Grant and sponsorship programs, community, advice, advocating for the health and wellbeing of the community.
Cultural and Heritage
Kapunda Museum and Community Art Gallery. Grant funding under the Heritage Incentive Scheme to owners of local heritage places.
Parks, Gardens and Recreation Facilities
Planning, planting and maintenance of reserves, ovals, and gardens. Maintenance of the Kapunda Swimming Pool.
Economic Development
Economic development plan, encouraging investment in the region, supporting the agribusiness and tourism industries.
Street Lighting
Maintaining 1,200 existing public lights and installing new lighting, including reserve lighting, sports field, court and car park lighting.
Public Health
Regulating food safety, vermin control, waste-water management in Kapunda, Freeling, Greenock, Roseworthy, and Neil Ave in Nuriootpa.
Infrastructure and Asset Management
Maintenance of bus shelters, cemeteries, footpaths on local streets, shared use paths, and sealed, unsealed, and unformed roads.
Tourism and Events
Kapunda Visitor Information Centre (accredited), visitor experience, event promotion, and website lightcountry.com.au
Planning and Development
Provision of planning and building related services, ensuring compliance with development legislation.
Compliance and Parking
Dog and cat management, nuisance, and litter control, permits for fires and burn offs, parking enforcement.

Emergency Planning
Provide advice to residents on fire risk management, local and zone emergency management plans.
Streetscaping
Planning, planting and maintenance of verges and streetscapes. Street tree planting, maintenance and weed control. Emptying of public bins.
Waste Management and Recycling
Domestic kerbside collection, hard rubbish, e-waste, litter control, illegal dumping, and street cleaning.
Stormwater Management
Stormwater drainage within the townships is monitored and maintained to prevent flooding.
Sustainability and Biodiversity
Maintaining and creating natural spaces that sustain local biodiversity.

2024/2025
HIGHLIGHTS
• Long term financial sustainabilitykey sustainability measures and reasonable rate increase.
• Purchase strategic land in the Roseworthy expansion precinct
• 4-year capital works program aligned to the recommendations from the revised IAMP, including an increase in renewal funding from $4.5 million to $7.6 million consistent with the strategic plan goal.
• Progressive implementation of GHG reductions following the GHG audit in 2023/2024.
• Balanced operating budget with a small surplus forecast.

MEASURING PERFORMANCE
Success is measured by the achievement of key financial and strategic objectives and performance indicators aligned to the 2024-2028 Strategic Plan, Long-Term Financial Plan, Infrastructure and Asset Management Plan (IAMP) and supporting corporate documentation.

When evaluating activities undertaken during any given financial year, several factors are considered, one being the future financial sustainability (refer CEO Financial Sustainability Statement in the Long term financial plan (LTFP) document). These measures are all ‘long-term’ so the trend over time is as important as the result or target for any individual financial year. Refer section ‘Long Term ratios’. The LTFP demonstrates Council’s financial sustainability and was prepared considering:
• The revenue and expenditure results for the past five years;
• Intergenerational equity to ensure future generations of ratepayers do not face overwhelming debt provided to the current generation;
• Expenditure programs, both operating and capital aligned to Strategic Plans; and
• Rate revenue increases that are responsible and reflect the community’s ability to pay.
Council has foreshadowed that it will further consider whether to undertake service reviews during 2024/25

CLIMATE

Climate and weather have a number on different influences on LRC business planning and directly impacts organisational performance.
The following chart presents monthly, annual and average (long term) rainfall statistics in the region, as being an aspect of climate that has the most influence. Influences include:
1 Operations and asset management
high rainfall can disrupt operations and damage road infrastructure, although reasonable rainfall can also assist with unsealed road maintenance. It is generally accepted that infrastructure construction activities are planned for lower rainfall months. Higher rainfall is an advantage to water recycle schemes.
2 Economy
rainfall is a fundamental input to the local economy heavily dependent on agriculture, not only directly but also indirectly to the businesses and services that support agriculture.
3 Bushfire risk
high rainfall results in higher-thannormal vegetation growth, which when dry later increases bushfire risk.
Business planning assumes average rainfall and seasonal patterns, but the workforce needs to be adaptive to high seasonal variability.
Analysis
2023 was a ‘well below average rainfall year’, being 33% less the long-term average, with 3 months having rainfall greater than the long-term average for those months. This followed an aboveaverage rainfall in 2022 when annual rainfall was 54% greater than the long-term average and 9 months of above-average rainfall. It was a good start to late autumn, early winter with above-average rainfall in May and June, but the next four months were well below average.
In the past 7 years there have been 2 years where rainfall was significantly greater than the long-term average rainfall and 2 years approximately equal to the long-term annual average. 2019 was the driest year with only 64% of the long-term average, and 2023 was 67%.
Rainfall (Nuriootpa) 2023 v Long Term Average
Source: BoM (Nuriootpa data)

STRATEGIC DIRECTION
A new plan was developed for 2024 - 2028. The plan outlines the shared aspirations of the community and Council for the future development of the area. By articulating the collective vision, the plan is a roadmap for the next four years, explaining the strategic focus areas, key projects, and essential services that Council will prioritise to actively work towards achieving these overarching goals.
Our Council
The Light Regional community played an important role in shaping the plan, ensuring that it reflects the needs and expectations of the residents.
The full Strategic Plan can be found on our website www.light.sa.gov.au
Core Principles
Light Regional Council is guided by a focus on ‘Core Principles’ of Growth, Reform, Innovation and Discipline.
Vision
Respecting the past, partnering with our community, and sustainably creating our future.
Mission
To be regarded as an exemplary Council that puts the people of Light first, while creating a place that is also welcoming to visitors. Through the services we deliver, we will provide the basis for a community that can grow sustainably, but always within our environmental and financial means.
Values
As a Council we will be guided at all times by:
• Foundation values of respect, honesty, integrity and transparency
• Showing high performance leadership
• Having a constant awareness of the community we serve
• Our need to be viable in financial, environmental and human resources through the core principles
• Striving for quality outcomes
• A focus on achieving positive environmental, social and governance outcomes from Council’s activities.
Long Term Goals

Leadership
An inclusive, accountable and collaborative Council that supports business and community.
Community
A vibrant country community, growing sustainably, with housing, services and places that support a healthy and happy life for all.
Transport
Quality road, path, public and community transport networks that make it easy to get around.
Sustainability
A thriving, healthy and resilient community working together to protect and restore our environment now and for the future.
Economy
A diverse economy sustained by its rural identity and heritage.
Focus for next 4 years
• Advocacy for health care
Community
Transport
Sustainability
• Improving sport and community facilities
• Ensuring places and activities for people of all ages, abilities, backgrounds and means
• Identifying and advocating for affordable housing, infrastructure and facilities for the existing and growing population
• Improving the quality and safety of Council roads
• Advocacy for improved bus and rail services, roads and speed limits
• Creating pleasant and connected pedestrian and cycle routes
• Exploring community transport opportunities
• Protecting and resorting natural areas and creating sustainable landscapes
• Encouraging community environmental sustainability
• Preparedness of community and Council for extreme weather events
• Striving towards environmental sustainability of operations by the progressive reduction of GHG emissions to achieve net zero
Economy
Leadership
• Protecting agriculture and character areas and enhancing associated industries, including manufacturing
• Encouraging value add enterprises and economic diversification
• Investing in initiatives designed to attract investments that also benefit our community
• Creating vibrant mainstreets and infrastructure to support local businesses
• Improving tourism information and wayfinding to extend visitation
• Enhancing community engagement for all ages and backgrounds
• Improving the customer experience and enhancing the customer satisfaction
• Transparency of Council decisions
• Leading collaboration to share resources and strengthen advocacy
Projects identified in the Strategic Plan
LONG TERM GOALS
Project
Sport and recreation precinct master plans
Walking and cycling network program
Township improvement program
Roseworthy recreation and community facilities
Develop master plans for the major township sporting and recreation precincts to address gaps in off-field amenity provisions and ensure facilities are fit for purpose based on their hierarchy/classification and our growing communities.
Walking and cycling network mapping and targeted improvements to support health and wellbeing, access to community and tourist destinations, encourage low emission transport and activating disused rail corridors where appropriate.
Collaboration with each township to identify targeted upgrades to main streets, transport corridors and community facilities that consider accessibility, community inclusion, greening and visitor attraction.
Explore and prepare a collaborative plan for new community and recreation facilities to service the Roseworthy area to meet growing community need.
Net zero Reduce Council’s GHG emissions to achieve net zero by 2050 and help the community to achieve similar emission reductions.
Customer success
Develop a strategy that establishes a customercentric culture and enhances the customer experience and engagement, with a focus on continual improvement to optimise performance and elevate service delivery across all functions.
Drovers Encounter Partner with Investors and Operators to implement the Drovers Encounter - a multi-dimensional authentic Australian tourism experience in Kapunda centred around culinary, cultural and entertainment experiences to enhance the local economy and jobs.
Regional collaboration and advocacy
Council road review program
Strategic land
Establish collaborative governance relationships and agendas in the region to strengthen advocacy and investment and share resources for improved regional outcomes in planning, healthcare, public and community transport, roads, recreation and wellbeing.
Program of mapping, reclassification and prioritised upgrades to improve the quality and safety of Council’s roads.
Secure land that could be developed for affordable housing, community facilities, operational efficiencies or economic stimulus opportunities.

SIGNIFICANT INFLUENCES
The following budget parameters and assumptions were applied for the purpose of preparing the 2024/2025 ABP and Budget.
• The Operating Budget be developed with reference to and within the framework of the adopted 2024-2034 updated Long Term Financial Plan (LTFP); Infrastructure Asset Management Plan (IAMP); and the 4-year budget.
• Operating surplus 0-5% of revenue (sustainability ratio).
• Material, Contracts and Other Expenses indexation be set at 3% in the absence of any other reliable way of estimating this expenditure group, excluding specific cost items where known cost will exceed this stretch target, e.g. energy (diesel fuel, electricity, insurance, specific contracts).
• Wages and Salaries increase by 6.4% in 2024/25, and then aligned with Reserve Bank inflation forecast for future years and zero employee growth (Enterprise agreements were still under negotiation)
• Fees and charges not otherwise set by legislation be increased by 3% at a minimum.
• New Capital Projects consistent with the IAMP and approved within the constraints of the LTFP.
• New services, increases in service levels and one-off projects to be funded through rate revenue increases or by expenditure savings.
• Infrastructure Asset Management Plan (IAMP) forecasts (included a revised ‘Transportation infrastructure’), indexed for inflation after 2024, have been included in the long-term financial plan commencing from the 2023/2024 financial year.
• Participation in regionally significant projects and investigate shared resource opportunities where practicable.
• Annual Business Plan (ABP) objectives for 2024/2025 are aligned with the goals and objectives in Council’s Strategic Management Plan 2024-2028.
• Roseworthy Water Scheme - the Bunyip 2 water scheme based on its forecast long term positive net present value.
• Northern and Yorke Landscape Board advised the landscape levy arrangements for the 2024/2025 year will increase by 1.1%.

ANNUAL BUDGET FOR OPERATIONAL SERVICES
Where Council’s Revenue Comes From
Operations and programs are funded by revenue from sources such as general rates, fees and charges levied on services (Statutory Charges and User Charges), grants from State and Commonwealth Governments, interest income from investing excess cash in short-term investments, reimbursements, and other sundry revenue sources. The source of Council’s estimated $30.423m revenue, for the 2024/2025 Financial Year, is described below.
Operating Income by Source $
537,000 User Charges 31,000 Investment Income 256,000
375,000 Other Income 737,000 Statutory Charges
2,849,000 Grants, Subsidies and Contributions
25,638,338 Rates
Rates
Rates are the main source of funding for the activities undertaken. A projected total of $25.6m ($23.0m in 2023/2024 – excluding landscape levy collected on behalf of State Government) will be levied in 2024/2025 Financial Year, to fund essential services (non-discretionary) such as waste collection, management of basic infrastructure, public health and safety, as well as discretionary services such as libraries, community programs, and events. Rates revenue includes a separate rate income from the Roseworthy Water Scheme for the 2024/2025 financial year (part of the year from commencement of scheme operations).
Statutory Charges
Statutory charges are fees and fines levied in accordance with legislation including development application fees, animal registrations, Health Act registrations, and parking fines. It is estimated that statutory charges of $0.737m will be collected in 2024/2025 ($0.627 in 2023/24).
User Charges
User charges relate to the recovery of service delivery costs through the charging of fees to users of services. These include charges for the use of Council facilities, library printing and photocopy charges, Section 7 property searches etc. Council estimates user charges income of $0.537m in 2024/2025, an expected decrease over 2023/2024 budgeted user charges of $0.520m.

Grants, subsidies, and contributions
Grants, subsidies, and contributions income includes monies received from State and Commonwealth Government sources that fund the delivery of services to ratepayers. Grants income for the 2024/2025 financial year has been budgeted based on both confirmed and estimated funding levels. The budget includes $0.587m of Roads to Recovery funding ($0.424m 2023/2024) and $1.831m of South Australian Local Government Grants Commission general and roads funding. Developer contributions of $0.143m are expected towards the ‘Bunyip 2’ water scheme project.
The Government of South Australia allocates funds annually to support public libraries in South Australia, complementing the funding allocation by individual councils to public libraries. Light Regional Council anticipates $0.117m of public libraries funding for 2024/2025.
Investment Income
Investment income primarily earned in the form of interest from the investment of cash surpluses throughout the financial year. The repayment of loans given to community organisations is also reflected as investment income. Investment income for 2024/2025 is forecast at $0.031m.
Reimbursements
During 2024/2025 Council anticipates it will seek reimbursement of $0.256m compared to $0.221 in 2023/2024 from through the provision of various services, such as private works.
Other Income
Other income relates to a range of unclassified items that do not fit within the main revenue categories. It is estimated that other income will be $0.375m in 2024/2025 financial year compared to $0.363m budgeted in 2023/2024.
How Each Dollar of Revenue is Spent
A substantial amount of operating expenditure is related to delivering ongoing services such as libraries, and the maintenance of roads, parks, playgrounds, reserves, cemeteries, and economic development and township planning activities. In addition to the usual expected services, specific one-off programs and projects are undertaken (Operating Projects) to meet its strategic objectives.
The following chart illustrates estimated 2024/2025 financial year operating expenditure of $30.4m by the main expenditure categories.
Operating Expenses by Type $
10,585,136 Materials, Contracts & Other Expenses
8,704,231 Depreciation, Amortisation & Impairment
10,564,000 Employee Costs
204,900 Finance Costs - General
344,000 Finance CostsBunyip 2 water scheme
Employee Expenses
Employee expenses include all labour related expenditure such as salaries, wages, allowances and on-costs (including Annual Leave, Long Service Leave, Superannuation, Workers Compensation Insurance etc.).
For the 2024/2025 financial year, employee costs are forecast at $10,564m compared with a budgeted amount of $10.560m in 2023/2024. The increase includes:
• An estimated increase in the Enterprise Agreements
• An increase in statutory superannuation contributions of 0.5%
• graduate progression through classification levels
• resourcing levels that enable business obligations to be met, provide necessary community services, meet legislative requirements, and deliver significant infrastructure programs
• Estimated employee costs ‘capitalised’ to infrastructure construction projects.
Post-Covid, as being experienced elsewhere, the level of staff turnover has increased and the ‘vacancy-gap’ until replacements are recruited diminishes service delivery capability. Another measure, widely used in other governments, has been introduced to accurately calculate the ‘gap’, and is known as ‘paid FTE’. ‘Paid FTE’ is calculated by dividing the total amount of work hours paid (inclusive of any overtime) by the number of working hours in a year. Refer table below, which compares ‘position’ FTE with ‘paid’ FTE. ‘Position’ FTE is at a point in time (30 June), but ‘paid FTE’ is for the hours worked during the financial year. The 2024/2025 budget has been prepared based on ‘paid’ FTE acknowledging that staff turnover is expected to continue for the foreseeable future and the need to continue to deliver services with ‘less’. ‘Paid FTE’ will be monitored carefully during the year to determine whether an additional staffing strategy is necessary, although turnover is not expected to diminish in the near term.
Materials, Contracts and Other Expenses
Materials include items such as electricity, water, fuel, civil construction materials, printing, and other miscellaneous costs.
Contracts relate to the provision of services by external providers and include items such as waste collection, security, leases and some infrastructure repairs and maintenance.
Other Expenses relate to a range of items including contributions to community groups, advertising, insurances, motor vehicle registrations, payment of the Landscape Levy and other miscellaneous expenditure.
It is estimated that $10.585m (exclusive of ‘Bunyip 2’ entity) will be spent on materials, contracts, and other expenses during the 2024/2025 financial year, compared to a budget of $10.367m in 2023/2024.

Depreciation, Amortisation, and Impairment
Depreciation is an accounting charge that measures consumption of property, plant and equipment (including infrastructure assets such as roads and stormwater drainage) over the estimated effective useful life of the assets. Another measure of infrastructure sustainability is a comparison of the long-term average infrastructure renewal expenditure with the long-term average depreciation. The long-term financial plan includes estimates of depreciation for infrastructure assets ‘handed over’ by land developers. A review of asset condition and lives is being progressively undertaken which may have an impact on depreciation with the next phase being buildings and related infrastructure.
During 2023/24 a condition assessment and revaluation of all ‘Transport’ Infrastructure assets was undertaken which has resulted in a substantial increase in annual depreciation.
The forecast amount of depreciation for 2024/2025 is $8.704m compared with $6.342m originally budgeted for 2023/2024, an increase of $2.362m or 37%. The revaluation and depreciation change was effective from 1 July 2023.
Finance Costs
Finance costs mainly relate to interest charged by the Local Government Finance Authority on funds that have been borrowed and other bank fees. Interest costs have been estimated based on the current loan portfolio as of May 2024.
Interest costs for 2024/2025 are forecast at $0.549m ($0.243m in 2023/2024) and reflects interest rates for variable loans and Cash Advance Debenture (CAD) borrowings during the 2024/2025 financial year. The key assumption is that there will be one (1) reduction in interest rates of 0.25% during the financial year. Interest cost forecasts include an estimate of offset when surplus cash is used to reduce the amount of drawn CAD.

Budgeted Statement of Comprehensive Income
The Statement of Comprehensive Income, which incorporates all operating income and expenses is provided below. A surplus operating result is forecast for the 2024/2025 financial year (surplus of $0.021m).
The ‘Bunyip 2’ (Roseworthy Water Scheme) project involves commercial information of a confidential nature and was considered by Council ‘in confidence’ under the Local Government Act, 1999 in April 2022. The details of this project will be released in due course. Council has approved the Bunyip 2 water scheme to proceed subject to the receipt of State Government grants and the approval of loan funds, based on its forecast long term positive net present value.
The budgeted operating result for 2024/2025 varies unfavourably by $0.615m against the projected surplus (inclusive of Bunyip 2 PPP project) of $0.635m as stated in the 2023-2033 Long Term Financial Plan adopted by Council in June 2023.
Measured against the projections for 2023/2024, adopted by Council in the 2023-2034 LTFP, the key variances include:
Revenue
• User charges $0.108 million less than the LTFP target
• Grants and subsidies $0.841 million more than the LTFP target
Expenditure
• Employee costs $0.226 million more than the LTFP target
• Depreciation - significant increase due to the revaluation to the ‘Transportation’ component of Infrastructure Assets, being $2.041m more than the LTFP target
• Finance charges $0.255 million less than the LTFP target
Statement of Comprehensive Income
Comprehensive Income
in Asset Revaluation Surplus (1,005,000)
Accounted Council Businesses
Impairment (Expense) / Recoupments Offset to Asset Reval (1,205,000) Total Other Comprehensive Income (2,167,000) - - - - -
FOUR YEAR BUDGET
In addition to the LTFP, the 2024/2025 ABP details key projects, new initiatives, capital and operational works programs for the first four years of the LTFP, referred to as the Four-Year Budget (4YB).
The purpose of including the 4YB in addition to the LTFP and detailed financial and non-financial information for the 2024/2025 financial year is to:
• Communicate the medium-term strategies and outcomes for the next four (4) years aligned to the strategic plan
• Implement a systematic approach towards organisational planning and reviewing, prioritising, and monitoring strategies, projects and initiatives
• Support Council’s budget deliberations by providing additional decision-making assistance
• Facilitate alignment to Council’s suite of corporate documents, the Strategic Plan 2024-2028, LTFP 2024-2034 and IAMP.
In the 4YB Income Statement, Council forecasts a surplus operating position for 2024/2025 and for the duration of the 4 years. The first year of the 4YB includes several new initiatives and projects as outlined in the 4-Year Operating Projects Budget. Year 2 of the 4YB takes up the full year cost of new 2024/2025 initiatives and any incomplete 2023/2024 initiatives.
Additional analysis is provided to indicate an adjusted surplus excluding the ‘Bunyip 2’ water scheme transactions. To illustrate, in 2024/25 the Statement of Comprehensive Income includes net costs of $0.402 million (being interest, water costs, less developer contributions to the scheme). The better ‘underlying’ surplus excluding these net costs is shown as ‘excluding Bunyip’.

Financial Plan for the Years ending 30 June 2034
Statement of Comprehensive Income
Operating Project Program
The Four-Year Income Statement shown above incorporates various existing and new initiatives. Refer to the table below for a description of the operating initiatives and appendix C for detailed capital works program.
Programs/projects - Capital and Operating Expenditure
Operating Initiatives
Pines
Operating
Sustainability Strategy
The Sustainability Strategy would follow LRC’s Environmental Sustainability Strategy and Action Plan. Actions that are undertaken include curbside waste investigations, audit of Councils operational greenhouse gas emissions, increase of renewable energy generation and to prepare and commence delivery of a sustainability communication and engagement plan.
Following the audit of Council’s operational greenhouse gas emissions a draft GHG reduction strategy and targets have been included in the LTFP to track the path to ‘Net Zero’. The LTFP includes targets for a combination of direct offsets (purchase Australian-compliant GHG offset certificates) and indirect offsets (e.g. Green energy), as well as GHG reduction targets, e.g. greening projects. The 2024/2025 ABP incorporates green energy projects, $55,200 over two (2) financial years for GHG offset certificates for waste-water GHG (to be offset by a service charge increase over 2 yearsadditional 3.1% increase above CWMS expenses), and has a general allocation for projects that may include other ‘greening’ initiatives projects.
Reconciliation Strategy
Various actions to be undertaken as outlined by its first Reconciliation Action Plan. This includes partnering with Kaurna and Ngadjuri peoples to incorporate Indigenous biocultural and water knowledge into Council’s biodiversity management planning and supporting NAIDOC initiatives.
Strategic Plan
The council must undertake a comprehensive review of its strategic plan within 2 years after each general election of the Council (Local Government Act, 1999 - section 122 (4)). The council has reviewed its strategic direction ‘from the ground up’ and developed a new plan with external assistance to facilitate engagement, research and development of the strategic plan and contribute broader inputs to this process. The new plan was completed during the 2023/24 financial year. The ABP is aligned to the new strategic plan.
Review of Character Preservation
In conjunction with the Barossa Council, Council has allocated funding towards a project to update policies in the Planning and Design Code that relate to the Barossa Character District. Further discussions with State authorities will guide the development and delivery of this initiative during 2024/2025.
Regional Public Health Plan Coordinator Contribution
The Adelaide Plains, Barossa, Light Regional and Gawler councils collaborated to deliver the region’s second regional public health plan which was adopted by the health minister in August 2022. One of the initiatives includes the regional council partners joint funding a plan coordinator to project manage the development, review and reporting for the Plan. This initiative, delayed in 2023/2024, has been funded for progression in 2024/2025.
Other projects
The plan includes a provision for a scheme to deal with a number of small initiatives to be prioritised by Council with input from the community.
CAPITAL PROJECTS PROGRAM
Council is responsible for a large portfolio of assets with depreciation expense of $8.659 million projected for the 2024/2025 financial year. It is therefore critical for the long-term sustainability of assets for engagement in practises that optimise assets useful lives for the benefit of the community.
The Four-Year Capital Project Budget is comprised of eight existing and new initiatives brought forward through business cases, plus, Council’s Infrastructure and Asset Management Plan (IAMP) program is projected to cost $34.4m over four (4) years.
In the 2024/2025 Financial Year, spending of $16.4m ($19.9m in 2023/2024 – which included $4.2m for a CWMS project) is proposed on its capital program. As highlighted in the table below, this includes $0.500 million related to CWMS renewal.
Programs/projects - Capital and Operating Expenditure
Summary of Four-Year Capital Project Program
Significant ongoing projects adopted in previous years’ budgets:
Security Cameras Public Spaces (six-year program)
To provide cameras at key sites within the region such as the Freeling Skate Park, Goods Shed Reserve / ANZAC Park Freeling, Lions Playground, Hewett Recreation Precinct, Kapunda Main Street, and Roseworthy Recreation Park. Security measures will provide renewed open spaces to enable opportunities for communities to connect and build relationships. The presence of cameras is hoped to deter vandalism and undesirable behaviour and provide the impression of a safer place to visit.
IT computer hardware replacement
Undertaken every 4 years. Council staff work within multiple applications, including cloud applications, (e.g. Teams, Business Central, Nintex, Skytrust, Word, Excel, Powerpoint, etc.) and in many instances these applications running at the same time which requires the computing power of the device to be increased to allow an optimised and painless experience (e.g. eliminating computer slowdowns / crashing / overheating issues. There are some devices that also require higher performance applications to run on them (e.g. Adobe Photoshop and Premier Pro, BlueBeam (for Development Stamping) and Autodesk products (e.g. AutoCAD) so these devices also need to allow for this increased computer capacity associated with these programs. All laptops are part of an enterprise fleet of devices from the Manufacturer, this includes software to allow Council IT Administrators to deploy and provide policies to ensure the security of LRC data on the fleet and use tools such as remote wiping in the event of loss or theft. In addition, manufacturers then provide an extended or Same Day support warranty to attend and remediate devices if there is a defect or incident (e.g. Damaged Screen / Water Damage).
Refer to Appendix C for details of Council’s Capital Asset Renewal Program.

LOANS
New Long-term loans
No new loans are proposed in 2024/2025, or for the life of the long-term financial plan. This excludes any arrangements that may be made with community organisations.
During the 2023/2024 financial year Council secured Cash Advance Debentures (CADs) totalling $16 million for two (2) major projects. These projects, the ‘Bunyip 2’ Roseworthy Water Scheme and a strategic land purchase, are subject to commercial arrangements and have been considered by Council ‘in confidence’ under the Local Government Act, 1999, with the details to be released in due course.
There were some delays in the finalisation of ‘Bunyip 2’ which is now expected to be completed during 2024/25. Similar to challenges being experienced elsewhere in the Australian economy the delays were mainly related to major contractor procurement.
To support cashflow variability during the quarterly rate receipt cycle the cash advance debenture loans that have been previously approved will also be utilised. The actual timing and the amount will be managed based on cash available from day-today by operations in line with Council’s Treasury Management Policy.
Existing loans
The forecast balance of the unpaid loan principal at 1 July 2025 is $2.05 million which includes loans that support assets owned by community organisations on Council land and are repayable to Council by those organisations.
A review ‘CADs’ was undertaken during the 2023/2024 budget ‘process’. A further review with be undertaken during 2024/2025 in association with a review of the Treasury Management Policy and intergenerational fairness.
Borrowing strategy
The borrowing strategy explains that there are four (4) reasons for Council borrowing from the Local Government Finance Authority (LGFA):
1 Credit foncier (principal and interest) debentures made available to and repaid by community organisations (mainly sporting and recreational facilities) for the improvement of their assets.
2 Cash advance debentures for the purpose of cash flow management, mainly to take advantage of the benefits of operational ‘during-year’ surplus cash flow to minimise interest costs.
3 Cash advance debentures for projects where is it expected that there will be a repayment of the loan during or after the successful completion of the project. This approach is being used for the Bunyip 2 ‘water scheme’.
4 Credit foncier (principal and interest) debentures for infrastructure intergenerational assets to enable the cost of the asset to be (as best possible subject to the maximum loan length available) spread over the life of the asset meaning the ratepayer beneficiaries of the asset share in it cost. The policy requires that “the council should, in making any decision, take into account the financial effects of the decision on future generations”. This principle includes that the Council should consider intergenerational fairness including that there should not be volatile shifts in rating levels as a consequence of expenditure on infrastructure assets.
Capital expenditure ‘funding’
The following table reconciles forecast overall capital outlays with the sources of funds used. A shortfall in funds is drawn from available CADs. Significant transactions and assumptions in the table include:
• A land purchase funded by a CAD borrowing.
• The Bunyip 2 recycled water scheme is fully operational during 2023/24, and is ‘taken out’ by the PPP partner allowing for the borrowing to constructure the scheme to be repaid.
• Funds received for the CWMS scheme in temporary excess (mainly depreciation) are held in reserve (although the cash is managed holistically.
Capital expenditure budget & funding
Grants - CWMS
Grants - Bunyip 2
Contributions (developer Bunyip 2) (143) (143) (143)
Bunyip 2 water scheme* - rates/takeout (900) (900) (900)
Internally generated funds - depreciation (8,551) (8,941) (9,436) (10,053) (10,810)
Borrowing - CAD use (Bunyip 2) (2,000) -
Borrowing - CAD use (Strategic Land) (4,500)
Borrowing - CAD use ‘other’**** (155)
funds
outlays/funds
Net change in CAD balances use (accum.) (17,108)
* Bunyip 2 is not LRC capex (advances/loan to Bunyip Water), but treated as such for funding purposes ** Includes strategic land sales *** CWMS - Freeling Wastewater - spend **** CWMS - Freeling Wastewater - grant

SIGNIFICANT CHANGES AFTER THE PUBLIC CONSULTATION
After the public consultation period the following significant changes were made to the draft Annual Business Plan:
• A change in the long-term financial plan and budget in relation to land purchases and land sales, which reduces forecast expenditure, borrowing and delays forecast land sales. Forecast cash advance borrowing for 30 June 2025 has been reduced to $21.246 million from $25.246 million, with resultant interest savings.
• A change in interest rate assumptions. It was originally assumed that there would be two (2) loan interest rate reductions of 0.25% by the Reserve Bank during the 2024/25 financial year, which affects the interest paid on variable cash advance debenture borrowing. This assumption has now been changed to only one (1) interest rate reduction of 0.25% to occur early in the 2025 year resulting in an increase in interest cost.
• Providing for a discretionary rebate to assist ratepayers, on application, with very high increases in property values and adjust the differential rates for each land use to fund the estimated value of the rebates. The rebate applies to all land use categories, but primary production is the one experiencing significant value increases this year. The value threshold will be set at 15% so the valuations used for calculating the general rates and the rebate will be property valuations that are higher than 15% compared to the 2023/2024 financial year. Several conditions are likely to apply, to be decided when the Council approves the ABP.

APPENDIX A RATING STRUCTURE & POLICY
In proposing its rates for the 2024/2025 Financial Year, Council considered its Rate Revenue Policy (approved in 2023), the Strategic Management Plan 2024-2028, the current economic climate (including the lasting effects of Covid-19 including the ‘spike’ in inflation), the budget requirements for the 2024/2025 financial year and the impact of rates on the community. Land use categories as provided in the Local Government (General) Regulations 1999 are used as the basis of Council’s general rate calculation. Section 147 of the Local Government Act 1999 provides Council with the power to rate all land within Light Regional Council – except for land specifically exempted, such as Crown land and land occupied by Council (unless leased).
Capital value determined by the State Valuation Office as the basis for valuing land and calculating rates, as it is felt this method provides the fairest and most efficient method of distributing the rate burden across all rate payers. If a property owner is dissatisfied with a property valuation, then an objection may be made to the Valuer-General in writing, within 60 days of receiving notice of the valuation, explaining the basis for the objection. It is important to note that Council has no role in the valuation process.
During 2022/23 Council approved a Rate Revenue Policy – refer Council’s website for details.

Objections
If a ratepayer believes that a particular property has been wrongly classified by Council as to its land use, then they may object (to Council) to that land use within 60 days of being notified. For further information on this matter, ratepayers may contact Council’s Rates Assessment Officer.
Impact of Rates
In the 2024/2025 budget, Council proposes to collect $20.271m of general rate revenue in a total operating revenue budget of $30.423m. The final value of general rates revenue will be based on the final Valuer General’s Light region valuation on or around 30 June 2023.
Income also includes separate charges for Refuse Collection and Community Wastewater Management Systems, and Council acts as a collection agent on behalf of the State Government regarding the collection of income for the Regional Landscape Boards.
The following four tables summarise general rates forecasts used to formulate the 2024/2025 ABP and Budget. This information was prepared at Week 40 (April 2024) of the valuation cycle. The total capital valuation of the region (rateable property) has increased 19.66%) between 1 July 2023 and the date of the valuation data used to formulate the 2024/2025 budget. This excludes new assessments. Further minor changes will be made before the approval of the budget and the rates declaration. The number of rateable properties increased by 5.3%.
The table on the next page expands on the information above and provides comparative assessment, valuation, and rating data by Land Use Code.
Note: there will be further valuation updated from the Valuer-General before the Rates are approved in July 2024. Therefore, the rating analysis is subject to minor changes. Council will consider whether to apply a high property value increase rebate when rates are adopted.
Comparative Assessment and Valuation Data
Rate in the $ by land use
All rates modelling incorporates the overall rating and its impact using average valuations. Rate changes for individual assessments will likely vary from average amounts used for modelling purposes.
* 2024/25 rate in $ includes funding the discretionary rebate/effective rate is lower
Differential General Rates
A differential rate is applied to industrial, primary production commercial properties and vacant land. This additional amount is based on the principle that industrial and commercial properties are a greater burden on infrastructure and achieve direct benefits from parking and health regulations, events and tourism etc. For vacant land, the differential rate discourages holding vacant property and encourages development.
Every resident benefits in some part from the general amenity of the area, whether that is at the present time or in the future. The amenity includes the local economy, general Council operations and the ability to use facilities.
Council rating is a system of taxation against property prescribed by the Local Government Act 1999. However, Council has assessed that the level of differential rating imposed is governed in part by the ability to pay, the potential for income tax deduction and the perception of accessibility or useability of council services by the residents and consumers.
Commercial Properties
Commercial properties generally have available to them, their employees, and customers, the same services as other ratepayers. However, in most cases commercial users have a greater impact on the main services such as road maintenance and generally derive a greater benefit from the services provided.
Industrial Properties
Industrial properties generally have available to them, their employees, and customers, the same services as other ratepayers. However, in most cases industrial users have a greater impact on the main services such as road maintenance and generally derive a greater benefit from the services provided, particularly where, for example, large amounts of raw or unrefined product are delivered to site for processing, utilising Council’s infrastructure.

Primary Production Properties
Primary Production properties tend to be more remote from some of the services provided by Council. In terms of infrastructure adjacent to their properties they may not have sealed or formed roads, footpaths, or street lighting. However, they do have capacity to enjoy the formed roads, footpaths or street lighting and enjoy the same level of amenity as other residents of the Council area.
Minimum Rate
A council may impose a minimum amount payable by way of rates if it has not imposed a fixed charge. Where two or more adjoining properties have the same owner and are occupied by the same occupier, only one minimum rate is payable by the ratepayer. Where a council imposes a minimum rate, it must not apply to more than 35% of properties in the council area.
In 2023/2024 Council proposes to levy a minimum rate of $965 ($925 in 2023/2024) which will affect 534 or 6.2% of the 8,568 rateable properties (606 in 2023/24). It is appropriate that all rateable properties make a base level contribution to the cost of administering Council’s activities and to the cost of creating and maintaining the physical infrastructure that supports each property. The minimum rate will apply to residential assessments valued at less than $269,000. The average residential property value has increased to approximately $512,000.
Regional Landscape Board Levies
(formally the Natural Resource Management Board (NRM))
The whole of the Council area is located within the boundaries of the Northern and Yorke Landscape Board. Contributions are sought in 2024/2025 totalling $0.558m.
Council is operating as a revenue collector for the Regional Landscape Board in this regard. It does not retain this revenue or determine how revenue is spent.

Service Charges
Council provides a Community Wastewater Management System to residential and commercial properties in Kapunda, Freeling, Greenock, and Roseworthy. The estimated full cost of service for the 2024/2025 financial year is $1.822m. Council recovers this cost through various means including the imposition of a service charge of $630 per unit ($600 in 2023/2024) for all properties where the service is available. Where the service is provided to land (an assessment) to which a rate rebate applies, a CWMS service charge is levied against the land. The increase is inclusive of a 50% GHG offset.
The provision of CWMS is a regulated service and the Essential Services Commission of SA has issued a price determination and guidelines for councils to follow regarding the pricing of CWMS. The guidelines and price determination result from work done at the Commonwealth Government level, and adopted by State and Territory Governments, to ensure that the full cost of providing water and sewerage services is recovered from users. This approach ensures the sustainability of service provision over time. The proposed increases are reviewed annually and are adjusted in accordance with the costs of the scheme at that time.
A refuse collection service inclusive of recycling collections is provided within the townships of Kapunda, Freeling, Hewett, Greenock, Roseworthy, and Wasleys. The service is also provided to those ratepayers in Council’s area that can access the service along the designated collection routes. The full cost of service for 2024/2025 is budgeted to be $2.161m. It is proposed to recover this cost through a service charge of $380 ($335 in 2023/2024) for each property within the designated 3 bin service area (i.e., collection of domestic, recyclable and green organic refuse); and through a service charge of $255 ($225 in 2023/2024) for each property within the designated 2 bin service area (i.e. collection of domestic and recyclable refuse only). Where the service is provided to land (an assessment) to which a rate rebate applies, a refuse collection service charge is levied against the land.

Payment of Rates
Under Section 181 of the Local Government Act 1999, Council must provide the opportunity for all ratepayers to pay rates by quarterly instalments. Council payment dates for the 2024/20256 Financial Year will be 6th September 2024, 6th December 2024, 7th March 2025 and 6th June 2025
Late Payment of Rates
The Local Government Act 1999 provides that councils impose an initial penalty of 2% on any payment for rates, whether by instalment or otherwise, that is received late. A payment that continues to be late is then charged an interest rate, set each year according to a formula in the Act, for each month it continues to be late. Late payment penalties are applied in accordance with the Local Government Act 1999.
Appropriate delegations are made by Council to the Chief Executive Officer and other staff to undertake collection action on behalf of Council.
A final notice is issued when rates are overdue, i.e. unpaid by the due date. Should rates remain unpaid more than 21 days after the issue of the final notice, then the debt will be referred to a debt collection agency for collection.
The debt collection agency charges collection fees that are recoverable from the ratepayer. All costs incurred by Council in the recovery of outstanding rates and fines are payable by the ratepayer. When payment by the ratepayer is received for overdue rates, the money received is applied as follows:
I firstly – in payment of any costs awarded to, or recoverable by, the Council in any court proceedings undertaken for the recovery of the rates
II secondly – in satisfaction for any liability for interest
III thirdly – in payment of any fine
IV fourthly – in satisfaction of liabilities for rates in the order in which those liabilities arose in payment of rates, in date order of their imposition (starting with the oldest account first).
Remission and Postponement of Rates
Postponement of Rates – Hardship
Section 182 of the Local Government Act 1999 permits Council, on the application of the ratepayer, to remit rates partially or wholly or to postpone rates, based on hardship. Where a ratepayer is suffering hardship in paying rates, they are invited to contact Council’s Rates Assessment Officer, on (08) 8525 3200 to discuss the matter. Such enquiries are treated confidentially.
Relief from rapid increases in property valuations
For 2024/2025 the rebate for relief of rapid increases in property valuations will again be provided. The valuation threshold this year will be 15%. For applications refer to the LRC website, which includes the rules of eligibility and application instructions.
Seniors Rate Postponement
Section 182A of the Local Government Act 1999 provides the option for State Senior Card holders to apply to postpone part of their Council rates on a long-term basis. The deferred amount is subject to monthly interest charge, with the accrued debt being payable on the disposal or sale of the property. Postponement is like a reverse mortgage by relying on the equity in the property. A ratepayer who has a State Seniors Card may apply for postponement of a portion of the Council rates payable on property they own if it is their principal place of residence and if no other person other than their spouse has an interest as owner of the property and there is appropriate equity in the property. Further information can be obtained from Council’s Senior Rates Assessment Officer on (08) 8525 3200.
Rebate of Rates
The Local Government Act 1999 makes it mandatory for Councils to rebate the rates for certain land uses. This includes 100% rate rebates on places of worship, public cemeteries, hospitals, and land occupied by universities; and 75% rate rebates on educational facilities (subject to some qualifications).
Discretionary rebates may be applied by Council under Section 166 of the Act. Council annually considers many applications for rate rebates and has in the past, and is again for the 2024/2025 financial year, proposing to rebate rates charged to various district community and sporting organisations.
The Rate Revenue Policy requires that eligibility for discretionary rebates be reviewed each term of Council, except for rebates agreed for development purposes which have a limited timeframe or conditions.
Sale of Land for Non-Payment of Council Rates
The Local Government Act 1999 provides that a council may sell any property where the rates have been in arrears for three years (3) or more. The principal ratepayer and the landowner must be notified (if not the same person) of the intention to sell the land and provide the details of the outstanding amounts. If payment of the outstanding amount is not received within one month the property may be sold. Except in extraordinary circumstances, Council enforces the sale of land for arrears of rates.

Statement on Expected Rate Revenue
General Rates Revenue
General Rates (existing properties) $19,876,697 $20,468,408
Less: Mandatory Rebates ($365,000) ($454,223)
Less: Discretionary Rebates ($196,200) ($164,768)
Less: High value increase rebate ($89,000) ($457,000)
General Rates (existing properties)
General Rates (new properties)
General Rates (completed construction)
$19,226,497 $19,392,417 (a) 0.9%
General Rates (GROSS) $19,226,497
(e)=(c)+(d)
$383,539 (b)
$495,477 (b)
‘Existing properties’ excludes the estimated high value increase discretionary rebate. New properties ineligible. Completed construction not shown separately in 2023/24. New growth in properties and construction from in 2023/24 now existing properties in 2024/25.
Other Rate (inc. service charges)
Regional Landscape Levy
$551,988 $558,025 (f) The Regional Landscape Levy is a State tax, it is not retained by council.
(g) Including property growth
$1,861,020 (i) Including property growth Separate and Special Rates
$900,000 $900,000 (j) Water re-use schemes
$5,070,012 $5,482,605
Add: Penalties & legal recoveries $138,508 $191,300
Less: Discretionary Other Rebates - ($450,000) (l)
$450k for water scheme in 2023/24 (half year)
Expected Total Revenue $23,883,029 $24,937,313 (m) 4.4% Excluding the Landscape Levy and minus Mandatory & Discretionary Rebates, and water scheme contributions ($143k) (m)=(e)+(g)+(h)+(i)+(j)+(k)+(l)
Note: These amounts represent a considered estimate of Expected Rate Revenue based on the most current information available at the time of going out to consultation of the Annual Business Plan and Budget (ABP&B). This information is updated regularly and therefore these figures may be subject to confirmation at the time of actual adoption of the ABP&B.
Estimated Growth in Number of Rateable Properties
2023/24 (as adopted) 2024/25 (estimated)
Change Comments
‘Growth’ is defined in the regulations as where new properties have been created which has added rateable properties to council’s ratepayer base. Growth can also increase the need and expenditure related to infrastructure, services and programs which support these properties and residents.
Estimated Average General Rates per Rateable Property
2023/24 (as adopted) 2024/25 (estimated)
Change Comments
Councils use property valuations to calculate each rateable property’s contribution to the required rate revenue total. Councils do not automatically receive more money because property values increase but this may alter how rates are apportioned (or divided) across each ratepayer (ie. some people may pay more or less rates, this is dependent on the change in value of their property relative to the overall valuation changes across the council area). General rates received from rateable properties will equal the amount adopted in the budget.
Notes
(d) Councils are required under the Local Government Act to provide a rebate to qualifying properties under a number of categories:
Health Services - 100 per cent
Religious purposes - 100 per cent
Public Cemeteries - 100 per cent
Educational purposes - 75 per cent
Community Services - 75 per cent
Royal Zoological Society of SA - 100 per cent
The rates which are foregone via Mandatory Rebates are redistributed across the ratepayer base (ie. all other ratepayers are subsidising the rates contribution for those properties who receive the rebate).
(e) Presented as required by Regulation 6(1)(ea) of the LocalGovernment(FinancialManagement) Regulations 2011
Please Note: The percentage figure in (e) relates to the change in the total amount of General Rates revenue to be collected from all rateable properties, not from individual rateable properties (ie. individual rates will not necessarily change by this figure).
(f) Councils are required under the Landscape South Australia Act 2019 to collect the levy on all rateable properties on behalf of the State Government. The Levy helps to fund the operations of regional landscape boards who have responsibility for the management of the State’s natural resources
(i) Community Wastewater Management Systems
(l) A council may grant a rebate of rates or service charges in a number of circumstances. The rates which are foregone via Discretionary Rebates are redistributed across the ratepayer base (ie. all other ratepayers are subsidising the rates contribution for those properties who receive the rebate).
(m) Expected Total Rates Revenue excludes other charges such as penalties for late payment and legal and other costs recovered.
(n) ‘Growth’ as defined in Regulation 6(2) of the LocalGovernment(FinancialManagement) Regulations 2011
Land Use (General Rates - GROSS)
Expected Rates Revenue
2024/25 expected revenue inclusive of new properties and new construction, e.g. new house construction on vacant land and excludes estimated high value increase rebates.
Notes
(p) Average per rateable property calculated as General Rates for category, including a minimum rate but excluding any separate rates, divided by number of rateable properties within that category in the relevant financial year.
Rate revenue policy refers to the number of assessments being approximately 10%, but significant valuation increases have increased many more properties above the minimum valuation threshold.
(q) Light Regional Council does not apply a fixed charge.
(r) Where two or more adjoining properties have the same owner and are occupied by the same occupier, only one minimum rate is payable.
Adopted valuation method
Capital Value/Site Value/Annual Value
Council has the option of adopting one of three valuation methodologies to assess the properties in its area for rating purposes:
Capital Value - the value of the land and all improvements on the land;
Site Value - the value of the land and any improvements which predominantly affect the amenity of use of the land, such as drainage works, but excluding the value of buildings and other improvements (Note: Site Value will cease to be an option from 1 Sept 2023); or
Annual Value - a valuation of the rental potential of the property.
Light Regional Council uses adopted Capital Valuation.

APPENDIX C CAPITAL ASSET RENEWAL PROGRAM
The adopted Asset Management Plan 2020—2030 and is included in the LTFP. Council’s four year Asset Renewal Program is summarised below.
4 Year Capital Works Budget 2024-2028
Roads - Sealed Program Year 1
2025-2026 Roads Sealed Program - Year 2
2026-2027 Roads Sealed Program - Year 3
2027-2028 Roads Sealed Program - Year 4
3,375,000
Unsealed Program – Year 2
If Bethel Road is not funded under the Heavy Vehicle Safety Productivity Program the grey shaded roads will remain in the program. If funding is approved, the roads highlighted will need to be delayed into future years. If John Eden Road and Ebenezer Road are not funded within the any funding program by year 2, they will need to be re-sheeted under the current program due to the lack of pavement material on the road.
2026-2027 Unsealed Program – Year 3
2027-2028 Unsealed Program – Year 4
2024-2025 Buildings Program – Year 1
2025-2026 Buildings Program – Year 2
2026-2027 Buildings Program – Year 3
2027-2028 Buildings Program – Year 4
Stormwater Program 2024-2025 Stormwater Program – Year 1
2025-2026 Stormwater Program – Year 2
2026-2027 Stormwater Program – Year 3
2027-2028 Stormwater Program – Year 4
– Year
2025-2026
Open Space Program – Year 2
2026-2027
Open Space Program – Year 3
2027-2028 Open
Space Program – Year 4
2024-2025 CWMS Program – Year 1
2025-2026 CWMS Program – Year 2
2026-2027 CWMS Program – Year 3
2027-2028 CWMS Program – Year 4
APPENDIX D ESCOSA ADVICE
Responses
ESCOSA recommendations LRC response
Further define the basis, including inflation assumptions, for preparation of Annual Business Plans, budget and long-term financial plan.
Increase funding to address deferred asset renewals
New long term financial model developed in 2024/25 that includes significant more detail regarding the assumptions underpinning all forecasts with the forecast statements of comprehensive income and financial position and capital expenditure outlays and funding.
A comprehensive review was undertaken of ‘Transportation Infrastructure Assets’ condition in 2024 and resulted in a revised IAMP. The revised IAMP has now increased the recommend value for asset renewal expenditure which has been funded to 100% in the 2024/25 LTFP. $41 million has been committed to asset renewal, including the renewal component of grant funded road upgrade programs, over the first 4 years of the 2024/25 LTFP in line with IAMP recommendations
Review adequacy of renewal spending by 2028
Forecast and include the impact of new assets into the long-term financial plan
Transport Infrastructure renewal spending reviewed in 2024 and increased in LTFP. Other asset categories will be progressively reviewed, including building and other open space assets, prior to 2028.
This recommendation relates to new assets funded by external grants and the receipt of new infrastructure assets for newly developed areas. Previously, due to the uncertainty of forecasting the approval and receipt of government grants the practice was to only forecast the Council’s contribution to such projects. From 2024/25 the total cost of externally funded capital projects has been included in the LTFP, together with the best estimate of expected grants, but only for the next three (3) years as after that time scoping and approval is very uncertain. From 2024/25 it is expected that the first tranches of infra-structure asset ‘handover’ will begin from Roseworthy expansion developers. Estimates have been made of the value of these assets over the next 3 years where there is some knowledge of the assets being constructed through the development approval process. These estimates will be further refined over time.


Enquiries concerning this advice should be addressed to:
Essential Services Commission
GPO Box 2605 Adelaide SA 5001
Telephone: (08) 8463 4444
Freecall: 1800 633 592 (SA and mobiles only)
E-mail: advice@escosa.sa.gov.au
Web: www.escosa.sa.gov.au

Glossary of terms
ABS
AMP
Commission
CPI
Council
CWMS
ESC Act
F&A
FTE
IAMP
LG Act
LGA SA Financial Indicators Paper
LGGC
LGPI
LTFP
Regulations
RBA
SACES
SEIFA
SMP
SG
The scheme or advice
Australian Bureau of Statistics
Asset management plan (also called an IAMP)
Essential Services Commission, established under the Essential Services Commission Act 2002
Consumer Price Index (Adelaide, All Groups)
Light Regional Council
Community Wastewater Management System
Essential Services Commission Act 2002
Local Government Advice: Framework and Approach – Final Report
Full Time Equivalent
Infrastructure and asset management plan (also called an AMP)
Local Government Act 1999
Local Government Association of South Australia, Financial Sustainability Information Paper 9 - Financial Indicators Revised May 2019
Local Government Grants Commission
Local Government Price Index
Long-term financial plan
Local Government (Financial Management) Regulations 2011
Reserve Bank of Australia
The South Australian Centre for Economic Studies
Socio-Economic Indexes for Areas
Strategic management plan
Superannuation Guarantee
Local Government Advice Scheme
1 The Commission’s key advice findings for the Light Regional Council
The Essential Services Commission (CCommission) finds the Light Regional Council’s (CCouncil’s) short-term financial position sustainable. The Council’s longer-term financial performance is reliant on its continued commitment to the renewal of its asset stock, and continued cost control.
Current financial performance:
Projected financial performance (future):
Previous financial performance (past ten years):
Acknowledging the Council’s outlook, the Commission recommends that the Council undertake the following steps to ensure it budgets prudently and transparently, continues to manage its cost base efficiently, renews its asset base to meet sustainable service levels, plans its asset needs appropriately and contains the extent of further rate increases:
B Budgeting considerations
1. C Continue to review its inflation forecasts in its annual budget and forward projections from 2023-24, given the potential for higher short-term inflation outcomes, followed by a return to long-term averages.
2. F Further define the basis, including inflation assumptions, for preparation of annual business plans, budgets and the long-term financial plan in the accompanying documentation to increase transparency about the assumptions underpinning the figures.
Continuing to provide evidence of ongoing cost efficiencies
3. C Continue to monitor cost growth in its budgeting, including related to employee expenses, to contain it within the forecast long-term financial plan
4. C Continue its practice of reporting any actual and projected cost savings in its annual budget (and long-term financial plan, as appropriate), to provide evidence of containing cost growth and achieving efficiency across its operations and service delivery.
Refinements to asset management planning
5. I Increase funding to address deferred asset renewals and review adequacy of renewal spending by 2028.
6. F Forecast and include the impact of new assets into the long-term financial plan to provide transparency for existing and future ratepayers.
Containing rate levels
7. C Consider limiting future increases in rates to no more than expected inflation.
2 About the advice
The Essential Services Commission (CCommission), South Australia’s independent economic regulator and advisory body, has been given a role by the State Parliament to provide advice on material changes proposed by local councils in relation to elements of their strategic management plans (SSMPs) and on the proposed revenue sources, including rates, which underpin those plans. 1
One of the main purposes of the Local Government Advice Scheme (aadvice or t the scheme) is to support councils to make ‘financially sustainable’ decisions relating to their annual business plans and budgets in the context of their long-term financial plans (LLTFPs) and infrastructure and asset management plans (IIAMPs) 2 – both required as part of a council’s SMP. 3 Financial sustainability is considered to encompass intergenerational equity, 4 as well as program (service level) and rates stability in this context. 5 The other main purpose is for the Commission to consider ratepayer contributions in the context of revenue sources, outlined in the LTFP. 6 In addition, the Commission has discretion to provide advice on any other aspect of a council's LTFP or IAMP it considers appropriate, having regard to the circumstances of that council. 7
The first cycle of the scheme extends over four years from 2022-23 to 2025-26, and the Commission has selected 17 councils for advice in the second scheme year (2023-24), including the Light Regional Council (CCouncil).
This report provides the Local Government Advice for the Light Regional Council in 2023-24.
The Council is obliged under the Local Government Act 1999 (LLG Act) to publish this advice and its response, if applicable, in its 2024-25 Annual Business Plan (including any draft Annual Business Plan) and subsequent plans until the next cycle of the scheme. 8 It does not need to publish the attachment to the advice (these will be available with the advice on the Commission’s website 9), nor is it compelled under the LG Act to follow the advice.
The Commission thanks the Council for providing relevant information and meeting with Commission staff to assist the Commission in preparing this advice.
2.1 Summary of advice
In general, the Commission finds the Light Regional Council’s short-term financial position sustainable and notes that it has improved its sustainability position by partly addressing capital renewals, following a period of deferred capital renewal expenditure 10 and spending on new capital initiatives Historically, the Council experienced deficits between 2012-13 and 2014-15 but has since generated consistent operating surpluses.
The past rate increases above inflation, together with higher reimbursements income, increased the Council’s financial capacity to cover its operating and service sustainability requirements.
Its forward projections from 2023-24 (in its LTFP) forecast a financially sustainable outlook due to:
1 Amendments to the LG Act (s122(1c) to (1k) and (9)) specify the responsibilities for the Commission and local councils for the Local Government Scheme Advice. The Commission must provide advice to each council in accordance with the matters outlined in s122(1e), (1f) and (1g).
2 Commonly referred to as asset management plans.
3 The objectives of the advice with reference to a council’s LTFP and IAMPs are presented under LG Act, s122(1g). LG Act s122(1) specifies the requirements of a council’s SMP, including the LTFP and IAMPs.
4 ‘Intergenerational equity’ relates to fairly sharing services and the revenue generated to fund the services between current and future ratepayers.
5 Commission, Framework and Approach – Final Report, August 2022, pp. 2-3, available at www.escosa.sa.gov.au/advice/advice-to-local-government
6 LG Act s122(1f)(a) and (1g)(a)(ii).
7 LG Act s122(1f)(b) and (1g)(b).
8 LG Act s122(1h).
9 The Commission must publish its advice under LG Act s122(1i)(a).
10 As recommended by its AMPs.
forecast operating revenue growth,
contained expense growth,
continued average rate increases below the Reserve Bank of Australia (RRBA)-based forecast inflation rate,
the realisation of income from capital projects,
lower spending on new or upgraded capital works than on renewal and replacement capital works in contrast to expenditure in 2012-13 to 2021-22, and
higher asset spending on renewal and rehabilitation capital works, including to continue to partly address the accumulation of deferred renewals over the next 10 years.
The Commission considers that the Council is demonstrating good practice regarding the formulation of its financial projections in its LTFP, and transparency around its assumptions and directions, including the ratepayer impact; however, additional detail about inflation assumptions may be helpful for stakeholders
2.2 Detailed advice findings
The next sections summarise the Commission’s more detailed observations and advice findings regarding the Light Regional Council’s material changes to its 2023-24 plans (compared with the previous year’s plans), its financial sustainability (in the context of its long-term operating performance, net financial liabilities, and asset renewals expenditure) and its current and projected rate levels.
In providing this advice, the Commission has followed the approach it previously explained in the Framework and Approach – Final Report (FF&A). The attachment explores these matters further. 11
2.2.1
Advice on material plan amendments in 2023-24
The Light Regional Council’’s 2023-24 LTFP includes an improvement to its projected operating performance, and no changes to its projected capital expenditure estimates, compared with the 2022-23 forecasts, 12 as follows:
An improvement in operating performance by $20 million or by 7.3 percent. This is mainly driven by a 2.1 percent increase in general rates, receipt of delayed grant funding and income from major water projects.
An overall decrease in operating expenses that is a combination of lower materials, contracts and other expenses, along with higher finance costs.
The Council has factored several savings into its LTFP projections and includes sharing the benefit of its successful capital water project with ratepayers as discussed in the advice on current and projected rates section below (section 2.2.3). However, its forecasts may present a risk to its cost and income projections in the current inflationary environment The RBA currently forecasts the CPI (Australia-wide) to increase by 3.9 percent in the year to the June 2024 quarter and by 3.3 percent in the year to June 2025. Thereafter, it is reasonable to anticipate a return to long-run averages (and growth of 2.6 percent per annum from 2025-26). 13
The Commission notes that the Council’s stated assumptions for indexation in its 2023-24 LTFP are transparent and based on its annual review of these forecasts Noting the Council has endeavoured to find savings and reduce any inflationary impact on its community, the Commission has found that it would be appropriate for it to:
11 The attachment will be available on the Commission’s website with the Advice
12 The overlapping forecast period in both LTFPs (2022-23 to 2031-32 and 2023-24 to 2032-33).
13 RBA, Forecast Table - November 2023, available at https://www.rba.gov.au/publications/smp/2023/nov/economic-outlook.html
1. C Continue to review its inflation forecasts in its annual budget and forward projections from 2023-24, given the potential for higher short-term inflation outcomes, followed by a return to long-term averages.
The Light Regional Council adopted its annual business plan and budget in June 2023, together with its LTFP 2023-24. The Council proposed further material amendments to its 2023-24 estimates for the financial year from those proposed in its 2022-2023 LTFP
The Commission observes that the Council’s LTFP identifies the risks to the financial estimates (due to environmental and economic factors, for example) and that the annual business plan also includes its 2023-24 estimates (from the LTFP) The Commission notes the transparency in indexation assumptions underpinning the financial documents; however, assumptions about inflation were not explicitly stated. The Commission recommends that the Council:
2. F Further define the basis, including inflation assumptions, for preparation of annual business plans, budgets and the long-term financial plan in the accompanying documentation to increase transparency about the assumptions underpinning the figures.
2.2.2 Advice on financial sustainability
Operating performance
Key Points:


The operating surplus ratio averaged 0.6 percent or $0.3 million from 2012-13 to 2021-22 and is forecast to average 6.2 percent or $2.3 million between 2023-24 and 2032-33.
Income growth is forecast to reduce while expenditure growth is forecast to increase which will require close monitoring
Employee costs, ‘materials, contracts and other’ expenses increased by an average of 4.7 and 3.5 percent respectively from 2012-13 to 2021-22 where average CPI growth was 2 percent per annum.
Projected operating expenses over the next 10 years is forecast to be an average of 3.2 percent, which is slightly above the RBA-based forecast inflation for the same period
Conducts regular service level reviews of its operations, focused on achieving increased productivity, efficiency and effectiveness, and ultimately real savings
The Light Regional Council experienced operating deficits from 2012-13 to 2014-15, followed by consistent operating surpluses until 2021-22, with the operating surplus ratio 14 averaging 0.6 percent over this period (from 2012-13 to 2021-22) In its forward projections, the operating surplus ratio is expected to be within the suggested LGA target range at an average of 6.2 percent
Operating income growth averaged 5.1 percent per annum from 2012-13 to 2021-22, while operating expense growth averaged 2.9 percent per annum. 15 From 2015-16, the Council generated a sustained operating surplus with an average surplus of $1 million between 2015-16 and 2021-22.
14 The operating surplus ratio is defined as: Operating Surplus (Deficit) ÷ Total Operating Income. The general target is to achieve, on average over time, an operating surplus ratio of between zero and 10 percent (Local Government Association of South Australia, Financial Sustainability Information Paper 9 - Financial Indicators Revised, May 2019 (L LGA SA Financial Indicators Paper), p. 6).
15 Based on the compound average annual growth rate formula (which is the adopted approach to calculating average annual growth rates throughout the Commission’s advice).
The Council received a combination of additional rates, ‘grants, subsidies and contributions’, and reimbursements income over this period to generate its relatively strong operating income growth.
On the cost side, its ‘employee costs’, and ‘materials, contracts and other’ expenses increased by an average of 4.7 and 3.5 percent per annum respectively from 2012-13 to 2021-22 while average annual CPI growth was 2 percent per annum 16
The estimated rate of growth in operating expenses projected over the next 10 years is an average of 3.2 percent per annum, which is above the RBA-based forecast inflation 17 for the same period. The associated impact on ratepayers is discussed further below in section 2.2.3.
The Commission has observed the current practice of the Council in conducting regular service level reviews of its operations, focused on achieving increased productivity, efficiency and effectiveness and, ultimately, real savings. As an example, it has factored in savings of approximately $0.4 million to its expense estimates in 2023-24, compared to these items in 2022-23, due to a combination of reduced materials and contracts expenses but with increased finance costs The Council anticipates benefitting from economies of scale with respect to its forecast growth.
To ensure the Council is positioned to contain its expenses within its forecast and achieve its operating performance (without the need for further rate increases above inflation), the Commission encourages it to:
3. C Continue to monitor cost growth in its budgeting, including related to employee expenses to contain it within the forecast long-term financial plan
4. C Continue its practice of reporting any actual and projected cost savings in its annual budget (and long-term financial plan, as appropriate), to provide evidence of containing cost growth and achieving efficiency across its operations and service delivery.
Net financial liabilities
Key Points:
The net financial liabilities ratio averaged 18 percent from 2021-13 to 2021-22 and is forecast to average 24 percent between 2023-24 and 2032-33.
The reduction in the net financial liabilities ratio from 2022-23 to 2032-33, comes from progressive repayment of total borrowings, via operating income growth and costs constraint.
Net cash flows after operating and investing (that is, capital-related) activities has averaged negative $2 million annually between 2012-13 and 2021-22.
Past and projected borrowings for capital projects have a downwards trend and are at a level that the Council can affordably service, also leaving capacity for further investment
With the Council’s operating deficits from 2012-13 to 2014-15, followed by ongoing operating surpluses, its net cash flows after operating and investing (that is, capital-related) activities has averaged negative $2 million annually between 2012-13 and 2021-22 The Council has relied partly on rates revenue and supplementary grant funding to fund its capital expenditure program over this period. The Council has also consistently used borrowings to partly finance its capital expenditure, and over time, this has been
16 CPI Adelaide (All groups) available at Consumer Price Index, Australia, September Quarter 2023 | Australian Bureau of Statistics (abs.gov.au)
17 The forecast average annual growth in the CPI from 2023-24 to 2032-33 is estimated to be 2.6 percent based on the RBA forecasts for the CPI (Australia-wide) and the Commission’s calculations of average annual percentage growth; RBA forecasts available at: RBA, Forecast Table - November 2023, available at https://www.rba.gov.au/publications/smp/2023/nov/economic-outlook.html
within or below the suggested LGA target range for the net financial liabilities ratio (averaging 18 percent from 2011-12 to 2020-21). 18
The Council continues to meet the suggested LGA target range under its 2022-23 forecasts and projects fluctuation in the ratio, with an average of 24 percent over the 10-year period to 2032-33
Asset renewals expenditure
Key Points:
Between 2012-13 and 2022-23 the Council’s total capital expenditure averaged $12.6 million per annum (including $3.4 million on asset renewals and $9.2 million on new and upgraded assets).
The asset renewal ratio averaged 108.8 percent between 2012-13 and 2022-23.
From 2023-24 to 2032-33, the ratio is forecast to average 112.6 percent.
The IAMP renewal replacement gap is minimal while the depreciation gap is larger suggesting possible intergenerational inequity or a mismatch between actual and predicted useful asset lives.
Asset renewal expenditure has been highly variable in the past as deferred capital renewals have been partly addressed and higher levels of expenditure on renewals are forecast but with an ongoing deferred asset renewal backlog.
Between 2012-13 and 2022-23, the Council’s total capital expenditure averaged $12.6 million per annum (including $3.4 million on asset renewals and $9.2 million on new and upgraded assets) The Council’s asset renewal funding ratio (IAMP-based) was within the suggested LGA target range of 90 to 110 percent over these years, 19 and averaged 108.8 percent between 2012-13 and 2022-23. This reflected the Council’s need to renew assets that were not renewed in a timely manner historically 20 (and as noted in meeting with Council)
From 2023-24 to 2032-33, the ratio is forecast to average 112.6 percent reflecting continuation of the historical trend that has been focused on renewing deferred asset renewals. Average annual spending on renewal or rehabilitation of assets is projected to increase to $8 million (in nominal terms) and has also been influenced by the historical expenditure on new and upgraded assets. With reference to increased costs for construction, the Council has noted that it has kept its capital expenditure within its forecast budgets by deferring projects. 21
The Council has significantly grown its asset base over the past 10 years, averaging $9.2 million per annum on new or upgraded assets between 2012-13 and 2021-22. This has led to a steady increase in the value of the asset stock per property of $550 or 2.5 percent for each year over the 10 years to 202122.
18 The net financial liabilities ratio is defined as: Net financial liabilities ÷ Total operating income. This ratio measures the extent to which a council’s total operating income covers, or otherwise, its net financial liabilities. The suggested LGA target range is between zero and 100 percent of total operating income, but possibly higher in some circumstances (LGA SA Financial Indicators Paper, pp. 7-8).
19 The IAMP-based method is the current industry standard whereby asset renewal/replacement expenditure is divided by the recommended expenditure in the IAMP (or AMP). Ideally, this will show the extent to which a council’s renewal or replacement expenditure matches the need for this expenditure, as recommended by the plan. The suggested LGA target range for the ratio is 90 to 110 percent (LGA SA Financial Indicators Paper, p. 9).
20 Correspondence with Light Regional Council dated 11 December 2023 and Council Responses to ESCOSA Questions, p 4.
21 Correspondence with Light Regional Council dated 11 December 2023 and Council Responses to ESCOSA Questions, p. 1.
The Council is forecasting a continuation of the levels of spending on renewals of asset stock as described above, in addition to expenditure on new/upgraded assets partly in relation to water projects and township expansion. The Council forecasts that expenditure on new and upgraded assets will average $1.5 million per annum from 2023-24 to 2032-33, with growth averaging 3.5 percent per annum
Forecasts for both asset renewals and new/upgraded assets may be understated however, due to the Council’s practice of only including known grants in its LTFP (impacts projects scheduled), as well as the financial impacts from a scheduled update to the Transport AMP not yet being known The Council intends to address some deferred asset renewals in the forecast period (2024-2033); however, it estimates there will continue to be a shortfall in funding. 22
Acknowledging the significant financial impact of the Councils major water projects, transport related projects and strong development pipeline, the Commission considers that it would be appropriate for it to:
5. I Increase funding to address deferred asset renewals and review adequacy of renewal spending by 2028.
6. F Forecast and include the impact of new assets into long-term financial plan to provide transparency for existing and future ratepayers.
Asset renewals can also be evaluated by the depreciation-based asset renewal funding ratio, 23 which is projected to track slightly above the LGA-recommended range (for the IAMP-based ratio) of 90110 percent, averaging 112.6 percent per annum to 2032-33. Historically (between 2012-13 and 202122) depreciation expenses have outpaced renewal capital expenditure by a significant margin (totalling $23.2 million over ten years). This earlier period may indicate an intergenerational equity 24 risk, as the Council had partly funded capital expenditure (through depreciation) but had deferred or under invested on its asset renewal needs. Alternatively, there may also be a mismatch between assessed useful lives of assets and actual useful lives of assets as indicated by renewals required.
The Commission notes that the Council had prepared comprehensive AMPs with supporting technical specifications that cover most of the Council’s asset base, coupled with the Councils’ intention to review its AMPs and consider its long-term funding/borrowing strategy with a focus on inter-generational impacts. 25
2.2.3 Advice on current and projected rate levels
Key Points:


Rate revenue per property growth has averaged 4.6 percent per annum for each property in the period between 2012-13 and 2021-22, which is 2.6 percent above CPI for the same period.
The average rate income per annum for each property is forecast to grow by 0.6 percent between 2022-23 and 2032-33 based on achievement of growth in rateable properties
22 Correspondence with Light Regional Council dated 11 December 2023 and Council Responses to ESCOSA Questions, p. 5.
23 The Council’s asset renewal funding ratio by the depreciation-based method (where asset renewal/replacement expenditure is divided by depreciation expenses). This ratio shows the extent to which capital expenditure on the renewal and replacement of assets matches the estimated rate at which these assets are used or consumed.
24 ‘Intergenerational equity’ relates to fairly sharing of services and the revenue generated to fund the services between current and future ratepayers.
25 Correspondence with the Council dated 31 August 2023 (p 6) and in meeting with Council on 12 December 2023
The Council has implemented a strategy to provide rates relief for ratepayers that experience substantial property valuation increases of more than 10 percent, noting that rateable property valuations increased 13.62 percent from July 2022 until April 2023 when rates were set
The constraint in rates growth is a result of Council subsidies based on income realised from successful water projects and rates relief against substantial property valuation increases
Affordability risk for further average rate increases appears low based on a range of factors including an assessment of the economic resources available to the community and low levels of community concern
The Council’s rate revenue per property growth has averaged 4.6 percent or $93 per annum for each property between 2012-13 and 2021-22, which exceeded CPI growth (at an average of 2.0 percent per annum over this period) The Commission notes the Council has set its rates after undertaking its own benchmarking reflecting its services and ratepayer’s service level expectations 26
The Council has budgeted for an average rate increase of 3 percent or $81 per property for its existing ratepayers in 2023-24. 27 The rates increases are contained despite recent higher short-term inflation, and this was enabled by the realisation of benefits from the Bunyip 1 water project income and a consequent significant reduction in finance costs 28 The Council also has a strategy to provide rates relief for ratepayers that experience property valuation increases of more than 10 percent, 29 noting that rateable property valuations increased 13.62 percent from July 2022 until April 2023 when rates were set. 30
Different rate categories are subject to varying changes, with residential ratepayers to pay a lower increase of 2.7 percent or $48 per property on 2022-23 levels. Primary production (mostly farmland) ratepayers are budgeted to pay 2.8 percent or $74 per property. 31
The Council has also assumed growth in the area will be strong with growth in rateable properties increasing at 3.2 percent over the forecast period Significant regional population growth is anticipated in the area surrounding Roseworthy over the next decade. 32
As a result of the modest rates increases, the percentage of the Council’s total income contributions from ratepayers is projected to average around 83.5 percent, a constant percentage compared to the historical average.
Risks for ratepayers arise however if:
the anticipated growth does not eventuate,
inflation exceeds the Council’s estimates,
additional operational expenditure is required due to a revised transport AMP, or
unanticipated remedial expenditure is required due to deferred asset renewal backlogs.
26 Correspondence with the Council dated 31 August 2023, p 7.
27 Based on the Council’s 2023-24 Annual Business Plan and its Excel template (with the 2023-24 forecasts) provided to the Commission. The Commission has used $23.239 million (in 2023-24 budgeted rates revenue) compared to unaudited 2023-23 estimates. Individual rate level changes may be higher or lower depending on the rates category and property value.
28 Correspondence with the Council dated 31 August 2023, p 3.
29 Light Regional Council 2023/2024 Annual Business Plan, Budget and Long-term Financial Plan, p 10
30 Light Regional Council 2023/2024 Annual Business Plan, Budget and Long-term Financial Plan, p 8.
31 Rate in the dollar applied to the capital value of the property in the Council area. Light Regional Council, 2023/2024 Annual Business Plan, Budget and Long-term Financial Plan, p 49
32 Light Regional Council 2023/2024 Annual Business Plan, Budget and Long-term Financial Plan, p 5.
As the current economic environment is putting more pressure on most communities’ capacity to pay for further rate increases, including those of the Council, the Commission considers it would be appropriate for the Council to:
7. C Consider limiting future increases in rates to no more than expected inflation
2.3 The Commission’s next advice and focus areas
In the next cycle of the scheme, the Commission will review and report upon the Council’s:
ongoing performance against its LTFP estimates and transparency in underlying assumptions,
achievement of cost savings and efficiencies and its continued reporting of these in its plans,
review of its capital spending towards asset renewal and rehabilitation works and how it has addressed the backlog of asset renewal expenditure, and
how it has sought to minimise any emerging affordability risks

The Essential Services Commission
Level 1, 151 Pirie Street Adelaide SA 5000 GPO Box 2605 Adelaide SA 5001 T 08 8463 4444
E escosa@escosa.sa.gov.au | W www.escosa.sa.gov.au
Enquiries concerning this advice should be addressed to:
Essential Services Commission
GPO Box 2605 Adelaide SA 5001
Telephone: (08) 8463 4444
Freecall: 1800 633 592 (SA and mobiles only)
E-mail: advice@escosa.sa.gov.au
Web: www.escosa.sa.gov.au
A The Commission’s approach
In providing the Advice for the Light Regional Council (CCouncil), the Essential Services Commission (CCommission) has followed the approach it previously explained in the Framework and Approach –Final Report (FF&A). 1
The Commission has considered the Council’s strategic management plan (SSMP) documents (as in the box below), with a particular focus on its performance and outlook against three financial indicators: the operating surplus ratio, the net financial liabilities ratio and the asset renewal funding ratio. 2 Analysis of these three indicators captures financial and service sustainability, in addition to cost control and affordability risk. 3
2023-2024 Annual Business Plan Budget and 2023-2033 LTFP (adopted June 2023)
2012-2013 to 2032-2033 Long Term Financial Plan
2020-2030 Asset Management Plan
Technical Asset Management Plan Summary – Bridges, Floodways, Footpaths, Stormwater, Transport (Roads), 2020-2030
Technical Asset Management Plan Summary – Buildings & Open Space, 2020-2030
Technical Asset Management Plan Summary – Community Wastewater Management System (CWMS), 2020-2030
Economic Development Plan 2020-2030
Letter from Light Regional Council dated 31 August 2023 – Material matters – 2023-24 ABP and LTFP
Letter from Light Regional Council dated 11 December 2023 – Council Responses to ESCOSA Questions
Audit and Risk Committee Meeting Agenda, Item ARC7.3 – Public Consultation – Draft 2023/2024 Annual Business Plan, Budget and 2023-2033 Long-Term Financial Plan (June 2023)
Meeting in-person between Light Regional Council and ESCOSA at Kapunda on 12 December 2023
The Commission notes that most of the Council’s asset base is covered by its existing asset management plans (AAMPs), and asset valuations for those assets have been carried out within the last four years.
Given that the Commission must, in providing advice, have regard to the objective of councils maintaining and implementing their infrastructure and asset management plans (IIAMPs) (usually termed AMPs) and long-term financial plans (LLTFPs), 4 it has also considered the Council’s performance
1 Commission, Framework and Approach – Final Report, August 2022, available at www.escosa.sa.gov.au/advice/advice-to-local-government
2 The indicators are specified in the Local Government (Financial Management) Regulations 2011. Since 2011, each council has been required to refer to these three indicators in its plans, annual budget, mid-year budget review and annual financial statements. The councils can adopt their own target range for each ratio, but the Commission has adopted the previously suggested Local Government Association (LLGA) target ranges as a basis for its analysis, which were established and agreed during the development of the LGA Financial Sustainability Papers (2006-2011).
3 The F&A listed 29 analytical questions that the Commission has answered in assessing the Council’s performance against these indicators to determine affordability, cost control and other sustainability risks.
4 Local Government Act 1999 (LLG Act) s122(1g)(a)(i).
in that context. Findings regarding the content of the Council’s AMPs, and the alignment between its LTFP and AMPs, 5 are discussed in section C.3.
The Commission has also reviewed the Council’s template data which contains its 2023-24 LTFP forecasts for 2023-24 to 2032-33, as well as its 2022-23 LTFP forecasts, and historical financial data and number of rateable properties and council staff (Full Time Equivalent (FFTE)) numbers from 2012-13 onwards. 6 7 All charts and tables in the Advice are primarily sourced from these datasets. In addition, the Commission has reviewed the Council audit committee reports, and other public information, as appropriate.
The Commission has reported estimates in nominal terms, for consistency with the Council’s plans and actual rate levels, but it has compared estimated inflation impacts to these trends as a guide to identify ‘real’ rather than ‘inflationary’ effects. In the charts, the Consumer Price Index (CCPI) line shows the cumulative growth in the CPI (Adelaide) series from 2012-13, and then projections of this series from 2023-24 based on the Reserve Bank of Australia (RRBA) (Australia-wide) inflation forecasts (to the June quarter 2025), and the midpoint of the RBA target range (2.6 percent) thereafter.
Finally, in formulating this Advice, the Commission has had regard to the circumstances of the Council, including its location as a regional council, its income level ($28.4 million) and the size of its rates base (more than 8,265 ratepayers 8).
Summary of the Light Regional Council’s financial sustainability performance and the Commission’s risk assessment
Financial sustainability indicators: 2022-23 estimate
Last 10 years from 2012-13 (Actual performance)
Operating surplus ratio (target 0-10%)
Operating deficits
Net financial liabilities ratio (target 0-100%)
Asset renewal funding ratio (target 90-110%)
Identified Risks:
Next 10 years from 2023-24 (Council forecasts)
Improved performance -------> Surpluses projected ------------------------------>
Ratio met historically ---------------------------------------------->
Volatility in renewal works spending & some years below target range -------------------------------------------------->
Ratio projected within target from FY27 ->
Ratio within or above LGA target range as deferred renewals addressed
On average, operating expenses growth less than forecast CPI --------------------------->
Rates revenue per property average growth of 4.6% pa to 2021-22 (CPI 2.0%)
Projected rate revenue per property average growth below forecast CPI (CPI 2.8%)
Ratio close to suggested LGA target range or medium risk
Ratio within suggested LGA target range or lower risk
5 As required under s122(1b) of the LG Act.
6 Sourced from the Local Government Grants Commission (including data reported by the Office of the Valuer-General) and the Council’s data.
7 The Council’s estimates for the 2022-23 financial year, relied on at the time of preparing this advice, were unaudited.
8 Based on the estimated number of property assessments in 2023-23.
B Material plan amendments in 2023-24
The Council has made various amendments to its 2023-24 budget and forward projections, partly for inflation and partly for other revenue and spending initiatives. The material amendments to some of its main financial forecasts are listed in the table below (in nominal terms). 9 To ensure a comparable analysis of estimates between the 2022-23 and 2023-24 LTFPs, the Commission has reviewed the nine overlapping years’ statistics, 2023-24 to 2031-32, and identified material amendments accordingly. Selected
B.1 Changes to operating performance
The Council has budgeted (in 2023-24) for an increase in its operating surplus of $22.8 million compared to a surplus of $2.1 million in the 2022-23 LTFP. In aggregate, the projections in its current and previous LTFPs (that is, over the nine-year comparative period to 2030-31, as shown in the table above) indicate the Council’s cumulative operating surplus improved by $20.8 million This outcome reflects the Council’s significant increase in operating income arising from the receipt of funds pertinent to its Bunyip 1 Water project completed in 2022-23. 12
For the 2023-24 budget year, the Council has also noted a decrease in finance costs that contributed to the improvement in the operating deficit (compared to the LTFP) and certainty in employee expenses as a result of its enterprise agreement, (together a $0.4 million decrease in operating expenses).
Some of the amendments, compared to the LTFP, include: 13
Decreased cost pressures for ‘materials, contracts and other’ expenses
Employee expenses contained by enterprise agreement (for the known period of the agreement)
A further 2.1 percent increase in rates revenue
Increase in income of $11 million from Bunyip 1 project, with an associated decrease in finance costs
9 This table shows only selected financial items to demonstrate the material amendments made by the Council in its 2023-24 estimates. It excludes various financial items and individual items do not sum to totals.
10 The capital expenditure estimates are based on the 2023-24 LTFP estimates provided by the Council to the Commission (in an Excel template).
11 Footnote 10 applies.
12 Correspondence from Light Regional Council dated 31 August 2023, p 3.
13 Footnote 12 applies.
The Council’s historical and projected operating performance is discussed further in section C.1
B.2 Indexation adjustments
The Council applies indexation adjustments to its cost and revenue estimates, including 2.1 percent for rates, 3 percent for materials, contracts and other expenses and 2 percent for wages and salaries 14 The Council stated that its general rate revenue and services charges are increased at a rate below CPI inflation 15 Based on updated inflation assumptions in its 2022-23 LTFP, an increase in its revenue estimates by 1.3 percent over the 2023-24 to 2031-32 forecast period, 16 including recognition of deferred grant income compared with the same estimates in its 2022-23 LTFP, supports the Council’s statement
The Council has factored several genuine savings into its LTFP projections, discussed in section C.1. The RBA currently forecasts the CPI (Australia-wide) to increase by 3.9 percent in the year to the June 2024 quarter and by 3.3 percent in the year to June 2025. Thereafter, it is reasonable to anticipate a return to long-run averages (and growth of 2.6 percent per annum from 2025-26, based on the RBA’s 2 to 3 percent target range). 17
The Commission notes that the Council’s stated assumptions for indexation in its 2023-24 LTFP are based on its annual review of these and other forecasts Noting the Council has endeavoured to find savings and reduce any inflationary impact on its community, the Commission has found that it would be appropriate for it to:
1. C Continue to review its inflation forecasts in its annual budget and forward projections from 2023-24, given the potential for higher short-term inflation outcomes, followed by a return to long-term averages.
B.3 Increase to capital expenditure estimates
The Council’s 2023-24 LTFP indicate no changes in capital expenditure for asset renewals nor for new and upgraded assets compared to the previous year’s LTFP (for the period from 2022-23 to 2030-31).
The Council’s capital expenditure outlook is discussed further in section C.3
B.4 Changes between 2023-24 long-term financial plan and annual business plan
The Council adopted its LTFP in June 2023, together with its annual business plan and budget
The Commission notes that the Council’s LTFP identifies the risks to its estimates after it is adopted (due to environmental and economic factors, for example) and that the annual business plan also includes its 2023-24 estimates (from the LTFP). The Commission also acknowledges the Council’s efforts in community consultation on budget development and material budget adjustments and inclusion of community feedback. 18
The Commission has noted that the Council has prepared its AMP in real terms as opposed to nominal terms and it stated that these costs were included in budgets following indexation for inflation. The Commission notes the Council’s process in disclosing information underpinning capital expenditure in its LTFP Other parameters and assumptions were also provided; 19 however, the Council’s assumptions about inflation were not explicitly stated. The Commission recommends that the Council:
14 Final 2023 2024 ABP and Budget, p 23
15 Final 2023 2024 ABP and Budget, p 12
16 The set of nine years forecast in both the 2022-23 and 2023-24 LTFP projections.
17 RBA, Forecast Table - November 2023, available at https://www.rba.gov.au/publications/smp/2023/nov/economic-outlook.html
18 Light Regional Council, Audit and Risk Committee Meeting Agenda – 13 June 2023, Item ARC7.3 Public Consultation – Draft 2023/2024 Annual Business Plan, Budget and 2023-2033 Long-Term Financial Plan, p. 18 available at https://www.light.sa.gov.au/__data/assets/pdf_file/0031/1413598/ARC20230613AGN.PDF
19 Light Regional Council, 2023/2024 Annual Business Plan, Budget, and Long Term Financial Plan, p 21
2. F Further define the basis, including inflation assumptions, for preparation of annual business plans, budgets and the long-term financial plan in the accompanying documentation to increase transparency about the assumptions underpinning the figures.
C Financial sustainability
C.1 Operating performance
The Council had operating deficits from 2012-13 to 2014-15, followed by consistent operating surpluses until 2021-22. The operating income surplus averaged $0.3 million per annum from 2012-13 to 2021-22 (see the left chart below)
The projected operating performance is expected to remain in surplus, with revenue growth at 1.3 percent and expenditure growth at 3.2 percent (see the right chart below). Spikes in the operating surplus are related to the Council’s Bunyip water projects.


Rates revenue has increased on average by 5.5 percent per annum from 2012-13 to 2021-22, 20 during which time rateable property growth averaged 0.8 percent and CPI growth averaged 2.0 percent. Over the same period ‘grants, subsidies and contributions’ (accounting for 8.9 percent of total operating income) increased by an average of 2.8 percent per annum Grants income has been ‘lumpy’ from year to year, 21 and the three-year average of $271 per ratepayer in 2021-22 reflects an increase in value in real terms compared with the three-year average of $194 in 2014-15
The Council’s operating expense growth of 2.9 percent (from 2012-13 to 2021-22) was primarily due to an average annual increase of 4.7 percent in ‘employee’ expenses and 3.5 percent in ‘materials, contracts and other’ expenses (see the changes by expense type in specific time periods in the left chart over the page).
Looking forward, the Council is projecting average annual rates revenue growth of 3.3 percent to 2032-33, which encompasses forecast growth in rateable properties. This growth is above the forecast long-term inflation, 22 and represents a small real terms increase in rates per property (mainly from the period 2023-24 to 2024-25). After that time, rates are projected to increase at a rate below forecast inflation The average growth in annual rates revenue is also higher than expected expense growth (rates are discussed in more detail in section D).
Forecast average expense growth of 3.2 percent per annum is above the RBA-based forecast inflation growth 23 and represents a decline from the Council’s cost control performance historically (with average annual growth of 2.9 percent in the 10 years to 2020-21).
20 Based on the compound average annual growth rate formula (which is the adopted approach to calculating average annual growth rates throughout the Commission’s advice).
21 Due to the timing of different grants and sometimes advance grant payments (as for the 2023-24 grant allocation, which was received and accounted for in 2022-2023).
22 The forecast average annual growth in the CPI from 2023-24 to 2032-33 is estimated to be 2.6 percent based on the RBA forecasts for the CPI (Australia-wide) to June 2026 (and the Commission’s calculations of average annual percentage growth) and within the RBA’s target range (2 - 3 percent) from 2025-26
23 Footnote 22 applies
Expenses per property (a metric which also accounts for growth) are expected to remain relatively static over this period, which would represent a significant cost reduction in real terms (based on current inflation projections) (see the right chart below). The Council anticipates benefitting from economies of scale with respect to its forecast growth. This may be a risk, but it appears to be mitigated by significant progress and ongoing demand within the Roseworthy expansion 24


The Council’s template data (provided to the Commission) shows that employee numbers are assumed to increase from a current level of 97 FTE to 108 FTE Most of Council’s operating income and expense lines indicate growth close to or above current inflation forecasts Grants income represents a forecast of $2.8 million per annum (on average in nominal terms), compared to a historical average of $1.9 million per annum. 25 In addition, ‘employee’ expenses and ‘materials, contracts and other’ expenses are forecast to increase by an average of 3.1 percent and 3.8 percent per annum respectively, from 2023-24 to 2032-33 Overall, this would reflect contained growth, close to forecast inflation. This is a positive trend, noting that the Council’s improved financial sustainability outlook does rely on continued cost containment and the economies of scale associated with growth in rateable properties as mentioned above
The Commission has observed the current practice of the Council in conducting regular service level reviews of its operations, focused on achieving increased productivity, efficiency and effectiveness, and ultimately, real savings, 26 for example, some of the forecast developments will also contribute community assets such as community centres and sports facilities. 27
To ensure the Council is positioned to contain its expenses within its forecast cost base and achieve its operating performance targets (without the need for further rate increases above inflation), the Commission encourages it to:
3. C Continue to monitor cost growth in its budgeting, including related to employee expenses, to contain it within the forecast long-term financial plan
4. C Continue its practice of reporting any actual and projected cost savings in its annual budget (and long-term financial plan, as appropriate), to provide evidence of containing cost growth and achieving efficiency across its operations and service delivery.
C.2 Net financial liabilities
With the Council’s operating deficits from 2012-13 to 2014-15, followed by ongoing operating surpluses, its net cash flows after operating and investing (that is, capital-related) activities has averaged negative $2 million annually between 2012-13 and 2021-22 – strongly influenced by major new capital
24 Email Correspondence with Council dated 31 January 2023 and Council comments on draft advice
25 Based on the Council’s Excel template provided to the Commission. Historical average is based on the 10-year period from 2011-12 to 2021-22; and forecast average is based on the 10-year period from 2023-24 to 2032-33
26 Council, 2023/2024 Annual Business Plan, Budget, and Long-Term Financial Plan, p 4.
27 Meeting between Council and ESCOSA on 12 December 2023.
acquisitions in 2015-16 and 2018-19. This is different to the chart below which shows cash held by the Council at the end of each year, including financing activities, has been minimal in most years but which has averaged $1.4 million due to the high level of cash held at year end 2014-15
The Council has predominantly used borrowings to fund its renewal of existing assets and acquisition of new and upgraded assets and public private partnership projects (e.g. Bunyip water) For example, in the 2015-16 LTFP, the Council included borrowings of $11.3 million to fund the ‘Bunyip1’ major water project. 28 The Council discharged this loan in 2022-23 and used returns from the project to surrender additional cash advance debenture loans, reducing overall indebtedness. 29
The Council’s net financial liabilities ratio has trended between 52.1 and negative 14.3 percent between 2012-13 and 2022-23 (see the bottom left chart below). This is within (or below) the suggested LGA target range for the indicator of between zero and 100 percent (averaging 18 percent over this period) and is at a level which demonstrates that the Council is only accumulating liabilities that its operating income can reasonably service (see the top right chart below). 30 The Council has estimated that the ratio will peak at 43.3 percent in 2024-25, with additional borrowings related to the Bunyip2 major water project as noted in the December 2023 meeting with Council.
The ratio will then have a general downwards trajectory until 2029-30 then start rising again, which reflects both the declining trend in borrowings and other liabilities (see bottom right chart below), and the projected operating income growth (an average of 1.3 percent per annum). As previously stated, the Council is relying predominantly on growth in rateable properties and lower growth in operating expenses to maintain or improve its overall financial sustainability.


28 Correspondence with Light Regional Council dated 31 August 2023, p 3
29 Note 28 applies.
30 The net financial liabilities ratio is defined as: Net financial liabilities ÷ Total operating income. This ratio measures the extent to which a council’s total operating income covers, or otherwise, its net financial liabilities. The suggested LGA target range is between zero and 100 percent of total operating income, but possibly higher in some circumstances (LGA SA Financial Indicators Paper, pp. 7-8).
C.3 Asset renewals expenditure
The Council has experienced a highly variable asset renewal funding ratio 31 between 2012-13 and 202122, and the 2022-23 unaudited estimates 32 continue the trend (see chart overleaf top right).
Between 2012-13 and 2021-22, the asset renewal funding ratio (under the ‘IAMP-based’ approach) averaged 111.9 percent, 33 signifying spending on the renewal and rehabilitation needs of its asset stock that is slightly above the LGA target range over this period but reflecting the Council’s need to renew assets that were not renewed in a timely manner prior to 2012 34 (as also noted in meeting with Council)
The Council’s spending on renewal and rehabilitation of assets averaged $3.3 million each year over the period 2021-13 to 2021-22 (see chart overleaf top left). With reference to increased costs for construction, the Council noted it kept capital expenditure within forecast budgets by deferring projects 35
Over the 10-year projections in the 2023-24 LTFP, the Council has factored in a total of $94.8 million in capital renewal and replacement works: $80.2m on renewal and replacement works and $14.5 million in new and upgraded capital works, accounting for 84.6 percent and 15.4 percent of the total capital expenditure program respectively. The Council’s stated practice 36 is to take a conservative approach and include only known grants in its LTFP, which may result in the capital expenditure on asset renewals appearing to be more significant This may present difficulty in comparing historical performance (which includes all grants received) to forecast performance, noting that grants as a percentage of income were 8.9 percent in the period 2012-13 to 2021-22 compared to forecast 8.3 percent for the period from 2023-24 to 2032-33.
The Council’s transport assets (mainly road assets) represent a significant asset class, and is a major focus of its renewal investment, estimated to account for approximately 77.5 percent 37 of the total asset renewal budget averaging $6.2 million per annum over the next 10 years. The renewal budget incorporates a portion of deferred renewal expenditure; however, the Council estimates that there will be a 12.5 percent funding shortfall for transport assets, 38 which will not be covered over the 10-year projections in the 2023-24 LTFP as it is not included in the projected funding. The Council intends to continue addressing deferred asset renewals as funding is available. 39 The intentional exclusion of funding to cover all deferred asset renewals presents a risk of asset failure or service level provision that is lower than expected.
From 2023-24 to 2032-33, the asset renewal funding ratio is forecast to average 112.6 percent (see chart overleaf top right), reflecting continuation of the historical trend that has been focused on renewing deferred asset renewals Average annual spending on renewal or rehabilitation of assets is projected to increase to $8 million (in nominal terms)
The Council has significantly grown its asset base over the past 10 years, averaging $9 2 million per annum on new or upgraded assets between 2012-13 and 2021-22 (see the right chart overleaf). This has led to a steady increase in the value of the asset stock per property of $550 or 2.5 percent for each year over the 10 years to 2020-21 (see the bottom left chart overleaf).
The Council has forecast a continuation of its high levels of spending on renewals of asset stock as described above, in addition to expenditure on new/upgraded assets partly in transport asset projects
31 The IAMP-based method is the current industry standard whereby asset renewal/replacement expenditure is divided by the recommended expenditure in the IAMP (or AMP). Ideally, this will show the extent to which a council’s renewal or replacement expenditure matches the need for this expenditure, as recommended by the plan. The suggested LGA target range for the ratio is 90 to 110 percent (LGA SA Financial Indicators Paper, p 9).
32 2022-23 Unaudited figures as reported in the LTFP template
33 The quoted averages for the ratio are based on ‘gross asset renewal expenditure’ (before the sale of replaced assets) rather than ‘net asset renewal expenditure’.
34 Correspondence with Council dated 11 December 2023, and Council Responses to ESCOSA Questions (p 4)
35 Correspondence with Council dated 11 December 2023 and Council Responses to ESCOSA Questions (p 1)
36 Council Responses to ESCOSA Questions and Meeting between Council and ESCOSA on 12 December 2023.
37 Technical Asset Management Plan Summary Bridges, Floodways, Footpaths, Stormwater, Transport (Roads) 2020-2030, p 4 and LTFP renewal projections
38 Note 37 applies
39 Correspondence with Council dated 11 December 2023, and Council Responses to ESCOSA Questions (p 5)
and township expansion The Council further forecasts that expenditure on new and upgraded assets will average $1.5 million per annum from 2023-24 to 2032-33 with growth averaging 3.5 percent per annum (a modest level in comparison to historical expenditure – see chart below right), noting that grants supporting additional expenditure may be excluded as discussed above.
As discussed in a meeting with the Council, the Commission notes the financial impact of the Council’s major water projects, significant transport related projects and strong development pipeline causing material differences to the historical expenditure and forecasts. 40 The forecast asset value per property is expected to decline from $28,419 in 2022-23 to $23,820 in 2032-33 (see bottom left chart below) noting that this may be a characteristic applicable to any fast-growing council where rateable property growth is high.


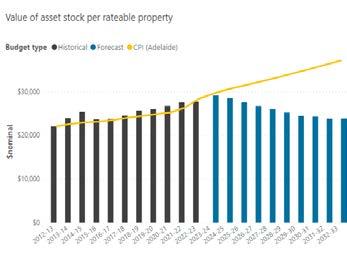

Asset renewals can also be evaluated by the depreciation-based asset renewal funding ratio, 41 which is projected to track in line within the LGA recommended range (for the IAMP-based ratio) of 90110 percent, averaging 103.7 percent per annum to 2031-32 (see chart overleaf below right). Historically (between 2012-13 to 2021-22) depreciation expenses have outpaced renewal capital expenditure by a significant margin (totalling $23.8 million over ten years). This earlier period may indicate an intergenerational equity 42 risk, as the Council had partly funded new/upgrade capital expenditure (through depreciation), while deferring or under investing on its asset renewal needs There may also be a mismatch between the assessed useful lives of assets and actual useful lives of assets as indicated by renewals required.
40 Correspondence with Council dated 31 August 2023 (p 3); Correspondence with Council dated 11 December 2023; and Council Responses to ESCOSA Questions (p 1).
41 The Council’s asset renewal funding ratio by the depreciation-based method (where asset renewal/replacement expenditure is divided by depreciation expenses). This ratio shows the extent to which capital expenditure on the renewal and replacement of assets matches the estimated rate at which these assets are used or consumed.
42 ‘Intergenerational equity’ relates to fairly sharing of services and the revenue generated to fund the services between current and future ratepayers.
Council has also noted that significant increases in construction costs in later years (2020-2022) has led to reduced construction outcomes, as costs were contained within the capital works program aligned to LTFP targets. 43 Limiting expenditure to budget when costs have risen gives rise to additional deferred asset renewals which, when combined with known shortfalls in funding allocation (refer discussion above), creates a risk of asset failure.


The Council has a comprehensive AMP 2020-2030 in addition to detailed technical AMPs for transport assets, buildings and open spaces, and CWMS assets These cover most of the Council’s asset base and reflect asset valuations that have been carried out within the last four years. In formulating its AMPs, the Council has considered several matters such as customer levels of service, utilisation and demand of its assets, life cycle management, and risk management planning These matters (among others) have informed the Council’s planned operating and maintenance budgets, and asset renewal needs over the period to 2030. The Council has also detailed how its asset renewal funding forecasts (in its 2023-24 LTFP) aligns with its AMP renewal targets. The Commission notes the Council’s process of annual review of asset register data and rolling 4-year reviews of specific asset classes. 44 The Commission’s review of the AMPs has found that the Council’s strategic planning processes aligns with good practice for a council of its size and complexity.
The Council advises that the current asset class under review is transport assets and potential expenditure from this review is not yet included in the LTFP. 45 Given that transport assets form a major part of the Council’s asset base, there is a risk that significant additional expenditure may be required for depreciation and operational or capital expenditures.
The Council’s planned renewal expenditure is mainly attributed to transport assets, covering bridges, floodways, footpaths, stormwater and transport, and accounts for approximately 81 percent of total renewals from 2023-2030 46 Aside from transport works, the Council has planned renewals for buildings and open spaces, and CWMS assets (together approximately 19 percent of total renewals). The Council has a strong focus on, and successful track record in attracting, funding to undertake renewal and new capital projects. 47
As previously noted, the Council has identified some deferral of completion of construction outcomes due to budgetary constraints which has led to a ‘renewal funding gap’, across all asset classes in its AMPs. This gap is estimated to be $6 million in 2023-24 and potentially extending to $16 million in 2032-33; however, the Council anticipates a lower inflation and lower interest rates environment in coming years which may mitigate the size of the gap In addition, the Council is reviewing its long-term
43 Correspondence with Council dated 31 August 2023, p 1
44 Council’s Responses to ESCOSA Questions (p 1) and meeting between the Council and ESCOSA on 12 December 2023
45 Correspondence with Council dated 31 August 2023, p 6
46 Data from Technical Asset Management Plan Summaries -Budget Summary by Lifecycle Activity
47 Correspondence with Council dated 11 December 2023; Council’s Responses to ESCOSA Questions (p 1); and meeting between the Council and ESCOSA on 12 December 2023
funding/borrowing strategy with a focus on inter-generational impacts. 48 The Commission notes that a deferred asset renewal gap under the current funding regime will remain unless the Council assigns more funding to renewal capital expenditure. For these reasons, the Commission considers that it would be appropriate for the Council to:
5. I Increase funding to address deferred asset renewals and review adequacy of renewal spending by 2028
6. F Forecast and include the impact of new assets into long-term financial plan to provide transparency for existing and future ratepayers
‘The Council indicated to the Commission that it is proposing several amendments to its AMPs, as follows: 49
Comprehensive review of all transport infrastructure including asset condition assessments
Revaluation of transport assets
Review and update of AMP with potential changes in priorities.
D Current and projected rate levels
D.1 Historical rates growth
The Council’s rate revenue per property growth has averaged 4.6 percent or $93 per annum for each property over the past 10 years, 50 to reach an estimated $2,811 per property in 2021-22 (see the left chart below). This has exceeded CPI growth (2.0 percent per annum over this period 51), but also encompasses 0.8 percent average annual growth in rateable property numbers. Current rate levels partially reflect its recent history of spending growth, predominantly on capital expenditure (on renewals, and new and upgraded assets), higher employee-related costs, and the Council’s focus to improve its operating surplus.
The Council remains mostly reliant on its rate base for its operating sustainability although income from capital projects has supported the Council to minimise future rates rises and absorb some expenditure increases 52 As the chart below indicates (to the right), rates revenue has been maintained at a steady proportion of income, forecast to account for 83.5 percent of budgeted operating income on average between 2023-24 and 2032-33, compared with 81.4 percent of income in 2012-13. The Commission notes the Council has set its rates after undertaking its own benchmarking reflecting its services and ratepayer’s service level expectations 53


D.2
Proposed 2023-24 rate increases
The Council has budgeted for an average rate increase of 3 percent or $81 per property for its existing ratepayers in 2023-24. 54 The rates increases are contained despite recent higher short-term inflation, and this was enabled by a significant reduction in finance costs following the realisation of benefits from the Bunyip 1 water project. 55 The Council also has a strategy to provide rates relief for ratepayers that experience property valuation increases of more than 10 percent, 56 noting that rateable property valuations increased 13.62 percent from July 2022 until April 2023 when rates were set 57 The Council has also assumed growth in the area will be strong, with growth in rateable properties increasing at 3.2
50 From 2012-13 to 2021-22.
51 CPI Adelaide (All groups). Available at: https://www.abs.gov.au/statistics/economy/price-indexes-andinflation/consumer-price-index-australia/sep-quarter-2023#capital-cities-comparison
52 Light Regional Council 2023/2024 Annual Business Plan, Budget and Long-term Financial Plan, p 10
53 Correspondence with Council dated 31 August 2023, p 7.
54 Based on the Council’s 2023-24 Annual Business Plan and its Excel template (with the 2023-24 forecasts) provided to the Commission. The Commission has used $23.239 million (in 2023-24 budgeted rates revenue) compared to unaudited 2023-23 estimates Individual rate level changes may be higher or lower depending on the rates category and property value.
55 Correspondence with Council dated 31 August 2023, p 3.
56 Note 45 applies.
57 Light Regional Council 2023/2024 Annual Business Plan, Budget and Long-term Financial Plan, p 8.
percent over the forecast period Significant regional population growth is anticipated in the area surrounding Roseworthy over the next decade. 58
Different rate categories are subject to varying changes, with residential ratepayers to pay a lower increase of 2.7 percent or $48 per property on 2022-23 levels. Primary production (mostly farmland) ratepayers are budgeted to pay 2.8 percent or $74 per property 59
Other than ‘general rates’ revenue, the Council collects income from waste collection, the CWMS charge, and the Regional Landscape Levy
D.3 Projected further rate increases
Over the forward years of its LTFP, the Council is projecting average rates increases per property for its existing ratepayers of approximately 0.6 percent per annum from 2022-23 to 2032-33 primarily due to the forecast growth in rateable properties
In total, the LTFP effectively projects a modest cumulative increase of $171.35 per existing ratepayer by 2032-33, 60 which is consistent with the Council’s assumption of growth in rateable properties, lower inflation and interest rate growth over this period but is also below the RBA-based inflation forecast of an average of 2.6 percent per annum 61
As a result of the modest rates increases, the percentage of the Council’s total income contributions from ratepayers is projected to average around 83.5 percent, a consistent percentage compared with the historical average
Risks for ratepayers may arise if:
the anticipated growth does not eventuate,
inflation exceeds the Council’s estimates,
additional operational expenditure is required due to a revised transport AMP, or
unanticipated remedial expenditure is required due to deferred asset renewal backlogs.
D.4 Affordability risk
Affordability risk among the community for these further rate increases appears to be low, on balance, when considering:
the Council’s relative average socio-economic indexes for areas (SSEIFA) economic resources ranking for the Council area, 62
the current rates without further forecast increases above inflation for ratepayers,
58 Light Regional Council 2023/2024 Annual Business Plan, Budget and Long-term Financial Plan, p 5.
59 Rate in the dollar applied to the capital value of the property in the Council area. Light Regional Council, 2023/2024 Annual Business Plan, Budget and Long-term Financial Plan, p 49
60 The Commission has calculated growth based on removing the effect of the Bunyip water projects income on rates revenue following discussion with the Council on 31 January 2024
61 The forecast average annual growth in the CPI from 2023-24 to 2032-33 is estimated to be 2.6 percent based on the RBA forecasts for the CPI (Australia-wide) to June 2026 (and the Commission’s calculations of average annual percentage growth) and within the RBA’s target range (2 - 3 percent) from 2025-26.
62 The Light Regional Council area is ranked 70 among 71 South Australian ‘local government areas’ (including Anangu Pitjantjatjara and Maralinga Tjarutja Aboriginal community areas and ‘unincorporated SA’) on the Australian Bureau of Statistics SEIFA Index of Economic Resources (2021), where a lower score (eg, 1) denotes relatively lower access to economic resources in general, compared with other areas, available at https://www.abs.gov.au/ausstats/subscriber.nsf/log?openagent&2033055001%20%20lga%20indexes.xls&2033.0.55.001&Data%20Cubes&5604C75C214CD3D0CA25825D000F91AE&0&2016&2 7.03.2018&Latest
the effect of cumulative increases in rates per existing ratepayer of approximately 2.0 percent per annum to the period 2031-32, below the forecast rate of inflation, and
the overall financial sustainability risks of the Council and its LTFP trend towards ongoing operating surpluses
However, as the current economic environment is putting more pressure on most communities’ capacity to pay for further rate increases, including those of the Council, the Commission considers it would be appropriate for the Council to:
7. C Consider limiting future increases in rates to no more than expected inflation.
The Essential Services Commission
Level 1, 151 Pirie Street Adelaide SA 5000 GPO Box 2605 Adelaide SA 5001 T 08 8463 4444
E escosa@escosa.sa.gov.au | W www.escosa.sa.gov.au
(08) 8525 3200
light@light.sa.gov.au
www.light.sa.gov.au