2023/2024 Annual Business Plan, Budget, and Long Term Financial Plan
Acknowledgement of Country
We acknowledge the Kaurna and Ngadjuri Peoples as the Traditional Owners of the country that makes up the Light Regional Council. We respect their spiritual relationship to their country and acknowledge that as Traditional Custodians, their cultural heritage and beliefs are still as important today.
Contents FROM THE MAYOR 3 HOW THE PLAN WAS PREPARED ………………………………………………………………………………………………………… 4 CEO FINANCIAL SUSTAINABILITY STATEMENT…… 5 SNAPSHOT OF THE REGION………………………………………………………………………………………………………………….. 6 COMMUNITY SERVICES & PROGRAMS ………………………………………………………………………………………… 7 HIGHLIGHTS FOR 2023/2024 ……………………………………………………………………………………………………………….. 10 MEASURING COUNCIL’S PERFORMANCE 11 CLIMATE……………………………………………………………………………………………………………………………………………………… 13 STRATEGIC DIRECTION …………………………………………………………………………………………………………………………. 14 Community………………………………………………………………………………………………………………………………….. 15 Environment … 18 Investment ………………………………………………………………………………………………………………………………… 19 SIGNIFICANT INFLUENCES & PRIORITIES ……………………………………………………………………………………………. 22 ANNUAL BUDGET FOR OPERATIONAL SERVICES ………………………………………………………… 23 FOUR YEAR BUDGET ………………………………………………………………………………………………………………………………… 29 CAPITAL PROJECTS PROGRAM……………………………………………………………………………………………………………… 32 LOANS 34 LONG TERM FINANCIAL PLAN ………………………………………………………………………………………………………………. 36 APPENDIX A – RATING STRUCTURE & POLICY ………………………………………………………………………………….. 49 APPENDIX B – STATEMENTS ON EXPECTED RATE REVENUE ………………………………………………………… 55 APPENDIX C – CAPITAL ASSET RENEWAL PROGRAM ………………………………………………………………………. 58
FROM THE MAYOR
A Message from the Mayor
On behalf of my Council colleagues, I am pleased to present this 2023-2024 Council Budget. Each year our budget aims to deliver on our Council Plan and its three strategic priorities of Community, Environment and Investment


The Annual Business Plan (ABP) details the services, programs and projects Council intends to deliver in the 2023/2024 Financial Year and how it will be funded. It also includes a revised Long-Term Financial Plan (LTFP) for the period 2023/2024 to 2032/2033 financial years. The first four years of the LTFP incorporates the Four-Year Budget outlining Council’s capital, operational strategies, and projects for that period.
This year’s $26.6m operating expenditure and $9.1m capital expenditure budgets will ensure Council continues to provide expected key services and activities, maintenance and upgraded capital works programs and new initiatives, while concurrently focussing on emerging developments and residential housing growth across the region. Council’s budget program continues to achieve financial sustainability during the life of the LTFP
The ABP is aligned with the objectives and actions identified in Council’s Strategic Management Plan under Community, Environment and Investment and considers the South Australian State Government’s Strategic Plans, the Regional Development Association’s Roadmap, and regional partners’ strategic directions.
A significant project for Council in the 2023/2024 Budget and LTFP is the Roseworthy Water Scheme, also referred to as Bunyip 2 due to it being the second Public Private Partnership arrangement with Bunyip Water involving regional water infrastructure. Using $4.9 million of Commonwealth and State Government grant funds, property developer contributions and cash advances from the Local Government Finance Authority, implementation of the initial stage of the scheme will deliver a discharge pathway for stormwater harvested from developments across the Roseworthy Township Expansion and Kingsford Regional Industrial Estate areas. The water will be stored and reused on open spaces within the Roseworthy Township Expansion as well as for viticulture use in the western Barossa Valley.
Council recognises that the State Valuer General (VG) annual revaluation process continues to result in significant changes (increases and reductions) to some property valuations, particularly in the Residential and Primary Production land use categories. Council acknowledges that the current economic climate and increased cost of living expenses may make it difficult for ratepayers to keep pace with changing circumstances such as, rising interest rates and high inflation and will offer rate ‘relief’ in 2023. Rate payers who experience a substantial property valuation increase, of greater than 10% and meet the eligibility criteria can apply for a partial rate rebate.
Some highlights in the budget this year will be:
• Continuity of core Council services
• Improvements in road and other infrastructure with a program of $8.2 m
• Upgrades to community facilities $0.6m
• New community projects, initiatives or events $0.392m
• 45kms of unsealed roads resheeted
• 1,200km of road grading
• Other community programs
In the year ahead Council will provide services and programs that are responsive to the community needs and expectations, responsible, sustainable management of our intergenerational assets and support for growth investment across our region.
I would like to thank my fellow councillors for their input, and the council officers involved for their expertise and diligence in preparing this budget.
Light Regional Council 2023/2024 Annual Business Plan, Budget & Long-Term Financial Plan 3
HOW THE PLAN WAS PREPARED
The Annual Business Plan and Budget process enables Council to review its annual and four (4) year detailed financial plans and Long-Term Financial Plan. The process includes the review and refinement of budgetary considerations concerning the cost and level of service provision; management of Council’s assets; proposed infrastructure programs; economic development initiatives; and new initiatives raised by Business Case proposals. All initiatives and their expenditure impact are assessed against the financial impact on the community, ratepayers and Council.
Several economic and operational influences and assumptions were reviewed and revised to update existing financial plans.
Light Regional Council’s suite of strategic plans, listed below, are the underpinning documents from which the 2023/2024 Annual Business Plan (ABP) and Budget are formulated:
• Strategic Plan 2021-2025
• Infrastructure and Asset Management Plan (IAMP)
• Long Term Financial Plan (LTFP) 2022-2031
• The detailed four (4) year Budget program.
This plan proposes the 2023/2024 budget allocation and advises of the projects and services that Council plans to deliver to the community over the next 12 months. Included in this plan are:
• A summary of Council’s long term financial objectives
• An outline of Council’s objectives for the 2023/2024 financial year, including activities that Council intends to undertake to achieve those objectives and the measures (financial and non-financial) that Council intends to use to assess the performance against its objectives over the financial year
• A summary of proposed operating expenditure, capital expenditure and sources of revenue, whilst considering the financial requirements of Council for the financial year
• The property rating structure and associated policies
• An assessment of the impact of the rates structure and policies on the community, based on analysis that has been undertaken by Council
Following the public consultation process, Council reviews public feedback received and will consider the final plan at the 27 June 2023 Ordinary Council Meeting
Light Regional Council 2023/2024 Annual Business Plan, Budget & Long-Term Financial Plan 4
CEO FINANCIAL SUSTAINABILITY STATEMENT
Financial sustainability (FS) is where long-term financial performance and position is sustainable through planned long-term service and infrastructure levels and standards being met without unplanned increases in rates or disruptive cuts to services. Related to FS is the legislative obligation for council to take into account the financial effects on future generations in making any decision. It is clear that LRC’s ratepayers expect minimal volatility in the annual general rates and service charges levied. Meeting this expectation has become far more difficult in recent years with extreme volatility in annual property valuations, a key ingredient in the determination of rates ‘bills.’
Infrastructure assets
Councils are the custodians of a substantial investment in infrastructure assets. LRC analysis indicates that approximately 60% of total capital and operating outlays are related to this infrastructure. LRC approves a longterm Infrastructure Asset Management Plan (IAMP) to ensure that it is aware of the need to develop and replace its infrastructure assets to meet the service delivery expectations of the community. The IAMP is integrated into the long-term financial plan (LTFP) which is amended each year. Council also monitors relevant key performance indicators (KPI) to keep abreast of its infrastructure developments and ambitions. For example, the required ‘Asset Renewal Funding Ratio’ is forecast, but also the relationship being depreciation expense (the measure of the annual consumption of assets) and annual asset renewal expenditure is monitored.
Funding of infrastructure expenditure
Funding is a fundamental component of the sustainability equation. Funding comprises ‘internally generated funds’ from operations (mainly sourced from Council rate revenue), grants from other governments, capital contributions from other sources (e g property developers), asset sales, and borrowing. A small surplus shown on Statement of Financial Performance ‘budget’, and a high level of rates and other debtors’ collection, ensures that non-cash depreciation expense provides the funds to replace existing assets. The LTFP contains several funding elements that are carefully monitored to ensure medium and long-term financial sustainability including:
• A small ‘operating’ surplus, historically and into the future
• High levels of collection of revenue due
• Avoidance of borrowing for operating purposes, except cash flow variability
• Use of long-term borrowing only for the purpose of new community organisation assets, ratepayers fairly share in the costs and benefits of new infrastructure assets (i.e. long-lived assets are not funded in the short term) and ensuring that future generations are not left with borrowing liabilities from immediate asset consumption
Although the long-term financial plan provides useful information for financial sustainability measurement the LRC also produces a strategic 10-year summary of capital expenditure ‘outlays’ and funding. This is a useful tool to ensure that capital outlays will be fully funded, effective management of short-term borrowing (cash advance debentures) and it highlights any annual volatility in borrowing needs for intergenerational assets. Refer table on page 34
Population growth
Regional growth, especially in the area surrounding Roseworthy, including a substantial increase in population in the next decade. Residential subdivisions will result in a significant hand-over of infrastructure assets from developers for safekeeping, maintenance, and renewal. To ensure that this growth does not threaten financial sustainability, LRC management has several control mechanisms, including a task team to engage and monitor the developments and the service levels being produced, as well as regular financial forecasting to understand the impact on the LTFP of both operating and renewal expenditure but also understanding rate revenue growth.
Light Regional Council 2023/2024 Annual Business Plan, Budget & Long-Term Financial Plan 5
SNAPSHOT OF THE REGION

Area of
the Light Region
Residents 4,397 Families
Households with internet connection (ID Community, 2021)
Residents who live in the region but work outside of it. (ABS, 2020)

Households renting (ABS, 2020)

Median house price affordability (ID Community, 2021) $390,000 0


Gross Regional Product (NIEIR FY 2019/2020)


Light Regional Council 2023/2024 Annual Business Plan, Budget & Long-Term Financial Plan 6
2015-2016 Value of Production in the Region (ABS, 2017) 15,792
14.5%
70%
40 Years Median Age $758m $11.0m 1276.8 Wine Grapes $15.7m 82.2% 70% 14.5% $390,000 Wheat $14.5m Pigs $48.3m Poultry $13.6m Hay $11.0m
COMMUNITY SERVICES & PROGRAMS
What Light Regional Council does to make the region a great place to live, work and play
Maintenance of Community Halls and Facilities
Includes: Town Institutes, Hewett Centre, Kapunda RSL, Men’s Shed, Herald Printing office, Kapunda Kindergarten.
Children and Youth Services
Providing programs and services for young people, self-development opportunities, immunisation program and youth sponsorship.
Library Services
Three branch libraries plus outreach locations.
Programs and resources to support lifelong learning, literacy, social connectivity, and skill development.
Community Transport
Services to assist those in the community who are transport disadvantaged, such as the aged and younger disabled residents without access to transport.
Services for the Aged and Disabled
Provide home maintenance and support services through The Barossa Region Home Assist Scheme.
Cultural and Heritage
Kapunda Museum and Community Art Gallery.
Grant funding under the Heritage Incentive Scheme to owners of local heritage places.
Economic Development
Economic development plan, encouraging investment in the region, supporting the agribusiness and tourism industries.
Parks, Gardens and Recreation Facilities
Planning, planting and maintenance of reserves, ovals, and gardens.
Maintenance of the Kapunda Swimming Pool.
Community Development
Grant and sponsorship programs, community, advice, advocating for the health and wellbeing of the community.
Street Lighting
Maintaining 1,200 existing public lights and installing new lighting, including reserve lighting, sports field, court and car park lighting.
Light Regional Council 2023/2024 Annual Business Plan, Budget & Long-Term Financial Plan 7
Tourism and Events
Kapunda Visitor Information Centre (accredited), visitor experience, event promotion, and website lightcountry.com.au
Public Health
Regulating food safety, vermin control, wastewater management in Kapunda, Freeling, Greenock, Roseworthy, and Neil Ave in Nuriootpa.
Infrastructure and Asset Management
Maintenance of bus shelters, cemeteries, footpaths on local streets, shared use paths, and sealed, unsealed, and unformed roads.
Planning and Development
Provision of planning and building related services, ensuring compliance with development legislation.
Compliance and Parking
Dog and cat management, nuisance, and litter control, permits for fires and burn offs, parking enforcement.
Streetscaping
Planning, planting and maintenance of verges and streetscapes. Street tree planting, maintenance and weed control. Emptying of public bins.
Stormwater Management
Stormwater drainage within the townships is monitored and maintained to prevent flooding.
Waste Management and Recycling
Domestic kerbside collection, hard rubbish, e-waste, litter control, illegal dumping, and street cleaning.
Emergency Planning
Provide advice to residents on fire risk management, local and zone emergency management plans.
Sustainability & Biodiversity
Maintaining and creating natural spaces that sustain local biodiversity.
Light Regional Council 2023/2024 Annual Business Plan, Budget & Long-Term Financial Plan 8
HIGHLIGHTS FOR 2023/2024
Budget highlights:
• An increase in general rate revenue of approximately 3%
• An increase on general rate revenue and service charges significantly below inflation with increases in energy and construction costs absorbed within the budget
• A cap on valuation increases with a $0.3m Rate ‘relief’ strategy providing a rebate for rate payers who experience substantial property valuation increase greater than 10%
• A small budget surplus of $0.042m
• Continuity of existing services
• $0.39m funding available for new community initiatives
• Implementation of ‘Bunyip 2’ for water re-use project associated with the Roseworthy development.
• Infrastructure Capital Works Program (Appendix C) totalling $ 8.2m that includes:
o a road re-sheeting program $2.6m
o a Rural Road sealing program of $1.4m
o the upgrade of 4 township roads $0.6m
o 48kms of unsealed roads re-sheeted
o 1,200km of road grading
• Completion of the upgrade and renewal of the Community Wastewater Management System (CWMS) to support population growth $0.5m
• Angle Vale ‘historic’ Bridge – provision for restoration project undertaken by the City of Playford, subject to review of what can be achieved after the collapse of the bridge.
• Community facilities upgraded to ensure compliance, improve safety, wayfinding, and accessibility $0.6m,
• Continue to implement the Reconciliation Strategy to support the actions and outcomes from Council’s ‘Reflect’ Reconciliation Action Plan (RAP), including NAIDOC initiatives and developing partnerships with Kaurna and Ngadjuri peoples.
Light Regional Council 2023/2024 Annual Business Plan, Budget & Long-Term Financial Plan 10
MEASURING COUNCIL’S PERFORMANCE
Council’s success measure is driven by the achievement of key financial and strategic objectives and performance indicators aligned to the 2021-2025 Strategic Plan, Long Term Financial Plan, Infrastructure and Asset Management Plan (IAMP) and supporting corporate documentation.
Financial Indicators
When evaluating activities undertaken during any given financial year, several factors are considered, one being the future financial sustainability (refer CEO Financial Sustainability Statement pg. 5) These measures are all ‘longterm’ so the trend over time is as important as the result or target for any individual financial year. Refer section ‘Long Term ratios’ The LTFP demonstrate Council’s financial sustainability and was prepared considering:
• The revenue and expenditure results for the past five years;
• Intergenerational equity to ensure future generations of ratepayers do not face overwhelming debt provided to the current generation;
• Provision of prioritise expenditure programs, both operating and capital aligned to Strategic Plans; and
• Rate revenue increases that are responsible and reflect the community’s ability to pay
A series of financial indicators, explained below, have been developed by the Local Government sector to assist in assessing whether a council is financially sustainable, or moving to a position of financial sustainability:
1. Operating Surplus Ratio – Desired level is between 0% and 5% on average.
Long-term financial sustainability is dependent upon ensuring that, on average over time, its operating income is higher than operating expenses (i.e. an operating surplus). The operating surplus ratio is the operating surplus (or deficit) expressed as a percentage of operating income. A positive ratio indicates the percentage of operating income available to help fund capital expenditure. A negative ratio indicates the percentage increase in operating income or the approximate decrease in operating expenses required to achieve a break-even operating result. Council’s Operating Surplus Ratio over the life of the long-term financial plan indicates a continuing sustainable operating result.
2. Asset Renewal Funding Ratio - Desired level is greater than 90% but less than 110% on average
Councils are the custodians of significant infrastructure assets that require renewal from time-to-time. The Infrastructure and Asset Management Plan (IAMP) provides a guide on when assets should be renewed. Net asset renewals expenditure is defined as net capital expenditure on the renewal and replacement of existing assets and excludes new capital expenditure on the acquisition of additional assets. This ratio is calculated as capital expenditure on renewal of existing assets divided by renewal expenditure from the IAMP and current budget for those asset classes without a completed IAMP. The ratio in individual financial years can vary significantly from the long-term average due to the volatility of assets being renewed.
3. Net Financial Liabilities Ratio - Desired level is greater than 0% but no more than 100% on average.
Net Financial Liabilities are defined as total liabilities less non-equity financial assets. Total operating revenue excludes profit on disposal of non-current assets. This ratio is a measure of Council’s total indebtedness.
Light Regional Council 2023/2024 Annual Business Plan, Budget & Long-Term Financial Plan 11
Financial Ratios Target 2018/2019 2019/2020 2020/2021 2021/2022 2022/2023 2023/2024 Operating Surplus Ratio 0% - 10% 3.1% 5.8% (1.8%) (1.6%) 3.3% 1.2% Asset Renewal Funding Ratio 90% - 110% 81% 125% 155% 63% 178% 151% Net Financial Liabilities Ratio 0% to 100% 32% 28% 23% 55% 52% 59%
Financial Ratios
CLIMATE
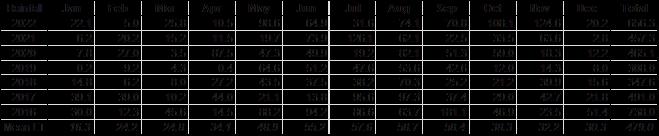
Climate and weather have a number on different influences on LRC business planning and directly impacts organisational performance. The chart below presents monthly, annual and average (long term) rainfall statistics in the region, as being an aspect of climate that has the most influence. Influences include:
1. Operations and asset management – high rainfall can disrupt operations and damage road infrastructure, although reasonable rainfall can also assist with unsealed road maintenance. It is generally accepted that infrastructure construction activities are planned for lower rainfall months. Higher rainfall is an advantage to water recycle schemes.
2. Economy – rainfall is a fundamental input to the local economy heavily dependent on agriculture, not only directly but also indirectly to the businesses and services that support agriculture.
3. Bushfire risk – high rainfall result in higher-than-normal vegetation growth, which when dry later increases bushfire risk.
Business planning assumes average rainfall and seasonal patterns, but the workforce needs to be adaptive to high seasonal variability.
Analysis
2022 was a very high rainfall year, being 37% greater than the long-term average, with 8 months having rainfall greater than the long-term average for those months. 2022 was only eclipsed by the 2016 year when annual rainfall was 54% greater than the long-term average and 9 months of above-average rainfall. However, 2016 had an extraordinary September when over 181 millimetres of rain fell in that month. 2022 had heavy late season Spring rain with 108mm in October and 125mm in November, but also had heavy early-season rain with 99mm in May. The rainfall was particularly disruptive to LRC operations and caused significant infrastructure damage resulting in additional maintenance.
In the past 7 years there have been 3 years where rainfall was significantly greater than the long-term average rainfall and 2 years approximately equal to the long-term annual average. 2019 was the driest year with only 64% of the long-term average, and 2018 was 73%.
Light Regional Council 2023/2024 Annual Business Plan, Budget & Long-Term Financial Plan 12
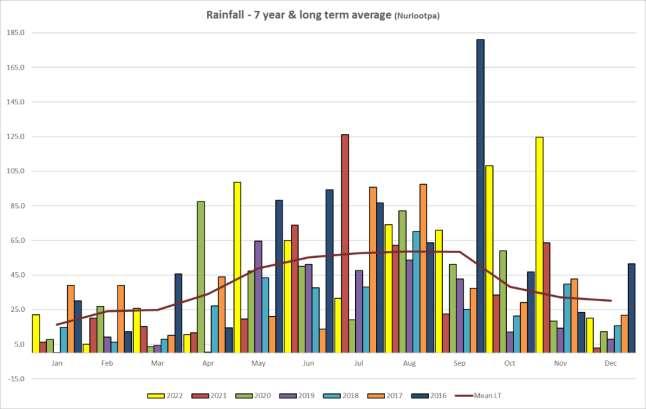
Source: BoM (Nuriootpa data)
STRATEGIC DIRECTION
Strategic Objectives
Light Regional Council’s Strategic Plan 2021-2025 recognises the strategic priorities that sustain Council’s vision over a four-year term. To achieve this, three goal areas have been identified, Community, Environment and Investment, each of which are underpinned by key objectives. In consideration of the community and business requirements within the Council area, the plan upholds the goals, objectives, and strategies of the United Nations, Commonwealth and State Governments, Regional Development Australia Barossa Gawler Light Adelaide Plains (RDA BGLAP), and neighbouring councils. A full list of Council’s Strategic Goals and Objectives can be found on our website www.light.sa.gov.au
The 2023/2024 objectives and performance indicators are reported on a quarterly basis to Council. The final achievements will be communicated in the 2023/2024 Annual Report.
Light Regional Council 2023/2024 Annual Business Plan, Budget & Long-Term Financial Plan 13
Strategic Goal 1 Community
Council supports the health and wellbeing of the community by assisting with initiatives that promote social interaction, provide access to services, and provision of services to improve quality of life of the community
SP Obj. 2023/2024 Actions
1.1
1.2
1.3
Assist the South Australian Local Government Boundary Commission (SALGBC) with its inquiry into the Town of Gawler’s ‘Stage 2’ Proposal as required
Share Regional Development Australia Barossa Gawler Light Adelaide Plains, Legatus, Small Business Commissioner and Australian Small Business and Family Enterprise Ombudsman program opportunities.
Involvement with the Public Health Advisory Group under the Regional Public Health Plan.
Leadership of assigned Regional ‘lighthouse’ project 1 - Community transport
Implementation of actions outlined in the Disability Action and Inclusion Plan.
1.4
1.5
1.6
Share and promote Barossa Regional University Campus services and programs.
Build on partnerships with organisations to provide inclusive and accessible training opportunities in the community.
Deliver ongoing improvements in technology to remain current, secure and ultimately improve service delivery.
Establish and build Business Data Analytics capability and Information Services key dashboard reports leveraging real time data and analytics
Digital displays are implemented into the Light Country Visitor Information Centre (VIC) for inclusiveness.
Performance Indicators
Responses provided within SALGBC timeframes.
Increased local business community awareness and participation in community leadership programs.
Attendance at Public Health Advisory Group meetings during 2023/2024 to contribute to regional planning.
Leadership and management to guide the delivery of actions under Regional ‘lighthouse’ project 1
Increased awareness and participation in Barossa Regional University Campus services and programs.
Implementation of SKILL workshops facilitated by Purple Orange.
Website Refresh is completed by the end of July 2024.
Council’s Word and PDF forms are migrated over to Nintex Workflow Cloud (SmartForms and Process Automation)
Monitors and video are implemented to promote the Light Region and experiences at the VIC.
1.7
Increase the promotion of library services and resources through accessible digital platforms.
Library website and media platform content is up-to-date and meets accessibility standards.
Light Regional Council 2023/2024 Annual Business Plan, Budget & Long-Term Financial Plan 14
1.8
Enhance community engagement and participation using digital platforms
Council website and media platform content is up-to-date and meets accessibility standards.
1.9
Performance measurement strategy developed to measure outcomes against service delivery targets.
Commencement of the review of Council’s Strategic Plan
Support an inclusive organisational Culture that invests in continuous improvement, learning and leadership to enhance service provision.
Advancement of a Character Preservation Overlay in partnership with The Barossa Council to assist the State Planning Commission
Implementation of Easy English components into corporate documentation and information to improve communication between Council and its diverse community.
Evaluate service standards for new community public spaces vested to Council and compare to established communities service standards.
1.10 Advocate for digital infrastructure to be included in new public design and housing developments.
1.11
Continue to develop Council’s ‘Reflect’ Reconciliation Action Plan by informing this through further engagement with traditional owners.
Continue to develop Council’s ‘Reflect’ Reconciliation Action Plan by informing this through further engagement with traditional owners.
1.12 Council support for management of key facilities and programs in the region by the community for the community
1.13 Develop and implement innovative programs with a focus on promoting digital literacy, early childhood development and social inclusion.
Engage with the community and relevant stakeholder to review and develop the 20242029 Strategic plan.
Strategic plans are reviewed and updated.
Workforce Plan actions are implemented within agreed periods
Enterprise Bargaining negotiations are conducted within legislative framework.
Liaise with the Barossa Council
Council information is available to the community in Easy English.
Awareness of service standards across Council’s communities and options to implement generational equity of service standards.
Liaise with relevant agencies and stakeholders.
Further develop the draft ‘Reflect’ RAP through engagement with traditional owners.
Community engagement on the RAP in early 2024.
Building and Structures 2023/2024 Program completed.
Supporting new community empowerment opportunities as appropriate.
Community participation in the grant funded library programs and initiatives including ‘VR for Seniors’ and ‘It Takes a Village’.
Increase in the number of participants and programs offered through the library service.
Light Regional Council 2023/2024 Annual Business Plan, Budget & Long-Term Financial Plan 15
1.14
1.15
Council’s library facilities can support the delivery of the diverse range of programs and activities being delivered.
Build effective partnerships with government and regional affiliates to assist with preparedness for emergency events.
Maintain direct engagement with regional emergency affiliates to build Council’s depth in understanding of emergency management functions and preparedness.
Continued representation and participation with regional initiatives and programs.
Maintain accessible and up to date emergency information links for community access.
Maintain Emergency Management plans and documents.
Represent Council and the community at regional emergency affiliate meetings and actively participate in defined objectives.
Provide support to government agencies as requested during emergency events.
Light Regional Council 2023/2024 Annual Business Plan, Budget & Long-Term Financial Plan 16
Strategic Goal 2 Environment
Council supports the goal of creating a place that values its natural environment and manages environmental impacts by implementing practices that preserve areas of environmental biodiversity.
2.1 Scope draft LRC operations environmental scorecard based on :
Light Country Visitor Information Centre (VIC) completes STRIVE 4 Sustainability Scorecard with ECO Tourism Australia
2.2 Be aware of opportunities to enhance council’s operations by applying affordable green technologies.
2.3 Explore placemaking opportunities, as identified in urban design frameworks adopted by Council.
2.4 Maintain Council’s emergency management framework and associated documentation
STRIVE 4 Sustainability Scorecard activated for the VIC
Identification and assessment of new opportunities as guided by the Sustainability Working Party and the Sustainability-Strategy-and-Action-Policy.pdf (light.sa.gov.au)
Options for placemaking projects aligned to community and visitor needs identified and reported to Council.
Review Council’s Emergency Management Plan annually.
Implement identified actions of the Emergency Management Plan
Light Regional Council 2023/2024 Annual Business Plan, Budget & Long-Term Financial Plan 17
SP Obj. 2023/2024 Actions Performance Indicators
Pengilly Scrub (Mudla Wirra Reserve), Molloy Rd, Wasleys
Strategic Goal 3 Investment
Council supports investment by assisting with initiatives that promote local agriculture and tourism industries, deliver quality infrastructure that is responsive to community needs, and investigates ways to strengthen the region’s economy.
SP Obj. 2023/2024 Actions Performance Indicators
3.1
3.2
Progress the Roseworthy Water Scheme in accordance with partnership agreements.
Engage with Government and Private Sector to identify pathways to implement the Drover’s Encounter.
Deliver Council’s Capital Renewal Program and the approved components of the Light Stimulus Program, seeking opportunities for private contributions where appropriate.
Continue to seek grant funding opportunities and deliver road infrastructure upgrades for tourism development that are consistent with the IAMP.
Proactively operate the Roseworthy Township Expansion Infrastructure Taskforce to: Facilitate growth that meets market demand; Maximises the opportunities to be realised from a coordinated approach to infrastructure augmentation; and Balances service levels with ongoing operating costs (after asset handover to Council).
Roseworthy Water Scheme partnership obligations and milestones met or varied via agreement.
Certain pathways for implementing the Drover’s Encounter identified with Government and Private Sector.
Secure funding support through partnerships where appropriate.
3.3
3.4
Engage with public and private stakeholders in accordance with policies and procedures to explore opportunities to deliver initiatives in support of community and economic outcomes.
Monitor, activate and share National, State and Regional Agritourism plans, opportunities and information.
Ongoing advocacy and support for suitable policy for regional agri-business success.
Light Regional Council’s approach to enabling Roseworthy Township Expansion seen by the Development Industry, SA Government and peers as ‘best practice’ among SA urban fringe growth Council’s.
3.5
3.6
Continue to seek Grant Funding opportunities
Deliver Road infrastructure upgrades that are consistent with the IAMP
Progress ‘Year Two’ actions of the Light Country Signs Business Case.
Secure funding support through partnerships where appropriate, creating outcomes that would not be achieved through conventional means.
Increased awareness and activation of Agritourism.
Advocacy for policy outcomes supporting regional agri-business success, such as through contributions to the development of the new ‘Regional Plan’ for ‘Greater Adelaide’ to be progressed by the State Government.
Minimum of 1 application for every external grant funding program applicable to Council’s infrastructure.
100% delivery of the 2023/2024 capital program
Light Country Signs Business Case Actions complete.
Light Regional Council 2023/2024 Annual Business Plan, Budget & Long-Term Financial Plan 18
3.7
Continue to monitor and introduce and implement the Light Country brand to stakeholders and in marketing activities.
Continue to collaborate and liaise with State and Regional tourism bodies and industry groups.
Communications and marketing strategies are activated that are consistent with State and Regional marketing themes and plans to build the Light Country brand and promote Light Region tourism offerings.
Continue to monitor and evolve Agritourism and Ecotourism opportunities to promote sustainable tourism product to target markets.
Event opportunities are explored and promoted relevant to target markets.
Light Country branding is visible and utilised in marketing.
Relationships with State and Regional tourism bodies and groups are maintained.
Content, communication and marketing plans and campaigns are developed that promote and encourage visitation to Light Region.
Agritourism and Ecotourism products feature in marketing activities. Increased awareness of Agritourism and Ecotourism with tourism operators.
Tourism events are promoted in marketing activities.
Light Regional Council 2023/2024 Annual Business Plan, Budget & Long-Term Financial Plan 19
SIGNIFICANT INFLUENCES & PRIORITIES
Council endorsed the following budget parameters and assumptions for the purpose of preparing the 2023/2024 ABP and Budget.
• The Recurrent Operating Budget be developed with reference to and within the framework of the adopted 2023-2033 updated LTFP; Infrastructure, Asset Management Plan; and the 4-year budget program
• Operating surplus 0-5% of revenue (sustainability rec. ratios)
• Material, Contracts and Other Expenses indexation be set at 3% in the absence of any other reliable way of estimating this expenditure group, excluding energy (fuel/electricity) and construction costs which are based on individual items.
• Wages and Salaries increase by 2%, aligned with existing Enterprise Agreements (2%) and 0.5% employee growth (note: 3% be applied in the 2024/2025 long term financial plan in line with Reserve Bank wage price index forecasts)
• Fees and charges not set by legislation be increased by 3% at a minimum
• New Capital Projects to be considered and approved within the constraints of the LTFP
• New services, increases in service levels and one-off projects to be funded through rate revenue increases or by expenditure savings
• Infrastructure Asset Management Plan (IAMP) forecasts, indexed for inflation after 2021, have been included in the long-term financial plan commencing from the 2023/2024 financial year
• Continue to participate in regionally significant projects and investigate shared resource opportunities where practicable
• Annual Business Plan objectives for 2023/2024 are aligned with the goals and objectives in Council’s Strategic Management Plan 2021-2025
• Roseworthy Water Scheme –The Bunyip 2 water scheme to, based on its forecast long term positive net present value
• Northern and Yorke Landscape Board advised the landscape levy arrangements for the 2023/2024 year, with the application of the landscape levy equalisation process, will increase by 56% due to a change in the allocation methodology of the budget between member Councils.
Light Regional Council 2023/2024 Annual Business Plan, Budget & Long-Term Financial Plan 21
ANNUAL BUDGET FOR OPERATIONAL SERVICES
Where Council’s Revenue Comes From
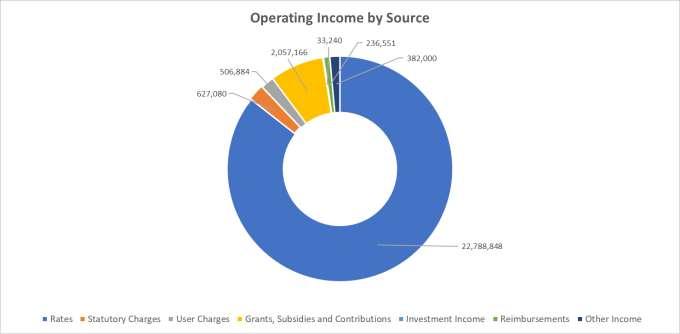
To fund Council operations and programs, Council collects revenue from sources such as general rates, fees and charges levied on services (Statutory Charges and User Charges), grants from State and Commonwealth Governments, interest income from investing excess cash in short-term investments, reimbursements, and other sundry revenue sources. The source of Council’s estimated $26.632m revenue, for the 2023/2024 Financial Year, is outlined below.
Rates
Rates are the primary source of funding for the activities undertaken by Council. A projected total of $22 788m ($22 274m in 2022/2023) will be levied in 2023/2024 Financial Year, to fund essential services (nondiscretionary) such as waste collection, management of basic infrastructure, public health and safety, as well as discretionary services such as Council’s libraries, community programs, and events. Rates revenue includes a separate rate income from the Roseworthy Water Scheme for the 2023/2024 financial year.
Statutory Charges
Statutory charges are fees and fines levied in accordance with legislation including development application fees, animal registrations, Health Act registrations, and parking fines. Council estimates that it will collect statutory charges of $0.627m in 2023/2024, an increase over 2022/2023 budgeted statutory charges of $0.572m due to Roseworthy Township Expansion
Light Regional Council 2023/2024 Annual Business Plan, Budget & Long-Term Financial Plan 22
User Charges
User charges relate to the recovery of service delivery costs through the charging of fees to users of Council’s services. These include charges for the use of Council facilities, library printing and photocopy charges, Section 7 property searches etc. Council estimates user charges income of $0.507m in 2023/2024, an expected decrease over 2022/2023 budgeted user charges of $0.515m
Grants, subsidies, and contributions
Grants, subsidies, and contributions income includes monies received from State and Commonwealth Government sources that fund the delivery of Council’s services to ratepayers. Grants income for the 2023/2024 financial year has been budgeted based on both confirmed and estimated funding levels The budget includes $0.424m of Roads to Recovery funding ($0.424m 2022/2023) and $0.500m of South Australian Local Government Grants Commission roads funding. Further grant monies are provided by way of Financial Assistance Grants totalling $0.740m in 2023/2024. Commonwealth and State Government grant contributions are expected towards the ‘Bunyip 2’ water scheme project in accordance with grant deeds
The Government of South Australia allocates funds annually to support public libraries in South Australia, complementing the funding allocation by individual councils to public libraries. Light Regional Council anticipates $0.114m of public libraries funding for the 2023/2024 financial year
Investment Income
Council earns investment income primarily in the form of interest from the investment of cash surpluses throughout the financial year. The repayment of loans given to community organisations is also reflected as investment income. Investment income for 2023/2024 is forecast at $0.033m; an increase on 2022/2023 at $0.018m
Reimbursements
During 2023/2024 Council anticipates it will seek reimbursement of $0.221m compared to $0.214m in 2022/2023 from through the provision of various services, such as private works.
Other Income
Other income relates to a range of unclassified items that do not fit within the main revenue categories. Council estimates that it will receive other income of $0.382m in 2023/2024 financial year compared to $0.780m budgeted in 2022/2023
Light Regional Council 2023/2024 Annual Business Plan, Budget & Long-Term Financial Plan 23
How Each Dollar of Revenue is Spent
A substantial amount of Council’s expenditure is spent on delivering ongoing services such as libraries, and the maintenance of roads, parks, playgrounds, reserves, cemeteries, and economic development and township planning activities. In addition to the usual expected services, specific one-off programs and projects are undertaken (Operating Projects) to meet its strategic objectives.
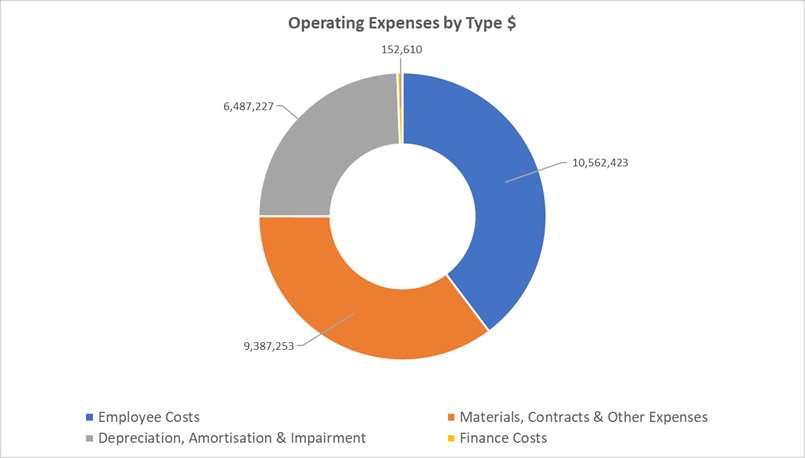
The following chart illustrates estimated 2023/2024 financial year Council expenditure of $26.59m by the main expenditure categories.
Employee Expenses
Employee expenses include all labour related expenditure such as salaries, wages, allowances and on-costs (including Annual Leave, Long Service Leave, Superannuation, Workers Compensation Insurance etc.).
For the 2023/2024 financial year, employee costs are forecast at $10.562m compared with a budgeted amount of $10 139m in 2022/2023. The increase includes:
• the provisions in the Enterprise Bargaining Agreements
• graduate progression through classification levels
• resourcing levels that enable business obligations to be met, provide necessary community services, meet legislative requirements, and deliver significant infrastructure programs
• Estimated employee costs ‘capitalised’ to infrastructure construction projects
Post-Covid, as being experienced elsewhere, the level of staff turnover has increased and the ‘vacancy-gap’ until replacements are recruited diminishes service deliver capability. Another measure, widely used in other governments, has been introduced to accurately calculate the ‘gap’, and is known as ‘paid FTE’. ‘Paid FTE’ is calculated by dividing the total amount of work hours paid (inclusive of any overtime) by the number of working hours in a year. Refer table below, which compares ‘position’ FTE with ‘paid’ FTE. ‘Position’ FTE is at a point in time (30 June), but ‘paid FTE’ is for the hours worked during the financial year. The 2023/2024 budget has been prepared based on ‘paid’ FTE acknowledging that staff turnover is expected to continue for the foreseeable future and the need to continue to deliver services with ‘less’. ‘Paid FTE’ will be monitored carefully during the year to determine whether an additional staffing strategy is necessary.
Light Regional Council Total Staff (FTEs)
Light Regional Council 2023/2024 Annual Business Plan, Budget & Long-Term Financial Plan 24
Description 30 June 2022 30 June 2023 30 June 2024 Total Staff (FTE) 96 101 101 Paid Hours FTE 97 98 98
Materials, Contracts and Other Expenses
Materials include items such as electricity, water, fuel, civil construction materials, library books, printing, and stationery costs.
Contracts relate to the provision of council services by external providers and include items such as waste collection, security, leases and infrastructure repairs and maintenance.
Other Expenses relate to a range of items including contributions to community groups, advertising, insurances, motor vehicle registrations, payment of the Landscape Levy and other miscellaneous expenditure.
It is estimated that $9.387m (exclusive of ‘Bunyip 2’ entity) will be spent on materials, contracts, and other expenses during the 2023/2024 financial year, compared to a budget of $17 668m (estimated inclusive of advances to ‘Bunyip 2’ entity) in the 2022/2023 financial year
Depreciation, Amortisation, and Impairment
Depreciation is an accounting charge that measures consumption of Council’s property, plant and equipment (including infrastructure assets such as roads and drains) over the estimated effective useful life of the assets. Another measure of infrastructure sustainability is a comparison of the long-term average infrastructure renewal expenditure with the long-term average depreciation. The long-term financial plan includes estimates of depreciation for infrastructure assets ‘handed over’ by land developers. A review of asset condition and lives is being undertaken which may have an impact on depreciation.
The forecast amount of depreciation for 2023/2024 is $6.487m compared with $6.342m for 2022/2023, an increase of $0.155m or 2 23%.
Finance Costs
Finance costs relate to interest charged by the Local Government Financing Authority on funds that have been borrowed. Interest costs have been estimated based on the current loan portfolio as of May 2023
Interest costs for 2023/2024 are forecast at $0.153m ($0 620m in 2022/23) and reflect interest rates for variable loans and Cash Advance Debenture (CAD) borrowings during the 2023/2024 financial year.
Light Regional Council 2023/2024 Annual Business Plan, Budget & Long-Term Financial Plan 25
Budgeted Statement of Comprehensive Income
The Statement of Comprehensive Income, which incorporates all operating income and expenses is provided below. A surplus operating result is forecast for the 2023/2024 financial year (surplus of $0 042m).
The ‘Bunyip 2’ (Roseworthy Water Scheme) project involves commercial information of a confidential nature and was considered by Council ‘in confidence’ under the Local Government Act, 1999 in April 2022. The details of this project will be released in due course Council has approved the Bunyip 2 water scheme to proceed subject to the receipt of State Government grants and the approval of loan funds, based on its forecast long term positive net present value.
The budgeted result for 2023/2024 varies favourably against the projected deficit of $0.719m as reflected in the 2023-2032 Long Term Financial Plan adopted by Council in June 2022
STATEMENT OFCOMPREHENSIVEINCOME
Light Regional Council 2023/2024 Annual Business Plan, Budget & Long-Term Financial Plan 26
A B C=A-B 2022 Actual 2023 Adopted Budget 2024 Proposed Budget 2024LTFP Variance fromLTFP OperatingIncome Rates 22,750,000 22,273,777 22,788,848 23,956,432 (1,167,584) StatutoryCharges 613,000 571,710 627,080 631,164 (4,084) UserCharges 236,000 514,710 506,884 639,664 (132,780) Grants,SubsidiesandContributions 2,466,000 6,698,303 2,057,166 2,564,686 (507,520) InvestmentIncome 17,000 18,440 33,240 16,530 16,710 Reimbursements 413,000 214,000 236,551 214,159 22,392 OtherIncome 520,000 780,300 382,000 308,300 73,700 TotalIncome 27,015,000 31,071,240 26,631,769 28,330,935 (1,699,166) OperatingExpenses EmployeeCosts 9,547,000 10,139,000 10,562,423 10,522,428 39,995 Materials,ContractsandOtherServices 9,031,000 17,667,161 9,387,253 11,712,645 (2,325,392) Depreciation,Amortisation&Impairment 6,329,000 6,341,744 6,487,227 6,500,288 (13,061) FinanceCosts 698,000 620,061 152,610 314,785 (162,175) Netloss-EquityAccountedCouncilBusinesses 26,000 TotalExpenses 25,631,000 34,767,966 26,589,513 29,050,146 (2,460,633) OperatingSurplus/(Deficit) 1,384,000 (3,696,726) 42,256 (719,211) 761,467 AssetDisposal&FairValueAdjustments (1,342,000) -AmountsReceivedSpecificallyforNeworUpgradedAssets 6,711,000 6,000,408 2,360,000 - 2,360,000 PhysicalResourcesReceivedFreeofCharge 2,359,000 -NetSurplus/(Deficit) 9,112,000 2,303,682 2,402,256 (719,211) 3,121,467 OtherComprehensiveIncome ChangesinAssetRevaluationSurplus (1,005,000) EquityAccountedCouncilBusinesses 43,000 Impairment(Expense)/RecoupmentsOffsettoAssetReval. (1,205,000) TotalOtherComprehensiveIncome (2,167,000) - - -TotalComprehensiveIncome 6,945,000 2,303,682 2,402,256 (719,211) 3,121,467 Excludes Bunyip 2waterscheme- referLTFP
Measured against the projections for 2023/2024, adopted by Council in the 2023-2032 LTFP, the key variances making up the net result of $0 042m include:
Revenue
• Expected allocation of financial assistance grant received over two financial years realising a reduction of $0.507m
• ‘Bunyip 2’ separate rate applies for six (6) months only (originally budgeted for twelve months due to timing of the project commencement $0 450m
• Rate rebate provision for properties with an increased valuation greater than 10%
• Reduced user charge due to reduction of some commercial activities $0.133m
Expenditure
• Expected outlays for ‘Bunyip 2’ revised due to timing of the project commencement of $2 665m
• Depreciation slightly less than forecast, $0.013m
Light Regional Council 2023/2024 Annual Business Plan, Budget & Long-Term Financial Plan 27
FOUR YEAR BUDGET
In addition to the LTFP, the 2023/2024 ABP details key projects, new initiatives, capital and operational works programs for the first four years of the LTFP, referred to as the Four-Year Budget (4YB).
The purpose of including the 4YB in addition to the LTFP and detailed financial and non-financial information for the 2023/2024 financial year is to:
• Communicate the medium-term strategies and outcomes for the next four (4) years
• Implement a systematic approach towards organisational planning and reviewing, prioritising, and monitoring strategies, projects and initiatives
• Support Council’s budget deliberations by providing additional decision-making assistance
• Facilitate alignment to Council’s suite of corporate documents, the Strategic Plan 2021-2025, LTFP 20232032 and IAMP.
In the 4YB Income Statement, Council forecasts a surplus operating position for 2023/2024 and for the duration of the 4 years The first year of the 4YB includes several new initiatives and projects as outlined in the 4-Year Operating Projects Budget. Year 2 of the 4YB takes up the full year cost of new 2023/2024 initiatives and any incomplete 2022/2023 initiatives The operating results forecast for year 4 of the 4YB are the result of a gradual increase in rates revenue over a considerable period and the reduction of finance costs associated with debt reduction from the finalisation of the ‘Bunyip 1’ water scheme The forecast below excludes the ‘Bunyip 2’ water scheme, which is presented as a separate budget, but included further improves the operating surplus.
Light Regional Council INCOMESTATEMENT-GENERALFUND
Scenario:Draft (excludingBunyip2 water scheme)
(Expense)/RecoupmentsOffsettoAssetReval. (1,205,000) TotalOtherComprehensiveIncome (2,167,000)
*2022/23RevisedBudgetMay2023
Light Regional Council 2023/2024 Annual Business Plan, Budget & Long-Term Financial Plan 28
Actuals CurrentYear YEAR1 YEAR2 YEAR3 YEAR4
2021/2022 2022/2023* 2023/2024 2024/2025 2025/2026 2025/2027 $ $ $ $ $ $ Income Rates 22,750,000 22,414,000 22,788,848 24,512,531 25,217,355 25,931,075 StatutoryCharges 613,000 572,000 627,080 641,828 652,704 712,798 UserCharges 236,000 629,000 506,884 644,746 649,957 655,298 Grants,SubsidiesandContributions 2,466,000 2,298,000 2,057,166 2,007,463 2,054,074 2,219,851 InvestmentIncome 17,000 40,000 33,240 14,550 12,800 10,970 Reimbursements 413,000 1,229,000 236,551 218,354 218,520 218,688 OtherIncome 520,000 780,000 382,000 308,300 309,300 309,300 TotalIncome 27,015,000 27,962,000 26,631,769 28,347,772 29,114,710 30,057,981 Expenses EmployeeCosts 9,547,000 10,139,000 10,562,423 10,859,273 11,207,064 11,566,159 Materials,ContractsandOtherServices 9,031,000 10,125,000 9,387,253 10,286,277 10,000,384 11,148,143 Depreciation,Amortisation&Impairment 6,329,000 6,342,000 6,487,227 6,662,795 6,829,365 7,000,099 FinanceCosts 698,000 440,000 152,610 499,600 301,000 164,000 Netloss-EquityAccountedCouncilBusinesses 26,000TotalExpenses 25,631,000 27,046,000 26,589,513 28,307,944 28,337,813 29,878,400 OperatingSurplus/(Deficit) 1,384,000 916,000 42,256 39,827 776,897 179,580 AssetDisposal&FairValueAdjustments (1,342,000) - - 1,980,000 720,000 2,500,000 AmountsReceivedSpecificallyforNeworUpgradedAssets 6,711,000 2,707,000 2,360,000 2,440,000 3,700,000 1,196,000 PhysicalResourcesReceivedFreeofCharge(estimate) 2,359,000 - - - -NetSurplus/(Deficit) 9,112,000 3,623,000 2,402,256 4,459,827 5,196,897 3,875,580 Other
Changes
EquityAccounted
43,000
- - - -TotalComprehensiveIncome 6,945,000 3,623,000 2,402,256 4,459,827 5,196,897 3,875,580
ComprehensiveIncome
inAssetRevaluationSurplus (1,005,000)
CouncilBusinesses
Impairment
Operating Project Program
The Four-Year Income Statement shown above incorporates various existing and new initiatives. Refer to the table below for a description of the operating initiatives and page 30 for the capital initiatives
Business Cases - Capital and Operating Expenditure
Operating
Sustainability Strategy
Budget allocated to the Sustainability Strategy would follow LRC’s Environmental Sustainability Strategy and Action Plan. Actions that are undertaken include curbside waste investigations, audit of Councils operational greenhouse gas emissions, increase of renewable energy generation and to prepare and commence delivery of a sustainability communication and engagement plan. The funding is only an initial ‘seed’ amount and the investigations to be undertaken during 2023/2024 will enable robust future estimates to be included in the next budget.
Light Regional Council 2023/2024 Annual Business Plan, Budget & Long-Term Financial Plan 29
Business case/concept projects 2022/2023 RB Year 1 2023/2024 Year 2 2024/2025 Year 3 2025/2026 Year 4 2026/2027 Capital $ $ $ $ Greenock Institute landscaping 20,000 Freeling Goods shed reserve seating 30,000 Electric vehicle - trial 61,000 Security Cameras Public Space 35,000 45,000 20,000 20,000 Greenock park cricket nets - 80,000 Hewett Centre rainwater diversion 30,000 170,000 Light country signs 143,900 140,400 Enterprise System Upgrade 734,000 50,000 Angle Vale bridge 110,000 490,000 Ward Projects 150,000 Total 'Capital' business cases/concepts 1,313,900 975,400 20,000 20,000Operating Pines Conservation Reserve signs 6,000 WHS resourcing 52,000 Sustainability strategy 20,000 22,000 64,000 66,000 68,000 Reconciliation strategy - 1,000 27,000 28,000 Strategic Plan 25,000 10,000 Review of Character Preservation - 20,000 20,000 Regional Public Health Plan Coordinator Contribution 13,250 26,250 27,050 27,850 Ward Projects * 100,000 392,000 COVID Response 'provisions' 50,000 Total 'Operating' business cases/concepts 228,000 453,250 147,250 141,050 95,850 Total Business Cases 1,541,900 1,428,650 167,250 161,050 95,850 Capital 'Works' Projects Site Stormwater Management Hill St. Precinct 37,000 123,000 Freeling Childcare Carpark 130,000 Light Stimulus Program * 1,860,408 - 2,027,000 2,027,000 2,027,000 Capital Asset Renewal Program 3,876,372 4,488,000 5,720,000 6,713,000 6,161,000 Capital Asset Upgrade Program 50,000 1,429,000 2,134,000 3,372,000 2,063,000 Capital Asset Upgrade Program - CWMS 3,047,000 1,016,000 Capital Asset Renewal Program - CWMS 455,000 486,000 500,000 512,000 525,000 Vehicle/Plant Replacement & Renewal Program 690,300 497,000 880,000 854,000 875,000 Total Capital Project Costs 10,016,080 8,169,000 11,261,000 13,478,000 11,651,000 * Projects to be determined
Reconciliation Strategy
The council would undertake various actions outlined by its first Reconciliation Action Plan. This includes partnering with Kaurna and Ngadjuri peoples to incorporate Indigenous biocultural and water knowledge into Council’s biodiversity management planning and supporting NAIDOC initiatives.
Strategic Plan
The council must undertake a comprehensive review of its strategic plan within 2 years after each general election of the Council (Local Government Act, 1999 - section 122 (4)). The council will review its strategic direction ‘from the ground up’ and develop its plan with external assistance to facilitate engagement, research and development of the strategic plan and contribute broader inputs to this process.
Review of Character Preservation
In January 2022, the Wine Arts Food Tourism Local Government Cluster Group (WAFTL) initiated a project called the Strategic Planning Review of the Barossa Character Area, working with Barossa Australia and The Barossa Council. Council’s contribution helps to fund the resources to work towards a Code Amendment and potentially establishing a Design Panel under the Local Design Review Scheme.
Regional Public Health Plan Coordinator Contribution
The Adelaide Plains, Barossa, Light Regional and Gawler councils have collaborated to develop the region’s second regional public health plan, pursuant to Section 51of the South Australian Public Health Act 2011 (the Act). The Barossa, Light and Lower Northern Region Regional Public Health Plan 2022-2027 (the Plan) was adopted by the health minister in August 2022. A Plan Coordinator has been employed to project manage the development, review and reporting for the Plan.
Road maintenance
In accordance with the final budget approval an additional $150,000 will also be reallocated to the road maintenance budget. The reallocation will be made at the first available budget review by Council.
Light Regional Council 2023/2024 Annual Business Plan, Budget & Long-Term Financial Plan 30
Capital Projects Program
Light Regional Council is responsible for a large portfolio of assets with depreciation expense of $6 487m projected for the 2023/2024 financial year. It is therefore critical for the long-term sustainability of assets that Council engages in practises that optimise assets useful lives for the benefit of the community.
The Four-Year Capital Project Budget is comprised of eight existing and new initiatives brought forward through business cases, plus, Council’s Infrastructure and Asset Management Plan (IAMP) program is projected to cost $45.573 m over four years.
In the 2023/2024 Financial Year, spending of $9.145m ($10.989m in 22/23) is proposed on its capital program of which $4.488m will be spent on asset renewal. As highlighted in the table below, this includes $1.016m and $0.486m related to CWMS upgrade and renewal.
Summary of Four-Year Capital Project Program
Significant ongoing projects adopted in previous years’ budgets:
Security Cameras Public Spaces (six-year program)
To provide cameras at key sites within the region such as the Freeling Skate Park, Goods Shed Reserve / ANZAC Park Freeling, Lions Playground, Hewett Recreation Precinct, Kapunda Main Street, and Roseworthy Recreation Park. Security measures will provide renewed open spaces to enable opportunities for communities to connect and build relationships. The presence of cameras is hoped to deter vandalism and undesirable behaviour and provide the impression of a safer place to visit.
Hewett Centre Rainwater Tanks
The scope of this project will involve removing rusting and faulty rainwater tanks currently at the Hewett Centre and diverting rainwater to a catchment pond flowing into the North Para River. Decking, pathing and other landscaping will be constructed to improve the visual appearance of the Hewett Centre and overall usability as a function area, building on its success as a venue.
Light Country Signs
Gateway, town, and tourism signage to be upgraded and updated with Light Country and Light Regional Council brands. This is appropriate for identification, brand consistency and presentation across the region. Current signs have reached the end of their useful life and are due for replacement, therefore upgrading and replacing them to represent the Light Country brand is of benefit to Council and its plans to deliver proposed development actions to the region.
Light Regional Council 2023/2024 Annual Business Plan, Budget & Long-Term Financial Plan 31
ProjectName Total4yrBudget 2024-2027 Year1 2023/2024 Year2 2024/2025 Year3 2025/2026 Year4 2026/2027 $ $ $ $ $ SecurityCamerasPublicSpaces(6YearProgram) 85,000 45,000 20,000 20,000 TotalCostsBusinessCases2018/2019to2025/2026 85,000 45,000 20,000 20,000CapitalAssetRenewalProgram 23,082,000 4,488,000 5,720,000 6,713,000 6,161,000 CapitalAssetUpgradeProgram 8,998,000 1,429,000 2,134,000 3,372,000 2,063,000 CapitalAssetUpgradeProgram-CWMS 1,016,000 1,016,000 CapitalAssetRenewalProgram-CWMS 2,023,000 486,000 500,000 512,000 525,000 Vehicle/Plant/EquipmentReplacementandRenewal Program 3,106,000 497,000 880,000 854,000 875,000 TotalCostsIAMP2024-2027 38,225,000 7,916,000 9,234,000 11,451,000 9,624,000 AngleValebridge 490,000 490,000 EnterpriseSystemUpgrade 50,000 50,000 Greenockparkcricketnets 80,000 80,000 HewettCentrerainwaterdiversion 170,000 170,000 Lightcountrysigns 140,400 140,400 SiteStormwaterManagementHillSt.Precinct 123,000 123,000 FreelingChildcareCarpark 130,000 130,000 LightStimulusProgram* 6,081,000 - 2,027,000 2,027,000 2,027,000 TotalCostsBusinessCases2023/2024 7,264,400 1,183,400 2,027,000 2,027,000 2,027,000 TotalCapitalProjectCosts2023/2024 45,574,400 9,144,400 11,281,000 13,498,000 11,651,000 * Specific projects to be determined
Angle Vale Bridge
The plan was developed on the basis that Light Regional Council would contribute $490,000 to a restoration project. The bridge then had been deemed to be unsafe due to the faults of key structural components and was closed to all public access. As the bridged recently collapsed the funding in this business plan proposed for restoration works in conjunction with the City of Playford will be reviewed once an assessment is completed of the area and it is known what bridge elements can be recovered. Refer Council’s website for further information.
Greenock Park Cricket Nets
Greenock Cricket Club have sought partnership with Council to renew and relocate the unsafe and unserviceable cricket nets from their present site. The scope of this project includes improving the overall landscape of the park, through new vegetation, irrigation, picnic settings and benches, and improving the health of a 100-year-old red gum which is the last surviving tree from the original site.
Business Enterprise System
The current business enterprise system was implemented in 2022. Further enhancement and refinement of the introduced programs is required to better achieve a more usable and integrated system. A suitable system solution is being procured that delivers both an enhanced customer experience and administrative efficiencies.
Site Stormwater Management – Hill Street Precinct
Site Stormwater Management will be undertaken in the Hill Street Precinct, Kapunda. These works are a continuation of the stormwater investigative works that have been taking place for four adjacent buildings owned by Council. As a result, additional works have been identified for these major buildings. The works require the use of specialized trades and equipment due to the age and heritage status of the buildings as well as the height, and terrain and uneven surface of the work area. Hire of equipment such as scaffolding is to be aligned between the sites for efficiencies with trades necessary to complete the tasks required.
Light Stimulus Program
A strategic program of works, under the State Government Local Government Infrastructure Partnership Program, which contributes to future economic growth of the region through infrastructure upgrades – e.g., Rural Road Seal Program.
Freeling Childcare Carpark
Upgrade to Freeling Childcare Centre carpark for shared use by neighbouring facilities
Refer to Appendix C for details of Council’s Capital Asset Renewal Program.
Light Regional Council 2023/2024 Annual Business Plan, Budget & Long-Term Financial Plan 32
LOANS
New Long-term loans
No new loans are proposed in 2023/2024, or for the life of the long-term financial plan.
During the 2022/2023 financial year Council obtained Cash Advance Debentures (CADs) totalling $12.5M for two (2) major projects These projects, the ‘Bunyip 2’ Roseworthy Water Scheme and strategic land purchases, are subject to commercial arrangements and have been considered by Council ‘in confidence’ under the Local Government Act, 1999, with the details to be released in due course.
To support cashflow variability during the quarterly rate receipt cycle the cash advance debenture loans that have been previously approved will be utilised. The actual timing and the amount will be managed based on cash available from day-to-day by operations in line with Council’s Treasury Management Policy.
Existing loans
The forecast balance of the unpaid loan principal at 1 July 2023 is $2.4 million which include loans that support assets owned by community organisations on Council land and are repayable to Council by those organisations. These loans will be fully expired by 2029.
Loans specifically relating to the GWRS (‘Bunyip 1’ water scheme) totalling $11.3m were ‘paid out’ during 2022/23 and the other proceeds will be partially used to repay other loans Council has reviewed its CADs during the 2023/2024 budget ‘process’ and decided to retain current CADs until the ‘Light Stimulus’ project review is completed.
Borrowing strategy
The borrowing strategy explains that there are four (4) reasons for Council borrowing from the Local Government Finance Authority (LGFA):
1. Credit foncier (principal and interest) debentures made available to and repaid by community organisations (mainly sporting and recreational facilities) for the improvement of their assets.
2. Cash advance debentures for the purpose of cash flow management, mainly to take advantage of the benefits of operational ‘during-year’ surplus cash flow to minimise interest costs.
3. Cash advance debentures for projects where is it expected that there will be a repayment of the loan during or after the successful completion of the project. This approach is being used for the Bunyip 2 ‘water scheme’.
4. Credit foncier (principal and interest) debentures for infrastructure intergenerational assets to enable the cost of the asset to be (as best possible subject to the maximum loan length available) spread over the life of the asset meaning the ratepayer beneficiaries of the asset share in it cost. The policy requires that “the council should, in making any decision, take into account the financial effects of the decision on future generations”. This principle includes that the Council should consider intergenerational fairness including that there should not be volatile shifts in rating levels as a consequence of expenditure on infrastructure assets.
Light Regional Council 2023/2024 Annual Business Plan, Budget & Long-Term Financial Plan 33
Contributions (developerBunyip 2) (341) (374)
Borrowing - CAD
Borrowing - CADuse (StrategicLand)
Borrowing - CADuse 'other'
outlays/funds
*Bunyip 2is not LRC capex (advances/loan to Bunyip Water), but treated as such forfunding purposes
**Includes strategicland sales
***subject to Light Stimulus project review
****Light Stimulus CADin 23/24to 26/27
*****CWMS - Freeling Wastewater- spend 3,049 1,016
*****CWMS - Freeling Wastewater- grant 1,387 462
Light Regional Council 2023/2024 Annual Business Plan, Budget & Long-Term Financial Plan 34 Capital expenditure
2022/23 2023/24 2024/25 2025/26 2026/27 2027/28 2028/29 2029/30 2030/31 2031/32 $000 $000 $000 $000 $000 $000 $000 $000 $000 $000 Outlays 88,160 130,500 New/upgraded assets (incl. WIP) 3,141 1,429 2,134 3,372 2,063 2,025 1,341 1,341 1,958 1,958 Renewal/replacement assets (Incl. WIP) 10,870 4,974 6,220 7,225 6,686 5,550 6,522 8,484 6,523 6,523 Light Stimulus 1,860 - 2,647 2,647 2,647 - - - -CWMS - upgrade &renewal ***** 3,504 1,502 500 512 525 538 551 565 579 593 Appropriation to reserve (transfer) - CWMS 41 27 (8) (22) (37) (54) (71) (90) (108) (128) StrategicLand - 4,500 - - - - - - -Bunyip 1waterscheme - - - - - - - - -Bunyip 2waterscheme * 1,434 11,290 691 - - - - - -CADs repaid*** 22,000 4,736 466 342 700 1,242 1,668 2,326 95 294 Total outlays: 42,850 28,458 12,650 14,076 12,584 9,301 10,011 12,626 9,047 9,240
Grants
specificpurpose forassets (2,706) (3,488) (2,440) (3,700) (1,196) (1,226) (1,257) (1,288) (1,320) (1,320) Grant - CWMS (1,387) (462) - - - - - - - -
- - - - - - - -
- - - - - - -Sales
assets
- - (1,980) (720) (2,500) - (500) (800) - -
- - - - - - - -
(22,000) - - - - - - - - -
rates (300) (450) (900) (900) (900) (900) (900) (11,000) -Internally generated funds - depreciation (6,342) (6,500) (6,663) (6,829) (7,000) (7,175) (7,354) (7,538) (7,727) (7,920)
(793) (6,566) (691) - - - - 8,000 - -
budget& funding
Funded by:
-
Grants - Bunyip 2 (300) (4,400)
of
**
Reserve funds - CWMS (1,662) (554)
Bunyip 1waterscheme
Bunyip 2waterscheme *-
use (Bunyip 2)
(4,500) 1,980 720 1,800 - - - - -
(7,019) (1,164) (1,956) (2,647) (2,788) Total funds: (42,850) (28,458) (12,650) (14,076) (12,584) (9,301) (10,011) (12,626) (9,047) (9,240) Net
- - - - - - - - - -
****
- - - - - - - - -Netchange in CADbalances used 14,188 (7,494) (201) (1,585) (288) 1,242 1,668 10,326 95 294
Accumulated netoutlays/(funds)
LONG TERM FINANCIAL PLAN
2023-2033
Background
Section 122 (1a) of the Local Government Act requires councils to develop and adopt:
(a) a Long-Term Financial Plan (LTFP) for a period of at least 10 years; and (b) an Infrastructure and Asset Management Plan (IAMP), relating to the management and development of infrastructure and major assets by the council for a period of at least 10 years (and these plans will also be taken to form part of the council’s strategic management plans).
Section 122(4)(a)(i) of the Act requires that the LTFP should be reviewed as soon as practical after the adoption of the ABP. However, Section 122(4)(b) of the Act specifies that the council must undertake a comprehensive review of its Long-Term Financial Plans within 2 years after each general election of the council
The purpose of a Council’s LTFP is to express, in financial terms, the activities that it proposes to undertake over the medium to longer term to achieve its stated objectives. It is like, but usually less detailed than, the annual budget. Just like the budget, it is a guide for future action although its preparation requires Council to think about not just one year but the longer-term impact of revenue and expenditure proposals. The aggregation of future strategic plans, business initiatives and their intended outlays and anticipated revenues, enables the accumulating overall financial and economic implications to be readily identified and, if warranted, future activities to be revised. The LTFP should specify and take account of:
• Expected expenses and capital outlays for each year of the plan
• Expected revenues for each year and their source
• Any variations in net debt required because of expected cash flow needs
• Performance measures to enable assessment of Council’s financial sustainability over the period of the plan.
Long Term Financial Objective of the Light Regional Council
The Long-Term Financial Objective of Light Regional Council is to be “a Council that delivers on its strategic objectives by managing its financial resources in a sustainable and equitable manner by incremental growth and service cost containment to reduce the operating deficit over time; as opposed to burdening the ratepayers of the Council with short-term excessive increases to their annual Council rate bill”.
Financial sustainability means having a financial position capable of meeting long-term service and infrastructure levels and standards, acceptable to the community, without substantial increases in rates or cuts to services. The Long-Term Financial Plan has been developed based on the following budget principles:
Principle 1: Breakeven Budget
Annual cost of Council’s services and programs, including depreciation of assets, are fully funded by the current ratepayers, who are the consumers of those services, programs and assets.
Principle 2: Rate Stability
Annual rate collections are fair and equitable for the ratepayers with the aim to keep rate revenue increases stable over the medium term.
Principle 3: Infrastructure and Asset Management
Maintain Infrastructure and Assets in line with the Council’s Infrastructure Asset Management Plans.
Light Regional Council 2023/2024 Annual Business Plan, Budget & Long-Term Financial Plan 35
Principle 4: Prudent Debt Management
Prudent use of debt to invest in new, long-term assets to ensure intergenerational equity between current and future users.
Assumptions used in the preparation of Long-Term Financial Plan 2023/2024 to 2032/2033
The LTFP provides the financial projections and budget framework to guide the development of the detailed annual budget and provide a level of assurance to elected members and the community on the sustainability of Council operations. A 10-year LTFP summarises the financial impacts of Council’s strategic directions and provides an indication of the sustainability of those plans. By evaluating financial strategies over a planning horizon of 10 years Council can determine how decisions made now and for the 2023/2024 budget will impact on the future and ensure the impact of rates is spread equitably across generations of ratepayers, so that planned service standards over the long term and infrastructure levels can be met without unplanned increases in rates or cuts to services. The LTFP is prospective information. Actual results are likely to vary from the information presented. Consequently, the information presented is prepared based on best estimate assumptions as to future events that Council expects are likely to take place. These estimates arise from information known as of 24 April 2023 (at week 43).
Assumptions used in preparation of the 2023/2024 Budget & 10-year LTFP
Description
General Rates
CWMS Charge
Refuse Collection Charges
Landscape Levy (formally NRM Levy)
Minimum Rates
Statutory Charges
User Charges
Grants, Subsidies & Contributions
Investment Income
Reimbursements
Other Income
Employee Costs
Materials, Contracts & Other Expenses
Depreciation, Amortisation & Impairment
Finance Costs
Assumptions
2023/2024 total rates revenue increases are estimated at 3.0% achieved by an average rate in-the-dollar decrease of 2.8%, a minimum rate at $925 (from $900 in 2022/2023), average assessment valuation increase of existing rateable assessments and growth provided by new assessments, and an estimate for successful rebate applications for general rates payable increases of >10%
$600 per CWMS unit from 2022/2023 at $580
3% per annum (p.a.) average over the LTFP (and assume ratio of 3-bin and 2bin ‘service’ level remains the same) Hard waste service availability increased by 20% in 2022/2023
4% p.a. average over the LTFP
2.8% p.a. in 2023/2024 to $925, and 2% over the LTFP (from year two).
3% p.a. average over the LTFP (where set by Council)
3% p.a. average over the LTFP
Based on confirmed grant funding for 2023/2024 and conservatively estimated over the LTFP
Nominal average over the LTFP based on minimal invested funds. Surplus cash used to minimise cash advance debenture balances.
2% p.a. average over the LTFP
2% p.a. average over the LTFP
2% p.a. average over the first year and 3% p.a average over the remaining nine years
3% p.a. average over the LTFP. Reserve Bank suggesting 3 to 3.5% in 2023/2024
As per LTFP model based on capital expenditure and useful lives by asset category.
Actual interest payable on existing loans and the estimated cost of cash advance debenture utilisation
Light Regional Council 2023/2024 Annual Business Plan, Budget & Long-Term Financial Plan 36
Long Term Financial Statements
Council forecasts surplus operating budgets for the financial year 2023/2024 through to 2032/2033 However, this is not taking into consideration the net expenditure of Bunyip2 which is identified separately The grants and advances related to Bunyip 2 have a net impact on the operating result of $310,000 (surplus) in 2023/2024. Refer page 45.
Current financial modelling indicates that over the 10-year LTFP the operating results of Light Regional Council continue to be sustainable. Over time the additional projects noted above will impact the LTFP, however a sustainable financial outcome remains.
Council’s Long Term Financial Plan financial statements and financial ratio information are included on the following pages
Light Regional Council 2023/2024 Annual Business Plan, Budget & Long-Term Financial Plan 37
LightRegionalCouncil
10YearFinancialPlanforthe Yearsending30June 2033 STATEMENT OFCOMPREHENSIVEINCOME-GENERALFUND
Scenario:Base PlanexcludingBunyip2waterscheme
2022/23RB 2023/24 2024/25 2025/26 2026/27 2027/28 2028/29 2029/30 2030/31 2031/32 2032/2033 $ $ $ $ $ $ $ $ $ $ $ Income Rates 22,414,000 22,788,848 24,512,531 25,217,355 25,931,075 26,829,860 27,730,888 28,641,336 29,561,384 30,408,315 31,168,523 Statutory Charges 572,000 627,080 641,828 652,704 712,798 724,114 735,656 747,430 759,438 775,687 795,079 UserCharges 629,000 506,884 644,746 649,957 655,298 661,070 666,690 672,453 678,363 681,288 698,320 Grants, Subsidies and Contributions 2,298,000 2,057,166 2,007,463 2,054,074 2,219,851 2,268,822 2,319,018 2,370,468 2,423,205 2,477,260 2,539,192 Investment Income 40,000 33,240 14,550 12,800 10,970 9,070 7,100 5,060 2,950 760 779 Reimbursements 1,229,000 236,551 218,354 218,520 218,688 218,860 219,036 219,215 219,398 219,584 225,074 OtherIncome 780,000 382,000 308,300 309,300 309,300 309,300 309,300 309,300 309,300 309,300 317,033 Net gain - equity accounted Council businesses - - - - - - - - - -Total Income 27,962,000 26,631,769 28,347,772 29,114,710 30,057,981 31,021,097 31,987,689 32,965,262 33,954,038 34,872,194 35,743,999 Expenses Employee Costs 10,139,000 10,562,423 10,859,273 11,207,064 11,566,159 11,936,921 12,319,732 12,715,058 13,123,157 13,544,325 13,882,933 Materials, Contracts &OtherExpenses 10,125,000 9,387,253 10,286,277 10,000,384 11,148,143 10,878,697 11,356,190 12,529,769 12,930,588 12,843,804 13,164,899 Depreciation, Amortisation &Impairment 6,342,000 6,487,227 6,662,795 6,829,365 7,000,099 7,175,101 7,354,479 7,538,341 7,726,799 7,919,969 8,117,968 Finance Costs 440,000 152,610 499,600 301,000 164,000 74,000 118,000 143,000 143,000 143,000 143,000 Net loss - Equity Accounted Council Businesses - - - - - - - - -Total Expenses 27,046,000 26,589,513 28,307,944 28,337,813 29,878,400 30,064,719 31,148,401 32,926,168 33,923,544 34,451,097 35,308,800 OperatingSurplus/(Deficit) 916,000 42,256 39,827 776,897 179,580 956,378 839,288 39,094 30,494 421,096 435,199 Asset Disposal &FairValue Adjustments - - 1,980,000 720,000 2,500,000 - 500,000 800,000 - -Amounts Received Specifically forNew orUpgraded Assets 2,707,000 2,360,000 2,440,000 3,700,000 1,196,000 1,225,900 1,256,548 1,287,961 1,320,160 1,320,160 1,320,160 Physical Resources Received Free of Charge - - - - - - - - - -NetSurplus/(Deficit) 3,623,000 2,402,256 4,459,827 5,196,897 3,875,580 2,182,278 2,595,836 2,127,055 1,350,655 1,741,257 1,755,359 Projected Years
LightRegionalCouncil
10Year FinancialPlanfor the Yearsending30June 2033 STATEMENT OFFINANCIALPOSITION -GENERALFUND
Scenario:Base PlanexcludingBunyip2water
scheme 2022/23RB 2023/24 2024/25 2025/26 2026/27 2027/28 2028/29 2029/30 2030/31 2031/32 2032/33 $ $ $ $ $ $ $ $ $ $ $ ASSETS Current Assets Cash & Cash Equivalents - - - - - - - - - -Trade & Other Receivables 2,536,000 2,331,184 2,331,184 2,344,123 2,447,496 2,433,751 2,507,840 2,590,928 2,680,910 2,758,307 2,815,651 Inventories 25,000 16,588 16,588 15,068 14,241 16,251 15,476 16,332 18,312 17,746 18,190 Total Current Assets 2,561,000 2,347,772 2,347,772 2,359,191 2,461,737 2,450,002 2,523,316 2,607,260 2,699,222 2,776,053 2,833,841 Non-Current Assets Financial Assets 525,000 467,995 467,995 417,542 365,326 311,281 255,341 197,435 137,491 75,433 29,659 Equity Accounted Investments in Council Businesses 2,224,000 2,224,000 2,224,000 2,224,000 2,224,000 2,224,000 2,224,000 2,224,000 2,224,000 2,224,000 2,224,000 Infrastructure, Property, Plant & Equipment 241,608,000 240,633,106 240,633,106 242,244,077 244,547,949 247,125,337 248,838,532 250,160,217 253,938,933 257,447,459 260,828,375 Intangible Assets - - - - - - - - - -Other Non-Current Assets 1,231,000 1,243,502 1,243,502 1,255,937 1,268,496 1,281,181 1,293,993 1,306,933 1,320,002 1,333,202 1,346,534 Total Non-Current Assets 245,588,000 244,568,603 244,568,603 246,141,556 248,405,771 250,941,799 252,611,866 253,888,585 257,620,426 261,080,094 264,428,568 TOTAL ASSETS 248,149,000 246,916,375 246,916,375 248,500,747 250,867,508 253,391,801 255,135,182 256,495,845 260,319,648 263,856,147 267,262,409
Liabilities Trade & Other Payables 5,214,000 4,021,807 4,021,807 3,835,686 3,761,245 4,118,372 4,060,520 4,250,885 4,612,623 4,588,972 4,716,032 Borrowings 527,000 200,996 200,996 222,829 221,883 235,680 235,607 221,910 252,167 228,350 141,830 Provisions 2,382,000 2,441,000 2,502,000 2,565,000 2,629,000 2,695,000 2,762,000 2,831,000 2,902,000 2,975,000 3,049,000 Total Current Liabilities 8,123,000 6,663,803 6,724,803 6,623,515 6,612,128 7,049,052 7,058,127 7,303,795 7,766,790 7,792,322 7,906,862 Non-Current
Cash Advance Debenture 7,838,000 7,450,040 9,437,213 4,666,213 260,408 1,499,939 1,239,341 181,683 1,979,451 4,040,143 5,854,258 Borrowings 2,065,000 2,209,680 2,117,415 1,966,746 1,744,863 1,549,757 1,510,089 1,305,111 1,165,678 937,328 795,497 Provisions 273,000 280,000 287,000 294,000 301,000 309,000 317,000 325,000 333,000 341,000 350,000 Other Non-Current Liabilities - - - - - - - - - -Total Non-Current Liabilities 10,176,000 9,939,720 11,841,628 6,926,959 2,306,271 3,358,696 3,066,430 1,811,794 3,478,129 5,318,471 6,999,755 TOTAL LIABILITIES 18,299,000 16,603,523 18,566,431 13,550,474 8,918,399 10,407,748 10,124,557 9,115,589 11,244,919 13,110,793 14,906,617 NetAssets 229,850,000 230,312,852 228,349,944 234,950,273 241,949,109 242,984,053 245,010,625 247,380,256 249,074,729 250,745,354 252,355,792 EQUITY Accumulated Surplus 54,491,000 54,926,852 52,971,944 53,700,841 53,846,422 54,782,801 55,618,089 55,670,183 55,729,678 56,197,775 56,604,974 Asset Revaluation Reserves 173,730,000 173,730,000 173,730,000 179,623,432 186,513,687 186,666,252 187,928,536 190,336,073 192,079,051 193,409,579 194,667,818 Other Reserves 1,629,000 1,656,000 1,648,000 1,626,000 1,589,000 1,535,000 1,464,000 1,374,000 1,266,000 1,138,000 1,083,000 TotalEquity 229,850,000 230,312,852 228,349,944 234,950,273 241,949,109 242,984,053 245,010,625 247,380,256 249,074,729 250,745,354 252,355,792
LIABILITIES Current
Liabilities
LightRegionalCouncil
10YearFinancialPlanforthe Yearsending30June 2033
STATEMENT OFCASHFLOWS-GENERALFUND
Scenario:Base PlanexcludingBunyip2waterscheme
CashFlowsfromOperatingActivities
Receipts:
2022/23RB 2023/24 2024/25 2025/26 2026/27 2027/28 2028/29 2029/30 2030/31 2031/32 2031/32 2032/33 $ $ $ $ $ $ $ $ $ $ $ $
Rates Receipts 22,414,000 23,888,124 24,489,956 25,188,743 25,902,102 26,793,374 27,694,311 28,604,377 29,524,035 30,373,934 31,133,282 31,133,282 Statutory Charges 572,000 628,966 641,433 652,302 710,576 723,696 735,230 746,994 758,994 775,086 794,463 794,463 UserCharges 629,000 635,044 644,558 649,764 655,101 660,857 666,483 672,240 678,145 681,180 698,209 698,209 Grants, Subsidies and Contributions (operating purpose) 2,298,000 2,852,148 2,025,109 2,005,759 2,306,312 2,265,906 2,316,029 2,367,404 2,420,064 2,475,261 2,537,143 2,537,143 Investment Receipts 40,000 16,568 14,589 12,835 11,006 9,108 7,139 5,101 2,992 804 824 824 Reimbursements 1,229,000 214,156 218,271 218,516 218,685 218,857 219,033 219,211 219,394 219,580 225,070 225,070 OtherRevenue 780,000 325,753 308,300 309,263 309,300 309,300 11,309,300 309,300 309,300 309,300 317,033 317,033 Payments: Payments to Employees (10,117,000) (10,515,122) (10,849,539) (11,197,014) (11,555,782) (11,926,207) (12,308,670) (12,703,635) (13,111,364) (13,532,153) (13,870,457) (13,870,457) Payments forMaterials, Contracts &OtherExpenses (11,176,000) (12,939,516) (10,860,434) (10,175,689) (11,182,615) (11,040,493) (22,407,640) (12,641,812) (12,612,836) (12,779,269) (13,098,750) (13,098,750) Finance Payments (440,000) (152,610) (499,600) (301,000) (164,000) (74,000) (118,000) (143,000) (143,000) (143,000) (143,000)NetCash provided (or used in)Operating Activities 6,229,000 4,953,511 6,132,643 7,363,479 7,210,685 7,940,398 8,113,215 7,436,180 8,045,724 8,380,723 8,593,817 8,736,817
Activities Receipts: Amounts ReceivedSpecifically forNew/UpgradedAssets 2,707,000 2,360,000 2,440,000 3,700,000 1,196,000 1,225,900 1,256,548 1,287,961 1,320,160 1,320,160 1,353,164 1,353,165 Sale of Replaced Assets - - - - - - - - - - -SaleofSurplus Assets - - - - - - - - - - -SaleofNonCurrent Assets "HeldforSale" - 1,980,000 720,000 2,500,000 - - 500,000 800,000 - - -Repayments of Loans by Community Groups 23,000 55,549 57,456 50,453 52,216 54,045 55,940 57,906 59,944 62,058 63,609 63,610 Distributions Received from Equity Accounted Council Businesses - - - - - - - - - -OtherInvestingActivity Receipts 22,000,000 - - - - - - - - - -Payments: Expenditure on Renewal/Replacement of Assets (11,777,000) (4,203,888) (7,241,718) (7,423,236) (7,530,061) (6,751,358) (7,373,177) (9,835,583) (9,855,326) (9,886,885) (10,134,057) (10,134,057) ExpenditureonNew/UpgradedAssets (5,010,000) (1,060,000) (945,000) (1,710,000) (1,999,000) (1,941,000) (1,285,000) (1,346,000) (1,380,000) (1,414,000) (1,449,350) (1,449,350) Purchase of Investment Property - - - - - - - - - -Loans Made to Community Groups (250,000) - - - - - - - - - -Capital Contributed to Equity Accounted Council Businesses - - - - - - - - - -NetCash provided (or used in)Investing Activities 7,693,000 (868,339) (4,969,262) (2,882,783) (8,280,845) (7,412,413) (6,845,689) (9,035,716) (9,855,222) (9,918,667) (10,166,634) (10,166,632) CashFlowsfromFinancingActivities Receipts: Proceeds from CAD - - - - 1,299,894 - - 1,844,186 2,061,664 1,766,294 1,806,876 1,663,877 Proceeds from Borrowings - - - - - - - - - - -Payments: Repayments ofCAD (13,654,000) (3,549,745) (947,497) (4,257,867) - (292,304) (1,030,864) - - - -Repayments of Borrowings (740,000) (449,108) (131,753) (136,844) (142,134) (147,633) (153,350) (159,293) (165,470) (139,489) (142,976) (142,976) Repayment ofPrincipal PortionofLeaseLiabilities (88,000) (86,319) (84,131) (85,985) (87,600) (88,048) (83,312) (85,357) (86,696) (88,861) (91,083) (91,083) Repayment of Bonds &Deposits - - - - - - - - - - -NetCash Flow provided (used in)Financing Activities (14,482,000) (4,085,172) (1,163,381) (4,480,696) 1,070,160 (527,985) (1,267,526) 1,599,536 1,809,498 1,537,944 1,572,817 1,429,815 NetIncrease/(Decrease)in Cash &Cash Equivalents (560,000) - - - - - - - - - -plus:Cash &Cash Equivalents-beginning ofyear 560,000 - - - - - - - - - -Cash &Cash Equivalents-end ofthe year - - - - - - - - - - - -
CashFlowsfromInvesting
Projected Years
LightRegionalCouncil
10YearFinancialPlanforthe Yearsending30June 2034
STATEMENT OFCHANGESINEQUITY-GENERALFUND
Scenario:Base Plan
OtherComprehensive Income
- Gain (Loss) on Revaluation of I,PP&E
- Available forSale Financial Instruments: change in fairvalue
- Impairment (loss) reversal relating to I,PP&E
- Transferto Accumulated Surplus on Sale of I,PP&E
- Transferto Acc. Surplus on Sale of AFS Financial Instruments
- Share of OCI - Equity Accounted Council Businesses
- OtherEquity Adjustments - Equity Accounted Council Businesses
- OtherMovements
Transfers between Equity
2023/24 2024/25 2025/26 2026/27 2027/28 2028/29 2029/30 2030/31 2031/32 2032/33 $ $ $ $ $ $ $ $ $ $ Opening Balance 228,726,000 233,826,429 231,559,521 237,950,273 244,949,109 245,984,053 248,010,625 250,380,256 249,074,729 250,745,354 Net Surplus
forYear 7,780,195 3,106,824 7,069,835 1,108,944 2,101,573 2,446,631 1,773,472 1,751,626 1,693,436 1,415,359
/ (Deficit)
- - - - - - - - - -
- - - - - - - - - -
- - - - - - - - - -
- - - - - - - - - -
- - - - - - - - - -
- - - - - - - - - -
- - - - - - - - - -
1,479,640 (5,373,731) (679,083) 5,889,893 (1,066,630) (420,059) 596,159 (3,057,153) (22,811) (125,334) Other
1,479,640 (5,373,731) (679,083) 5,889,893 (1,066,630) (420,059) 596,159 (3,057,153) (22,811) (125,334) Total Comprehensive Income 3,620,789 3,106,824 7,069,835 1,108,944 2,101,573 2,446,631 1,773,472 1,751,626 1,693,436 1,735,772
Comprehensive Income
- - - - - - - - -Equity-Balance atendofthe reportingperiod 233,826,429 231,559,521 237,950,273 244,949,109 245,984,053 248,010,625 250,380,256 249,074,729 250,745,354 252,355,792
Light Regional Council
Financial Plan for the Years ending 30 June 2031
STATEMENT FOR BUNYIP2 WATER PROJECT
Scenario:Base Plan
Projected Years
2022/23 2023/24 2024/25 2025/26 2026/27 2027/28 2028/29 2029/30 2030/31 $ $ $ $ $ $ $ $ $ Income Rates - 450,000 900,000 900,000 900,000 900,000 900,000 900,000 450,000 Grants, Subsidies and Contributions - 4,773,939 Investment Income Other Income 341,000 11,000,000 Total Income 341,000 5,223,939 900,000 900,000 900,000 900,000 900,000 900,000 11,450,000 Expenses Materials, Contracts & Other Expenses 60,000 75,000 Finance Costs 31,000 236,000 304,000 237,000 240,000 240,000 240,000 240,000 100,000 Net loss - Equity Accounted Council Businesses - - - - - - -Total Expenses 31,000 296,000 304,000 237,000 240,000 240,000 240,000 240,000 175,000 Operating Surplus / (Deficit) 310,000 4,927,939 596,000 663,000 660,000 660,000 660,000 660,000 11,275,000 Non-Current Assets Financial Assets 1,434,000 11,000,000 11,000,000 11,000,000 11,000,000 11,000,000 11,000,000 11,000,000Non-Current Liabilities Cash Advance Debenture 1,124,000 7,486,423 7,790,423 8,000,000 8,000,000 8,000,000 8,000,000 8,000,000Other Non-Current Liabilities - deferred income Cash Flows from Investing Activities Receipts: Repayment of loans by Bunyip2 and 'take-out' 11,000,000 Payments: Loans (advances) made to Bunyip2 1,434,000 11,290,362 - - - - - -Cash Flows fromFinancing Activities Receipts: Proceeds from CAD 1,124,000 6,362,423 304,000 209,577 -Payments: Repayments of CAD - - - - - - - - 8,000,000
LightRegionalCouncil
10YearFinancialPlanforthe Yearsending30June 2033
STATEMENT OFCOMPREHENSIVEINCOME-GENERALFUND
Scenario:Base Plan+Bunyip2waterscheme
Projected Years
2022/23RB 2023/24 2024/25 2025/26 2026/27 2027/28 2028/29 2029/30 2030/31 2031/32 2032/2033 $ $ $ $ $ $ $ $ $ $ $ Income Rates 22,414,000 23,238,848 25,412,531 26,117,355 26,831,075 27,729,860 28,630,888 29,541,336 30,011,385 30,408,315 31,168,523 Statutory Charges 572,000 627,080 641,828 652,704 712,798 724,114 735,656 747,430 759,438 775,687 795,079 UserCharges 629,000 506,884 644,746 649,957 655,298 661,070 666,690 672,453 678,363 681,288 698,320 Grants, Subsidies and Contributions 2,298,000 6,831,105 2,007,463 2,054,074 2,219,851 2,268,822 2,319,018 2,370,468 2,423,205 2,477,260 2,539,192 Investment Income 40,000 33,240 14,550 12,800 10,970 9,070 7,100 5,060 2,950 760 779 Reimbursements 1,229,000 236,551 218,354 218,520 218,688 218,860 219,036 219,215 219,398 219,584 225,074 OtherIncome 780,000 382,000 308,300 309,300 309,300 309,300 309,300 309,300 11,309,300 309,300 317,033 Net gain - equity accounted Council businesses - - - - - - - - - -Total Income 27,962,000 31,855,708 29,247,772 30,014,710 30,957,981 31,921,097 32,887,689 33,865,262 45,404,039 34,872,194 35,743,999 Expenses Employee Costs 10,139,000 10,562,423 10,859,273 11,207,064 11,566,159 11,936,921 12,319,732 12,715,058 13,123,157 13,544,325 13,882,933 Materials, Contracts &OtherExpenses 10,125,000 9,447,253 10,286,277 10,000,384 11,148,143 10,878,697 11,356,190 12,529,769 13,005,588 12,843,804 13,164,899 Depreciation, Amortisation &Impairment 6,342,000 6,487,227 6,662,795 6,829,365 7,000,099 7,175,101 7,354,479 7,538,341 7,726,799 7,919,969 8,117,968 Finance Costs 440,000 388,610 803,600 538,000 404,000 314,000 358,000 383,000 483,000 483,000 483,000 Net loss - Equity Accounted Council Businesses - - - - - - - - -Total Expenses 27,046,000 26,885,513 28,611,944 28,574,813 30,118,400 30,304,719 31,388,401 33,166,168 34,338,544 34,791,097 35,648,800 OperatingSurplus/(Deficit) 916,000 4,970,195 635,828 1,439,897 839,580 1,616,378 1,499,288 699,094 11,065,495 81,097 95,199 Asset Disposal &FairValue Adjustments - - 1,980,000 720,000 2,500,000 - 500,000 800,000 - -Amounts Received Specifically forNew orUpgraded Assets 2,707,000 2,360,000 2,440,000 3,700,000 1,196,000 1,225,900 1,256,548 1,287,961 1,320,160 1,320,160 1,320,160 Physical Resources Received Free of Charge - - - - - - - - - -NetSurplus/(Deficit) 3,623,000 7,330,195 5,055,828 5,859,897 4,535,580 2,842,278 3,255,836 2,787,055 12,385,656 1,401,257 1,415,359
Scenario:
scheme 2022/23RB 2023/24 2024/25 2025/26 2026/27 2027/28 2028/29 2029/30 2030/31 2031/32 2032/33 $ $ $ $ $ $ $ $ $ $ $ ASSETS Current Assets Cash & Cash Equivalents - - - - - - - - - -Trade & Other Receivables 2,536,000 2,331,184 2,331,184 2,344,123 2,447,496 2,433,751 2,507,840 2,590,928 2,680,910 2,758,307 2,815,651 Inventories 25,000 16,588 16,588 15,068 14,241 16,251 15,476 16,332 18,312 17,746 18,190 Non-current assets classified as "Held for Sale" - - - - - - - - - -Total Current Assets 2,561,000 2,347,772 2,347,772 2,359,191 2,461,737 2,450,002 2,523,316 2,607,260 2,699,222 2,776,053 2,833,841 Non-Current Assets Financial Assets 525,000 11,467,995 11,467,995 11,417,542 11,365,326 11,311,281 11,255,341 11,197,435 137,491 75,433 29,659 Equity Accounted Investments in Council Businesses 2,224,000 2,280,000 2,337,000 2,395,000 2,455,000 2,516,000 2,579,000 2,643,000 2,709,000 2,777,000 2,846,000 Infrastructure, Property, Plant & Equipment 241,608,000 240,633,106 240,633,106 242,244,077 244,547,949 247,125,337 248,838,532 250,160,217 253,938,933 257,447,459 260,828,375 Other Non-Current Assets 1,231,000 1,243,502 1,243,502 1,255,937 1,268,496 1,281,181 1,293,993 1,306,933 1,320,002 1,333,202 1,346,534 Total Non-Current Assets 245,588,000 255,624,603 255,681,603 257,312,556 259,636,771 262,233,799 263,966,866 265,307,585 258,105,426 261,633,094 265,050,568 TOTAL ASSETS 248,149,000 257,972,375 258,029,375 259,671,747 262,098,508 264,683,801 266,490,182 267,914,845 260,804,648 264,409,147 267,884,409 LIABILITIES Current Liabilities Cash Advance Debenture - - - - - - - - - -Trade & Other Payables 5,214,000 4,021,807 4,021,807 3,835,686 3,761,245 4,118,372 4,060,520 4,250,885 4,612,623 4,588,972 4,716,032 Borrowings 527,000 200,996 200,996 222,829 221,883 235,680 235,607 221,910 252,167 228,350 141,830 Provisions 2,382,000 2,441,000 2,502,000 2,565,000 2,629,000 2,695,000 2,762,000 2,831,000 2,902,000 2,975,000 3,049,000 Total Current Liabilities 8,123,000 6,663,803 6,724,803 6,623,515 6,612,128 7,049,052 7,058,127 7,303,795 7,766,790 7,792,322 7,906,862
Cash Advance Debenture 8,962,000 14,936,463 17,227,636 12,666,213 8,260,408 9,499,939 9,239,341 8,181,683 1,979,451 4,040,143 5,854,258 Borrowings 2,065,000 2,209,680 2,117,415 1,966,746 1,744,863 1,549,757 1,510,089 1,305,111 1,165,678 937,328 795,497 Provisions 273,000 280,000 287,000 294,000 301,000 309,000 317,000 325,000 333,000 341,000 350,000 Other Non-Current Liabilities - 56,000 113,000 171,000 231,000 292,000 355,000 419,000 485,000 553,000 622,000 Total Non-Current Liabilities 11,300,000 17,482,143 19,745,051 15,097,959 10,537,271 11,650,696 11,421,430 10,230,794 3,963,129 5,871,471 7,621,755 TOTAL LIABILITIES 19,423,000 24,145,946 26,469,854 21,721,474 17,149,399 18,699,748 18,479,557 17,534,589 11,729,919 13,663,793 15,528,617 Net Assets 228,726,000 233,826,429 231,559,521 237,950,273 244,949,109 245,984,053 248,010,625 250,380,256 249,074,729 250,745,354 252,355,792 EQUITY Accumulated Surplus 53,367,000 58,467,429 56,200,521 56,697,841 56,806,422 57,688,801 58,453,089 58,415,183 55,366,678 55,706,775 56,058,974 Asset Revaluation Reserves 173,730,000 173,730,000 173,730,000 179,623,432 186,513,687 186,666,252 187,928,536 190,336,073 192,079,051 193,409,579 194,667,818 Other Reserves 1,629,000 1,629,000 1,629,000 1,629,000 1,629,000 1,629,000 1,629,000 1,629,000 1,629,000 1,629,000 1,629,000 TotalEquity 228,726,000 233,826,429 231,559,521 237,950,273 244,949,109 245,984,053 248,010,625 250,380,256 249,074,729 250,745,354 252,355,792
Base Plan+ Bunyip2water
Non-Current Liabilities
LightRegionalCouncil
10Year FinancialPlanfor the Yearsending30June 2033
UNIFORM PRESENTATION OFFINANCES-GENERAL FUND
Projected Years
add
(Net Outlays) on Existing Assets
* Excludes proceeds of Bunyip1 'take-out' of $21.528m (balance due as at 30/6/2022) - net lending in 2022/23 is a substantial surrender/repayment of borrowing, firstly with the surrender of $11.3m of 'Bunyip1' borrowing, 2030/31 outcome subject to Bunyip2
Actuals Current Year 2021/2022 2022/2023 2023/2024 2024/25 2025/26 2026/27 2027/28 2028/29 2029/30 2030/31 2031/32 2032/2033 $ $ $ $ $ $ $ $ $ $ $ $
Income 27,015,000 27,962,000 32,305,708 29,247,772 30,014,710 30,957,981 31,921,097 32,887,689 33,865,262 45,404,039 34,872,194 35,743,999 less Expenses (25,631,000) (27,046,000) (26,885,513) (28,611,944) (28,574,813) (30,118,400) (30,304,719) (31,388,401) (33,166,168) (34,338,544) (34,791,097) (35,648,800) Operating Surplus
(Deficit) 1,384,000 916,000 5,420,195 635,828 1,439,897 839,580 1,616,378 1,499,288 699,094 11,065,495 81,097 95,199
Renewal and Replacement ofExisting Assets (1,322,000) (11,777,000) (7,241,718) (7,423,236) (7,530,061) (6,751,358) (7,373,177) (9,835,583) (9,855,326) (9,886,885) (10,134,057) (10,134,057) add back Depreciation, Amortisation and Impairment 6,329,000 6,342,000 6,487,227 6,662,795 6,829,365 7,000,099 7,175,101 7,354,479 7,538,341 7,726,799 7,919,969 8,117,968
582,000 - - - - - - - - - - -
5,589,000 (5,435,000) (754,491) (760,441) (700,696) 248,741 (198,076) (2,481,104) (2,316,985) (2,160,086) (2,214,088) (2,016,089)
New
Upgraded Assets
(19,677,000) (5,010,000) (1,060,000) (945,000) (1,710,000) (1,999,000) (1,941,000) (1,285,000) (1,346,000) (1,380,000) (1,414,000) (1,449,350)
Received Specifically for New and Upgraded Assets 6,711,000 2,707,000 2,360,000 2,440,000 3,700,000 1,196,000 1,225,900 1,256,548 1,287,961 1,320,160 1,320,160 1,353,164
back Proceeds from Sale ofSurplus Assets 1,201,000 - 720,000 2,500,000 - - 500,000 800,000 - - -(Net Outlays) on New and Upgraded Assets (11,765,000) (2,303,000) 2,020,000 3,995,000 1,990,000 (803,000) (215,100) 771,548 (58,039) (59,840) (93,840) (96,186) Net Lending /
for Financial Year * (4,792,000) (6,822,000) 6,685,704 3,870,387 2,729,201 285,321 1,203,202 (210,268) (1,675,931) 8,845,570 (2,226,831) (2,017,076)
Operating Activities
/
Capital Activities less (Net Outlays) on Existing Assets Capital Expenditure on
back Proceeds from Sale ofReplaced Assets
less (Net Outlays) on New and Upgraded Assets Capital Expenditure on
and
(including Investment Property & Real Estate Developments)
add back Amounts
add
(Borrowing)
Long Term Financial Ratios
The following figures show the long-term financial ratios as recommended by Local Government Financial Management Regulation 2011 over the life of the 2023-2033 LTFP.
Financial Sustainability Information Paper 9 of the LGA recommended an Operating Surplus Ratio of between 0% and 5% on average over long term. Council’s estimate of operating results for the long term does not include the likelihood of future new initiatives and programs impacting future returns. Council’s LTFP forecasts sustainable operating results from years 1 to 10 Reduction in 2030 relates to the end of the Bunyip 2 separate rate.
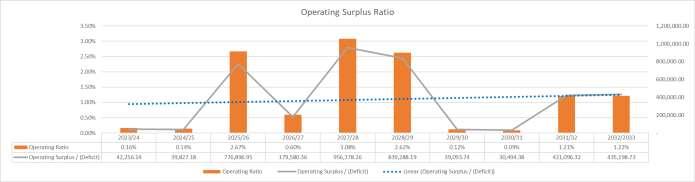
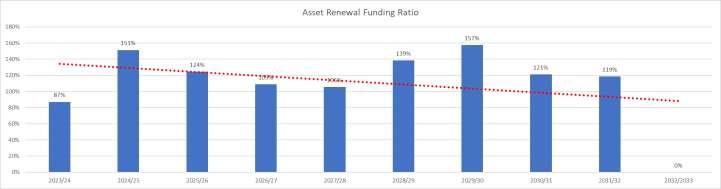
Financial Sustainability Information Paper 9 of the LGA recommended an Asset Renewal Funding Ratio of greater than 90% but less than 110% on average over long term. Information contained in its Infrastructure and Asset Management Plan (IAMP) has been used to inform and calculate the asset renewal funding ratio, for the term of the current IAMP. Beyond the horizon of the current IAMP (2031), future annual depreciation estimates are used to calculate the asset renewal funding ratio. Estimates of Asset Sustainability beyond year 5 of the LTFP fall outside of the current IAMP and these will be updated in the future revision of the LTFP accordance with a review and update of the IAMP.
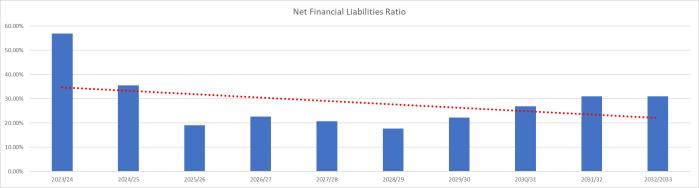
Light Regional Council 2022/2023 Annual Business Plan, Budget & Long-Term Financial Plan 46
Financial Sustainability Information Paper 9 of the LGA recommended a Net Financial Liabilities Ratio of greater than zero but no more than 100% of total operating revenue on average over long term.
Light Regional Council 2022/2023 Annual Business Plan, Budget & Long-Term Financial Plan 47
APPENDIX A - RATING
STRUCTURE & POLICY
In proposing its rates for the 2023/2024 Financial Year, Council has considered the Strategic Management Plan 2021-2025, the current economic climate (including the lasting effects of Covid-19), the budget requirements for the 2023/2024 financial year and the impact of rates on the community. Land use categories as provided in the Local Government (General) Regulations 1999 are used as the basis of Council’s general rate calculation. Section 147 of the Local Government Act 1999 provides Council with the power to rate all land within Light Regional Council –except for land specifically exempted, such as Crown land and land occupied by Council.
Council use the capital value determined by the State Valuation Office as the basis for valuing land and calculating rates, as it is felt this method provides the fairest and most efficient method of distributing the rate burden across all rate payers. If a property owner is dissatisfied with a property valuation, then an objection may be made to the Valuer-General in writing, within 60 days of receiving notice of the valuation, explaining the basis for the objection. It is important to note that Council has no role in the valuation process.
During 2022/23 Council approved a Rate Revenue Policy – refer Council’s website for details.
Objections
If a ratepayer believes that a particular property has been wrongly classified by Council as to its land use, then they may object (to Council) to that land use within 60 days of being notified. For further information on this matter, ratepayers may contact Council’s Rates Assessment Officer.
Impact of Rates
In the 2023/2024 budget, Council proposes to collect $19.303m of general rate revenue in a total operating revenue budget of $26.616m. The final value of general rates revenue will be based on the final Valuer General’s Light region valuation on or around 30 June 2023
Income also includes separate charges for Refuse Collection and Community Wastewater Management Systems, and Council acts as a collection agent on behalf of the State Government regarding the collection of income for the Regional Landscape Boards.
The following four tables summarise general rates forecasts used to formulate the 2023/2024 ABP and Budget This information is prepared at Week 43 (April 2023) of the valuation cycle. The total capital valuation of the region has increased 13.54% (rateable property has increased 13.62%) between 1 July 2022 and the date of the valuation data used to formulate the 2023/2024 budget. Further minor changes will be made before the approval of the budget and the rates declaration
The table below expands the information above and provide comparative assessment, valuation, and rating data by Land Use Code.
Light Regional Council 2022/2023 Annual Business Plan, Budget & Long-Term Financial Plan 48
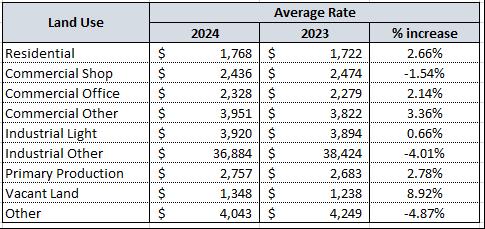
Light Regional Council 2022/2023 Annual Business Plan, Budget & Long-Term Financial Plan 49 Comparative
Valuation Data Rate in the
Average Rates payable by Land Use No. of Assessments Total District Valuation No. of Assessments Total District Valuation $ % Increase Over 2022-23 Residential 4,904 1,931,959,106 5,010 2,230,718,161 15.46% Commercial Shop 64 20,124,962 67 23,089,707 14.73% Commercial Office 11 3,246,250 11 3,603,350 11.00% Commercial Other 276 120,005,514 278 132,914,858 10.76% Industrial Light 24 7,826,900 24 8,624,824 10.19% Industrial Other 39 125,494,779 39 129,667,429 3.32% Primary Production 2,342 1,872,577,888 2,371 2,108,283,618 12.59% Vacant Land 350 54,393,338 381 71,166,767 30.84% Other 93 85,386,701 93 87,810,544 2.84% Total Rateable 8,103 4,221,015,438 8,274 4,795,879,258 13.62% Non-Rateable 410 64,285,582 407 69,856,701 8.67% Total Assessments 8,513 4,285,301,020 8,681 4,865,735,959 13.54% Land Use 2022-23 Financial Year 2023-24 Financial Year (as at Week 43) Total Assessments Land Use 2024 2023 Change Value Change % Residential 0.0040000 0.0043420 -0.00034 -7.88% Commercial Shop 0.0070000 0.0075990 -0.00060 -7.88% Commercial Office 0.0070000 0.0075990 -0.00060 -7.88% Commercial Other 0.0080000 0.0086840 -0.00068 -7.88% Industrial Light 0.0110000 0.0119410 -0.00094 -7.88% Industrial Other 0.0110000 0.0119410 -0.00094 -7.88% Primary Production 0.0031200 0.0033430 -0.00022 -6.67% Vacant Land 0.0070000 0.0075990 -0.00060 -7.88% Other 0.0040000 0.0043420 -0.00034 -7.88%
Assessment and
$ by Land Use
All rates modelling incorporates the overall rating and its impact using average valuations. Rate changes for individual assessments will likely vary from average amounts used for modelling purposes.
Differential General Rates
A differential rate is applied to industrial, primary production commercial properties and vacant land. This additional amount is based on the principle that industrial and commercial properties are a greater burden on infrastructure and achieve direct benefits from parking and health regulations, events and tourism etc. For vacant land, the differential rate discourages holding vacant property and encourages development.
Every resident benefit in some part from the general amenity of the area, whether that is at the present time or in the future. The amenity includes the local economy, general Council operations and the ability to use facilities.
Council rating is a system of taxation against property prescribed by the Local Government Act 1999 However, Council has assessed that the level of differential rating imposed is governed in part by the ability to pay, the potential for income tax deduction and the perception of accessibility or useability of council services by the residents and consumers
It has previously been decided that:
Commercial Properties
Commercial properties generally have available to them, their employees, and customers, the same services as other ratepayers. However, in most cases commercial users have a greater impact on the main services such as road maintenance and generally derive a greater benefit from the services provided.
Industrial Properties
Industrial properties generally have available to them, their employees, and customers, the same services as other ratepayers However, in most cases industrial users have a greater impact on the main services such as road maintenance and generally derive a greater benefit from the services provided, particularly where, for example, large amounts of raw or unrefined product are delivered to site for processing, utilising Council’s infrastructure.
Primary Production Properties
Primary Production properties tend to be more remote from some of the services provided by Council. In terms of infrastructure adjacent to their properties they may not have sealed or formed roads, footpaths, or street lighting. However, they do have capacity to enjoy the formed roads, footpaths or street lighting and enjoy the same level of amenity as other residents of the Council area.
Minimum Rate
A council may impose a minimum amount payable by way of rates if it has not imposed a fixed charge Where two or more adjoining properties have the same owner and are occupied by the same occupier, only one minimum rate is payable by the ratepayer Where a council imposes a minimum rate, it must not apply to more than 35% of properties in the council area.
In 2023/2024 Council proposes to levy a minimum rate of $925 ($900 in 2022/2023) which will affect 606 of rateable properties (588 in 2022/23) It is appropriate that all rateable properties make a base level contribution to the cost of administering Council’s activities and to the cost of creating and maintaining the physical infrastructure that supports each property. The minimum rate will apply to residential assessments valued at less than $231,250
Regional Landscape Board Levies (formally the Natural Resource Management Board (NRM))
The whole of the Council area is located within the boundaries of the Northern and Yorke Landscape Board Contributions are sought in 2023/2024 totalling $0.552m
Light Regional Council 2022/2023 Annual Business Plan, Budget & Long-Term Financial Plan 50
Council is operating as a revenue collector for the Regional Landscape Board in this regard It does not retain this revenue or determine how the revenue is spent.
Service Charges
Council provides a Community Wastewater Management System to residential and commercial properties in Kapunda, Freeling, Greenock, and Roseworthy The estimated full cost of service for the 2023/2024 financial year is $1 735m Council recovers this cost through various means including the imposition of a service charge of $600 per unit ($580 in 2022/2023) for all properties where the service is available. Where the service is provided to land (an assessment) to which a rate rebate applies, a CWMS service charge is levied against the land.
The provision of CWMS is a regulated service and the Essential Services Commission of SA has issued a price determination and guidelines for councils to follow regarding the pricing of CWMS The guidelines and price determination result from work done at the Commonwealth Government level, and adopted by State and Territory Governments, to ensure that the full cost of providing water and sewerage services is recovered from users. This approach ensures the sustainability of service provision over time. The proposed increases are reviewed annually and are adjusted in accordance with the costs of the scheme at that time
A refuse collection service inclusive of recycling collections is provided within the townships of Kapunda, Freeling, Hewett, Greenock, Roseworthy, and Wasleys The service is also provided to those ratepayers in Council’s area that can access the service along the designated collection routes. The full cost of service for 2023/2024 is budgeted to be $1.809m Council proposes to recover this cost through a service charge of $335 ($323 in 2022/2023) for each property within the designated 3 bin service area (i.e., collection of domestic, recyclable and green organic refuse); and through a service charge of $225 ($218 in 2022/2023) for each property within the designated 2 bin service area (i.e. collection of domestic and recyclable refuse only) Where the service is provided to land (an assessment) to which a rate rebate applies, a refuse collection service charge is levied against the land.
Payment of Rates
Under Section 181 of the Local Government Act 1999, Council must provide the opportunity for all ratepayers to pay rates by quarterly instalments. Council payment dates for the 2023/2024 Financial Year will be 1 September 2023, 1 December 2023, 1 March 2024 and 7 June 2024
Late Payment of Rates
The Local Government Act 1999 provides that councils impose an initial penalty of 2% on any payment for rates, whether by instalment or otherwise, that is received late. A payment that continues to be late is then charged an interest rate, set each year according to a formula in the Act, for each month it continues to be late. A further three (3) working days is allowed after the due date for payment as a ‘ grace’ period. Thereafter late payment penalties are applied in accordance with the Local Government Act 1999.
Appropriate delegations are made by Council to the Chief Executive Officer and other staff to undertake collection action on behalf of Council.
A final notice is issued when rates are overdue, i.e. unpaid by the due date. Should rates remain unpaid more than 21 days after the issue of the final notice, then the debt will be referred to a debt collection agency for collection.
The debt collection agency charges collection fees that are recoverable from the ratepayer. All costs incurred by Council in the recovery of outstanding rates and fines are payable by the ratepayer. When payment by the ratepayer is received for overdue rates, the money received is applied as follows:
i. firstly – in payment of any costs awarded to, or recoverable by, the Council in any court proceedings undertaken for the recovery of the rates
ii. secondly – in satisfaction for any liability for interest
iii. thirdly – in payment of any fine
iv. fourthly – in satisfaction of liabilities for rates in the order in which those liabilities arose in payment of rates, in date order of their imposition (starting with the oldest account first).
Light Regional Council 2022/2023 Annual Business Plan, Budget & Long-Term Financial Plan 51
Remission and Postponement of Rates
Postponement of Rates – Hardship
Section 182 of the Local Government Act 1999 permits Council, on the application of the ratepayer, to remit rates partially or wholly or to postpone rates, based on hardship. Where a ratepayer is suffering hardship in paying rates, they are invited to contact Council’s Rates Assessment Officer, on (08) 8525 3200 to discuss the matter. Such enquiries are treated confidentially.
Relief from rapid increases in property valuations
For 2023/2024 the Council is considering introducing a rebate for relief of rapid increases in property valuations greater than 10% since 2022/2023, but subject to certain conditions. These conditions may include (subject to final Council approval when the rates are declared) that the rebate:
• Applies to ‘all’ land use categories
• Is based on an application process (within 60 days of first rates notice)
• Is unavailable for improved (>$40,000) property since the last valuation
• Is unavailable for property sold since the last valuation
• Is unavailable for property where the land use has changed since the last valuation
Seniors Rate Postponement
Section 182A of the Local Government Act provides the option for State Senior Card holders to apply to postpone part of their Council rates on a long-term basis. The deferred amount is subject to monthly interest charge, with the accrued debt being payable on the disposal or sale of the property. Postponement is like a reverse mortgage by relying on the equity in the property A ratepayer who has a State Seniors Card may apply for postponement of a portion of the Council rates payable on property they own if it is their principal place of residence and if no other person other than their spouse has an interest as owner of the property and there is appropriate equity in the property. Further information can be obtained from Council’s Senior Rates Assessment Officer on (08) 8525 3200.
Light Regional Council 2022/2023 Annual Business Plan, Budget & Long-Term Financial Plan 52
Rebate of Rates
The Local Government Act 1999 makes it mandatory for Councils to rebate the rates for certain land uses. This includes 100% rate rebates on places of worship, public cemeteries, hospitals, and land occupied by universities; and 75% rate rebates on educational facilities (subject to some qualifications).
Discretionary rebates may be applied by Council under Section 166 of the Act. Council annually considers many applications for rate rebates and has in the past, and is again for the 2023/2024 financial year, proposing to rebate rates charged to various district community and sporting organisations.
Sale of Land for Non-Payment of Council Rates
The Local Government Act 1999 provides that a council may sell any property where the rates have been in arrears for three years (3) or more. The principal ratepayer and the landowner must be notified (if not the same person) of the intention to sell the land and provide the details of the outstanding amounts. If payment of the outstanding amount is not received within one month the property may be sold. Except in extraordinary circumstances, Council enforces the sale of land for arrears of rates.
Light Regional Council 2022/2023 Annual Business Plan, Budget & Long-Term Financial Plan 53
APPENDIX B - STATEMENTS
Light Regional Council 2022/2023 Annual Business Plan, Budget & Long-Term Financial Plan 54
ON EXPECTED
RATE REVENUE
Statement on Expected Rate Revenue
Please note: These amounts represent a considered estimate of Expected Rate Revenue based on the most current information available at the time of going out to consultation on the DRAFT Annual Business Plan and Budget (ABP&B). This information is updated regularly and therefore these figures may be subject to confirmation at the time of actual adoption of the ABP&B.
2022/23 (as adopted) 2023/24 (estimated)
Rates Revenue
General rates revenue (existing) includes estimate for 'rapid valuation' increase rebate applications. General Rates (NET)
Other Rates (inc. service charges)
The Regional Landscape Levy is a State tax, it is not retained by council.
Including property growth
Including property growth
Water re-use schemes
Incl. $450k for water scheme in 2023/24 (half year)
Estimated growth in number of rateable properties
'Growth' is defined in the regulations as where new properties have been created which has added rateable properties to Council's ratepayer base. Growth can also increase the need and expenditure related to infrastructure, services and programs which support these properties and
Estimated average General Rates per rateable property
Average per rateable property
(o)=(c)/(n)
Councils use property valuations to calculate each rateable property’s contribution to the required rate revenue total. Councils do not automatically receive more money because property values increase but this may alter how rates are apportioned (or divided) across each ratepayer (ie. some people may pay more or less rates, this is dependent on the change in value of their property relative to the overall valuation changes across the council area).
General Rates received fromrateable properties will equal the amount adopted in the budget.
Councils are required under the Local Government Act to provide a rebate to qualifying properties under a number of categories:
Health Services - 100 per cent
Community Services - 75 per cent
Religious purposes - 100 per cent
Public Cemeteries - 100 per cent
Royal Zoological Society of SA - 100 per cent Educational purposes - 75 per cent Expected Rates Revenue
The rates which are foregone via Mandatory Rebates are redistributed across the ratepayer base (ie. all other ratepayers are subsidising the rates contribution for those properties who receive the rebate).
Presented as required by the Local Government (Financial Management) Regulations 2011 reg 6(1)(ea)
Please Note: The percentage figure in (e) relates to the change in the total amount of General Rates revenue to be collected from all rateable properties, not fromindividual rateable properties (ie. individual rates will not necessarily change by this figure).
Councils are required under the Landscape South Australia Act 2019 to collect the levy on all rateable properties on behalf of the State Government. The levy helps to fund the operations of regional landscape boards who have responsibility for the management of the State’s natural resources.
Community Wastewater Management Systems
A council may grant a rebate of rates or service charges in a number of circumstances. The rates which are foregone via Discretionary Rebates are redistributed across the ratepayer base (ie. all other ratepayers are subsidising the rates contribution for those properties who receive the rebate).
Expected Total Rates Revenue excludes other charges such as penalties for late payment and legal and other costs recovered.
'Growth' as defined in the Local Government (Financial Management) Regulations 2011 reg 6(2)
Light Regional Council 2022/2023 Annual Business Plan, Budget & Long-Term Financial Plan 55
$18,704,999 $19,501,497
$294,904
General
$18,999,903 $19,726,497
3.8% Less: MandatoryRebates ($548,458) ($500,000)
$18,451,445 $19,226,497 (e) 4.2%
Regional Landscape Levy $349,177 $551,988
Waste collection $1,802,000 $1,811,777
CWMS $1,670,000 $1,750,800
Separate
Special Rates $1,350,000 $900,000
$5,171,177 $5,014,565 Less: DiscretionaryRebates ($746,114) ($642,000) (l) Expected Total Rates Revenue $22,527,331 $23,047,074 (m) 2.3% 8,265 8,267 (n) 0.0% Actual Estimate $2,232 $2,326 (o) 4.2% Notes (d) (e) (f) (i) (l) (m) (n)
General
General Rates (existing properties)
(a) General Rates (new properties)
$225,000 (b)
Rates (GROSS)
(c)
(d)
(f)
(g)
(i)
and
(j)
Number of rateable properties (e)=(c)+(d) (m)=(e)+(g)+(h)+(i)+(j)+(k)+(l)
Mandatory
Excluding the Regional Landscape Levy and minus
& Discretionary Rebates.
Comments Change
Statement on Expected Rate Revenue
Please note:These figures represent a considered estimate of Expected Rate Revenue based on the most current information available at the time of going out to consultation on the DRAFT Annual Business Plan and Budget (ABP&B). This information is updated regularlyand therefore these figures maybe subject to confirmation at the time of actual adoption of the ABP&B.
Expected Rates Revenue
Land Use (General Rates - GROSS)
Residential
Commercial - Shop
Industry - Other
Primary Production
Vacant Land No. of rateable properties
Other
Total Land Use
Not applicable
Not applicable
Total Locality
GRANDTOTAL (GROSS)
2023/24 expected revenue inclusive of new properties and exclusive of estimated rebates (including proposed 10% valuation increase cap).
Fixed Charge
Not applicable to Light Regional Council.
Rate revenue policy refers to the number of assessments being approximately 10%, but significant valuation increases have increased many more properties above the minimumvaluation threshold.
Council has the option of adopting one of three valuation methodologies to assess the properties in its area for rating purposes:
Capital Value – the value of the land and all improvements on the land;
Site Value – the value of the land and any improvements which predominantly affect the amenity of use of the land, such as drainage works, but excluding the value of buildings and other improvements (Note: Site Value ceases to be an option from1 Sept 2023); or
Annual Value – a valuation of the rental potential of the property.
Light Regional Council uses adopted Capital Valuation.
Average per rateable property calculated as General Rates for category, including a minimumrate but excluding any separate rates, divided by number of rateable properties within that category in the relevant financial year.
Light Regional Council does not apply a fixed charge.
Where two or more adjoining properties have the same owner and are occupied by the same occupier, only one minimumrate is payable.
Light Regional Council 2022/2023 Annual Business Plan, Budget & Long-Term Financial Plan 56 Cents in the $ 2022/23 2023/24 Change 2022/23 2023/24 2022/23 2023/24 Change 2023/24
$8,316,973 $8,968,218 8% 4,894 5,010 $1,699 $1,790 (p) $91 0.4000 $161,285 $163,597 1% 67 65 $2,407 $2,517 (p) $110 0.7000 $26,968 $25,643 -5% 12 11 $2,247 $2,331 (p) $84 0.7000 $1,037,173 $1,076,959 4% 278 278 $3,731 $3,874 (p) $143 0.8000 $86,177 $94,873 10% 22 24 $3,917 $3,953 (p) $36 1.1000 $1,447,838 $1,426,341 -1% 39 39 $37,124 $36,573 (p) -$551 1.1000 $6,357,692 $6,552,845 3% 2,374 2,366 $2,678 $2,770 (p) $92 0.3120 $621,243 $541,393 -13% 485 381 $1,281 $1,421 (p) $140 0.7000 $396,096 $376,628 -5% 94 93 $4,214 $4,050 (p) -$164 0.4000 $18,451,445 $19,226,497 4.2% 8,265 8,267 $2,232 $2,326 (p) $94 Locality (General Rates - GROSS) $0 $0 $0 $0 $0 $0 0 0 (p) $0 $18,451,445 $19,226,497 4.2% 8,265 8,267 $2,232 $2,326 (p) $93 2022/23 2023/24 Change 2022/23 2023/24 Change Fixed Charge $0 $0 $0 $0 (q) $0 2023/24 2022/23 2023/24 Change Minimum Rate 616 $900 $925 (r) $25 Capital Value/Site Value/Annual Value Notes (p) (q) (r) Commercial - Office Commercial - Other Industry - Light Total expected revenue Average per rateable property
Total expected revenue Charge
Rate Minimum Rate Adopted valuation method 7.5% %of total rateable properties
No. of properties to which rate will apply
APPENDIX C - CAPITAL ASSET RENEWAL PROGRAM
The adopted Asset Management Plan 2020 2030 and is included in the LTFP. Council’s four year Asset Renewal Program is summarised below.
4 Year Capital Works Budget 2023-2027
Note: The amounts provided for years 2 to 4, may be adjusted following the outcome of the transport assets condition audit and revaluation process that is scheduled for completion during the development of the 2023/2024 Annual Business Planning & Budget process.
Light Regional Council 2022/2023 Annual Business Plan, Budget & Long-Term Financial Plan 57
Asset
Year 1 Year 2 Year 3 Year 4 FY 2023/2024 FY 2024/2025 FY 2025/2026 FY 2026/2027 Transport Rural Sealed Renewal + Acquisition $1,249,189 $1,950,699 $1,900,000 $1,059,431 Town Sealed Renewal + Acquisition $603,811 $1,352,301 $3,213,000 $2,449,569 Sheeted Roads Renewal + Acquisition $2,600,000 $2,490,000 $2,553,000 $2,616,000 Footpaths Acquisition $100,000 $142,000 $523,000 $545,000 Renewal $40,000 $0 $185,000 $287,000 Bridges And Floodways Bridges, Culverts & Floodways $294,000 $296,000 $0 $0 Stormwater Renewal + Acquisition $138,000 $362,000 $819,000 $588,000 Buildings Renewal + Acquisition $604,000 $621,000 $637,000 $653,000 Open Space Renewal + Acquisition $288,000 $640,000 $255,000 $26,000 CWMS Renewal $486,000 $500,000 $512,000 $525,000 Council Contribution $6,403,000 $8,354,000 $10,597,000 $8,749,000 Potential External Funding $5,488,092 $6,904,000 $3,540,000 $2,540,000 Total Capital Works Program $11,891,092 $15,258,000 $14,137,000 $11,289,000
Type Description
Details of the proposed four year program comprised of sealing unsealed township and rural roads, re-sheeting rural roads, footpath upgrades, building upgrades, stormwater upgrades and bridge renewal and is provided below.
Rural Sealed Road Program
Road Name Nature of Works
Roseworthy
Belvidere Road
2023-2024
Reseal & shoulders Funding TBC Heavy Vehicle Safety & Productivity Programme Application$1,550,000 of work
Seppeltsfield Road Re-Seal and K&G Funding TBC Special Local Roads total project value of $2.1m
$183,501 (carry forward 2022-2023 remaining works)
($180,000) $1,249,189
2024-2025 Year 2
Light Regional Council 2022/2023 Annual Business Plan, Budget & Long-Term Financial Plan 58
From To Estimated Project
Cost
Thiele Hwy Sturt Highway
Road Heavy Vehicle Productivity Program Funding approved. Total project cost $917,505
Council Boundary Truro Road
$310,000
Gerald Roberts Road Peter Seppelt Road
Re-seal Bernard Court End
Road
Court Re-seal Smith Road End
Road
Road Re-seal Thiele Highway End
Road
review after project grant funding confirmed
$700,000 Prescott Crescent
of
$419,189 Bernard
of
Smith
of
To be reallocated at first budget
Heavy Vehicle Productivity Program. Total works budget $3,380,000 Redbanks Road Currie Road $676,000 Argent Road Heavy Vehicle Productivity Program Spray Seal with 300mm cement treated stabiliser. Total works budget $1,250,000 Thiele Highway Sturt Highway $250,000 Linda Street AC 10
40mm Ahrens Road End of Road
William Street Re-Seal
Ahrens Road End
Road Peppermint Drive Re-Seal
Edward Road End of Road Old Two Wells Road Re-Seal
Two Wells Road End of Road
Re-Seal
Two Wells Road End of Road Fairbanks Road Re-Seal Roediger Road End of Road Dixon Road Re-Seal Roediger Road End of Road Hart Road Re-Seal Two Wells Road End
Road
Spray Seal Redbanks Road End
Road
Spray Seal Weaver Road DIT End
Re-Seal
Parkers
Lange
Mudla Wirra Road
@
$1,024,699
(Spray Seal)
of
(Spray Seal)
(Spray Seal)
Roediger Road
(Spray Seal)
of
Old Mallala Road
of
Weaver Road
of Road Kentish Road
(Spray Seal)
Road
Road
Parkers Road Spray Seal
Fenn Place AC @ 40mm
Mendrin Road Spray Seal
Heyworth Road Spray Seal
Wingate Road Spray Seal
Holland Road Spray Seal
Rosedale Road Spray Seal
Roseworthy Road
100mm intersections to 60mm AC with modified binder
Clancy Road Kentish Road
Parkers Road End of Road
Clancy Road Heyworth Road
Mendrin Road End of Road
Two Wells Road River
Turretfield Road End of Seal
Turretfield Road North Para River
Horrocks Highway 476m from Flett Road
Boundary Road
Leitch Road
Hahesy Circuit
Two Wells Road Gawler River Road
Roseworthy Road Hahesy Circuit South
$1,059,431 Total $1,059,431
Light Regional Council 2022/2023 Annual Business Plan, Budget & Long-Term Financial Plan 59
Bethel Road Re-Seal (Spray Seal) Thiele Highway Bethel Road Bridge Total
2025-2026 Year 3 Samuel Road Special Local Roads FundingPavement construction and new sea Sir Condor Laucke Road Seppeltsfield Road $400,000 Mattschoss Road Re-Seal Start of Seal End of Seal
Re-Seal
Seal
$1,950,699
$492,000 North Terrace
Marrabel Road End of
Re-Seal
Re-Seal AC
Re-Seal
To be defined using latest asset condition report data and created in the 2024-2028 Capital Program
2026-2027 Year 4 To be defined using latest asset condition report data and created in the 2024-2028 Capital Program
AC Leitch Road North Leitch Road South
$1,008,000 Total $1,900,000
2023-2024 Year 1
2024-2025 Year 2
Light Regional Council 2022/2023 Annual Business Plan, Budget & Long-Term Financial Plan 60
Township Sealed Road Program
Road Name Nature of Works From To Estimated Project Cost Rogers Street Reconstruct and Seal Borrow Street Hanson Street $603,811 Blackwell Street Re-seal Crase Street South Terrace Peake Street Re-seal Clarke Street Shepherd Street Bagot Street Re-seal Branson Crescent Hogan Street Total $603,811
Chapel Street Re-seal in addition to Kerb & Gutter Branson Cres Whittaker Street
White Street Re-seal Crase Street Chapel Street Hanisch Street Re-seal in addition to Kerb & Gutter Road Closure Hanson Street Hamilton Street Re-seal in addition to Kerb & Gutter Hanisch Street View Street Crimson Court Re-seal Shamrock Way End of Road Jemalong Crescent Re-seal Shamrock Way North Shamrock Way South Meadow Lane Re-seal Shamrock Way End of Road Shamrock Way Re-seal Gartrell Street End of Road Railway Terrace Re-seal Gartrell Street Clode Street Elizabeth Street Re-seal plus kerb and gutter replacement Railway Terrace End of Road Queen Street Re-seal plus kerb and gutter replacement Railway Terrace Wright Street Clode Street Re-seal Railway Terrace Horrocks Highway Railway Road Re-seal in addition to Kerb & Gutter Railway Parade Coghill Street Total $1,352,301
Mill Street Re-seal in addition to Kerb & Gutter Murray Street End of Road $2,002,651 Koncke Street Re-seal Adelaide Road Branson Street Osprey Parade Re-seal Kestrel Road Kingfisher Drive Goldfinch Way Re-seal Kingfisher Drive Wren Place Wren Place Re-seal Goldfinch Way End of Road Kapunda Street Re-seal High Street Maxwell Street Kapunda Street Re-seal in addition to Kerb & Gutter Clare Road High Street Nash Street Re-seal Mildred Street Shannon Street Maxwell Street Re-seal Mildred Street West Terrace West Terrace Re-seal Clare Road Maxwell Street
$1,352,301
2025-2026 Year 3
Coghill Street Re-seal
James Street Re-seal
Beck Street Re-seal
Murray Street South Re-seal
Fisher Street Re-seal
Oldham Street Re-seal
Montefiore Street Main Street
Hancock Road Coghill Street
Main Street End of Road
Princess Street Main North Road
2026-2027 Year 4
Forster Street Jane Terrace
Forster Street Jane Terrace
Goss Road Re-seal in addition to Kerb & Gutter Annie Terrace End of Road
Forster Street Re-seal in addition to Kerb & Gutter Annie Terrace End of Road
Jane Terrace Re-seal in addition to Kerb & Gutter Annie Terrace Pratt Road
Pratt Road Re-seal in addition to Kerb & Gutter Jane Terrace Mudla Wirra Road
Macdonnell Street Re-seal Elizabeth Street End of Seal
Shannon Street Re-seal Maxwell Street Nash Street
Wheatley Street Re-seal Maxwell Street North Terrace
Perry Road Re-seal
$1,410,138
Adelaide Road 260m from Adelaide Road
Johnson Road Re-seal Perry Road End of Road
Mellor Place Re-seal
Johnson Road End of Road
$1,39,430 Total $2,449,568
Light Regional Council 2022/2023 Annual Business Plan, Budget & Long-Term Financial Plan 61
Signs
defined using latest asset condition report data and created in the 2024-2028 Capital Program
$20,000 To be
$1,210,350 Total $3,233,001
Annie Terrace Re-seal Mudla Wirra Road Harris Road
Signs
be defined using latest asset condition report data and created in the 2024-2028 Capital Program
To
2023-2024 Year 1
Road Name Nature of Works From To Estimated Project Cost
John Eden Road
New Seal Funding TBC Heavy Vehicle Safety & Productivity Programme Application - Total budget $1,060,115
Tremlett Road Re-Sheeting
Gawler River Road Re-Sheeting
Haydon Road Re-Sheeting
Bagot Well Road Re-Sheeting
Hazel Road Re-Sheeting
Helston Road Re-Sheeting
Harris Road Re-Sheeting
Fords Road Re-Sheeting
Research Road Re-Sheeting
Golflinks Road Re-Sheeting
Nitschke Road Re-Sheeting
Tremlett Road Best Road $188,523 Thiele Highway Tremlett Road
John Eden Road Job Road
Wilkinson Road Two Wells Road
Boundary Road Mudla Wirra Road
Truro Road Thiele Highway
450m from Range Road Helston Road
Hazel Road Trevena Road
650m from Public Road (1534 Hawkers Creek Road
Gap Road Thiele Highway
Gap Road Bend in Road
Pipeline Road Start of Seal
Roehr Road Public Road
Gomersal Road Pioneer Avenue
Seppeltsfield Road Roenfeldt Road
2024-2025 Year 2
Bethel Road New Construction - Special Local Roads Program $3.6m
$2,411,477
Total $2,600,000
Pine Creek Road Peltz Road
Peltz Road Church Road
Church Road Deep Creek Road
Deep Creek Road Charles Hill Road
Charles Hill Road Watson Road
Watson Road Wiese Road
Wiese Road Weichert Road
Weichert Road Hill Drive
Hill Drive Hawkers Creek Road
Hawkers Creek Road Fords Road
$1,200,000
Light Regional Council 2022/2023 Annual Business Plan, Budget & Long-Term Financial Plan 62 Rural Sheeted Roads Program
Horrocks Highway Pine Creek Road
Schneider Road Re-sheeting
Hentschke Road Re-sheeting
Lienert Road Re-sheeting
Moppa Road Re-sheeting
Fords Road 321m from Fords Road
Ebenezer Road Roehr Road
Roehr Road Truro Road
Braunack Road Rowland Flat
Rowland Flat Schiller Road
Schiller Road Gomersal Road
Sturt Highway Heinjus Road
Heinjus Road Edward Road
Edward Road Gomersal Road
Golf Course Road Moppa Springs Road
Moppa Springs Road Hughes Road
Hughes Road Carrara Hill Road
Carrara Hill Road Schrapel Road
Schrapel Road Truro Road
Truro Road 850m from Truro Road
$1,290,000
Hawker Creek Road Re-sheeting
Muster Road Re-sheeting
Hill Road Re-sheeting
Bethel Road Hazel Road
Hazel Road Trevena Road
Kernich Road Gneil Road
Gneil Road 700m from Gneil Road
Kernich Road Gneil Road
Gneil Road 700m from Gneil Road
700m from Gneil Road Green Road
Green Road Stockport Road
Stockport Road Start of Seal
End of Seal Neldner Road
Marble Quarry Road Heintze Road
Schultz Road Belvidere Road
Belvidere Road 864m Belvidere Road
Research Road Schneider Road
Total $2,490,000
Light Regional Council 2022/2023 Annual Business Plan, Budget & Long-Term Financial Plan 63
Carrarra
Forrest Road
2025-2026 Year 3
Heavy Vehicle Safety Productivity Program Year 1 of two year project. (Total cost $3.6m)
To be developed after asset evaluation and condition audit. $2,193,000 $2,553,000
2026-2027 Year 4
Heavy Vehicle Safety Productivity Program Year 2 of two-year project. (Total cost $3.6m)
$300,000 Wasleys Road Special Local Roads Funded Project (Total Project Cost $1,050,000)
To be developed after asset evaluation and condition audit. $2,616,000 Total $3,326,000
Light Regional Council 2022/2023 Annual Business Plan, Budget & Long-Term Financial Plan 64
Owen
Coleman Road
Road
$360,000
Forest Road
Coleman Road
Woolsheds Road Start of Seal
$350,000
Footpath Program Renewal programs
Light Regional Council 2022/2023 Annual Business Plan, Budget & Long-Term Financial Plan 65 Footpath
2023-2024 Year 1 Project Name Scope/Comments Allocation Peake Street Connecting paths to main street precinct Rogers Street Connecting paths to main street precinct Total $100,000 2024-2025 Year 2
Street Footpath constructed on Southern side of road linking Kapunda Musical Society and Senior Citizens Hanisch Street Footpath in conjunction with road upgrade works Hamilton Street Footpath in conjunction with road upgrade works $142,000 2025-2026 Year 3 Not defined at this time, to be developed as part of the 2024-2028 program $523,000 2026-2027 Year 4 Not defined at this time, to be developed as part of the 2024-2028 program $545,000
Acquisition
Chapel
Project Name Scope/Comments Allocation 2023-2024 Year 1 Adelaide Road Kapunda Footbridge to be upgraded $40,000 $40,000 2024-2025 Year 2 Not defined at this time. To be developed as part of the 2024-2028 Capital Program Total $185,000 2025-2026 Year 3 Not defined at this time. To be developed as part of the 2024-2028 Capital Program Total $287,000 2026-2027 Year 4
Project Name
Wasleys Institute & Supper Hall
Kapunda Museum
Kapunda Institute
Bagot’s Fortune Building
Upgrade and repairs of external waterproofing measures including flashings and gutters.
Waterproofing measures including new roofing and gutters for towers with general upgrade.
Upgrade of stormwater management including flashings, gutters, downpipes. External surface treatments
to waterproofing, light and ventilation including upgrade of stormwater system, including flashings, gutters, downpipes.
Greenock
Light Regional Council 2022/2023 Annual Business Plan, Budget & Long-Term Financial Plan 66 Building & Structures Program
Year 1
2023-2024
Scope/Comments Allocation
Improvements
Miscellaneous furniture renewal within community and operational buildings as required Total
2024-2025 Year 2 Kapunda Institute Internal works including main hall wall resurfacing Freeling Institute Renewal – general upgrade Greenock Centenary Park Grandstand, canteen renewal and pavilion canteen and shelter renewal
$604,000
Institute Renewal-main Hall supper room. Miscellaneous furniture renewal within community and operational buildings as required
2025-2026 Year 3 Kapunda Senior Citizens Renewal – general upgrade of main hall, surface treatments Thomson Building Renewal - general upgrade including flashings, gutters, windows etc Kapunda RSL/Craft Shop Renewal - general upgrade including flashings, gutters, windows etc Miscellaneous furniture renewal within community and operational buildings as required Total $637,000 2026-2027 Year 4 Kapunda Pool Changeroom toilet facilities, chemical storage shed
Likely to include Kapunda Pool facility upgrade, chemical storage shed, and solar installation to community buildings Total
Total $621,000
TBC
$653,000
Berriman Road
Old Anlaby Road
Flagstaff Hill Road
Stockport Road
Light Regional Council 2022/2023 Annual Business Plan, Budget & Long-Term Financial Plan 67 Floodways & Bridges Program 2022-2023 Year 1 Project Name Scope/Comments Allocation
Floodway
event
renewal required after 2022 storm
Culvert
renewal (three locations) following storm events
Floodway
renewal
asset
Floodway Floodway surface renewal
Floodway renewal required following flood damage
2023-2024 Year 2 Ayliffe Road Bridge Potential for-investment with Clare and Gilbert Council (pending approval) $100,000 To be determined from bridge and floodway asset renewal data $196,000 Total $296,000 2024-2025 Year 3
Bridge To be determined from bridge and floodway asset renewal data Total $0 2025-2026 Year 4 Hawkers Creek Bridge Scope of works to be determined. No budget allocation at this stage. Total $0
Schneider Road
$294,000
Rosedale
Hanson St pump station upgrade including emergency storage tank Kirchner St pump station upgrade including chamber and non-return valve.
Various pump station lid replacements throughout region
Spare pumps for contingency x 4 (Kapunda and Roseworthy)
Aerator x 1 (Kapunda)
Dewatering pump (Kapunda) Reticulation Pipework and Manhole Upgrade pipework and manholes (x 6 locations Freeling and Kapunda) Progressive upgrade of pipework approx. 500metres per year Recycled
Light Regional Council 2022/2023 Annual Business Plan, Budget & Long-Term Financial Plan 68 Stormwater Upgrade Program 2023-2024 Year 1 Project Name Scope/Comments Allocation Cliff Road Culverts and SEP Construction (Localised Flooding) Henry Turton Pumping System/Water Re-Use/Flood mitigation Multiple Stormwater Cross pipes (rural road network) $138,000 2024-2025 Year 2 Hanisch Street Stormwater Upgrade Stormwater Management Plan Priority Listing $362,000 Total $362,000 2025-2026 Year 3 Dommenz Road Stormwater Basin Basin on the Northern side of Dommenz Road and diversion of water down Victor Road $223,000 To be developed in the 2024-2028 Capital program from the Stormwater Management Plan Priority Listing $596,000 $819,000 2026-2027 Year 4 Wasley Township Stormwater Management Priority in conjunction with township road upgrades $588,000 Total $588,000 CWMS Program 2023-2024
Project Name Scope/Comments Allocation
CWMS Program
CWMS Pump Stations
WWTP
Water Freeling wetland pump station structure
fencing renewal Total
and
$486,000