Net Zero Building Technology Project ( Summer house )
Oxford Brookes University
MArchD Applied Design in Architecture
ARCH7072 : Net Zero Building Technologies
Student number: 19314299
Table of Contents
1. Introduction
2. London Climate
2.1 Temperature
2.2 Humidity
2.3 Rainfall
2.4 Wind
2.5 Solar Insolation
2.6 Seasonal and Diurnal Variations
3. Achieving the Passivhaus Standard
3.1 Building Design
3.2 Building Envelope (U-Value and Airtightness)
3.3 PHPP Calculation (Ventilation and Energy Demend)
3.4 PHPP Calculations and Services (MVHR and DHW system)
3.5 Physical Model and Shading Design
4. Net Zero and Renewables
4.1 Renewable Technologies
4.2 Energy Demand / Carbon Emission Calculations
4.3 Renewable Technology selection
4.4 Simple Payback Period / Carbon Saving
5. Building in a Different Climate
6. Conclusion
7. References
1. Introduction
The world faces global warming and climate changebecause of natural destruction and pollution; we use the resources faster than they replenish. As the buildings we live in and within are responsible for 35% of total energy consumption and carbon emissions globally, a sustainable strategy is needed to protect the planet we live on, and Passivehus is one of the solutions that provide a range of comfort but using less energy for heating and cooling.
This report aims to show the process of designing a Passivehus to meet net zero energy demands by using London as the project site. To achieve the standard of Passivehus and building energy performance, climate analysis of the site was critical, and the analysis will include temperature, humidity, and wind in different seasons. Furthermore, the calculations for U-Value, Airtightness, Services, Ventilation, Energy efficiency, and the consideration of the material, insulation, and window performance will be explained. After that, three renewable technologies will have to be applied to the design to meet 100% of the building's energy demand, and the financial feasibility of a simple payback period and reducing carbon emissions calculation will sum up the design. Additionally, we will do adaptability testing to the design proposal by changing the PHPP climate data and then highlighting the need to allow the building to perform.
Through these detailed analyses, calculations, and research, this report will present the role of an energy-efficient building in mitigating climate change and achieving a sustainable building.
2. London Climate
London's climate is mainly influenced by an oceanic climate with a few hours of sunshine during spring and summer and frequent cloudy skies and rain. This chapter of the report will analyze the key factors of London's climate by looking at temperature, humidity, rainfall, wind, solar insolation, and seasonal and diurnal variations. (Climates to travel, 2010)
2.1 Temperature
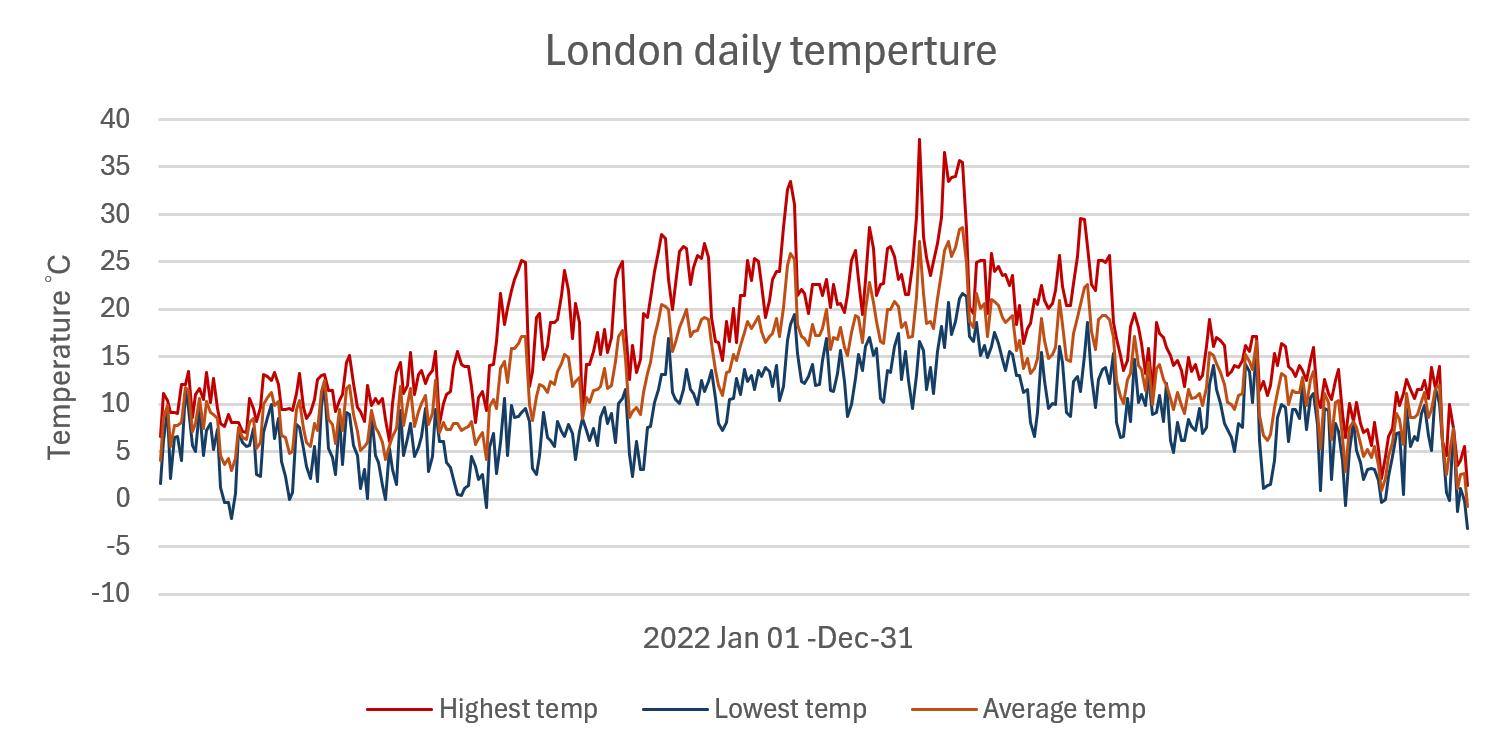
Figure 1. Create by author, London daily temperture line chart (Leon Sen, 2024)
London has a moderate average temperature during the year because of the oceanic climate. The line chart data above is from Design Builders . As we can see, the (red line) represents the average highest temperature, and the (blue line) shows the low est temperature. The highest average temperature typically occurs in July, reaching around 37°C in the summertime, and the lowest average temperature happens in January, which is around - 3°C in the wintertime. In conclusion, London's climate has a mild seasonal change in temperature with a short and comfortable summertime and has a more cold temperature during the year.
Design Considerations:
Based on the temperature analysis above, a few key considerations exist when designing a Passivhaus in London. First, high-quality insulation in walls, roofs, and floors is essential to keep the thermal envelope tight, and double- or triple-glazing windows should be installed to prevent heat loss in cold weather. Secondly, an energy-efficient heating and cooling system like a heat pump will be essential to providing heat to the building, and a passive ventilation design can be efficient during hot temperatures. Lastly, the building material must also be considered to give the building more weather resistance. (Passivhaus Trust, 2015)
2.2 Humidity
Figure 2. Create by author, London average humidity bar chart, (Leon Sen, 2024)
The average humidity data from 2018 to 2022 above is collected by (NASA, 2018). As the graph shows, the humidity levels are quite moderate; it is clear that the winter months (December - February) have the highest humidity, while the summer months (June- August) are the driest. The average humidity level is relatively stable, ranging from 82% to 85.88%. However, July has the lowest humidity annually, especially in 2022 (67.06%). Overall, London's humidity levels remain consistent with seasonal weather change and occasionally change because of specific climate events.
Design Considerations:
For Passivhaus, humidity management is essential to prevent mold growth and structural damage in high humidity, while low humidity can cause health issues and discomfort (Dr. Wolfgang, 2007). In Passivehaus design, a mechanical ventilation heat recovery (MVHR) system is used to bring fresh air into the building and remove moist air. Furthermore, airtight construction and water-resistant materials are important to prevent moisture ingress into walls. (Passivhaus Trust, 2015)
2.3 Rainfall
London Average Monthly Rainfall
Figure 3. Create by author, London average rainfall bar chart (Leon Sen, 2024)
The rainfall data above is based on Climate and Average Weather Year Round in London (Weather Spark, 2019). The rainfall data is quite consistent, hovering around the 40mm to 50mm range, except in March and April, which range around 32 mm, which is the spring months, and a high increase that shows a peak of 56mm in October during autumn. To sum up, London has frequent rainfall with less volume based on seasonal effects unless there is an extreme climate event.
Design Consideration :
In Passivhaus, waterproofing from rainfall has a few key considerations; firstly, a slopping roof can efficiently run off the rainwater, and a flat roof needs a slop drain or green roof to discharge the rainwater. Secondly, for walls, waterproof materials and layers, such as cavity walls with vapor barrier layers, can prevent moisture from rain. Lastly, overhangs extended from the roof can also lower the risk of water infiltration or thermal bridging to walls and windows. However, high-quality sealing for them is still essential for airtightness and water tightness. (BRE , 2014)
2.4 Wind
London Average Wind Speed
Figure 4. Create by author, London average Wind Speed line chart (Leon Sen, 2024)
The wind speed data above is based on Climate and Average Weather Year Round in London (Weather Spark, 2019). The line chart show the monthly wind speed in London through the year. From the chart, December and January have the highest wind speed around 21 kph, and July have the lowest wind speed of 15.5 kph. Allternitively, based on the seasonal pattern, winter have a windier climate and summer have a calmer wind.
5. London Wind Rose (MeteoBlue, 2024)
The wind rose chart above illustrates the wind direction in London, it is clear that west and southwest direction have a significant portion of wind flow, other direction like northeast and south east have a lower wind flow.
Design Consideration :
Wind analysis is important for the Passivehaus design strategy because wind pressure will cause air leakage in buildings. Therefore, a wind barrier layer plays a critical role during the design, enhancing airtightness, reducing heat loss, and protecting structural elements and insulation (wind can bring moisture). The orientation of the building also has to be considered because high winds can increase heat loss in a colder climate. However, a cross-ventilation system can also provide passive cooling to the building. (BRE , 2014)
Figure
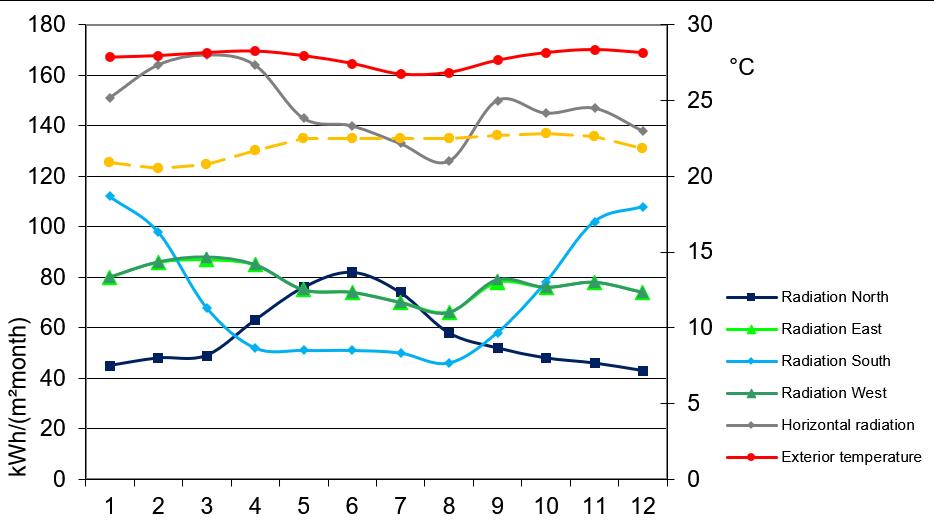
2.5 Solar Insolation
2024)
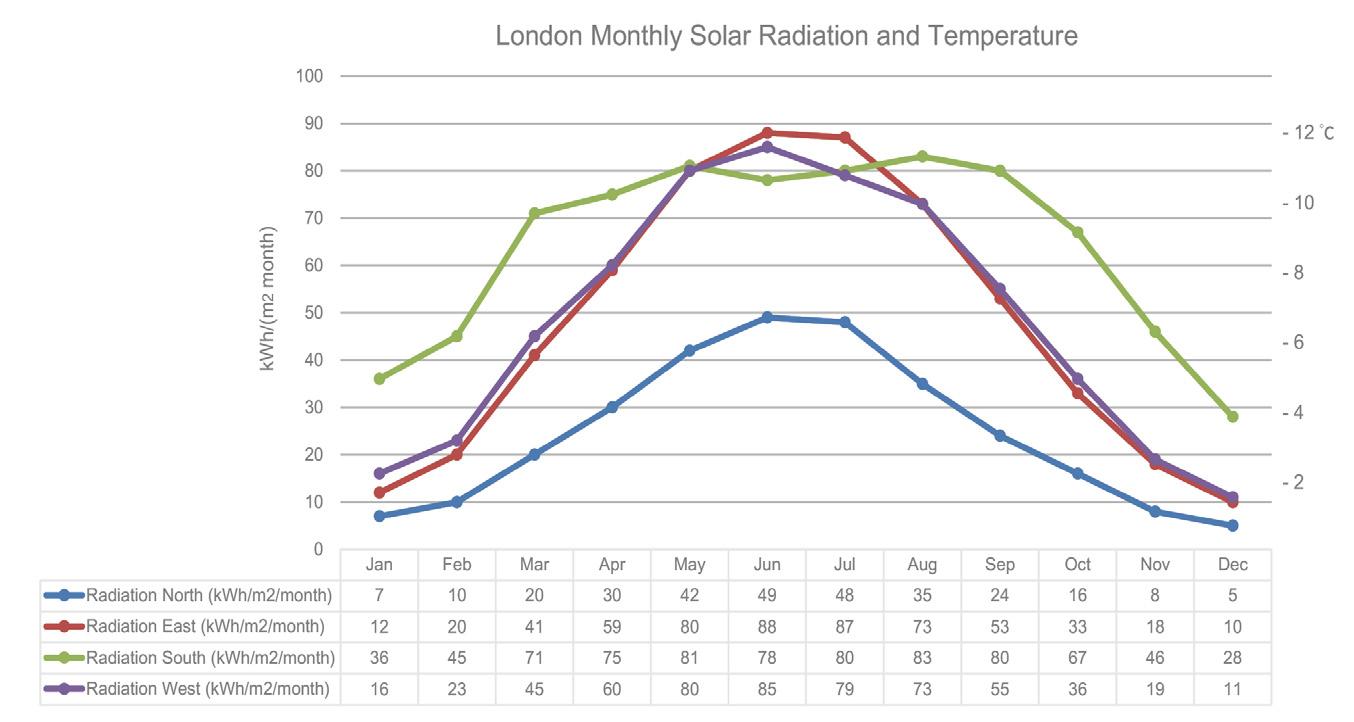
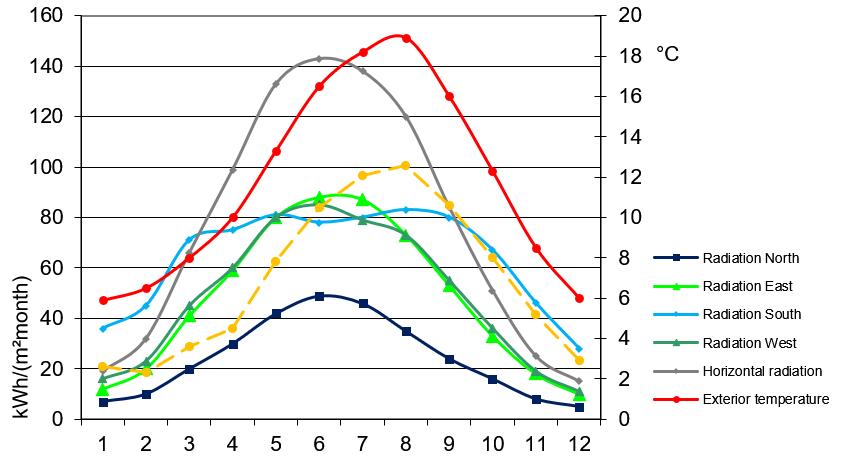
This chart illustrates London's monthly solar radiation and temperature change throughout the year. Solar radiation is significantly higher in the south than in other directions; June and July peak at 80 kWh/m², while the north side gets the least with around 50 kWh/m². The east and west sides have a similar pattern, reaching about 12 °C in summer and 2 °C in winter. To sum up, we can see that the south side has the highest solar gain and the North has the least. (The data from the chart above is provided from PHPP Version 9.6a)
Design Consideration
Solar consideration is crucial for Passivhaus design, enabling to achieve energy efficiency. Firstly, the building needs to be oriented to maximize solar gain, and with high-performance windows (double or triple glazing) to place around the building to capture sunlight in different seasons while minimizing heat loss. Secondly, a shading design to prevent overheating during summertime. Lastly, renewable technology can be placed on the roof to collect solar energy to generate electricity for the building. (Passivhaus Trust, 2015)
Figure 6. London Monthly solar radition and Temperature chart (Leon Sen,
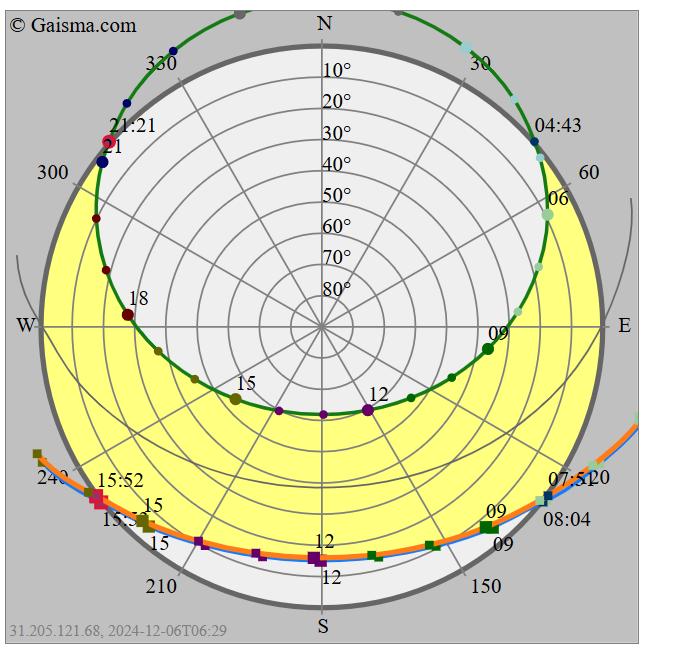
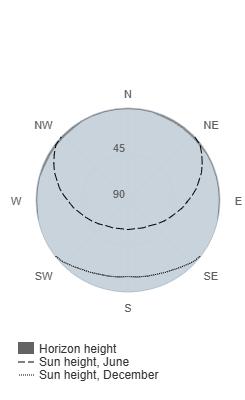
Figure 7. London Sun Path (GAISMA, 2024)
2.6 Seasonal and Diurnal Variations
Figure 8. Create by author, London seasonal temperture bar chart (Leon Sen, 2024)
The data above is based on Climate and Average Weather Year Round in London (Weather Spark, 2019), which shows the temperature across different times of day in London 2023 (7:00 morning, 12:00 Midday, and 23:00 night) on the representative dates (first day of the month) for the four seasons: Winter (January), Spring (April), Summer (July), and Autumn (October).
Seasonal Variations :
In Passivhaus design, seasonal variations significantly impact the building, and temperature needs to be balanced because of climate change throughout the year. In summer, while the temperature increases, seasonal shading design for the South, west, and east facades, natural ventilation or mechanical ventilation system, and thermal mass can reduce heat gain. During winter, keeping the building airtight is crucial. A high-performance insulation for walls, roof, and ground floor and an (MVHR) system can maintain indoor air quality and temperature and minimize energy loss. Furthermore, spring and autumn are more similar as the temperature is more stable, so shading and ventilation must put dynamic control into design consideration for them to fit in all seasons. (BRE, 2011)
Diurnal Variations :
Temperature and light change between morning and night, so maintaining indoor comfort and energy efficiency is crucial to avoid unwanted solar gains and such. In the daytime, the design has to maximize natural lighting to reduce artificial lighting with glazing in different building directions. Moreover, the temperature will generally drop at night, so using thermal mass to store heat can stabilize the indoor temperature. However, nighttime ventilation can cool the indoor temperature in warmer periods like summertime. (BRE, 2011)
3. Achieving the Passivhaus Standard
3.1 Building Design
The brief of this project is to design a simple two-storey residential building in London (Zone 1), use the Passivhaus Planning Package (PHPP) to meet the German standard of Passivhaus, and install renewable technology to meet the energy demand for achieving a Net Zero building.
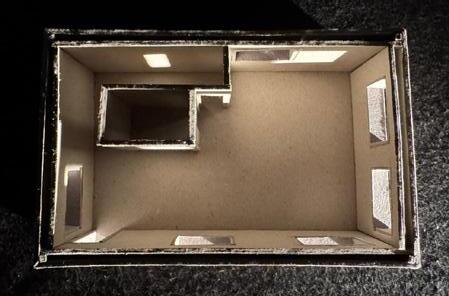
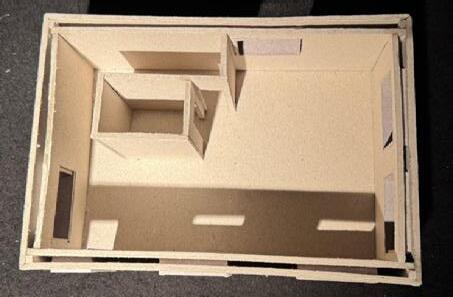
Firstly, it is essential to consider sustainable use with great energy performance in the space. Here is the space used for the building : (Kitchen, Dining area, Living room, Services room, Staircase, two Bedrooms, two Bathrooms, and a balcony). See Figure 9. for design details and Figure 10. for building layout.
The kitchen will be placed on the ground floor's northeast side to minimize overheating, and a window on the east side next to the kitchen for natural lighting (morning sunlight) and ventilation.
The dining area will be placed on the ground floor's north side next to the kitchen, sharing the east side lighting and a window behind the north wall for views to make the space more enjoyable.
The living room will be placed in front of the Kitchen and dining area, aligning to the southeast side. Three windows will be placed around the area for sunlight during the day, reduce heating demand in the winter, and provide views of the outdoor environment.
The services room will be placed under the stairs in the northwest corner of the ground floor, maximizing usable space for the living room. It will be close to the toilets and kitchen to minimize hot water delivery times, reducing heat loss in pipes and energy use.
An L-shaped staircase will be placed northwest to be more space efficient, and a window next to the stairs on the west wall for lighting, reducing the need for artificial lighting.
Both toilets will be placed in the corner of the L-shaped stairs on the ground and first floors, close to the service room, to minimize hot water delivery times, reduce heat loss in the pipe, and renergy use.
Both bedrooms will be placed on the first floor for safety concerns and privacy and will have access to the balcony. The main bedroom will be on the right side of the building, with east, south, and north sides for solar gain and natural lighting. The second bedroom is located on the southwest side of the building.
Balconey
The balcony will be placed on the southeast side corner of the building for views and natural sunlight and to provide a more efficient clothesline area.
Figure 9. Space used design detail (Leon Sen, 2024)
Figure 10. Floor plan layout
An open space layout on the ground floor creates a visually appealing environment, with natural lighting traveling through the space and creating an inclusive and accessible connection for the residents. The timber grille shading design for the balcony makes the space transparent but with privacy. Both bedrooms have two side windows that provide natural lighting, making the space more open and inviting.
3.1 Building Design
Figure 11. 1 : 50 Grounf Floor Setting out plan
Figure 12. 1 : 50 First Floor Setting out plan
3.1 Building Design
Figure 13. Section A-A Setting out Plan
Figure 14. Section B-B Setting out plan
3.1 Building Design
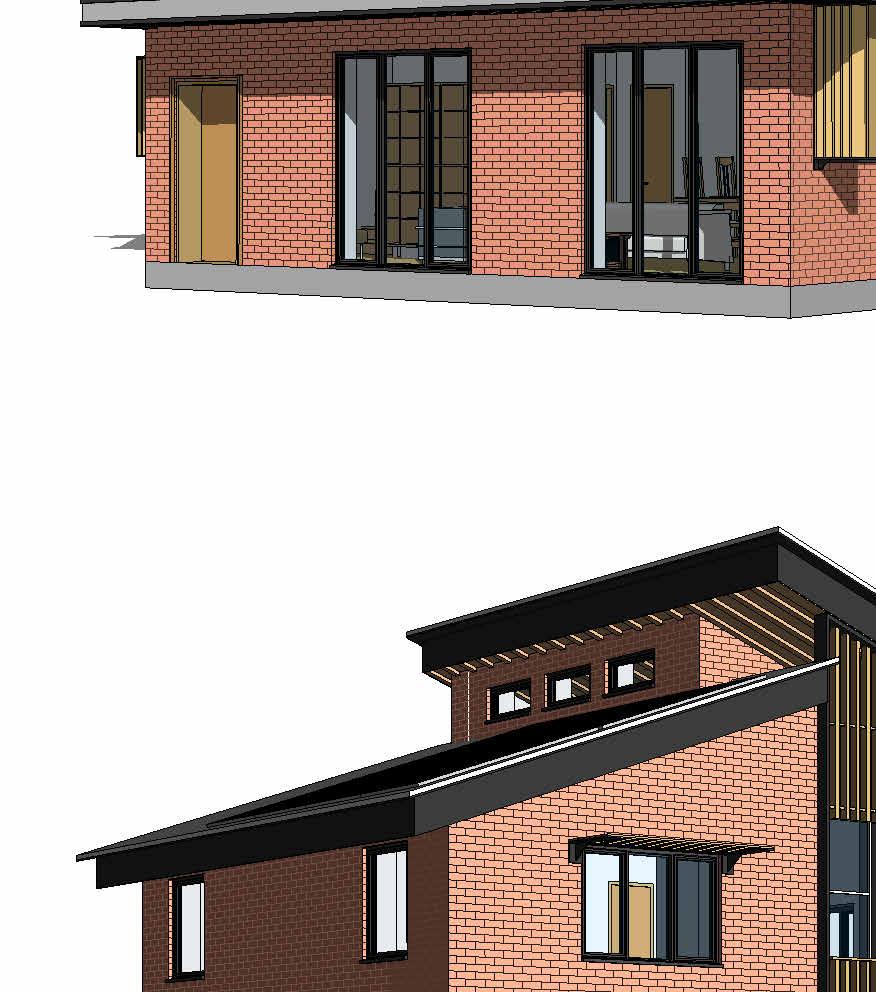
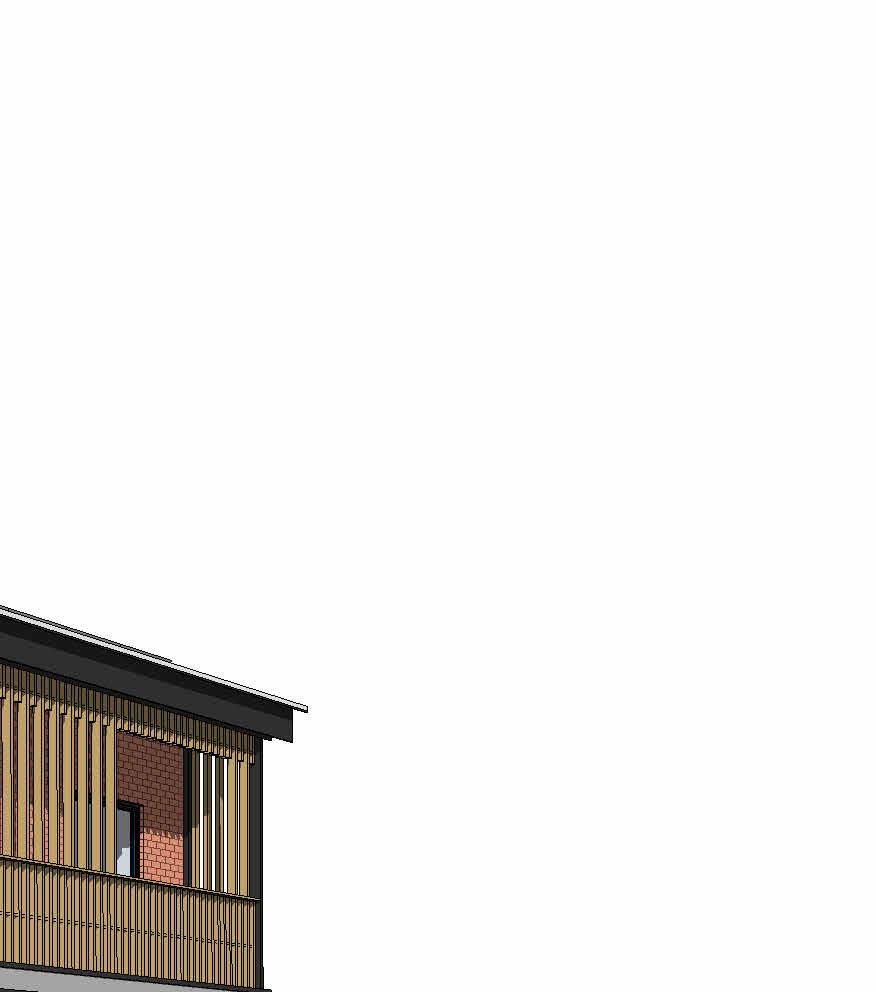
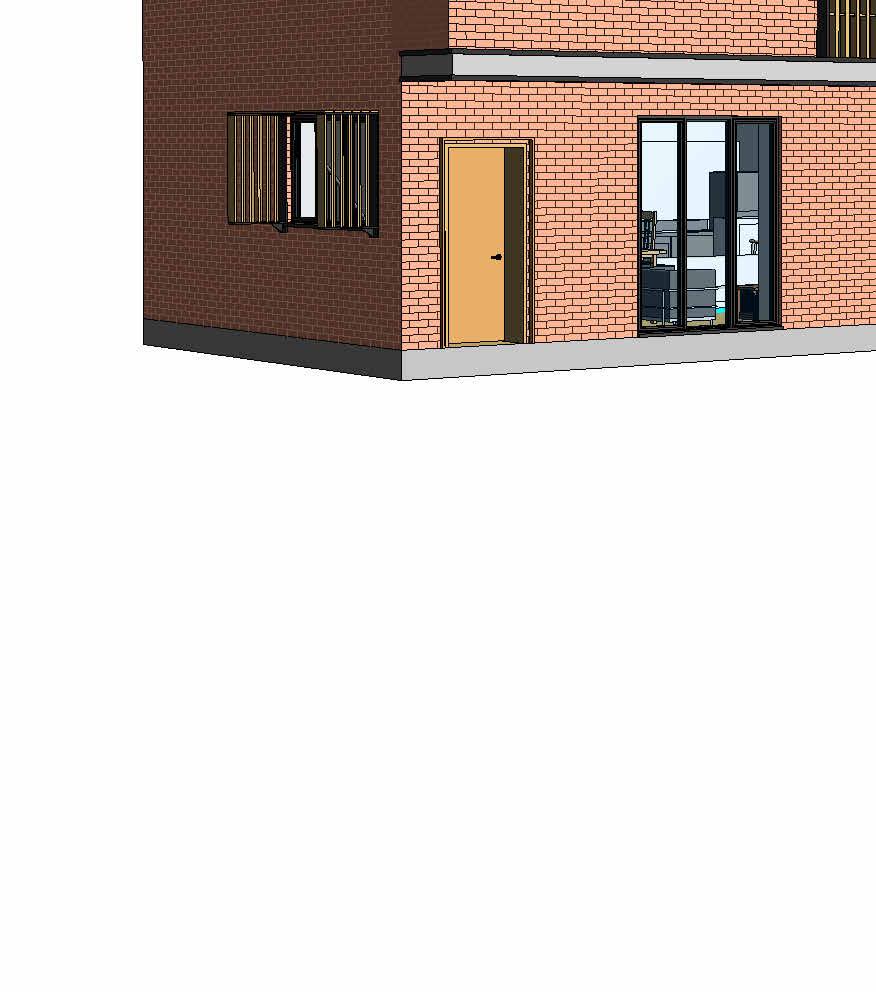
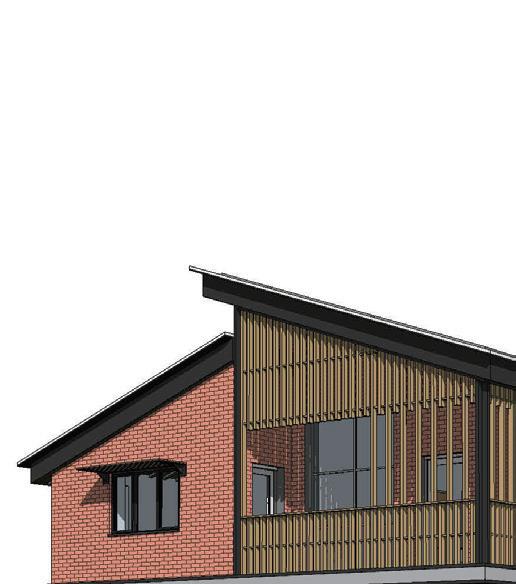
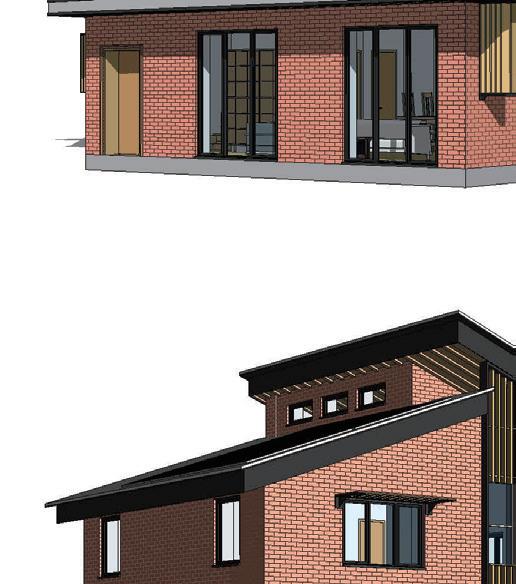
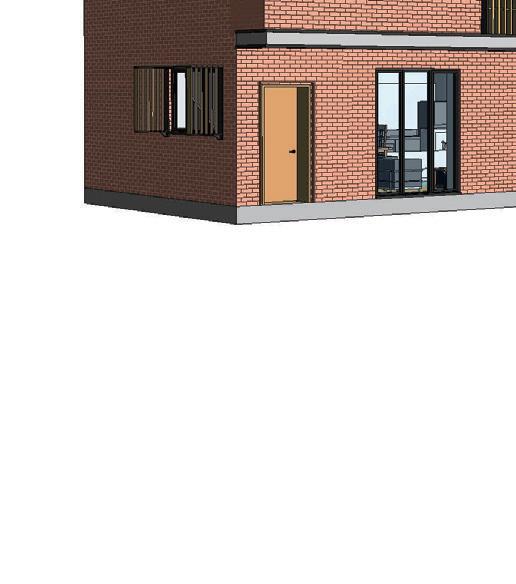
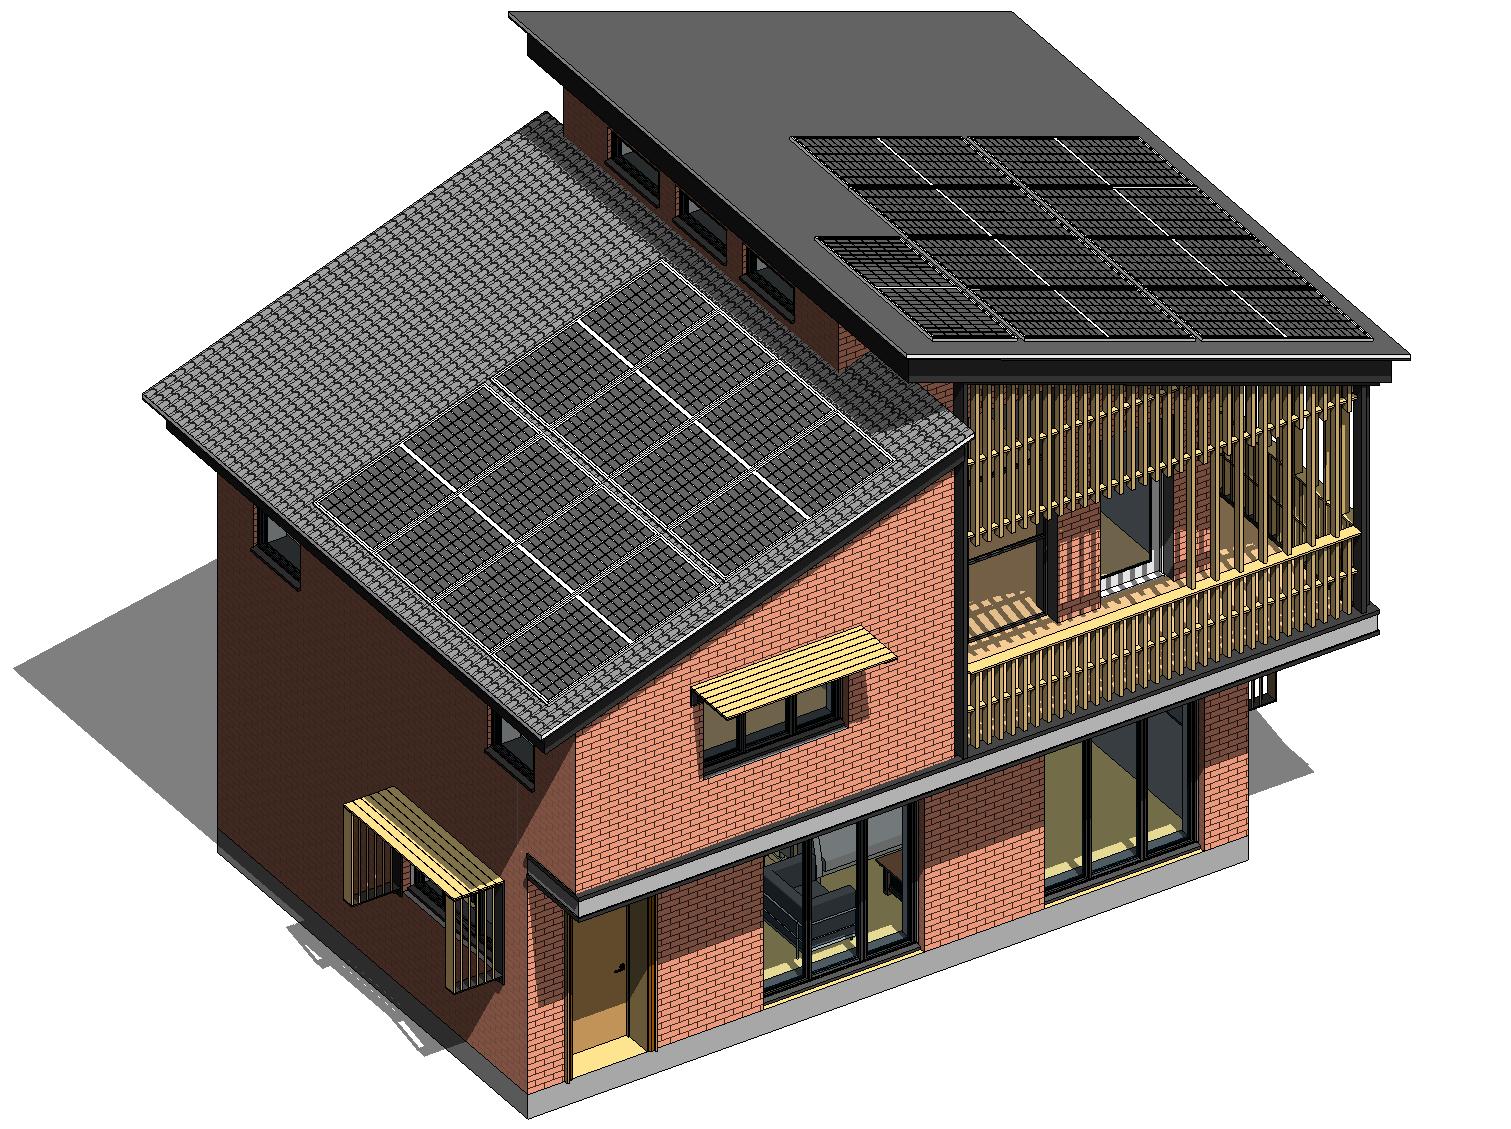
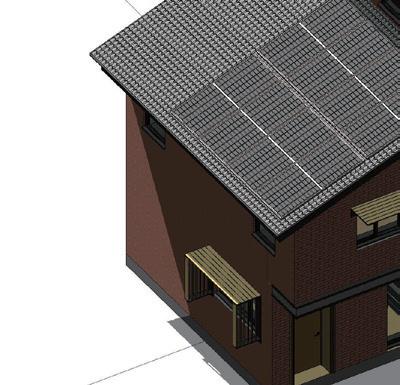
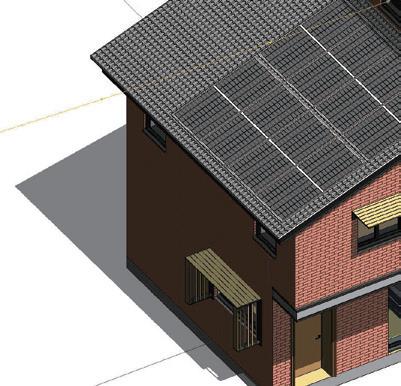
South East 3D View
South West 3D View
Figure 15. Building 3D View
3.2 Building Envelope (U-Value and Airtightness)
- Building envelope
The building envelope is the key for Passivhaus design to achieve extreme energy efficiency and thermal comfort. High thermal insulation in walls, roofs, floors, windows, and doors needs to achieve low U-values. Furthermore, Airtight construction, Solar shading, and Moisture control also need to be carefully designed.
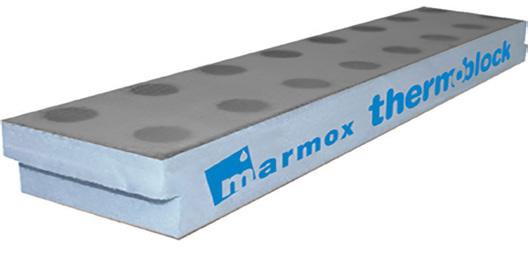
- Thermal Bridges
The geometric junctions and connections between elements typically create a route to heat loss and must be eliminated by using airtight strategy. The drawing below shows the common areas where thermal brideses can happen for this project.
Figure 16. Building envelope
Figure 17. Thermal Bridges
3.2 Building Envelope (U-Value and Airtightness)
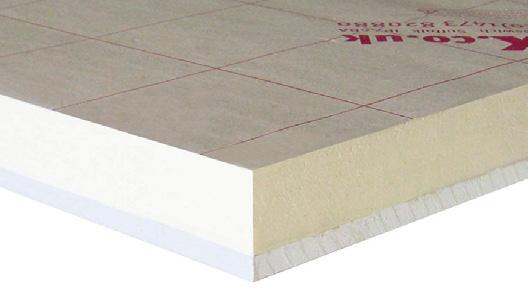
Material thermal transmittance in PHPP
PHPP is used to calculate the thermal transmittance of these elements when designing walls, floors, and roof detail layers under the Passivhaus standard. Thickness, thermal conductivity(λ), and resistance (R-value) of each material layer and internal/external surface resistances will be considered. The target of Passivhaus requires ≤0.15 W/m²K for walls, roofs, and floors. The above image shows the result of the PHPP sheet after design consideration. See (Figure 19.) on the next page for a detailed 1 : 10 section of airtightness and structural design.
of
Figure 18. PHPP U-value of building assemblies (Extracted from PHPP Version 9.6a)
3.2 Building Envelope (U-Value and Airtightness)
Key Material use Table
Airtightness
For walls, floors, and roof's airtightness design, a few critical areas require meticulous attention for airtight strategy : (wall-tofloor, wall-to-roof, window-to-wall, internal Plaster layer, and service penetrations). See Figure 14. for clarity.
SIGA Airtight Tape
-Windows in PHPP
PHPP is used to calculate Thermal performance (U-Value), Solar Gains (g-Value), Ventilation, Heat recovery, Thermal comfort, and Placement of windows. See details of the window (size, orientation, position, and glazing/frame performance) in the PHPP sheet below.
Figure 20. Window data ((Extracted from PHPP Version 9.6a)
- Passive Airflow
Figure 21. Passive Airflow
Open windows provide natural ventilation as fresh air enters the building (air exchange and crossventilation) to achieve passive cooling in hot conditions. A Passivhaus airtight strategy must be designed to ensure that passive airflow functions as designed; see Figure 19. for airtight details.
3.4 PHPP Calculations and Services (MVHR
and DHW system)
MVHR System layout
The MVHR layout plan below shows the unit location and duct runs for supplying fresh filtered air into habitable rooms (Living room, Dining room, and Bedrooms). The extracted air will be passover to a heat exchanger in the MVHR unit, where the heat in the extracted air will be removed and used to heat incoming air.
Figure 22. MVHR System layout
3.4 PHPP Calculations and Services (MVHR and DHW system)
- DHW
A Passive House Domestic Hot Water (DHW) system can efficiently provide water heating and minimize heat loss during water delivery through pipes for the building. After the PHPP calculation, the annual energy demand for DHW is 1220 kWh/ year, demonstrating a low energy demand that aligns with Passivhaus principles of sustainability system performance.
- Energy demand
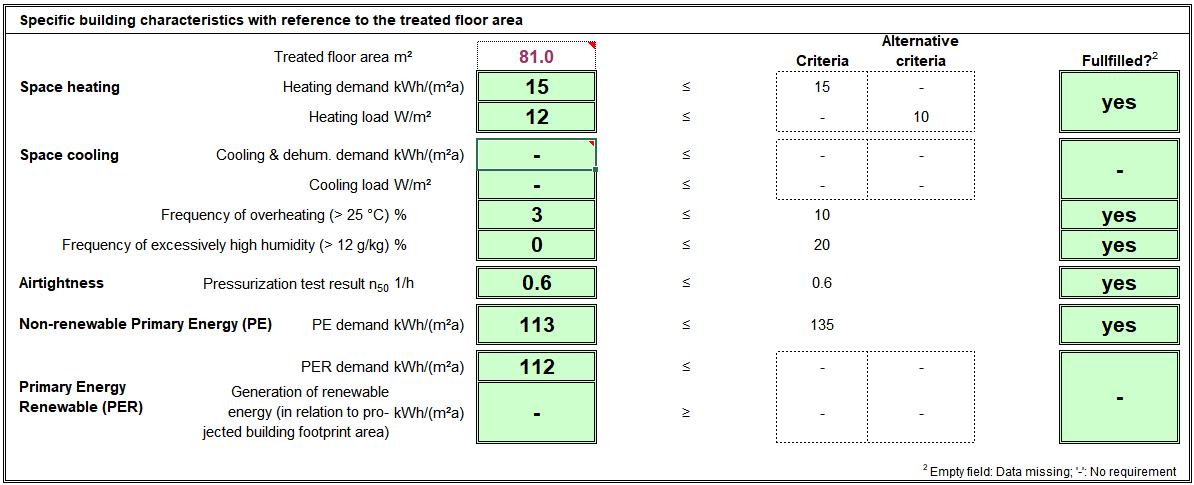
After meeting the Passivhaus standard for building elements, checking PHPP for energy balance and annual energy demand is the next step to certifying PHPP. In Figure 16, the diagram shows a higher heat gain (44.4 kWh/m2/year) than heat losses (21.1 kWh/m2/year), and the heating demand also matches the Passivhaus standard of 15 kWh/m2/year.
Figure 23. Energy balance heating (Extracted from PHPP Version 9.6a)
Figure 24. PHPP Verification (Extracted from PHPP Version 9.6a)
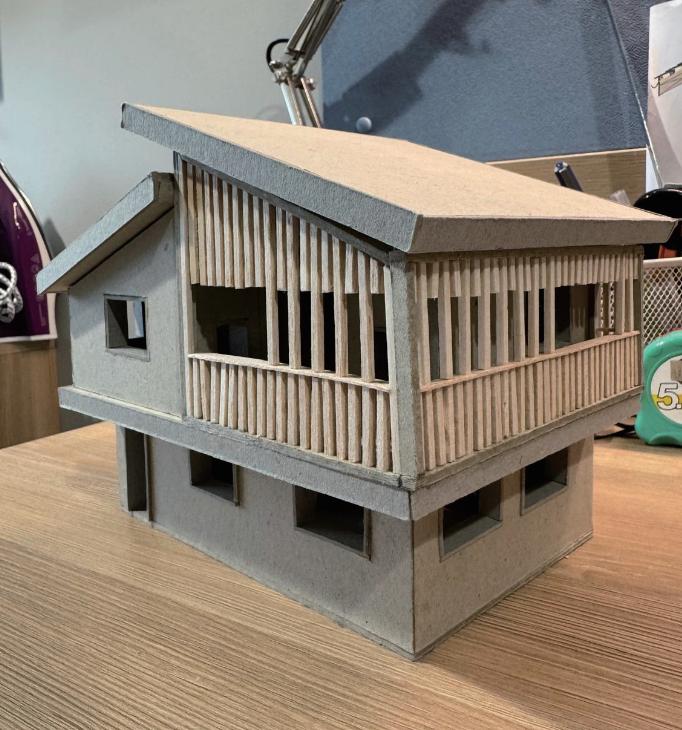
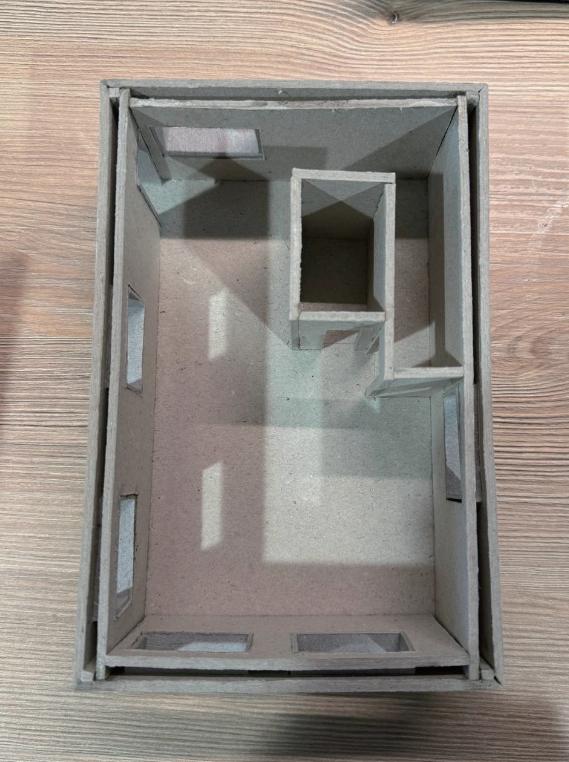
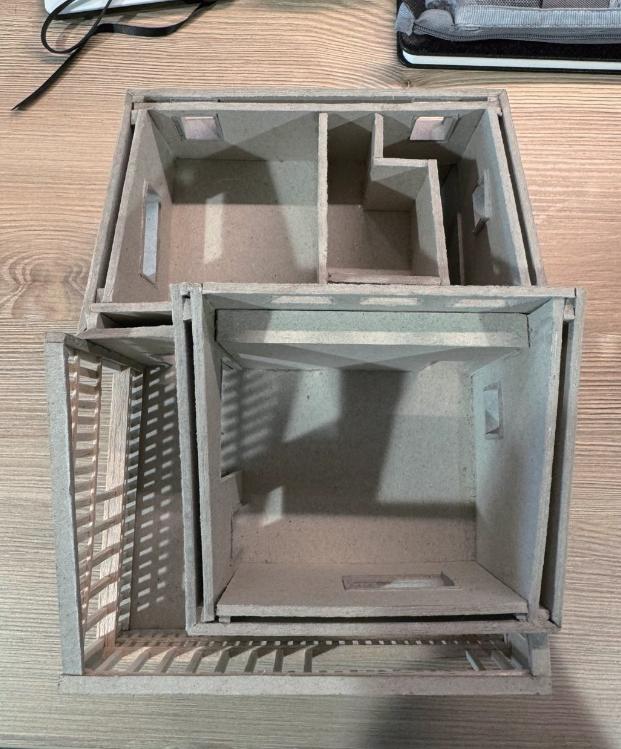
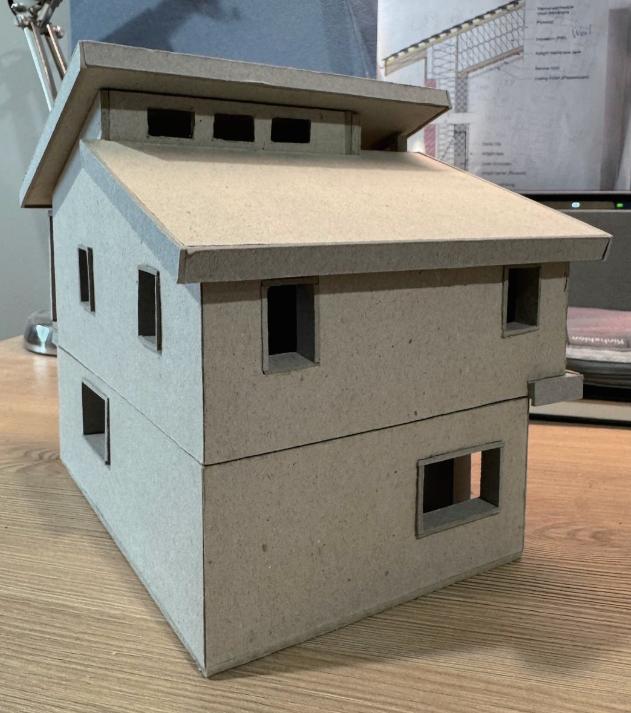
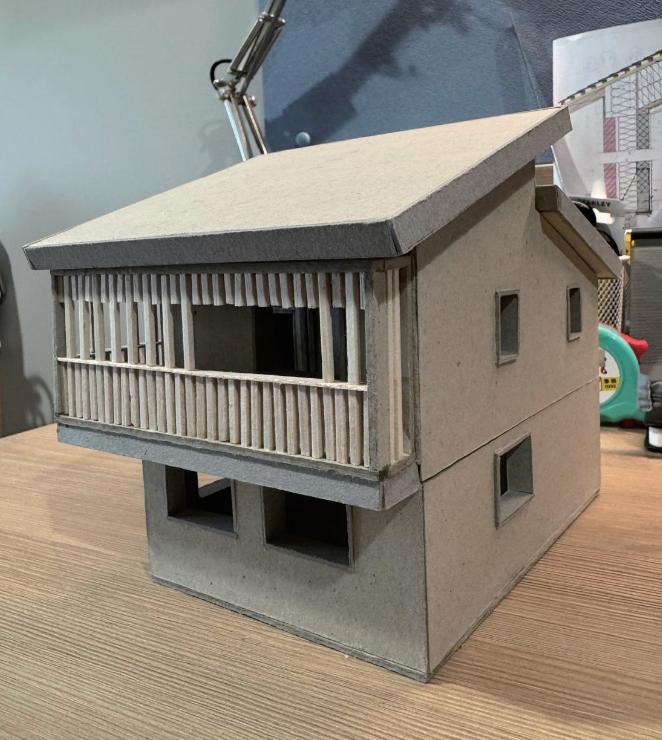
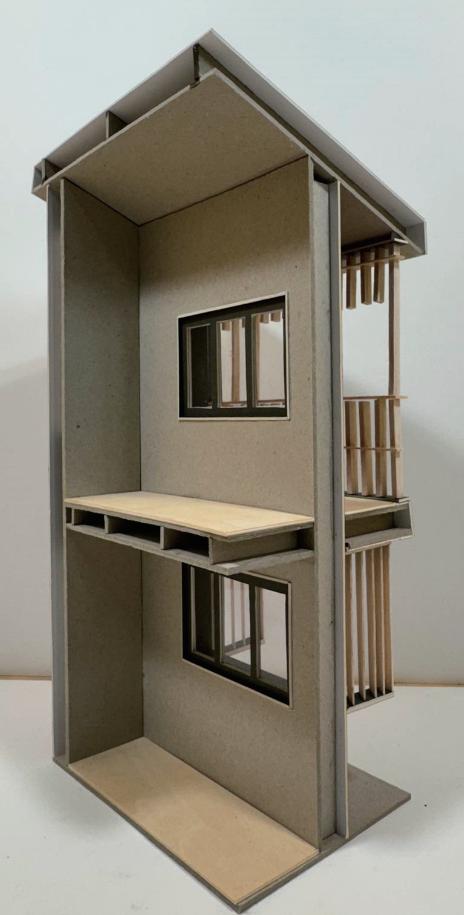
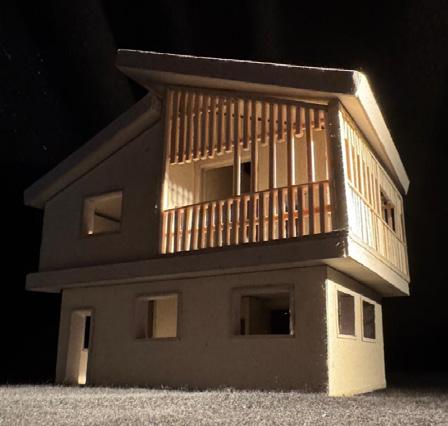
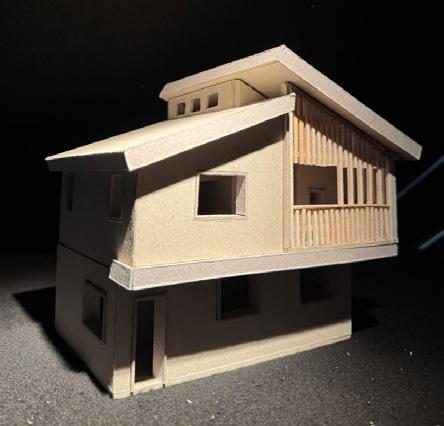
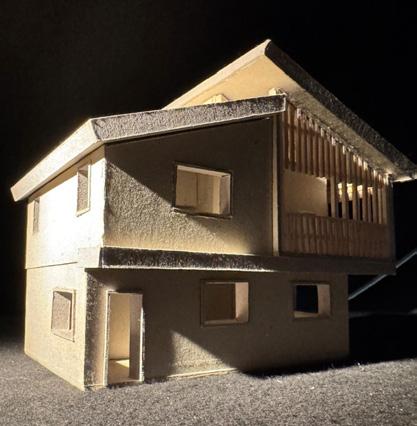
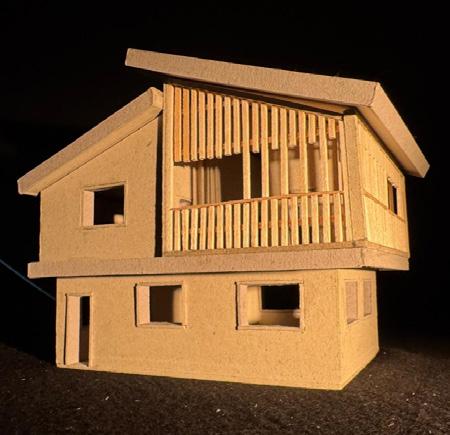
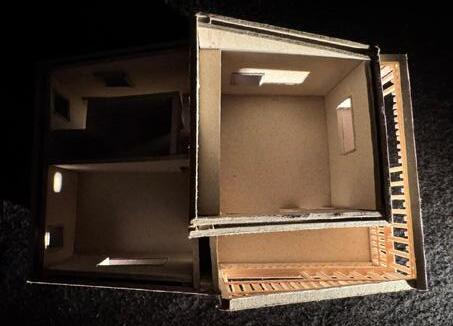
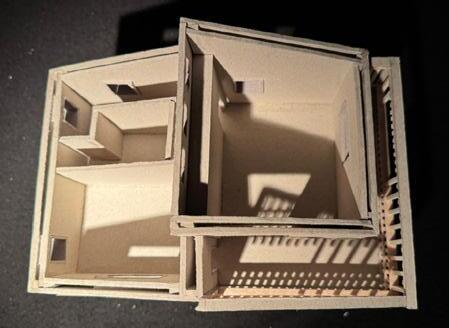
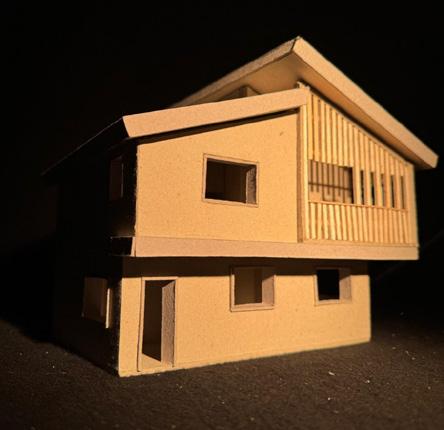
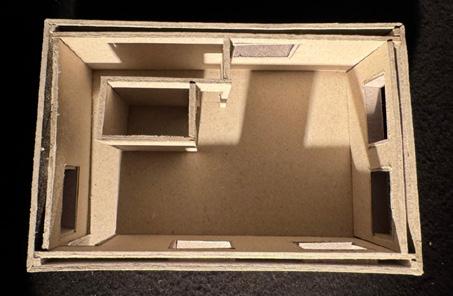
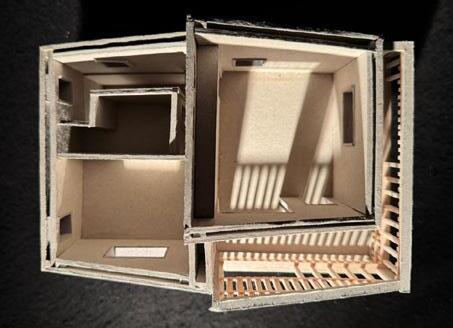
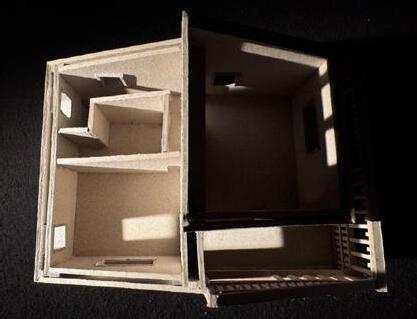
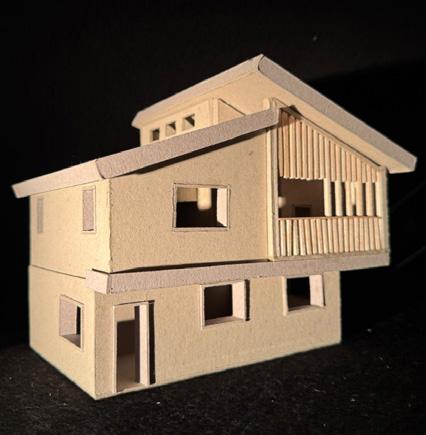
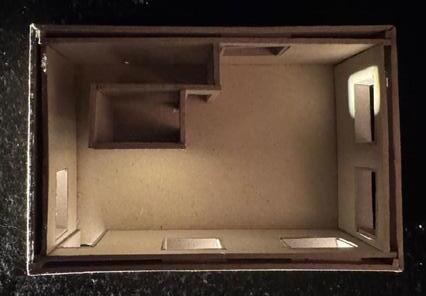
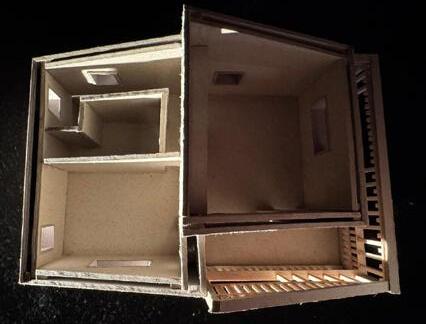
3.5 Physical Model and Shading Design
Figure 25. 1 : 50 Physical Model
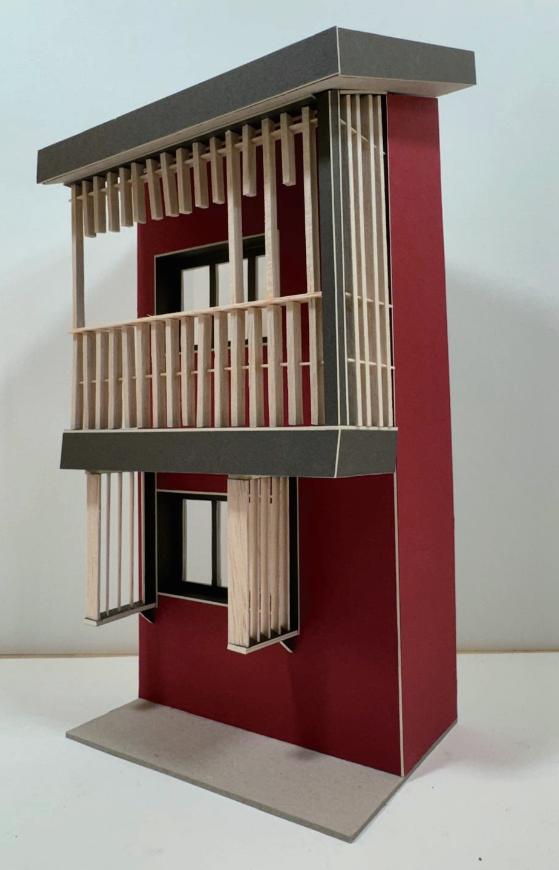
Figure 26. 1 : 20 Physical Detail Shading Section Model
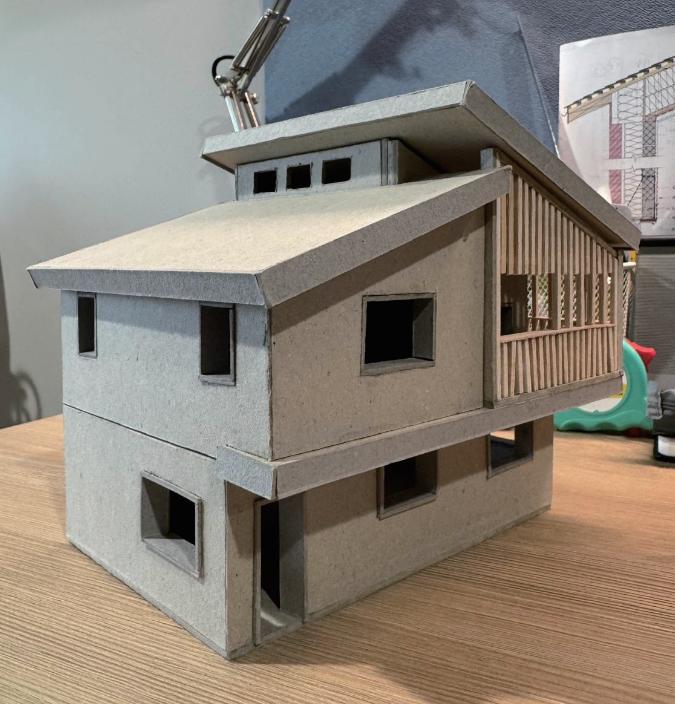
3.5 Physical Model and Shading Design
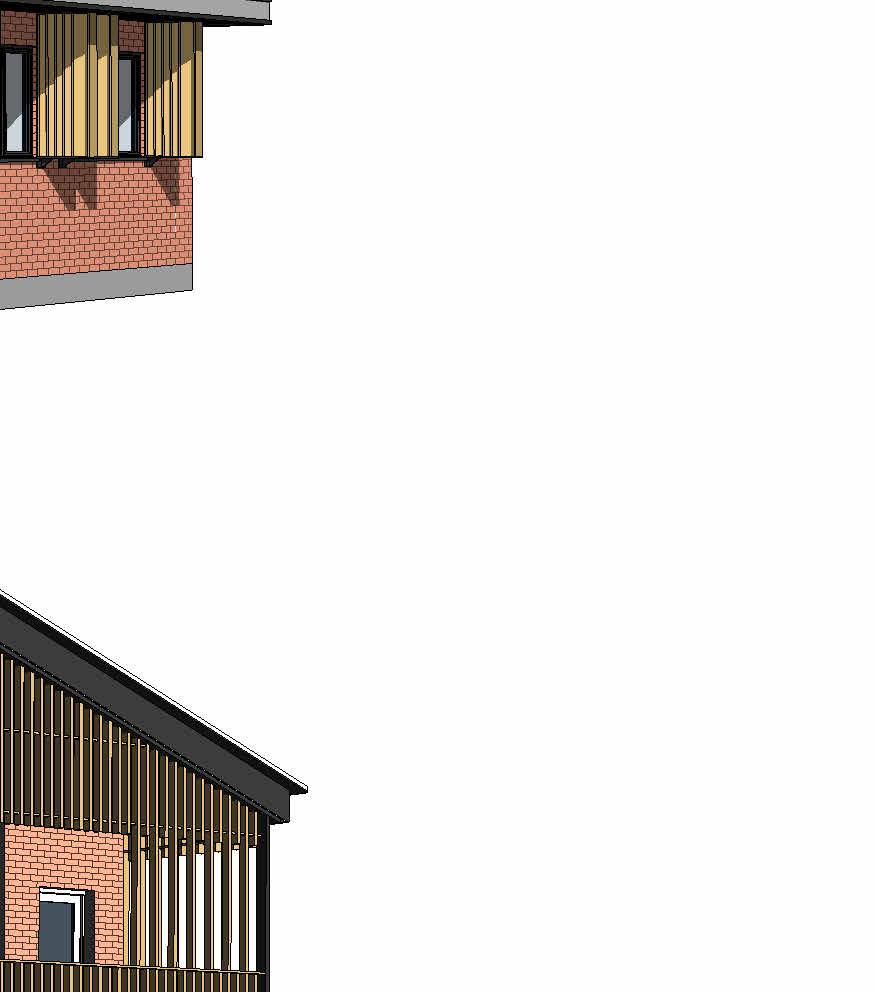
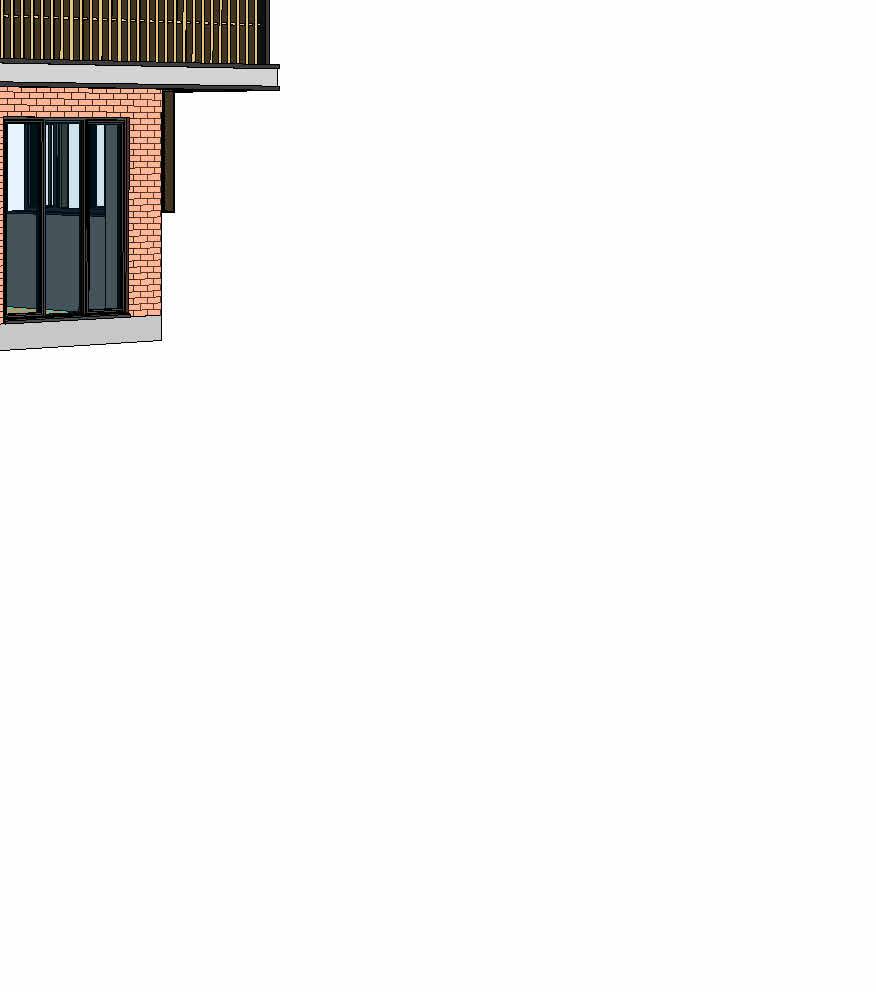
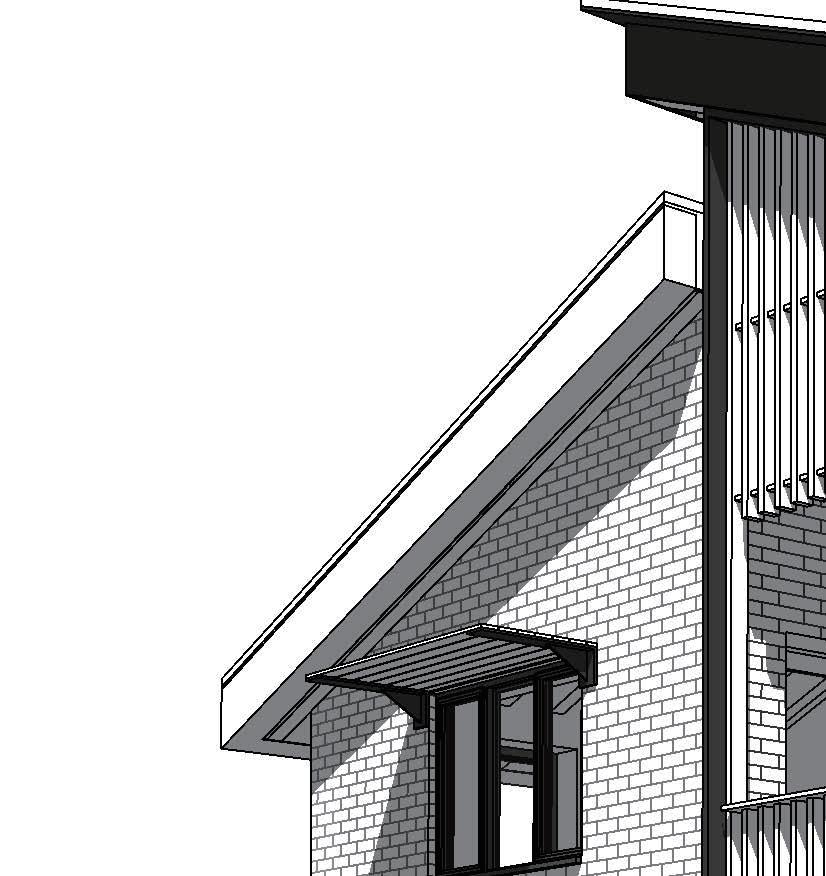
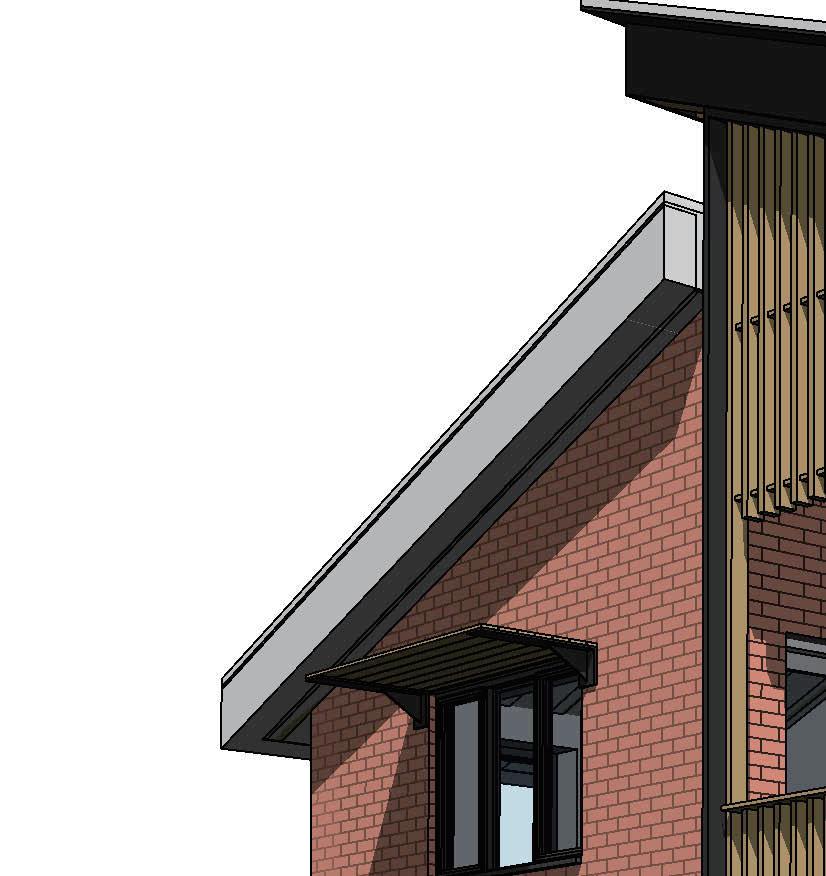
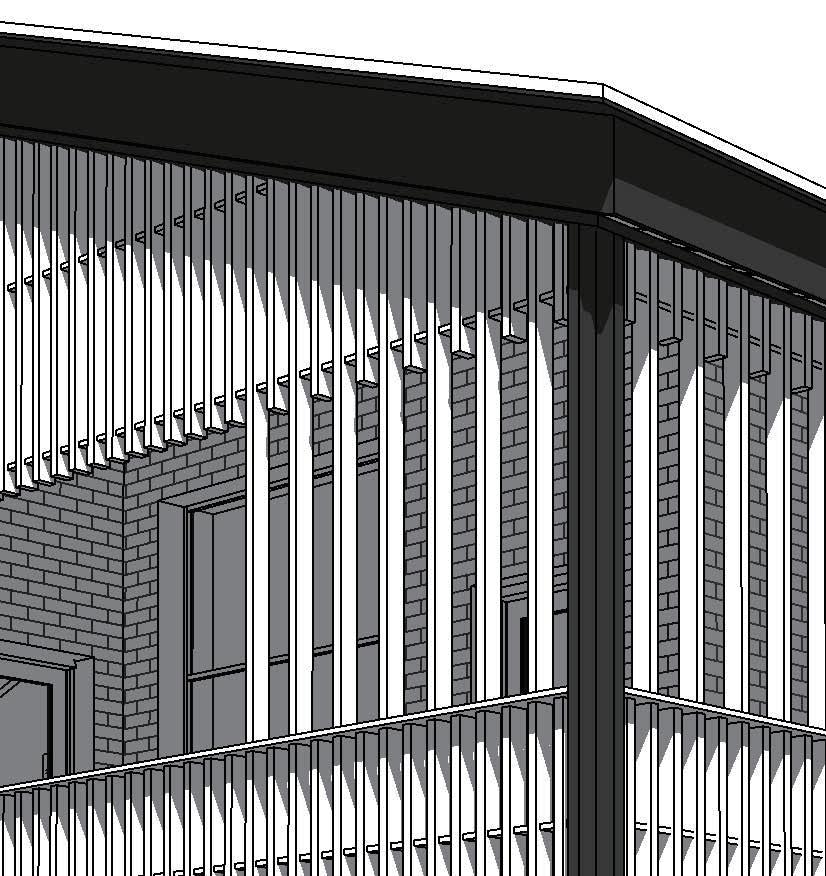
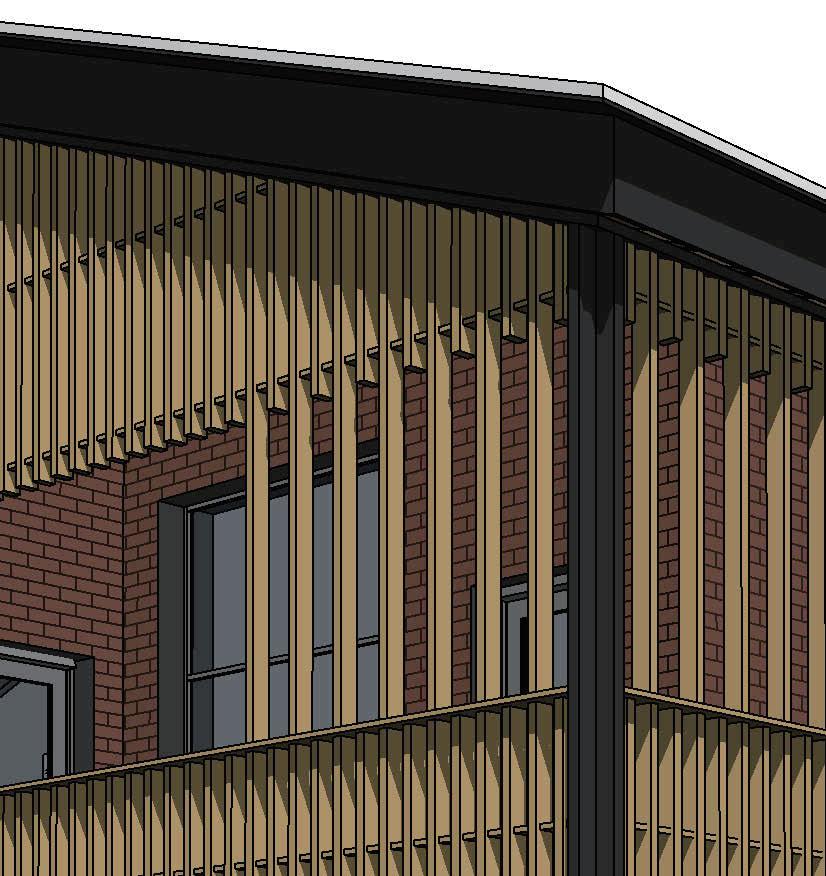
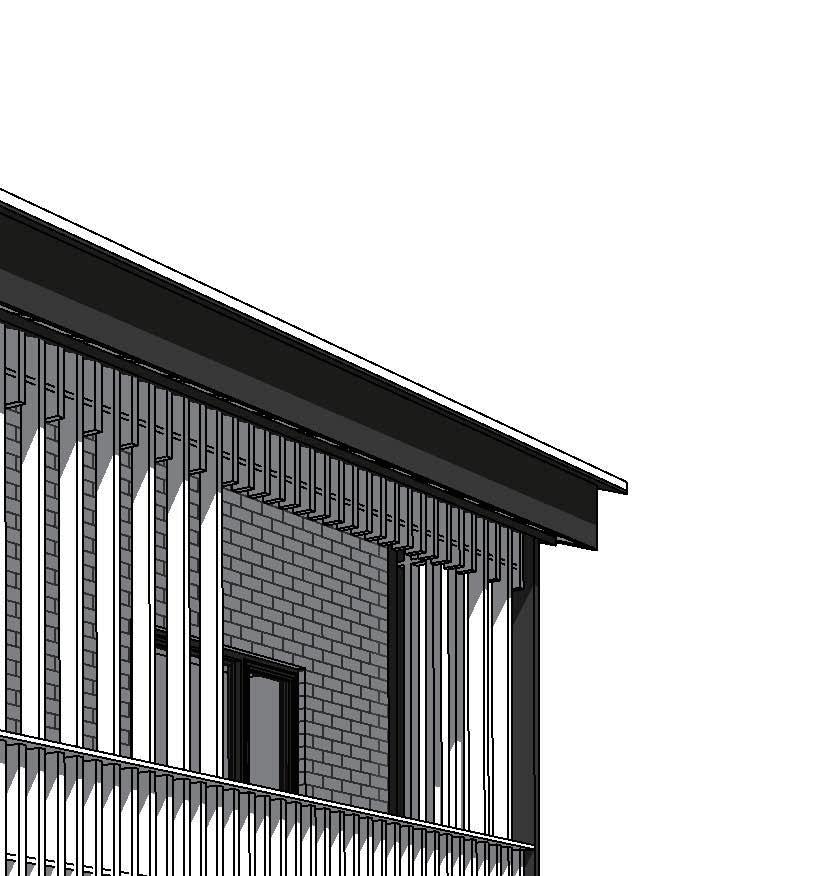
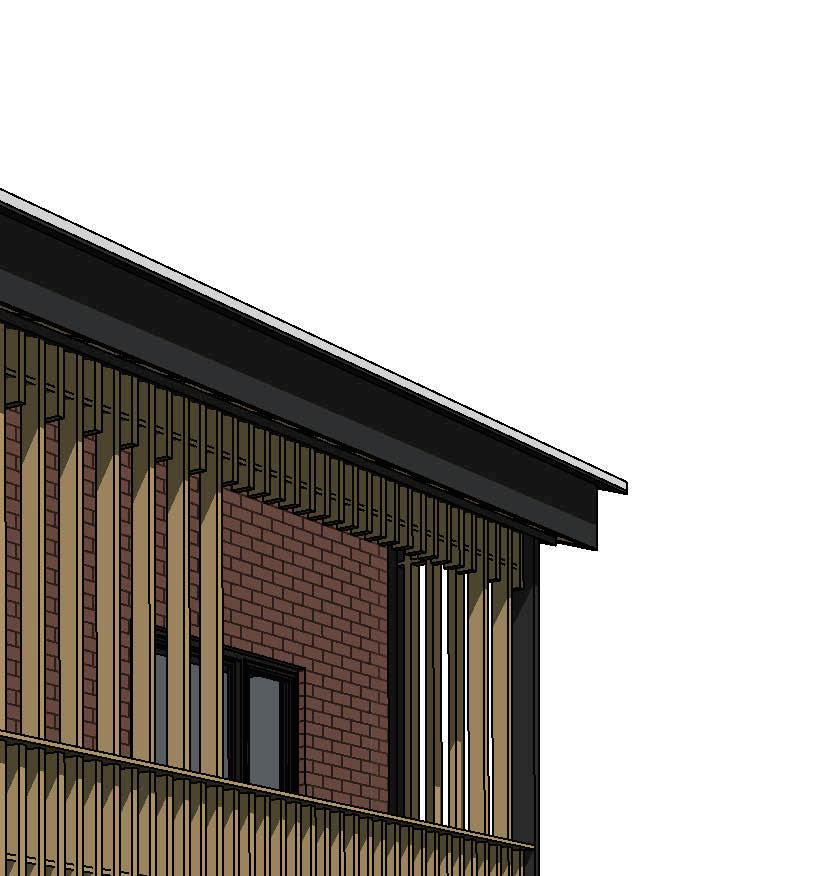
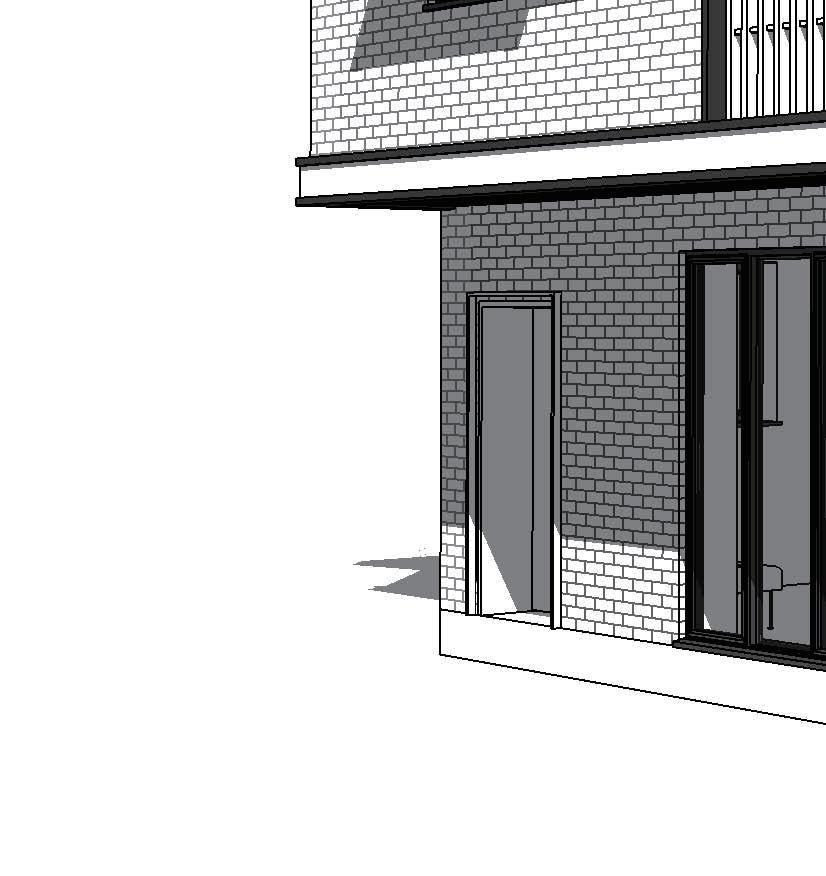
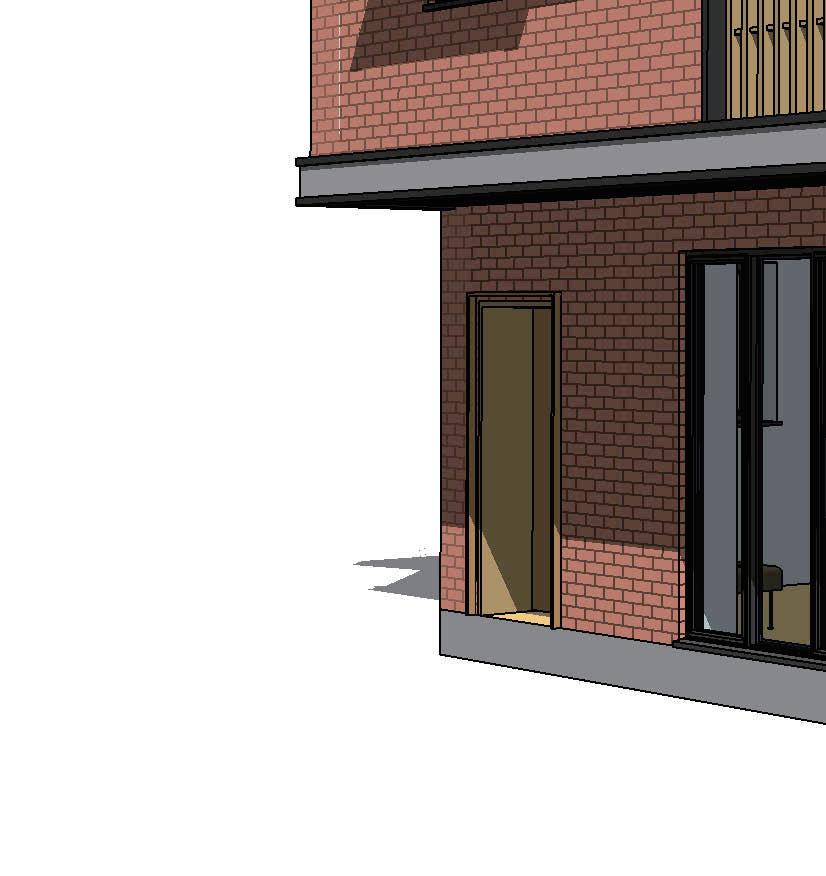
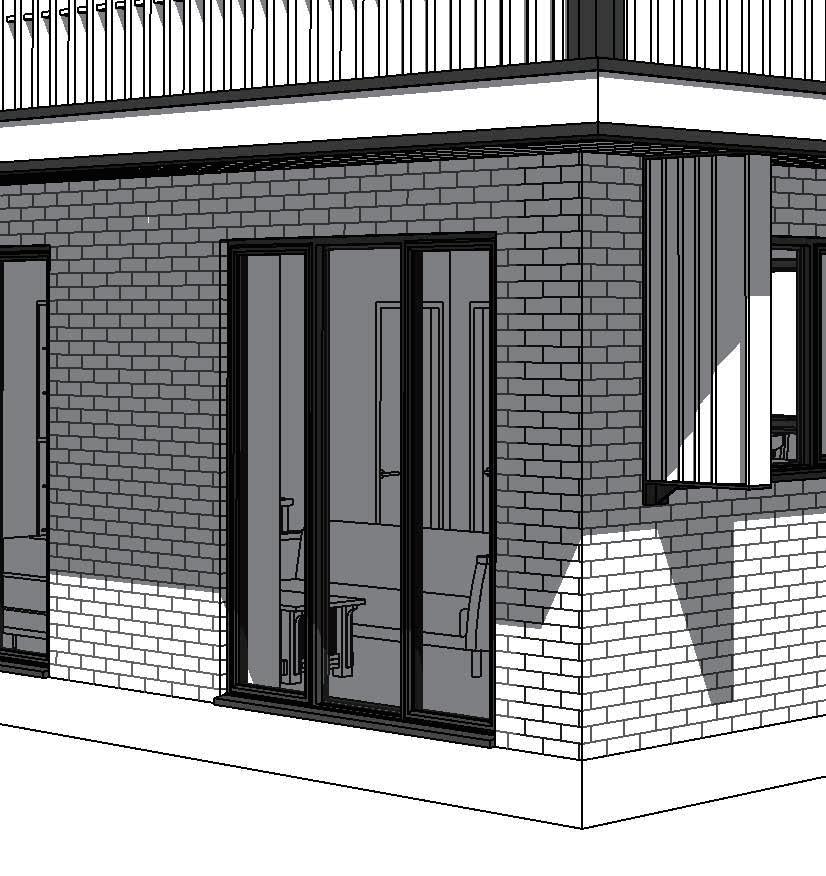
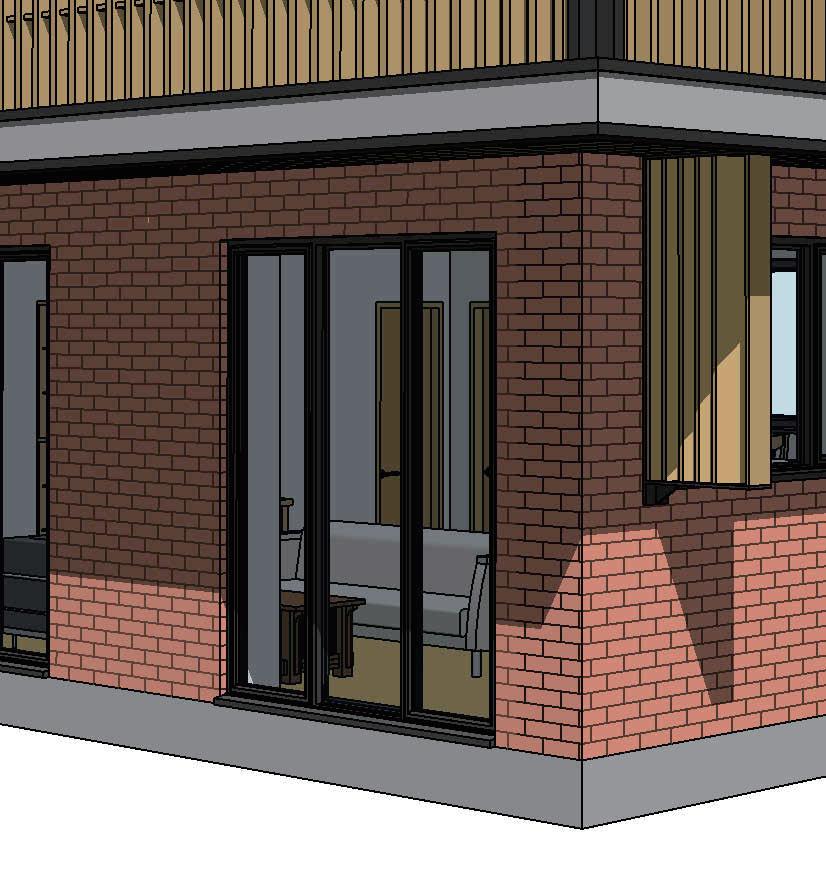
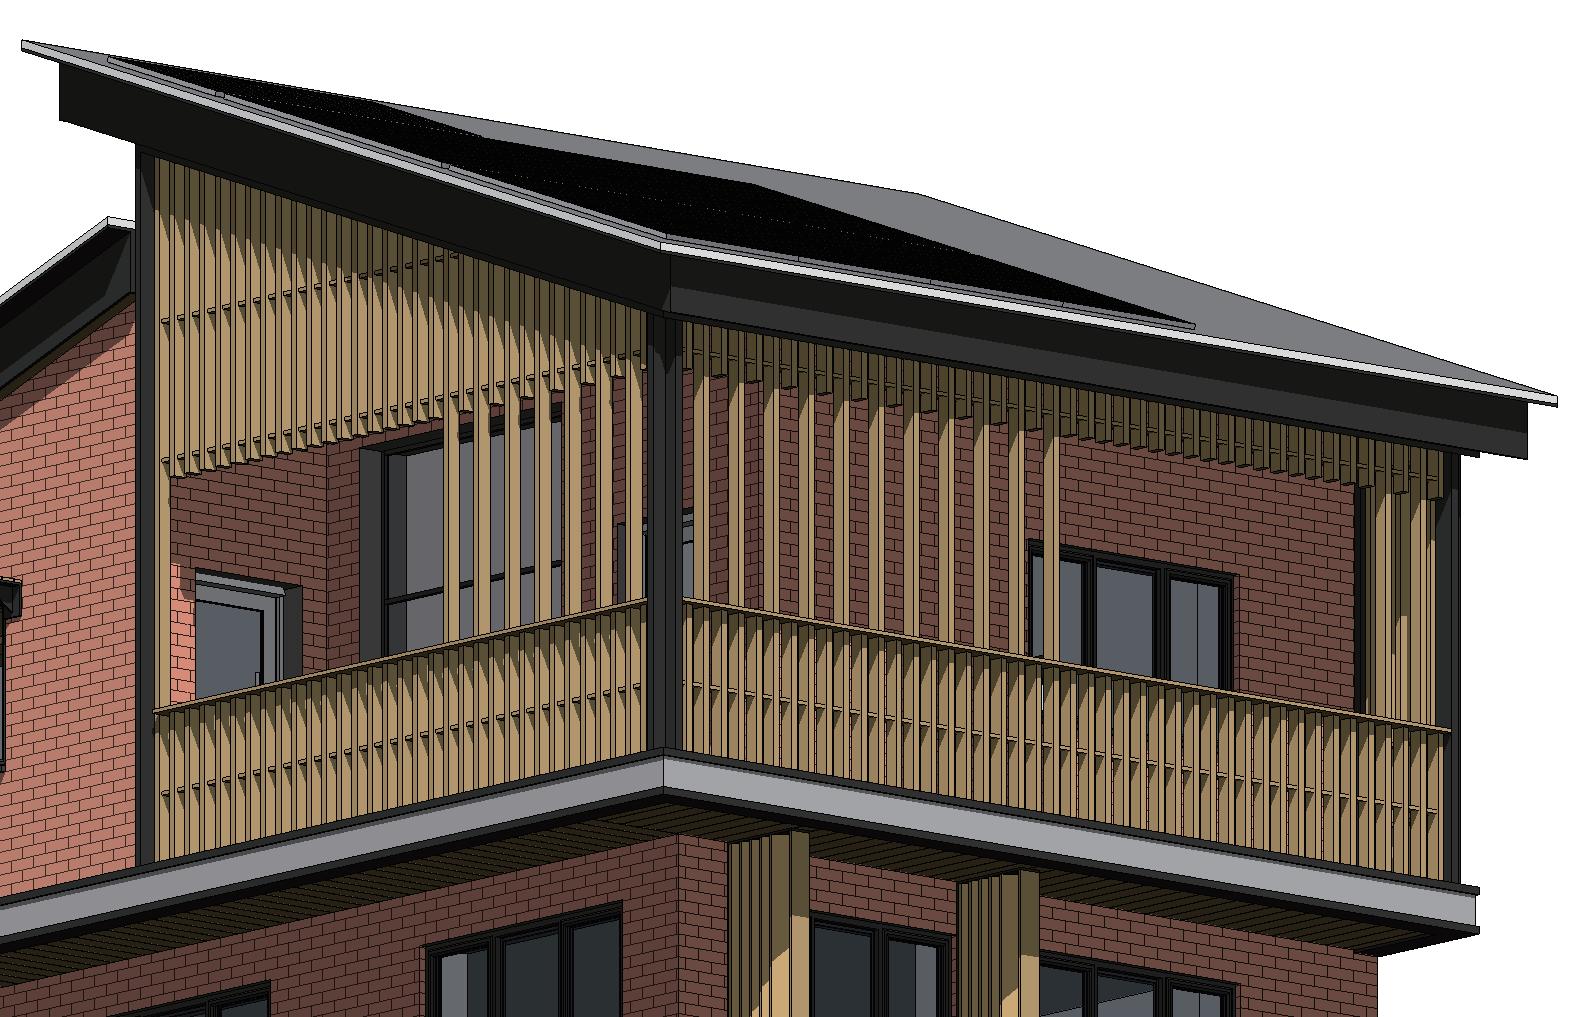
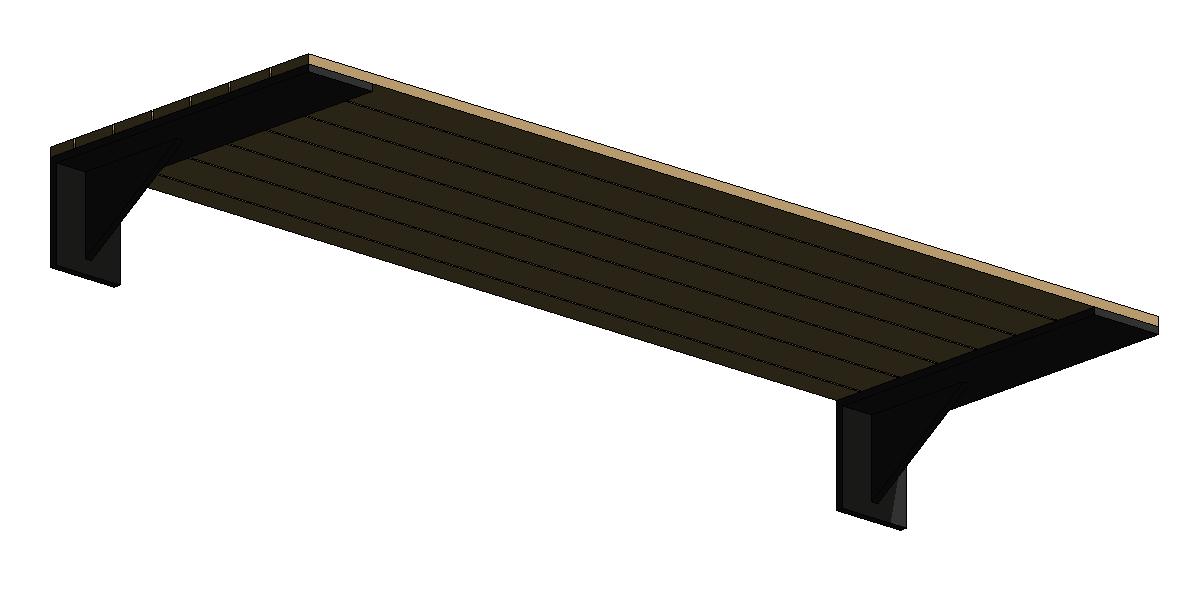
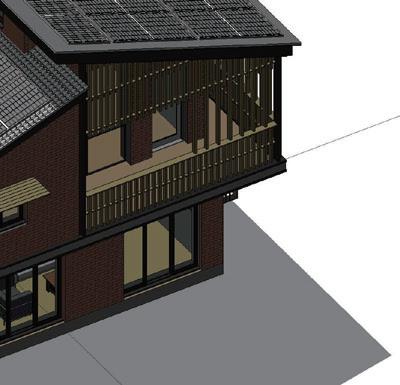
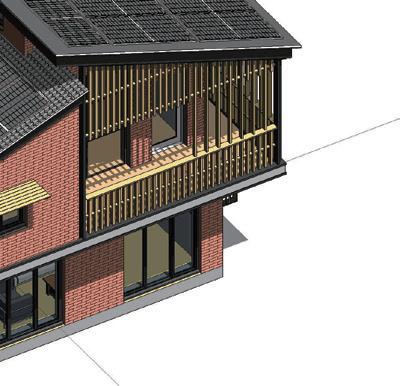
A rectangular blade timber brise shading design and an overhang of the firstfloor extension to shade the ground floor south/east face window reduce summer overheating.
Figure 27. 3D Model Shading design highlight
Figure 28. Balconey & Ground Flooor Shading
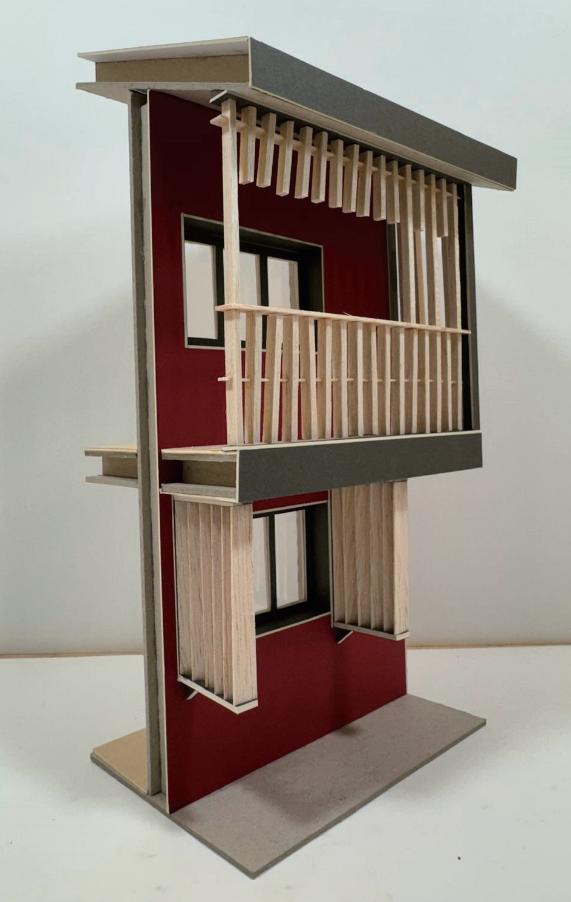
3.5 Physical Model and Shading Design
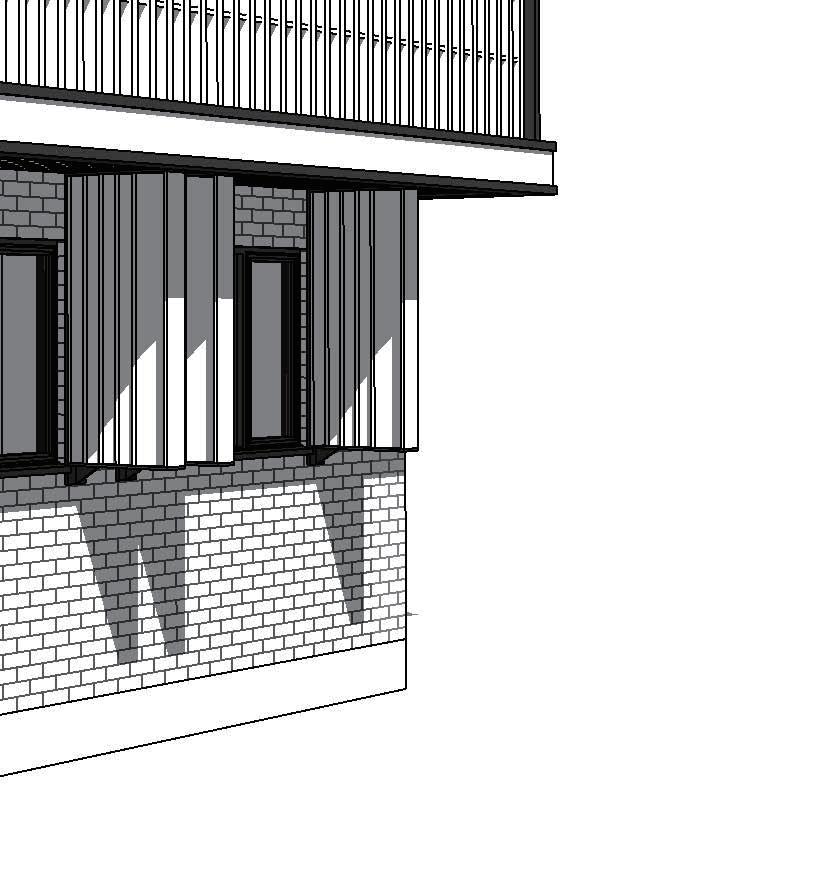
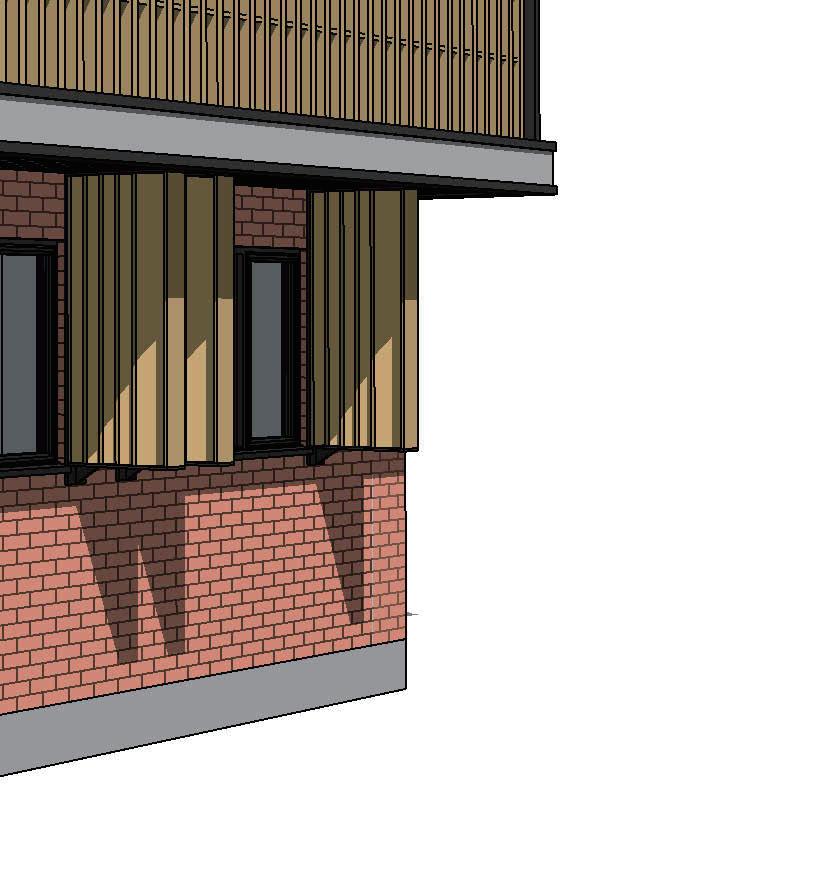
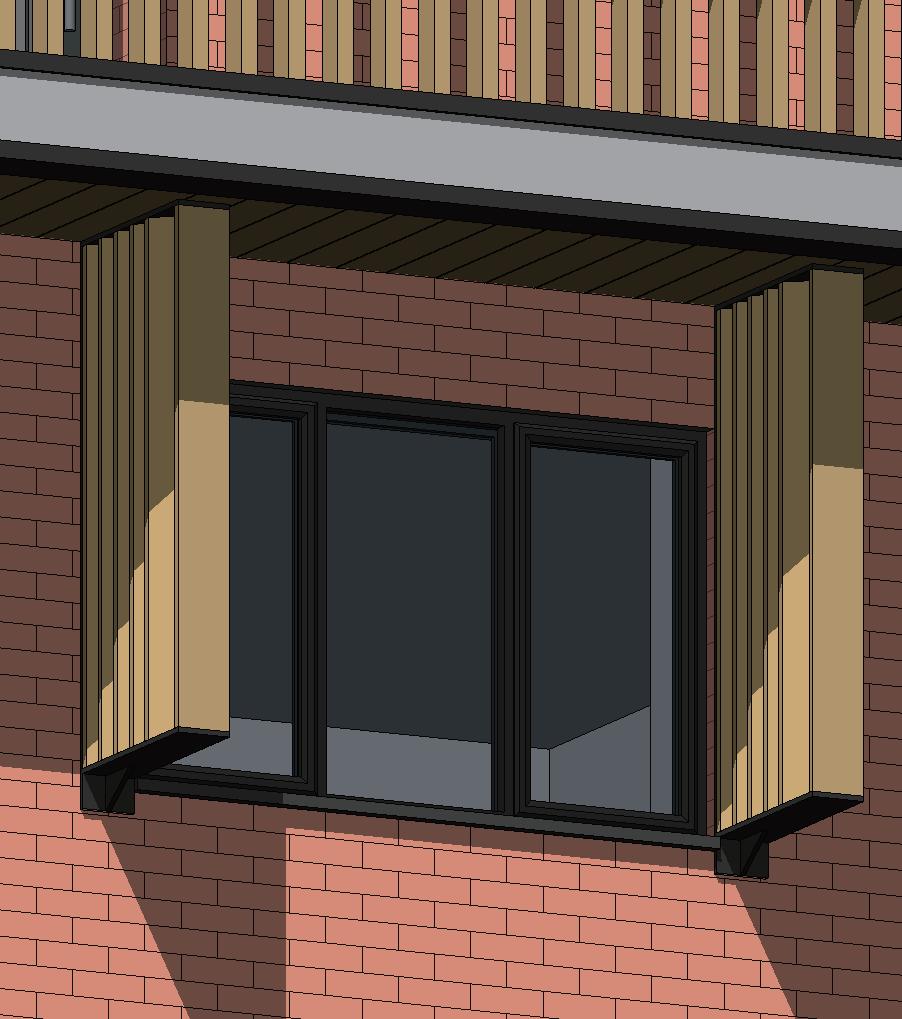
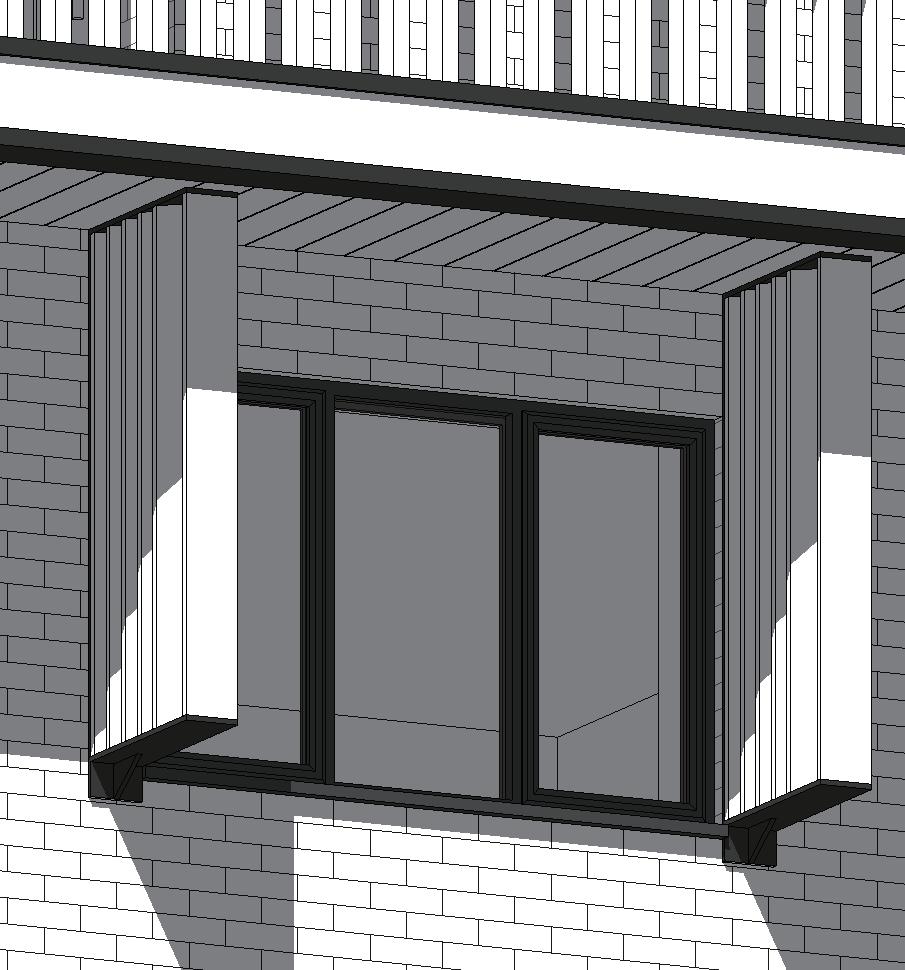
Mix use of first floor overhang with vertical timber canopy for ground floor east side shading.
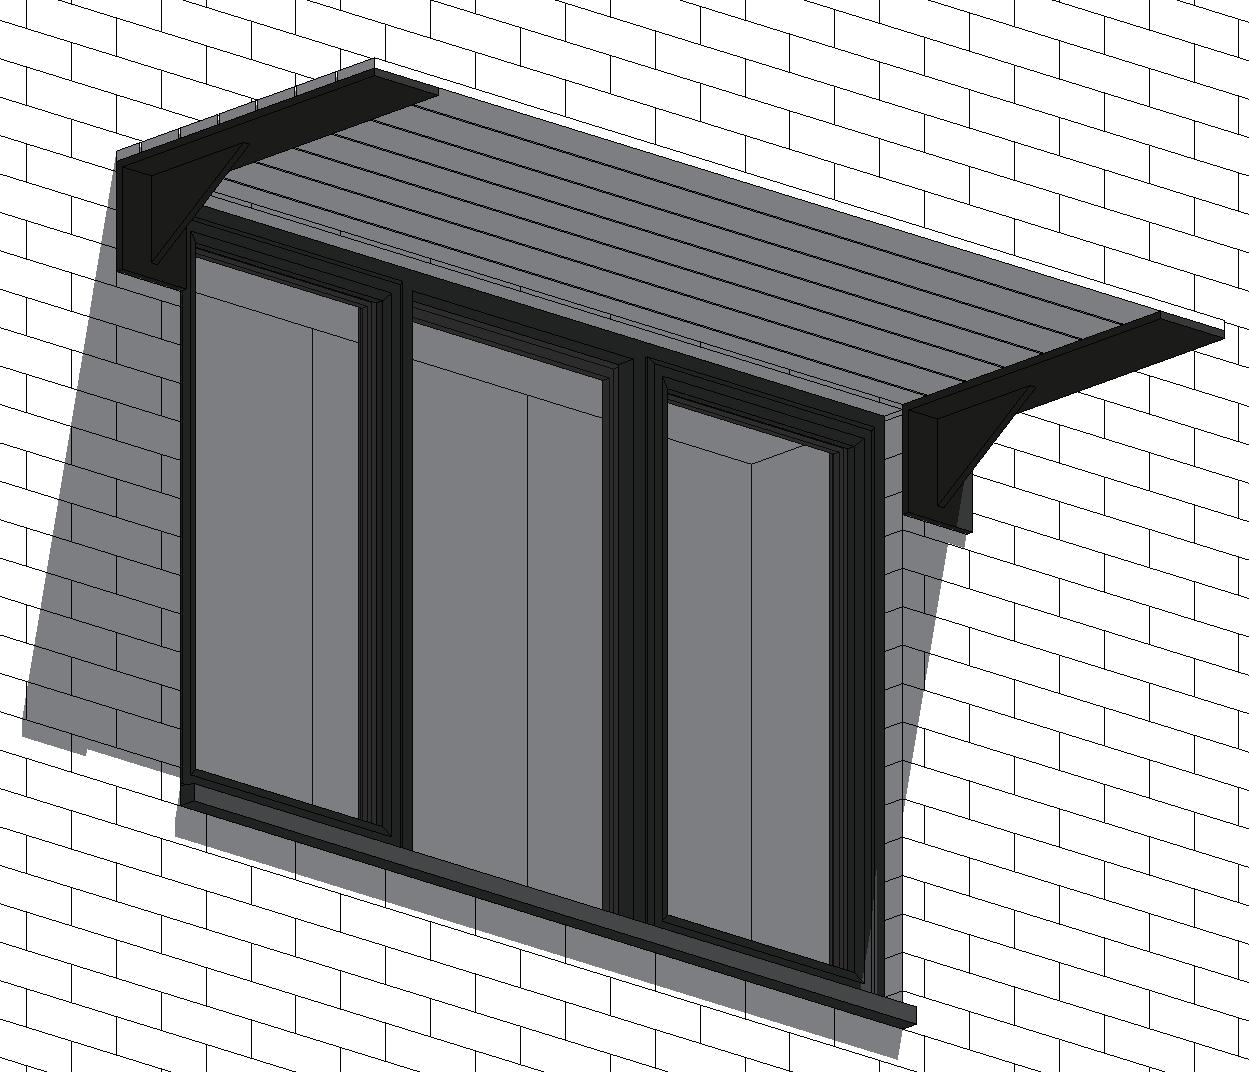
Horizantal timber canopy for first floor south side shading.
Figure 29. East Face Ground Floor Window Shading
Figure 30. South Face Second Floor Window Shading
3.5 Physical Model and Shading Design
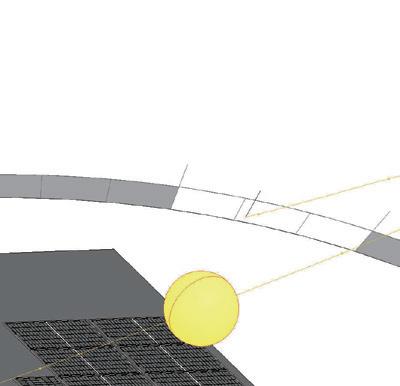
- London seasonal sun direction test with Heliodon
Season Morning 7:00 Midday 12:00 Night 6:00
Summer (July)
Winter (January)
Figure 31. Heliodon shading test in two extream temperture during the season
4. 1 Renewable Technologies
Installing renewable technology into the design is essential to achieve a net zero building. Renewable energy can produce energy from direct and indirect effects on the Earth to generate power sustainably. Technology like heat pumps, solar PV, and wind turbines can help cover the gas and electricity demand and reduce the building's carbon emissions.
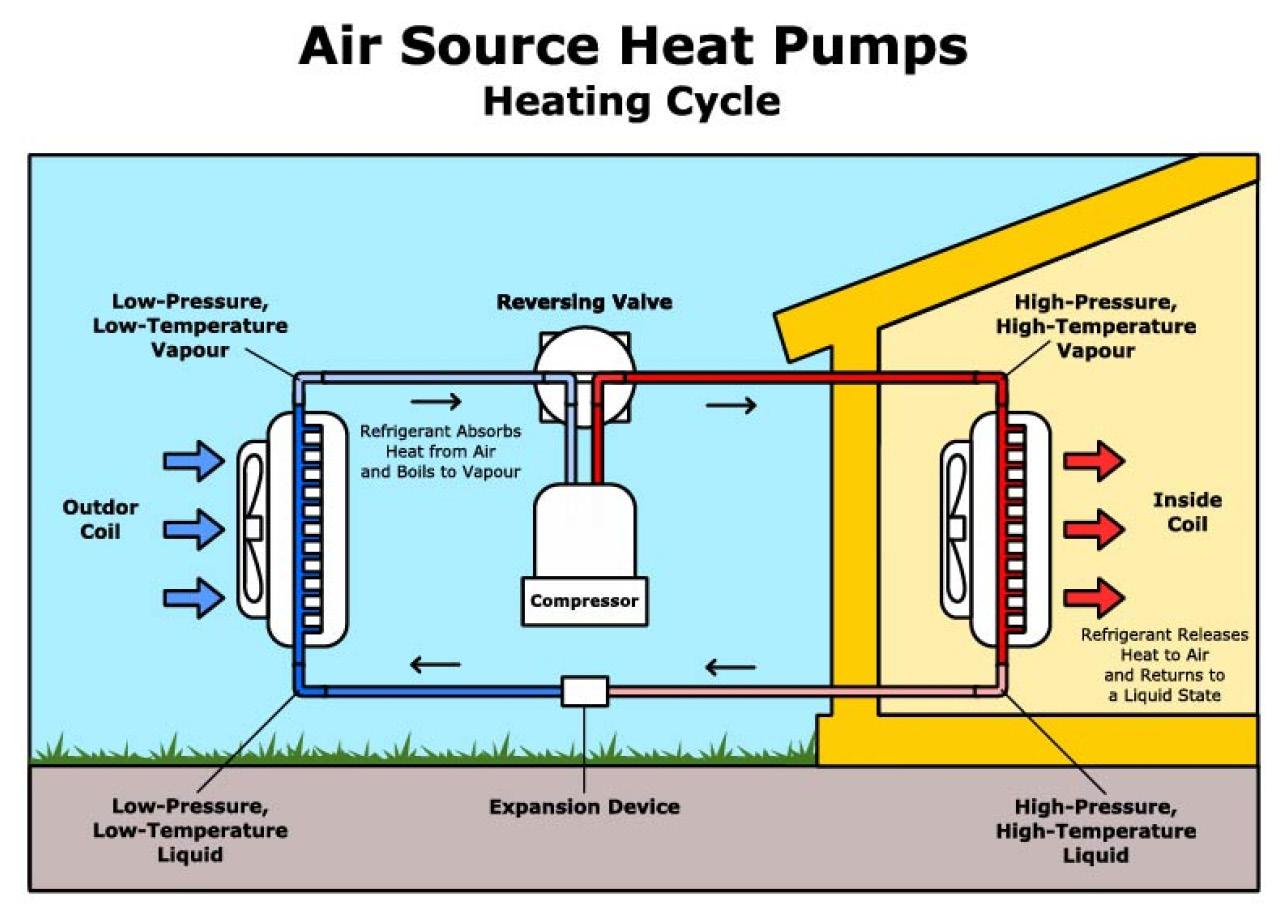
1. Air-Source Heat Pump (ASHP)
A heat pump is the future of home heating that can replace traditional heating devices like boilers (provide hot water needed and work as a heater for the building) and air conditioning systems (cool the spaces in hot weather). Unlike traditional heating systems, they transfer heat rather than converting it from fuel. Heat pumps work by collecting heat energy from the air to warm up the building, which is based on refrigeration and heat exchange principles. (TEK, 2018)
Air-Source heat pump heating Process :
1. Absorption
Extract heat from outside air (it works the same in cold or hot temperatures), and then refrigerant absorbs heat into vapor.
2. Compression
Compress the vapor to increase it's pressure and temperature (Thermodynamic Principle)
3. Heat Exchange
Heat (Thermal energy) travels to the indoor unit (air or water)
4. Refrigerant Cooling
The refrigerant cools and condenses back into a liquid and starts the cycle again to absorb more heat.
Figure 32. Air Source Heat Pumps Heating Cycle, (TEK, 2018)
4. 1 Renewable Technologies
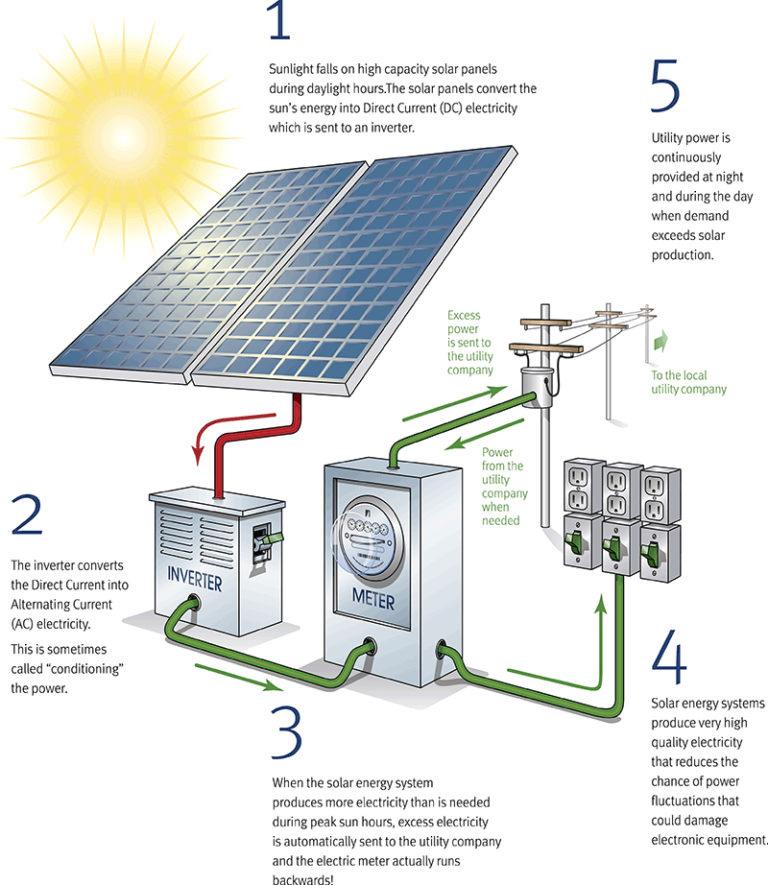
2. Solar Photovoltaic (PV)
Solar PV is a system that converts sunning (Solar energy, a renewable resource) into electricity (voltage) by using the photovoltaic effect through semiconductor materials (silicon). The Solar Panel converts the Direct Current (DC) through an inverter into Alternating Current (AC) electricity. The building can use this technology to fulfill its electricity, or if they have an excessive reserve battery to store solar power, the electricity can be fed back into the grid for financial return. (Swanepoel, n.d.)
Solar PV electricity generates process :
1. Sunlight hit solar panel
Sun projects energy in the form of photons, then hits the solar panel.
2. Exciting electrons
The solar panel surface is made from semiconductor materials (silicon) that excite electrons, breaking them loose from atoms.
3. Create electric current
Electrons flow to the other side of the solar panel cell, creating an electric current (DC) electricity.
4. Convert DC to AC
The inverter converts DC electricity to AC electricity.
5. Use or store Energy
The AC electricity can power up the building's electricity device or feed back into the grid for financial return. "In the UK, you can earn 5p to 15p per kWh" by (SEG) program.
Figure 33. Solar panel electricity generate process, (Swanepoel, n.d.)
4. 1 Renewable Technologies
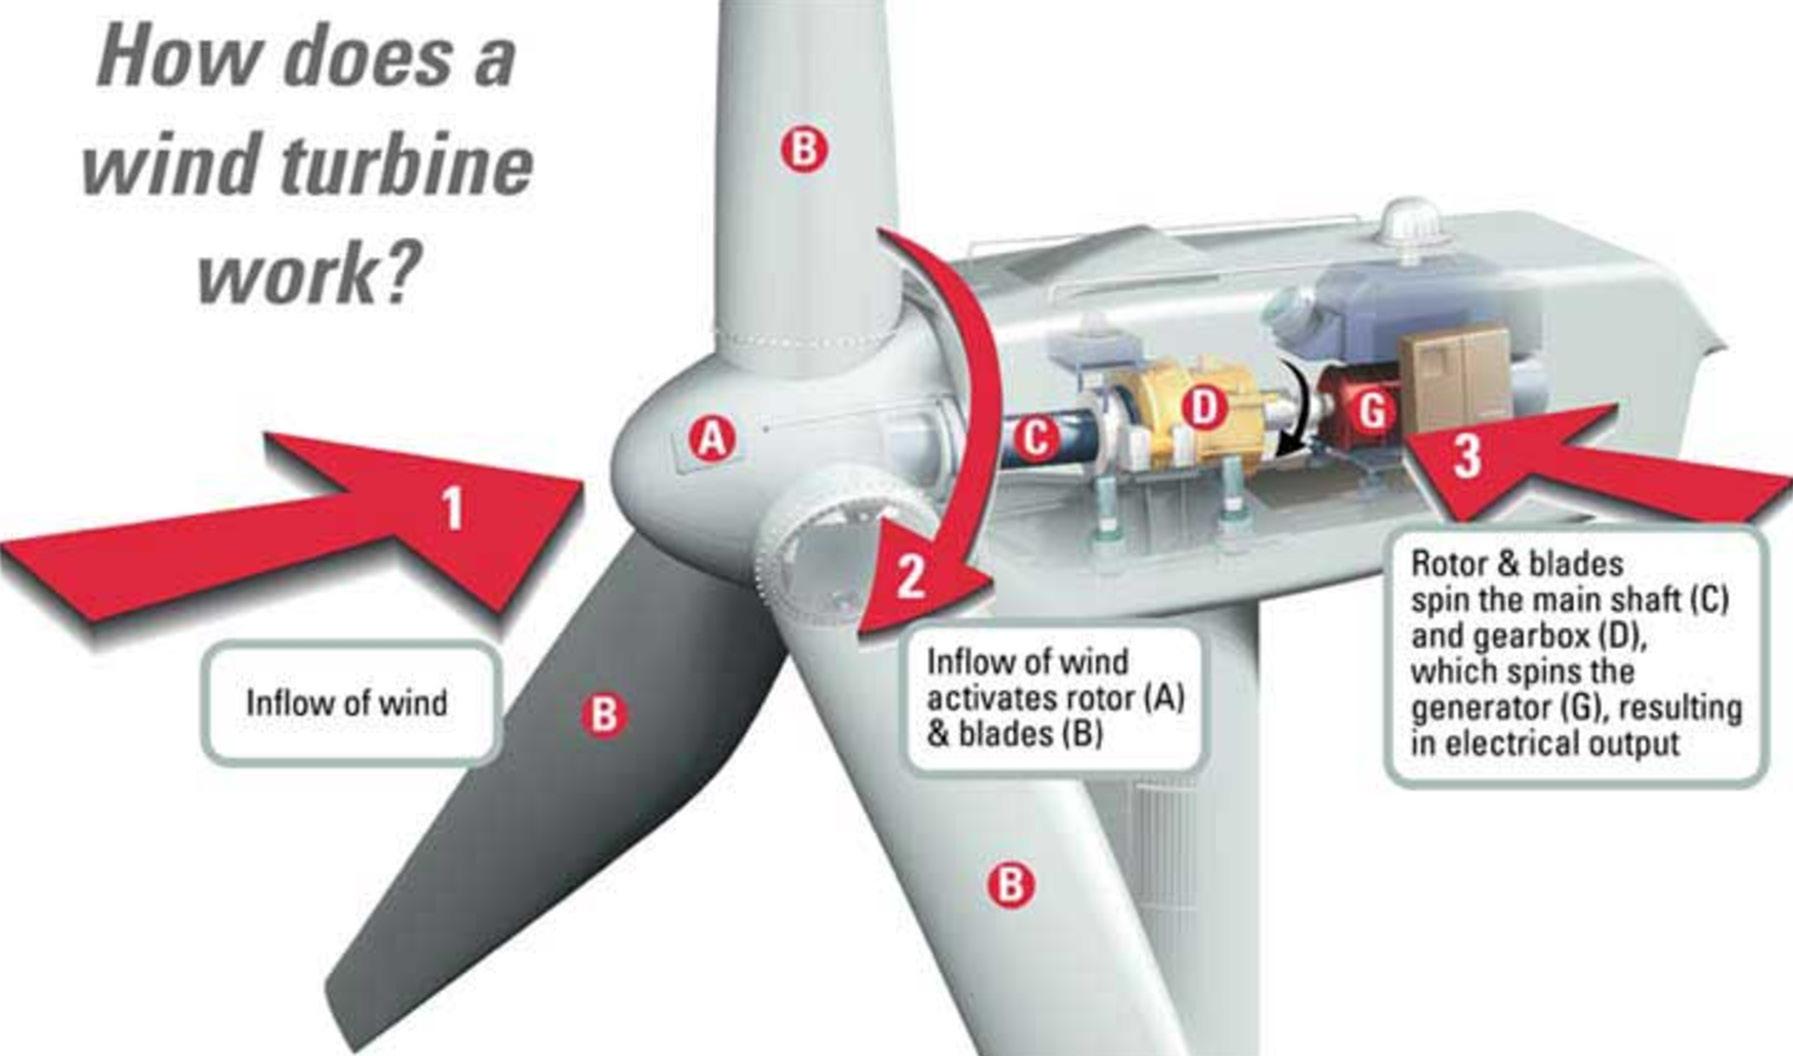
3. Wind Turbine
The sun triggers temperature change, and pressure makes the air move, creating wind energy, a sustainable technology like Wind turbines' energy source to generate electricity. Depending on the wind turbines' size and type (horizontal or vertical axis), they can be supplied to homes or businesses or clustered to form a wind farm. (EcoPlanet energy, 2012)
Wind turbine electricity generate process:
1. Kinetic Energy
The blads on the wind turbine turn by the kinetic energy of moving air (Wind flow)
2. Rotor
The blades are connected to a rotor. When spinning, the rotor converts the wind energy into rotation energy.
3. Generator
The generator that connects to the rotor uses magnets and coils of wire to interact to create electricity.
4. Electrical Output
The form of electricity created by the generator is (AC) electricity, and then transformers adjust the voltage to meet the grid requirement.
Project Total Energy Demand, Bills and CO2 Emission Calculation
Total Energy Demand : 9,153 kWh/a
- Calculation
Primary Energy Demand 113 kWh/a x Treated Floor Area 81 m2 = 9,153 kWh/a
GAS Demand : 2402 kWh/a
- Calculation
Tootal energy demand per year = (Electricity + Gas)
Total Heating demand 1220 kWh/a
Total DHW 1182 kWh/a
1220 + 1182 = 2402 kWh/a total (GAS demand)
2402 x 0.15£ = 360.3£ GAS bill per year
2402 x 0.216 = 518.832 kgCO2/kWh emission per year
Electricity Demand : 6015 kWh/a
- Calculation
Total demand - Gas = Electricity
9,153 - 2402 = 6751 kWh/a total Electricity demand
6751 x 0.3£ = 2025.3£ Electricity bill per year
6751 x 0.519 = 3503.769 kgCO2/kWh emission per year
Total (Electricity + Gas) Bill per year : 2385.6£
- Calculation
Electricity 2025.3£ + GAS 360.3£ = 2385.6£
Total CO2 emission per year : 4022.628kgCO2/kWh
Calculation :
518.832 + 3503.796 = 4022.628
To achieve a net zero building for this project, the energy demand will need to be met fully by on-site renewable energy systems. Solar photovoltaic (PV) and Airsource heat pump (ASHP) will be put to use by consideration and calculation of the building. The Air-source heat pump will provide both heating and cooling, while the solar PV system will generate electricity to meet the building's energy demand. These renewable technologies are also a long-term investment that will pay back in approximately 9.2 years. Furthermore, the installation will provide financial benefits by generating an annual savings of 2385.6£ from the reduction in energy bills. This investment is sustainable for the environment and provides significant value to the property over time.
4.3 Renewable Technology Selection
Air-Source Heat Pump : Vaillant Arotherm
Plus 3.5kW Air Source Heat Pump
Provider : Vaillant
Weight and Size : 114kg / 1100 x 765 x450 mm
Unit : 3.5 kW
Price : 3512.3£
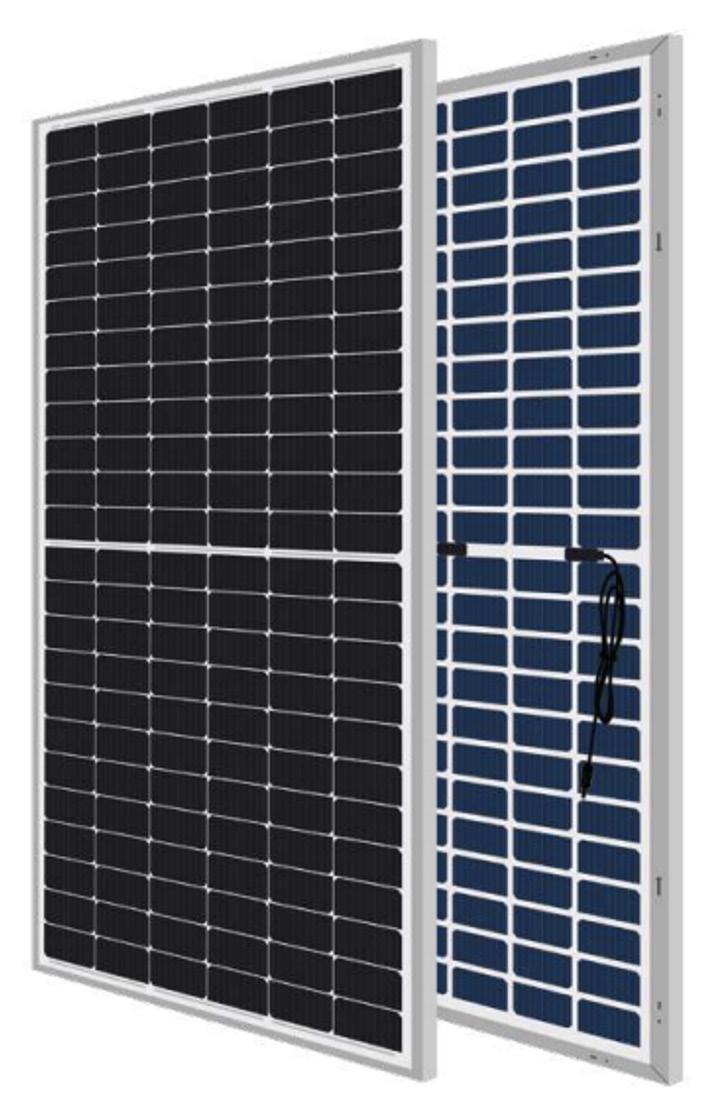
Solar PV : MEPV 144 BIFACIAL 550 Wp
Provider : EURENER energia solar
Weight and Size : 33kg / 2279 x 1134 x35 mm
Solar Cells : 144 bi-facial cell monocrystalline
Price : 85£
Figure 36. MEPV 144 BIFACIAL 550 Wp
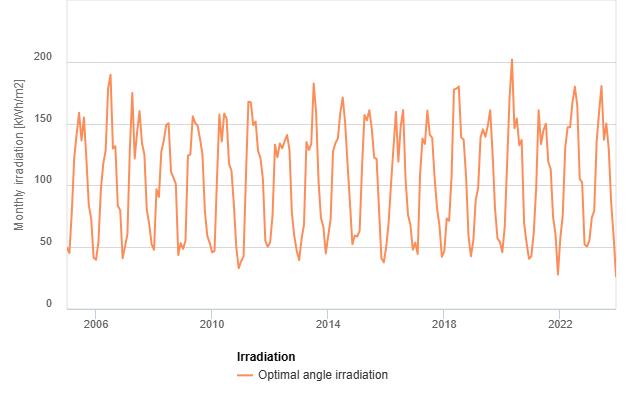
Each MEPV 114 BIFACIAL panel has a capacity of 550 Wp(watts peak), which is the maximum output under standard test conditions. In this design proposal, the Skillion roof surface faces the east and west sides, so they will only receive around 80% of the optimal south-facing solar production (Boxwell, 2021). The typical Performance Ratio (PR), Which accounts for system losses, is around 0.75 - 0.85, and London's typical Solar irradiance is approximately 900-1200kWh/m2/year based on PVGIS-5 geo-temporal irradiation database. See Figure 37. (European Commission, 2016)
Calculation
- Irradiance on east and west roofs is about 80% of the optimal south-facing value
- Reference irradiance of 1000 kWh/m2/year in this calculation
- Each MEPV 114 BIFACIAL panel capacity : 550Wp which is 0,55 kW
- Performance Ratio : 80% whitch is 0.8
- Formula for annual energy production : Panel capacity (kW) x Irradiance (kWh/m2/year) x Performance Ratio(PR) 0.55 x 1000 x 0.8 = 440kWh/year
Final Estimate :
MEPV 114 BIFACIAL panel on east and west roof in London are expected to produce approximately 440kWh/year
Figure 35. Vaillant Arotherm Plus 3.5kW Air Source Heat Pump
Monthly solar irradiation estimates Figure 37. London solar irradiation data generate by (European Commission, 2016)
4.4 Simple Payback Period / Carbon Saving
Building Gas Demand : 2402 kWh/a
Vaillant Arotherm Plus 3.5kW Air Source Heat Pump
Unit cost : 3512.3£
Installation cost : 7000£
Unit's Coefficient of Performance (COP) : 3 - 4
Energy demand for Heat Pump = Heating Demand / COP = 2402 / 4 = 600.5kWh/a
Solar PV pay back period = 11445 / 2025.3 = 5.6 (approx 5.6 years)
Total payback period = Total Installation Cost / Bill before renewable technology
21957.3£ / 2385.6£ = 9.2 years
Total Investment : 21957.3£
Annual Income After Payback : 2385.6£ per year (From savings in energy bills)
Carbon Save : 4022.628 kgCO2/kWh
To Summarize, the total investment for the renewable energy installation cost is 21,957.30£, with an estimated payback period of 9.2 years, calculated based on saving an annual energy bill of 2,385.60£. Once the payback period is completed, the system will generate an annual income of 2,385.60£ from these savings. Additionally, the installation contributes to environmental sustainability, saving approximately 4,022.63 kgCO2/kWh per year and making this project a NetZero Building.
5. Building in a Different Climate
Jakarta capital of Indonesia have a tropical climate, that have high temperature all year (average 26-32°C). Average sun hour is extreamly high (6-8 hours per day) and humidity levels is averging (77% per year). Jakarta's rainy season starts from October to May and dry season starts from June to September. (climatestotravel. com, 2024) For this chapter, PHPP climate location is changed to compare building performance in different climate. See following analysis below.
London monthly solar radiation and temperture
Jakarta monthly solar radiation and temperture
Figure 39. London and Jakarta's monthly solar radiation and temperture Line chart (Extracted from PHPP Version 9.6a)
The two different PHPP climate charts above clearly show that London experiences an intense seasonal changes in temperature and solar radiation, while Jakarta has a tropical climate, more consistent solar radiation, and minimal temperature change throughout the year.
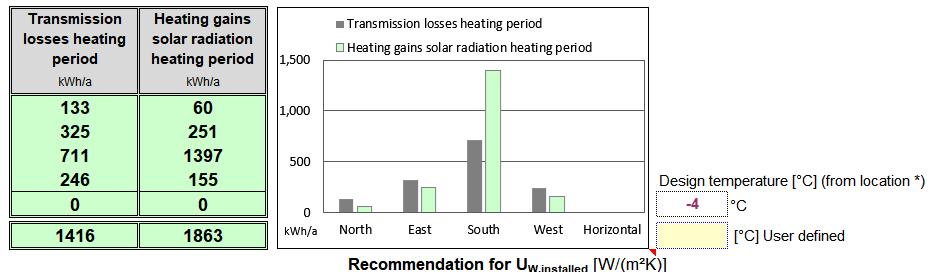
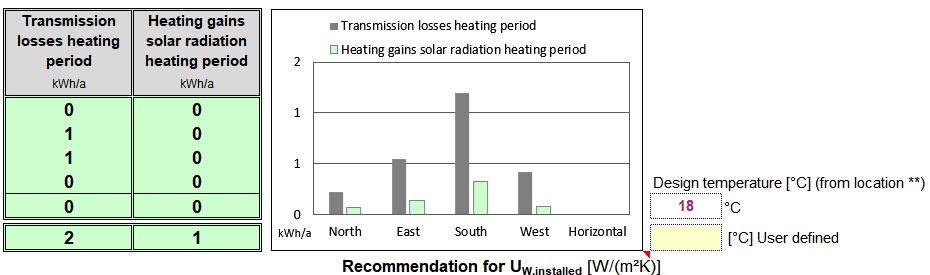
5. Building in a Different Climate
Figure 40. Window performance bar chart (Extracted from PHPP Version 9.6a)
In Figure 33. the window design for London's climate shows a high amount of heat loss under Jakarta's climate, as the design reflects a seasonal climate change location. For Jakarta's climate, the window design needs to focus more on cooling and ventilation considerations.
In conclusion, Passivhaus in London must focus on retaining heat, and Jakarta needs to minimize heat gain and manage humidity well. The heavy insulation in walls, floors, and roofs to retain heat is not ideal for Jakarta's climate. Speaking of heat gain, Jakarta has high solar radiation and long sun hours, so installing solar PV will have a high renewable energy potential. For materiality, low thermal mass structural material like timber or steel can avoid retaining heat in the building and absorb and release heat fast, which is an ideal material for Jakarta to achieve thermal comfort. (Passivhaus Trust, 2015)
Window Performance in London
Window Performance in Jakarta
5. Building in a Different Climate
Sun location
Figure 41. Jakarta and London sun location's differency during summer time (July / 1 12:00pm)
Jacarta Sun location
London
Conclusion
While writing this report, I gained a deeper understanding of Passivhaus design. By starting with analyzing (project site location) London's climate in a more detailed way, creating my own data graphs to further understand different climatemate effects. After that, I researched and wrote about the design considerations under the Passivhaus standards and strategies. Following this, I reviewed the design process of my building, checking to ensure it aligned with London's climate conditions.
Afterward, I used PHPP (Passive House Planning Package) to calculate the essential strategies for Passivhaus design. I double-checked the design details of my building envelope, including the U-values of the building elements, airtightness at every connection junction, and the building's services. Then, I explained my design considerations for shading to prevent overheating.
To achieve a Net Zero building, I analyzed three different renewable technologies. After calculating their performance, payback periods, and compatibility with my building's energy demands, I found that Solar PV and an air-source heat pump were the most suitable options. I then showed the calculation process and result to show that my building achieved Net Zero.
At the end of the report, I tested my buildings in different climates using PHPP, reviewed the errors that occurred under different climate conditions, and learned what design changes could make the building function again.
Overall, I successfully achieved a Net Zero Passivhaus. Even though the process was complex and challenging, the outcome was satisfying
7. References
Climates to travel (2010). London climate: average weather, temperature, precipitation, best time. [online] Climatestotravel.com. Available at: https://www. climatestotravel.com/climate/england/london. [Accessed 1 Dec. 2024].
Weather Spark (2019). Average Weather in London, United Kingdom, Year RoundWeather Spark. [online] Weatherspark.com. Available at: https://weatherspark.com/ y/45062/Average-Weather-in-London-United-Kingdom-Year-Round. [Accessed 1 Dec. 2024].
GAISMA (2024). London, United Kingdom - Sunrise, sunset, dawn and dusk times for the whole year. [online] Gaisma. Available at: https://www.gaisma.com/en/location/ london.html [Accessed 1 Dec. 2024].
Passivhaus Trust (2015). How to build a Passivhaus: Rules of thumb. [online] Passivhaus Trust. Available at: https://www.passivhaustrust.org.uk/UserFiles/File/ Technical%20Papers/How%20to%20Build%20a%20Passivhaus%20-%20Rules%20 of%20Thumb%20-%20compressed.pdf [Accessed 1 Dec. 2024].
NASA (2018). ArcGIS Web Application. [online] Nasa.gov. Available at: https://power. larc.nasa.gov/data-access-viewer/ [Accessed 1 Dec. 2024].
Dr. Wolfgang, F. (2007). Passive house ventilation. [online] Passiv.de. Available at: https://passiv.de/former_conferences/Passive_House_E/ventilation_and_humidity. htm [Accessed 1 Dec. 2024].
BRE (2014). Passivhaus primer: Airtightness Guide Airtightness and air pressure testing in accordance with the Passivhaus standard -A guide for the design team and contractors. [online] Passivhaus Learning Hub. BRE. Available at: https://www. passivhaustrust.org.uk/UserFiles/File/Technical%20Papers/BRE_Passivhaus_ Airtightness_Guide.pdf [Accessed 2 Dec. 2024].
BRE (2011). Passivhaus primer: Designer’s guide A guide for the design team and local authorities BRE is registered with the Passivhaus Institut as an official Certifier for Passivhaus Buildings. [online] Available at: https://passivehouse-international.org/ upload/BRE_Passivhaus_Designers_Guide.pdf.
TEK (2018). Air Source Heat Pump Installation | TEK. [online] Total Environmental Kooling (TEK). Available at: https://www.total-environmental.co.uk/air-source-heatpumps/ [Accessed 31 Nov. 2024].
Swanepoel, J.P. (n.d.). How Do Solar Panels Work? [online] bhgpower.co.za. Available at: https://bhgpower.co.za/how-do-solar-panels-work/ [Accessed 30 Nov. 2024].
EcoPlanet energy (2012). Wind energy | EcoPlanet Energy. [online] EcoPlanet energy. Available at: https://ecoplanetenergy.com/all-about-eco-energy/overview/ wind/ [Accessed 30 Nov. 2024].
Boxwell, M. (2021). Solar Electricity Handbook - 2021 Edition: A simple, practical guide to solar energy – designing and installing solar photovoltaic systems. 2021st ed. [online] Unit 51 Imex Business Park Birmingham B11 2AL United Kingdom: Greenstream, p.Page 73. Available at: https://kh.aquaenergyexpo.com/wp-content/ uploads/2023/12/Solar-Electricity-Handbook-2021.pdf [Accessed 26 Nov. 2024].
European Commission (2016). JRC Photovoltaic Geographical Information System (PVGIS) - European Commission. [online] Europa.eu. Available at: https://re.jrc. ec.europa.eu/pvg_tools/en/tools.html [Accessed 26 Nov. 2024].
climatestotravel.com (2024). Jakarta climate: weather by month, temperature, precipitation, when to go. [online] www.climatestotravel.com. Available at: https:// www.climatestotravel.com/climate/indonesia/jakarta.
7. References
Figure 1. Create by author, London daily temperture line chart (Leon Sen, 2024)
Figure 2. Create by author, London average humidity bar chart, (Leon Sen, 2024)
Figure 3. Create by author, London average rainfall bar chart (Leon Sen, 2024)
Figure 4. Create by author, London average Wind Speed line chart (Leon Sen, 2024)
Figure 5. London Wind Rose (MeteoBlue, 2024)
Figure 6. London Monthly solar radition and Temperature chart (Leon Sen, 2024)
Figure 7. London Sun Path (GAISMA, 2024)
Figure 8. Create by author, London seasonal temperture bar chart (Leon Sen, 2024)
Figure 9. Space used design detail (Leon Sen, 2024)
Figure 10. Floor plan layout
Figure 11. 1 : 50 Grounf Floor Setting out plan
Figure 12. 1 : 50 First Floor Setting out plan
Figure 13. Section A-A Setting out Plan
Figure 14. Section B-B Setting out plan
Figure 15. Building 3D View
Figure 16. Building envelope
Figure 17. Thermal Bridges
Figure 18. PHPP U-value of building assemblies (Extracted from PHPP Version 9.6a)
Figure 19. 1: 10 Detail Sections
Figure 20. Window data ((Extracted from PHPP Version 9.6a)
Figure 21. Passive Airflow
Figure 22. MVHR System layout
Figure 23. Energy balance heating (Extracted from PHPP Version 9.6a)
Figure 24. PHPP Verification (Extracted from PHPP Version 9.6a)
Figure 25. 1 : 50 Physical Model
Figure 26. 1 : 20 Physical Detail Shading Section Model
Figure 27. 3D Model Shading design highlight
Figure 28. Balconey & Ground Flooor Shading
Figure 29. East Face Ground Floor Window Shading
Figure 30. South Face Second Floor Window Shading
Figure 31. Heliodon shading test in two extream temperture during the season
Figure 32. Air Source Heat Pumps Heating Cycle, (TEK, 2018)
Figure 33. Solar panel electricity generate process, (Swanepoel, n.d.)