Research Report
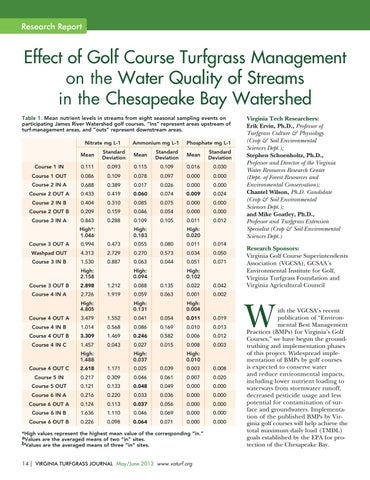
Effect of Golf Course Turfgrass Management on the Water Quality of Streams in the Chesapeake Bay Watershed Table 1. Mean nutrient levels in streams from eight seasonal sampling events on participating James River Watershed golf courses. “Ins” represent areas upstream of turf-management areas, and “outs” represent downstream areas. Nitrate mg L-1 Mean
Standard Deviation
Course 1 IN
0.111
Course 1 OUT
0.086
Ammonium mg L-1
Phosphate mg L-1
Mean
Standard Deviation
Mean
Standard Deviation
0.093
0.115
0.109
0.016
0.030
0.109
0.078
0.097
0.000
0.000
Course 2 IN A
0.688
0.389
0.017
0.026
0.000
0.000
Course 2 OUT A
0.433
0.419
0.060
0.074
0.009
0.024
Course 2 IN B
0.404
0.310
0.085
0.075
0.000
0.000
Course 2 OUT B
0.209
0.159
0.046
0.054
0.000
0.000
Course 3 IN A
0.843
0.288
0.109
0.105
0.011
0.012
High: 0.183
High*: 1.046
High: 0.020
Course 3 OUT A
0.994
0.473
0.055
0.080
0.011
0.014
Washpad OUT
4.313
2.729
0.270
0.573
0.034
0.050
Course 3 IN B
1.530
0.887
0.063
0.044
0.051
0.071
High: 2.158
High: 0.102
High: 0.094
Course 3 OUT B
2.898
1.212
0.088
0.135
0.022
0.042
Course 4 IN A
2.726
1.919
0.059
0.063
0.001
0.002
High: 4.805
High: 0.004
High: 0.131
Course 4 OUT A
3.479
1.552
0.041
0.054
0.011
0.019
Course 4 IN B
1.014
0.568
0.086
0.169
0.010
0.013
Course 4 OUT B
3.309
1.469
0.246
0.582
0.006
0.012
1.457
0.043
0.027
0.015
0.008
0.003
Course 4 IN C
High: 1.488
High: 0.037
High: 0.010
Course 4 OUT C
2.618
1.171
0.025
0.039
0.003
0.008
Course 5 IN
0.217
0.309
0.046
0.061
0.007
0.020
Course 5 OUT
0.121
0.133
0.048
0.049
0.000
0.000
Course 6 IN A
0.216
0.220
0.033
0.036
0.000
0.000
Course 6 OUT A
0.124
0.113
0.037
0.056
0.000
0.000
Course 6 IN B
1.636
1.110
0.046
0.069
0.000
0.000
Course 6 OUT B
0.226
0.098
0.064
0.071
0.000
0.000
*High values represent the highest mean value of the corresponding “in.” aValues are the averaged means of two “in” sites. bValues are the averaged means of three “in” sites. 14 | Virginia Turfgrass Journal May/June 2013 www.vaturf.org
Virginia Tech Researchers: Erik Ervin, Ph.D., Professor of Turfgrass Culture & Physiology (Crop & Soil Environmental Sciences Dept.); Stephen Schoenholtz, Ph.D., Professor and Director of the Virginia Water Resources Research Center (Dept. of Forest Resources and Environmental Conservation); Chantel Wilson, Ph.D. Candidate (Crop & Soil Environmental Sciences Dept.); and Mike Goatley, Ph.D., Professor and Turfgrass Extension Specialist (Crop & Soil Environmental Sciences Dept.) Research Sponsors: Virginia Golf Course Superintendents Association (VGCSA), GCSAA’s Environmental Institute for Golf, Virginia Turfgrass Foundation and Virginia Agricultural Council
W
ith the VGCSA’s recent publication of “Environmental Best Management Practices (BMPs) for Virginia’s Golf Courses,” we have begun the groundtruthing and implementation phases of this project. Widespread implementation of BMPs by golf courses is expected to conserve water and reduce environmental impacts, including lower nutrient loading to waterways from stormwater runoff, decreased pesticide usage and less potential for contamination of surface and groundwaters. Implementation of the published BMPs by Virginia golf courses will help achieve the total maximum daily load (TMDL) goals established by the EPA for protection of the Chesapeake Bay.