Copyright by KW Advisors 2024 May 2024

10DistrictsData
District 1
Jump to District 1
District 2
Jump to District 2
District 3
Jump to District 3
District 4
Jump to District 4
District 5
Jump to District 5
Jump to District 6
Jump to District 7
Jump to District 8
Jump to District 9 District 9
Jump to District 10 District 10

That's the question you should be asking yourself.
Our market is incredibly diverse and rapidly changing. Values vary not just by neighborhood but by street. Your home isn't necessarily worth what your neighbors' home is. It's the current market that sets the value of your home.
So, do you know what your home is worth in today's market?
Icanhelp...
Contact me for a confidential, no obligation assessment of your home's value.

You may have heard mortgage rates are going to stay a bit higher for longer than originally expected. And if you’re wondering why, the answer lies in the latest economic data. Here’s a quick overview of what’s happening with mortgage rates and what experts say is ahead.
When it comes to mortgage rates, things like the job market, the pace of inflation, consumer spending, geopolitical uncertainty, and more all have an impact. Another factor at play is the Federal Reserve (the Fed) and its decisions on monetary policy. And that’s what you may be hearing a lot about right now. Here’s why.
The Fed decided to start raising the Federal Funds Rate to try to slow down the economy (and inflation) in early 2022. That rate impacts how much it costs banks to borrow money from each other. It doesn’t determine mortgage rates, but mortgage rates do respond when this happens. And that’s when mortgage rates started to really climb.


You can’t always see a breakdown coming, but you can plan for it with American Home Shield. Our home service plans help fix or replace covered home systems and appliances, and help you stay on budget. Protect what you don’t expect.

CLICK HERE TO WATCH THE VIDEO


These refreshing colors make the wash-and-dry chore a little more pleasant.
Tranquil Blue
View it here
View it here
View it here
View it here
View it here
View it here
View it here
View it here
Create a tranquil laundry space with Benjamin Moore's Beach Glass Its light blue shade, coupled with a subtle gray undertone, offers a clean and versatile aesthetic that avoids any baby nursery associations.
Transform your space with earthy tones like October Mist and Gloucester Sage from Benjamin Moore. Test out the trendy sage in your laundry room for a lowcommitment update easy to change and customize, ensuring lasting satisfaction with your design choice.
Create an elegant laundry room with Chantilly Lace by Benjamin Moore The classic white choice adds sophistication, opens up the space, and simplifies stain detection.
Elevate your laundry space with the energizing touch of yellow. Behr's Roasted Corn or Upbeat bring warmth and optimism, while Pearly White offers a mellow option a yellow-based white that brings a perfect harmony of vibrancy and calmness
Gray remains a top choice for laundry room walls, providing a timeless and serene backdrop A soft gray for a whisper of sophistication, easily personalized with printed patterned tile flooring or Behr's bold 2024 Color of the Year, Cracked Pepper.
Sherwin-Williams' Rosebud for a touch of romance in laundry rooms. The dusty pink hue, paired with gold accents, adds a luxurious and warm atmosphere
Navy as the key to a striking laundry room. Beyond lighter blues, navy paired with lighter accents or white fixtures, especially Benjamin Moore's Hale Navy, creates a bold choice that makes the laundry room stand out.
Dare to take a style risk in your laundry room with a pop of color Opt for the subtle smoky lavender of Farrow & Ball's Peignoir for a neutral touch or go all-out glam with Backdrop's dark and vampy McQueen, drawing inspiration from the famous fashion designer.
Source : https://www familyhandyman com/list/laundry-room-colors/


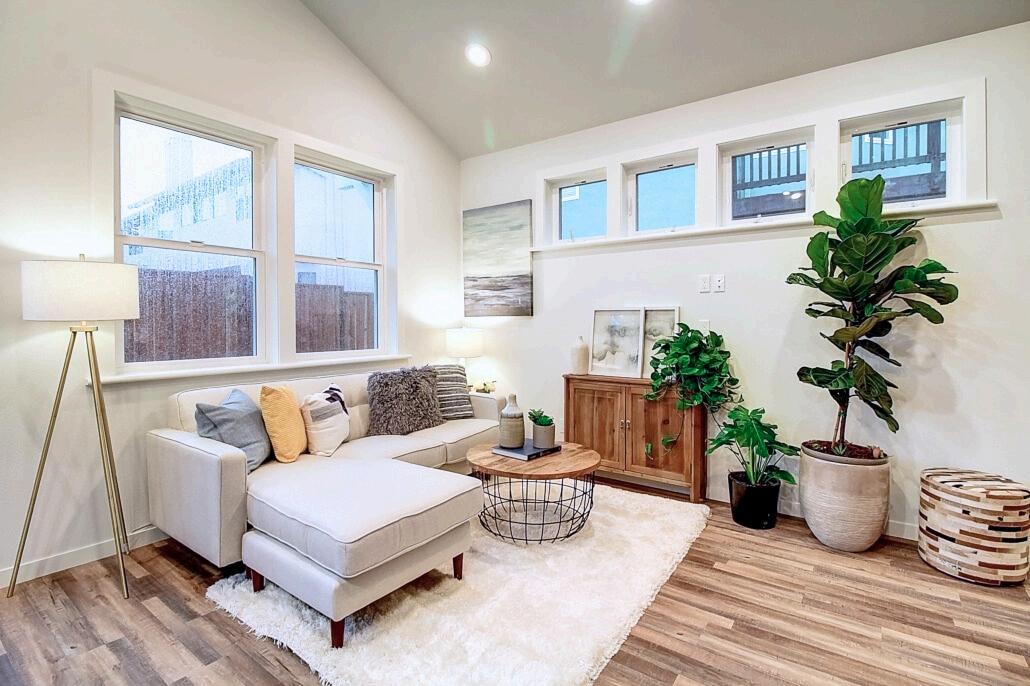

Be amazed at your property’s potential. Our experts use advanced 3D visualization and 3D model building to turn your ideas into tangible ADU plans
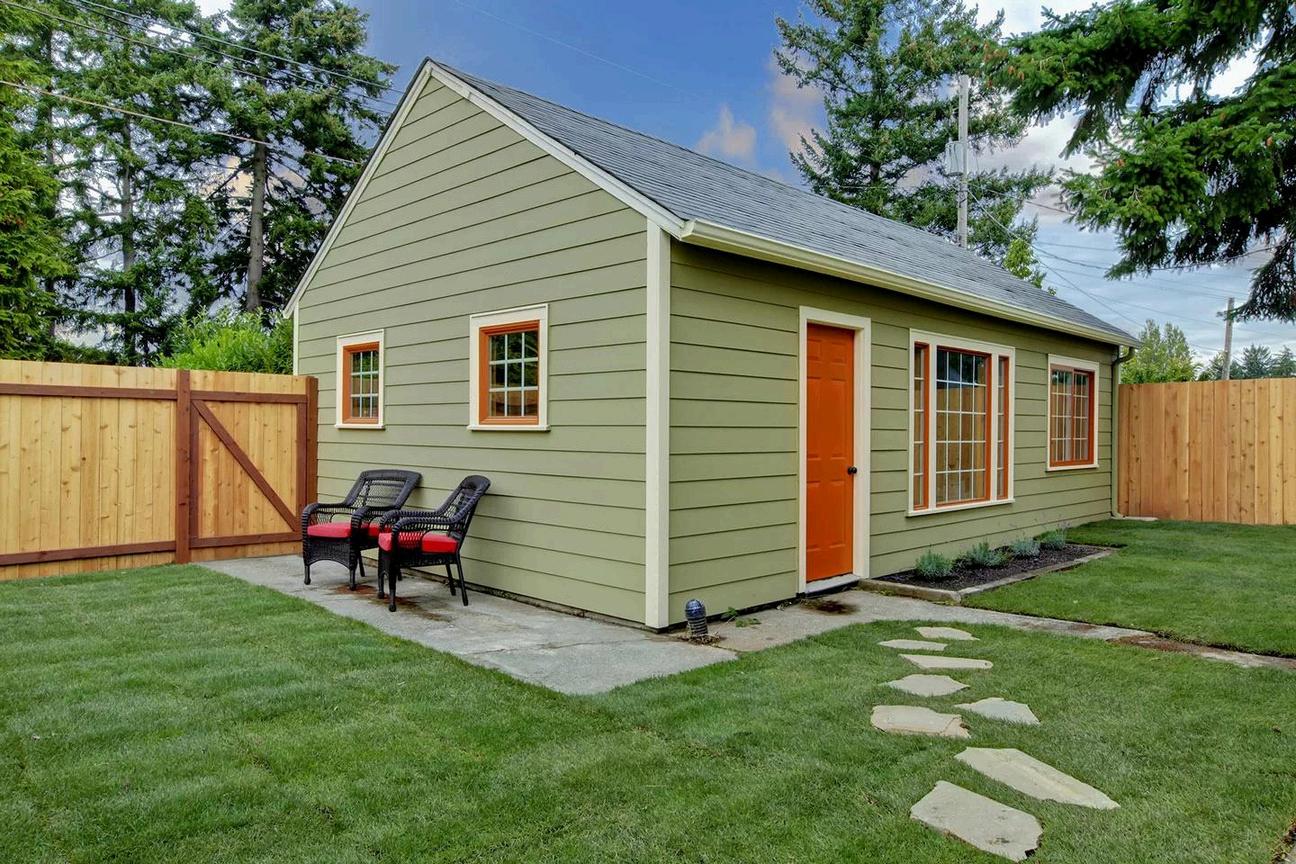
Leave the paperwork to us. Acton ADU simplifies the permitting process, allowing you to focus on what matters most while we handle the details
With 30+ years of craftsmanship behind our belts, our skilled team creates your dream ADU – tailored to your family’s needs and designed for modern living

When it comes to home ownership, knowing who you can trust is crucial. That's why we've curated a select list of trusted vendors who are ready to help with your home goals.


There were 21 single-family homes for sale, providing 1.3 months of inventory. There were 21 new listings, and 23 homes sold at a median price of $2.1m. The median overbid percentage was at 108.4%, with an average of 21 days on the market.
There were 15 condo and townhome units for sale, providing 2.2 months of inventory. There were 17 new listings and 9 units sold at a median sale price of $1.1m. The median overbid percentage was at 100%, with an average of 49 days on the market.
21 New Listings
23 Sold Listings
1.3 Months of Inventory
$2.1M
Median Sale Price
108.4%
Median Sale vs List
21 Avg Days on Market
sourced from InfoSparks, includes all single-family homes, condos and in the California Area above from April 2023 to April 2024. This may include ata, and may vary from the time the data was gathered. All data is deemed not guaranteed. DRE# 01995149. Copyright KW Advisors San Francisco | Napa Valley 2024. Each office is independently owned and operated.
New Listings
9
Sold Listings
2.2
Months of Inventory
$1.1M
Median Sale Price 100%
Median Sale vs List
49
Avg Days on Market

Single-Family Homes
The median sale price has decreased from $2 5m last April 2023, to $2 1m as of April 2024
Condos & Townhomes
The median sale price has decreased from $1 2m last April 2023, to $1 1m as of April 2024
Single-Family Homes
The average time spent on the market went down from 51 days last April 2023, to 21 days as of April 2024
Condos & Townhomes
The average time spent on the market went up from 37 days in April 2023, to 49 days as of April 2024.
Single-Family Homes
The overbid percentage has increased from 107 1% last April 2023, to 108 4% a year later
Condos & Townhomes
The overbid percentage has decreased from 102% last April 2023, to 100% a year later.

There were 36 single-family homes for sale, providing 1.2 months of inventory. There were 29 new listings, and 35 homes sold at a median price of $1.6m. The median overbid percentage was at 116%, with an average of 18 days on the market.
There were 6 condo and townhome units for sale, providing 3 months of inventory. There were 4 new listings and 4 units sold at a median sale price of $712k. The median overbid percentage was at 103.5%, with an average of 21 days on the market.

29 New Listings
35 Sold Listings
1.2 Months of Inventory
$1.6M Median Sale Price
116%
Median Sale vs List
18 Avg Days on Market
The data, sourced from InfoSparks, includes all single-family homes, condos and townhomes in the California Area above from April 2023 to April 2024. This may include preliminary data, and may vary from the time the data was gathered. All data is deemed reliable but not guaranteed. DRE# 01995149. Copyright KW Advisors San Francisco | Napa Valley 2024. Each office is independently owned and operated.
Listings 3 Months of Inventory
Sold Listings
Median Sale Price 103.5% Median Sale vs List 21 Avg Days on Market

Single-Family Homes
The median sale price has increased from $1 5m last April 2023, to $1 6m as of April 2024
Condos & Townhomes
The median sale price has decreased from $1 1m last April 2023, to $712k as of April 2024
The average time spent on the market went up from 14 days last April 2023, to 18 days as of April 2024
Condos & Townhomes
The average time spent on the market went down from 38 days in April 2023, to 21 days as of April 2024.
Single-Family Homes
The overbid percentage has increased from 112 9% last April 2023, to 116% a year later
Condos & Townhomes
The overbid percentage has increased from 100.6% last April 2023, to 103.5% a year later.

There were 17 single-family homes for sale, providing 1.4 months of inventory. There were 17 new listings, and 23 homes sold at a median price of $1.1m. The median overbid percentage was at 112.8%, with an average of 29 days on the market.
There were 3 condo and townhome units for sale, providing 1.4 months of inventory. There were 4 new listings and 2 units sold at a median sale price of $1.3m. The median overbid percentage was at 97.2%, with an average of 18 days on the market.

17 New Listings
23 Sold Listings
1.4 Months of Inventory
$1.1M Median Sale Price
112.8%
Median Sale vs List
29 Avg Days on Market
The data, sourced from InfoSparks, includes all single-family homes, condos and townhomes in the California Area above from April 2023 to April 2024. This may include preliminary data, and may vary from the time the data was gathered. All data is deemed reliable but not guaranteed. DRE# 01995149. Copyright KW Advisors San Francisco | Napa Valley 2024. Each office is independently owned and operated.
4
New Listings
2 Sold Listings
1.4
Months of Inventory
$1.3M
Median Sale Price 97.2%
Median Sale vs List
18 Avg Days on Market

APRIL 2023 - APRIL 2024
Single-Family Homes
Last 12 months, year-over-year.
Condos & Townhomes
Last 12 months, year-over-year
The median sale price has decreased from $1 2m last April 2023, to $1 1m as of April 2024
Condos & Townhomes
The median sale price has increased from $839k last April 2023, to $1 3m as of April 2024
The average time spent on the market went up from 12 days last April 2023, to 29 days as of April 2024
Condos & Townhomes
The average time spent on the market went down from 21 days in April 2023, to 18 days as of April 2024.
Single-Family Homes
The overbid percentage has increased from 106 3% last April 2023, to 112 8% a year later
Condos & Townhomes
The overbid percentage has decreased from 100.8% last April 2023, to 97.2% a year later.

There were 21 single-family homes for sale, providing 0.9 months of inventory. There were 38 new listings, and 37 homes sold at a median price of $2m. The median overbid percentage was at 114.8%, with an average of 21 days on the market.
There were 9 condo and townhome units for sale, providing 2.1 months of inventory. There were 5 new listings and 6 units sold at a median sale price of $824k. The median overbid percentage was at 100.9%, with an average of 41 days on the market.

38 New Listings
37 Sold Listings
0.9 Months of Inventory
$2M Median Sale Price
114.8%
Median Sale vs List
21 Avg Days on Market
The data, sourced from InfoSparks, includes all single-family homes, condos and townhomes in the California Area above from April 2023 to April 2024. This may include preliminary data, and may vary from the time the data was gathered. All data is deemed reliable but not guaranteed. DRE# 01995149. Copyright KW Advisors San Francisco | Napa Valley 2024. Each office is independently owned and operated.
5
New Listings
6 Sold Listings
2.1
Months of Inventory
100.9%
Median Sale vs List
$824K
Median Sale Price
41
Avg Days on Market

Single-Family Homes
The median sale price has increased from $1 8m last April 2023, to $2m as of April 2024
Condos & Townhomes
The median sale price has increased from $420k last April 2023, to $824k as of April 2024
Single-Family Homes
The average time spent on the market went down from 25 days last April 2023, to 21 days as of April 2024
Condos & Townhomes
The average time spent on the market went down from 112 days in April 2023, to 41 days as of April 2024.
Single-Family Homes
The overbid percentage has increased from 107 5% last April 2023, to 114 8% a year later
Condos & Townhomes
The overbid percentage has increased from 100% last April 2023, to 100.9% a year later.

There were 39 single-family homes for sale, providing 1.7 months of inventory. There wer new listings, and 33 homes sold at a median of $2.4m. The median overbid percentage wa 110.2%, with an average of 14 days on the m
There were 41 condo and townhome units fo sale, providing 1.7 months of inventory. Ther were 36 new listings and 23 units sold at a m sale price of $1.2m. The median overbid percentage was at 107%, with an average of days on the market.

39 New Listings
33 Sold Listings
1.7 Months of Inventory
$2.4M Median Sale Price
110.2%
Median Sale vs List
14 Avg Days on Market
36
New Listings
23 Sold Listings
1.7
Months of Inventory
$1.2M
Median Sale Price
107%
Median Sale vs List
40 Avg Days on Market

Single-Family Homes
Last 12 months, year-over-year.
Condos & Townhomes
Last 12 months, year-over-year
The median sale price has decreased from $2 6m last April 2023, to $2 4m as of April 2024
The median sale price has decreased from $1 3m last April 2023, to $1 2m as of April 2024
$3,500,000
The average time spent on the market went down from 20 days last April 2023, to 14 days as of April 2024
The average time spent on the market went down from 52 days in April 2023, to 40 days as of April 2024.
The overbid percentage has increased from 103 9% last April 2023, to 110 2% a year later
The overbid percentage has increased from 100% last April 2023, to 107% a year later.

There were 2 single-family ho providing 0.7 months of inve new listings, and 2 homes so of $2.3m. The median overbi 99.1%, with an average of 27
There were 42 condo and tow sale, providing 2.8 months of were 31 new listings and 18 sale price of $1.1m. The med percentage was at 100%, wit days on the market.

2 New Listings
0.7 Months of Inventory
99.1%
Median Sale vs List
2 Sold Listings
$2.3M Median Sale Price
27 Avg Days on Market
homes, condos and 2024. This may include gathered. All data is deemed Advisors San Francisco | Napa Valley 2024. Each office is independently owned and operated.
31
New Listings
18 Sold Listings
2.8
Months of Inventory
$1.1M
Median Sale Price 100%
Median Sale vs List
36 Avg Days on Market

Single-Family Homes
The median sale price has decreased from $3 5m last April 2023, to $2 3m as of April 2024
Condos & Townhomes
The median sale price has decreased from $1 3m last April 2023, to $1 1m as of April 2024
The average time spent on the market went down from 146 days last April 2023, to 27 days as of April 2024
Condos & Townhomes
The average time spent on the market went down from 43 days in April 2023, to 36 days as of April 2024.
Single-Family Homes
The overbid percentage has increased from 98 2% last April 2023, to 99 1% a year later
Condos & Townhomes
The overbid percentage has decreased from 104.3% last April 2023, to 100% a year later.

There were 37 single-family h providing 3.7 months of inve new listings, and 13 homes s of $7.3m. The median overbi 98.2%, with an average of 54
There were 56 condo and tow sale, providing 3.2 months of were 36 new listings and 27 sale price of $1.5m. The med percentage was at 100.9%, w days on the market.
14 New Listings
3.7 Months of Inventory
98.2%
Median Sale vs List
13 Sold Listings
$7.3M Median Sale Price
54 Avg Days on Market
homes, condos and 2024. This may include gathered. All data is deemed Advisors San Francisco | Napa Valley 2024. Each office is independently owned and operated.
36
New Listings
27
Sold Listings
3.2
Months of Inventory
$1.5M
Median Sale Price
100.9%
Median Sale vs List

22 Avg Days on Market
Single-Family Homes
The median sale price has increased from $4 5m last April 2023, to $7 3m as of April 2024
Condos & Townhomes
The median sale price has increased from $1 4m last April 2023, to $1 5m as of April 2024
Single-Family Homes
The average time spent on the market went up from 49 days last April 2023, to 54 days as of April 2024
Condos & Townhomes
The average time spent on the market went down from 38 days in April 2023, to 22 days as of April 2024.
Single-Family Homes
The overbid percentage has increased from 96% last April 2023, to 98 2% a year later
Condos & Townhomes
The overbid percentage has increased from 99.2% last April 2023, to 100.9% a year later.

There were 11 single-family homes for sale, providing 5 months of inventory. There were 7 new listings, and 2 homes sold at a median price of $3.7m. The median overbid percentage was at 93.5%, with an average of 47 days on the market.
There were 158 condo and townhome units for sale, providing 4.9 months of inventory. There were 68 new listings and 39 units sold at a median sale price of $1m. The median overbid percentage was at 100%, with an average of 67 days on the market.

7 New Listings
2 Sold Listings
5 Months of Inventory
$3.7M Median Sale Price
93.5%
Median Sale vs List
47 Avg Days on Market
The data, sourced from InfoSparks, includes all single-family homes, condos and townhomes in the California Area above from April 2023 to April 2024. This may include preliminary data, and may vary from the time the data was gathered. All data is deemed reliable but not guaranteed. DRE# 01995149. Copyright KW Advisors San Francisco | Napa Valley 2024. Each office is independently owned and operated.
68
New Listings
39 Sold Listings
4.9
Months of Inventory
$1M
Median Sale Price 100%
Median Sale vs List 67 Avg Days on Market

APRIL 2023 - APRIL 2024
Single-Family Homes
Last 12 months, year-over-year.
Condos & Townhomes
Last 12 months, year-over-year
Single-Family Homes
The median sale price has decreased from $3 8m last April 2023, to $3 7m as of April 2024
Condos & Townhomes
The median sale price has increased from $850k last April 2023, to $1m as of April 2024
$7,000,000
$5,000,000 $6,000,000
Single-Family Homes
The average time spent on the market went up from 23 days last April 2023, to 47 days as of April 2024
Condos & Townhomes
The average time spent on the market went down from 83 days in April 2023, to 67 days as of April 2024.
Single-Family Homes
The overbid percentage has decreased from 104 2% last April 2023, to 93 5% a year later
Condos & Townhomes
The overbid percentage has increased from 97.5% last April 2023, to 100% a year later.

There were 30 single-family homes for sale, providing 1.8 months of inventory. There were 24 new listings, and 20 homes sold at a median price of $1.5m. The median overbid percentage was at 108.3%, with an average of 23 days on the market.
There were 306 condo and townhome units for sale, providing 5.6 months of inventory. There were 126 new listings and 73 units sold at a median sale price of $975k. The median overbid percentage was at 99%, with an average of 65 days on the market.

24 New Listings
20 Sold Listings
1.8 Months of Inventory
$1.5M Median Sale Price
108.3%
Median Sale vs List
23 Avg Days on Market
The data, sourced from InfoSparks, includes all single-family homes, condos and townhomes in the California Area above from April 2023 to April 2024. This may include preliminary data, and may vary from the time the data was gathered. All data is deemed reliable but not guaranteed. DRE# 01995149. Copyright KW Advisors San Francisco | Napa Valley 2024. Each office is independently owned and operated.
New Listings
5.6
Sold Listings
Months of Inventory $975K
Median Sale Price 99%
Median Sale vs List 65 Avg Days on Market 73

Single-Family Homes
The median sale price has decreased from $1 6m last April 2023, to $1 5m as of April 2024
Condos & Townhomes
The median sale price has decreased from $977k last April 2023, to $975k as of April 2024
Single-Family Homes
The average time spent on the market went down from 44 days last April 2023, to 23 days as of April 2024
Condos & Townhomes
The average time spent on the market went up from 59 days in April 2023, to 65 days as of April 2024.
Single-Family Homes
The overbid percentage has increased from 102% last April 2023, to 108 3% a year later
Condos & Townhomes
The overbid percentage has increased from 98.6% last April 2023, to 99% a year later.

There were 69 single-family homes for sale, providing 2.1 months of inventory. There were 74 new listings, and 28 homes sold at a median price of $1.1m. The median overbid percentage was at 118.3%, with an average of 22 days on the market.
There were 35 condo and townhome units for sale, providing 6.3 months of inventory. There were 20 new listings and 11 units sold at a median sale price of $709k. The median overbid percentage was at 100%, with an average of 64 days on the market.

74 New Listings
28 Sold Listings
2.1 Months of Inventory
$1.1M Median Sale Price
118.3% Median Sale vs List
22 Avg Days on Market
New Listings
Median Sale vs List

Listings
Single-Family Homes
The median sale price has increased from $1m last April 2023, to $1 1m as of April 2024
Condos & Townhomes
The median sale price has decreased from $895k last April 2023, to $709k as of April 2024
The average time spent on the market went down from 35 days last April 2023, to 22 days as of April 2024
Condos & Townhomes
The average time spent on the market went up from 48 days in April 2023, to 64 days as of April 2024.
Single-Family Homes
The overbid percentage has increased from 100 9% last April 2023, to 118 3% a year later
Condos & Townhomes
The overbid percentage has remained the same from 100% last April 2023, to 100% a year later.