Stephanie Velasquez - April 2025 Market Report San Francisco Bay Area
San Francisco Bay area
Jump to Alameda Report Alameda
Contra Costa
Jump to Contra Costa Report
Jump to Napa Report Napa County
San Francisco County
Jump to San Francisco County Report
San Mateo
Jump to San Mateo Report
Santa Clara
Jump to Santa Clara Report
Solano County
Jump to Solano Report
Sonoma County
Jump to Sonoma Report
Jump to Marin Report Southern/Central Marin
What’syourhome reallyworthin today’smarket?
That's the question you should be asking yourself.
Our market is incredibly diverse and rapidly changing. Values vary not just by neighborhood but by street. Your home isn't necessarily worth what your neighbors' home is. It's the current market that sets the value of your home.
So, do you know what your home is worth in today's market?
Icanhelp...
Contact me for a confidential, no obligation assessment of your home's value.
The#1ThingSellersNeedTo KnowAboutTheirAskingPrice
When you put your house on the market, you want to sell it quickly and for the best price possible; that’s generally the goal. But too many sellers are shooting too high right now. They don’t realize the market has shifted as inventory has grown. The side effect? Price cuts are on the rise, but they really don’t have to be. Here’s why.
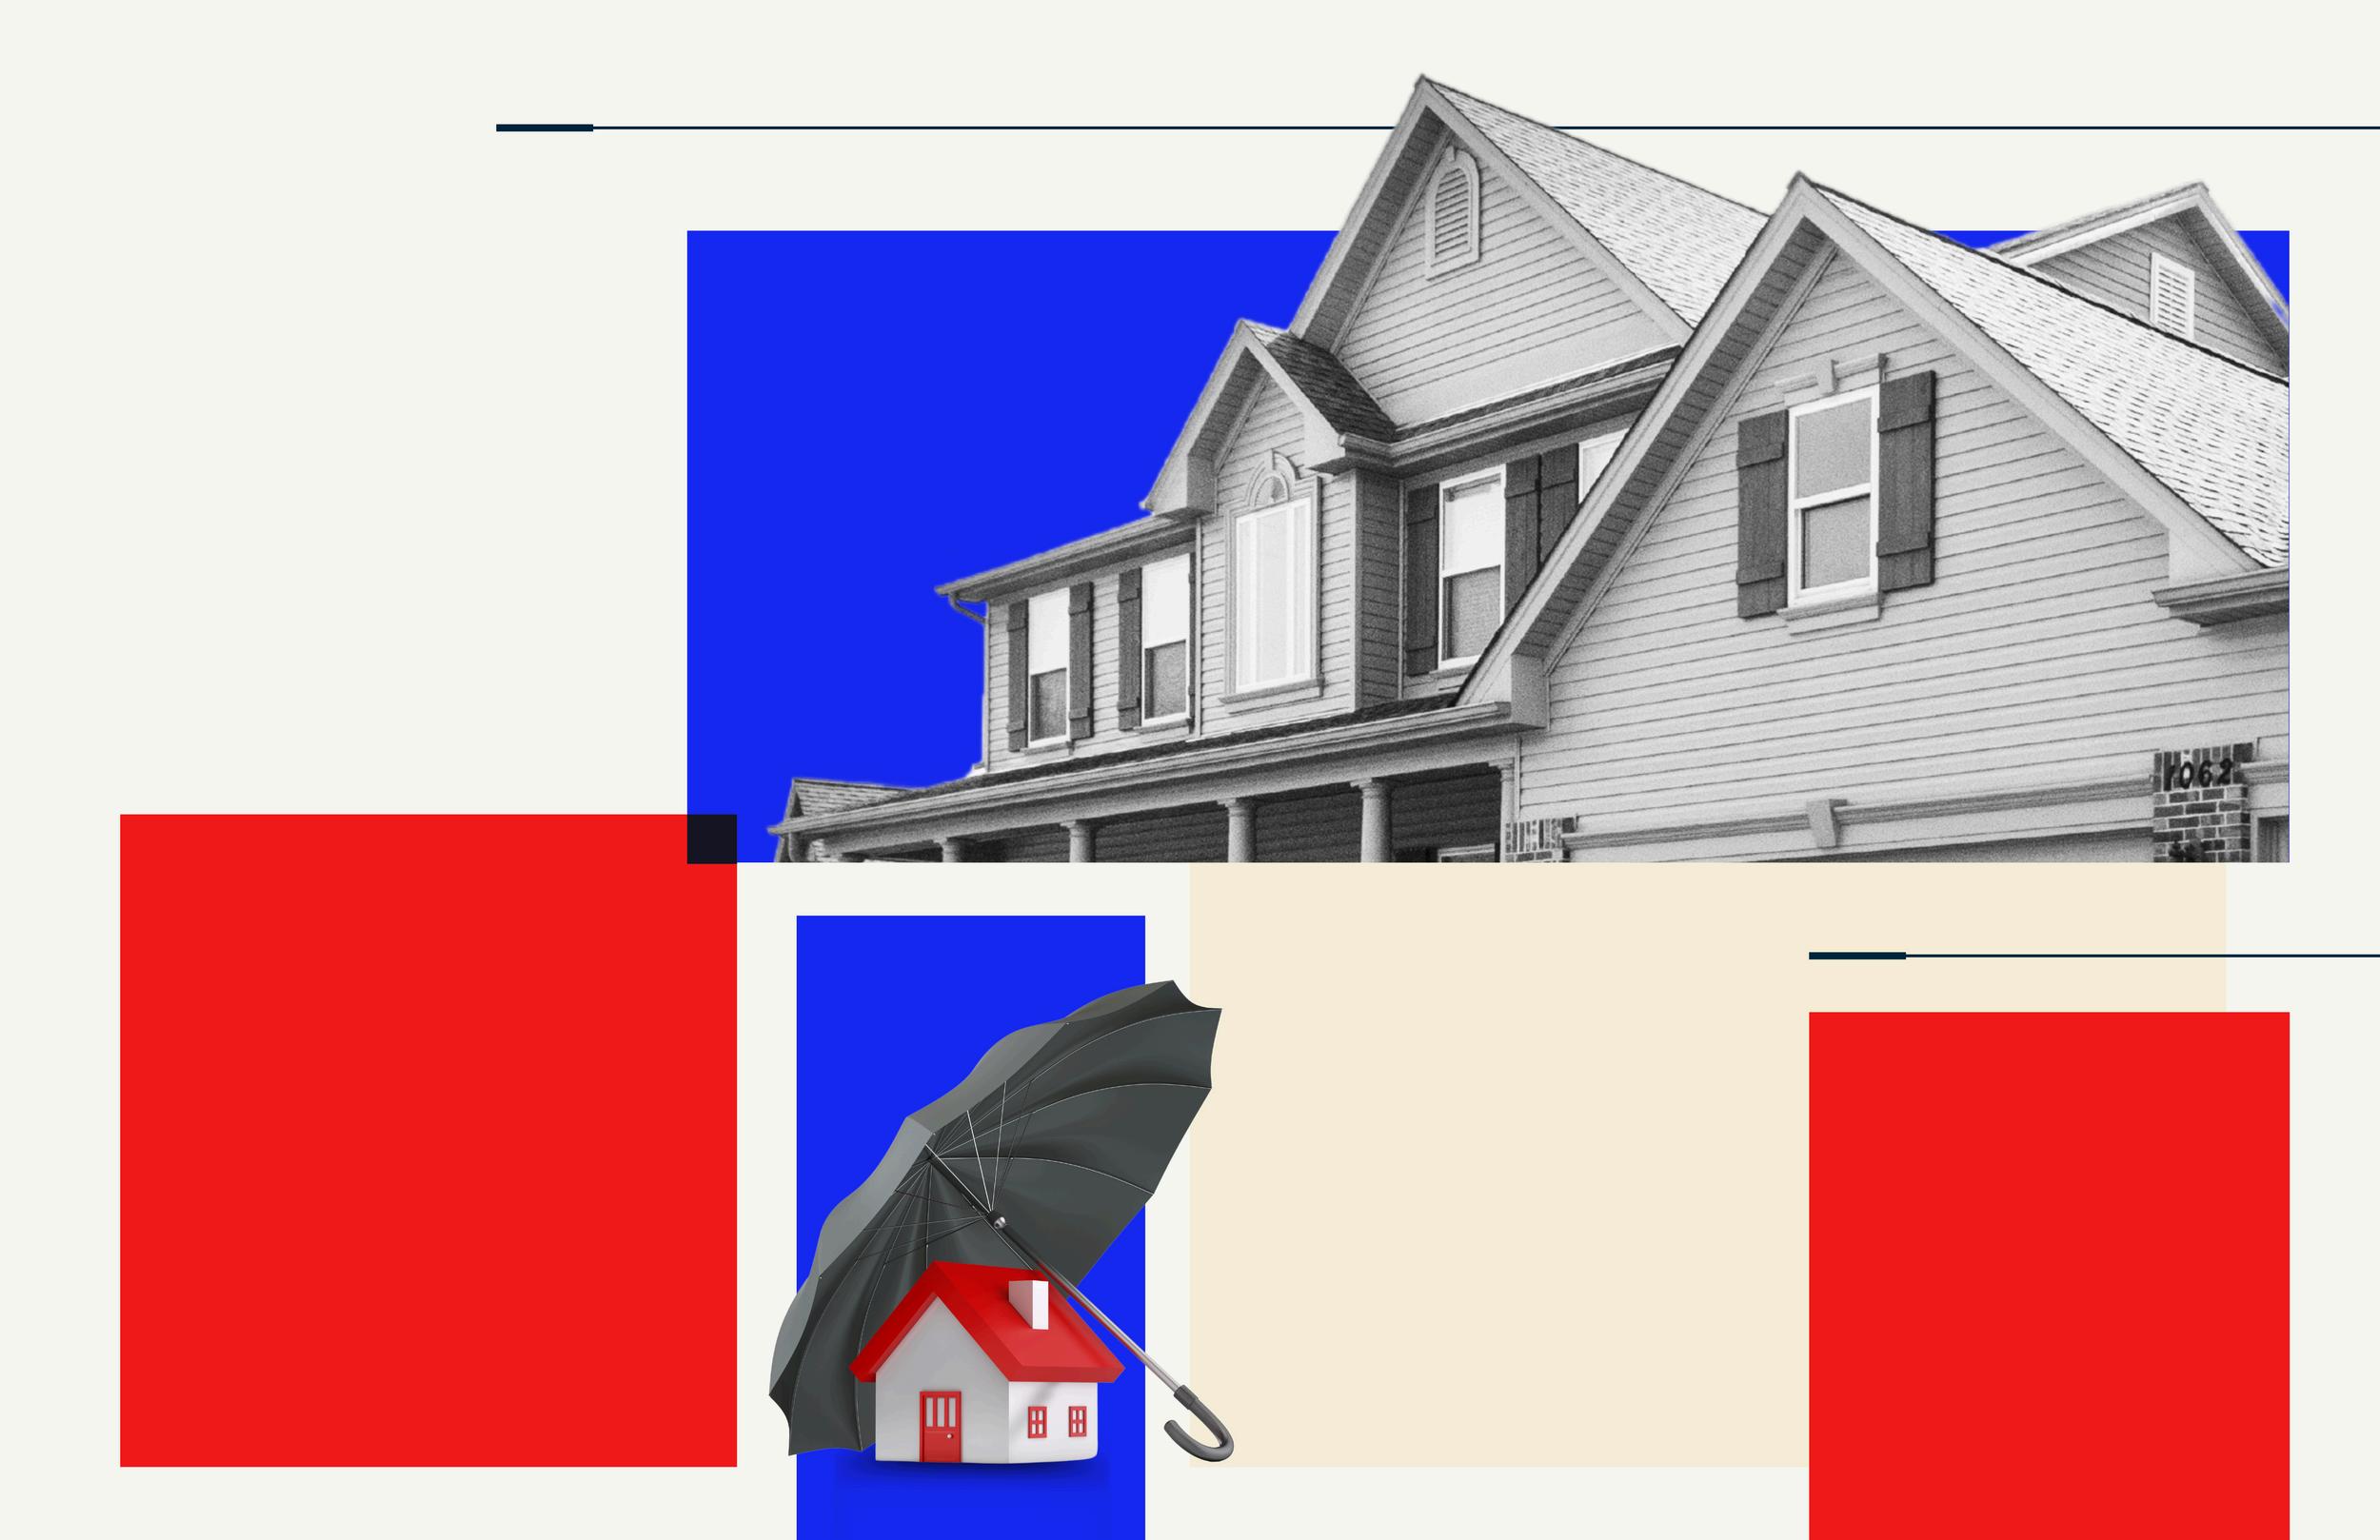
Smart Strategies for a Mortgage Application
Avoid paying off debts or collections without professional advice.
Don't have your credit report pulled too many times - this can hurt your credit score. 3 4 5 6 1 2
Always consult your mortgage professional before making large financial moves. Use verified funds for deposits to prevent closing delays.
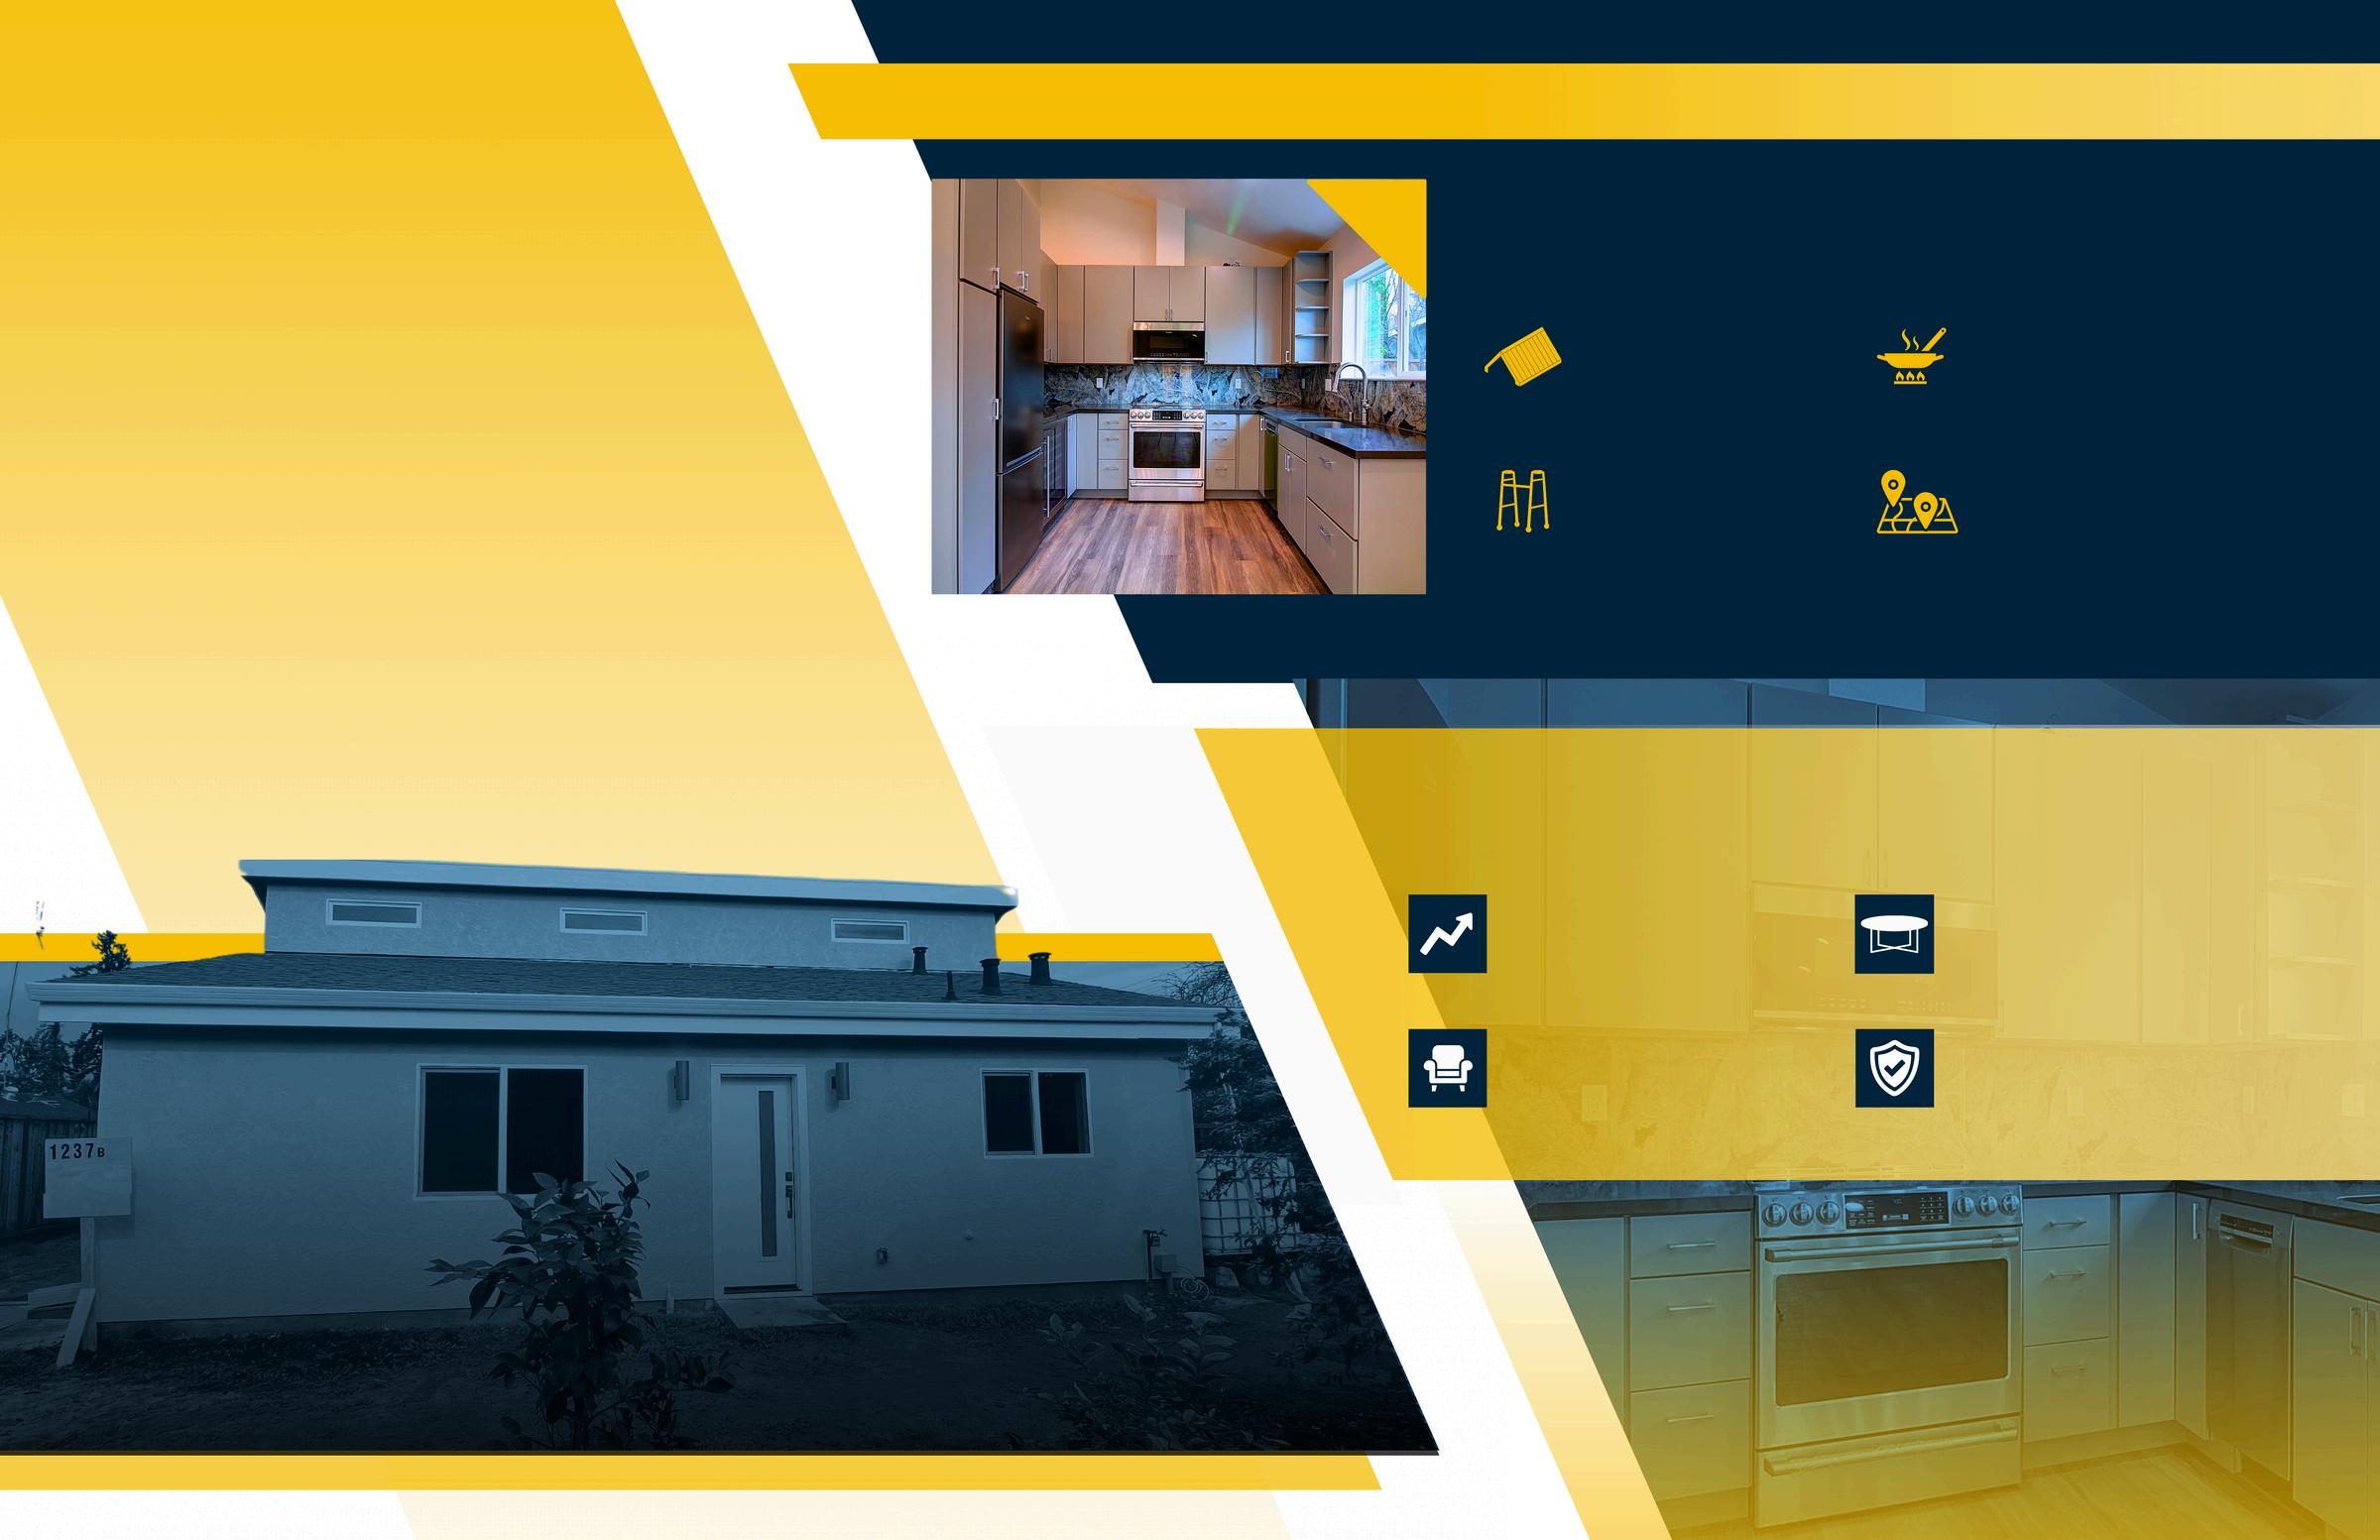
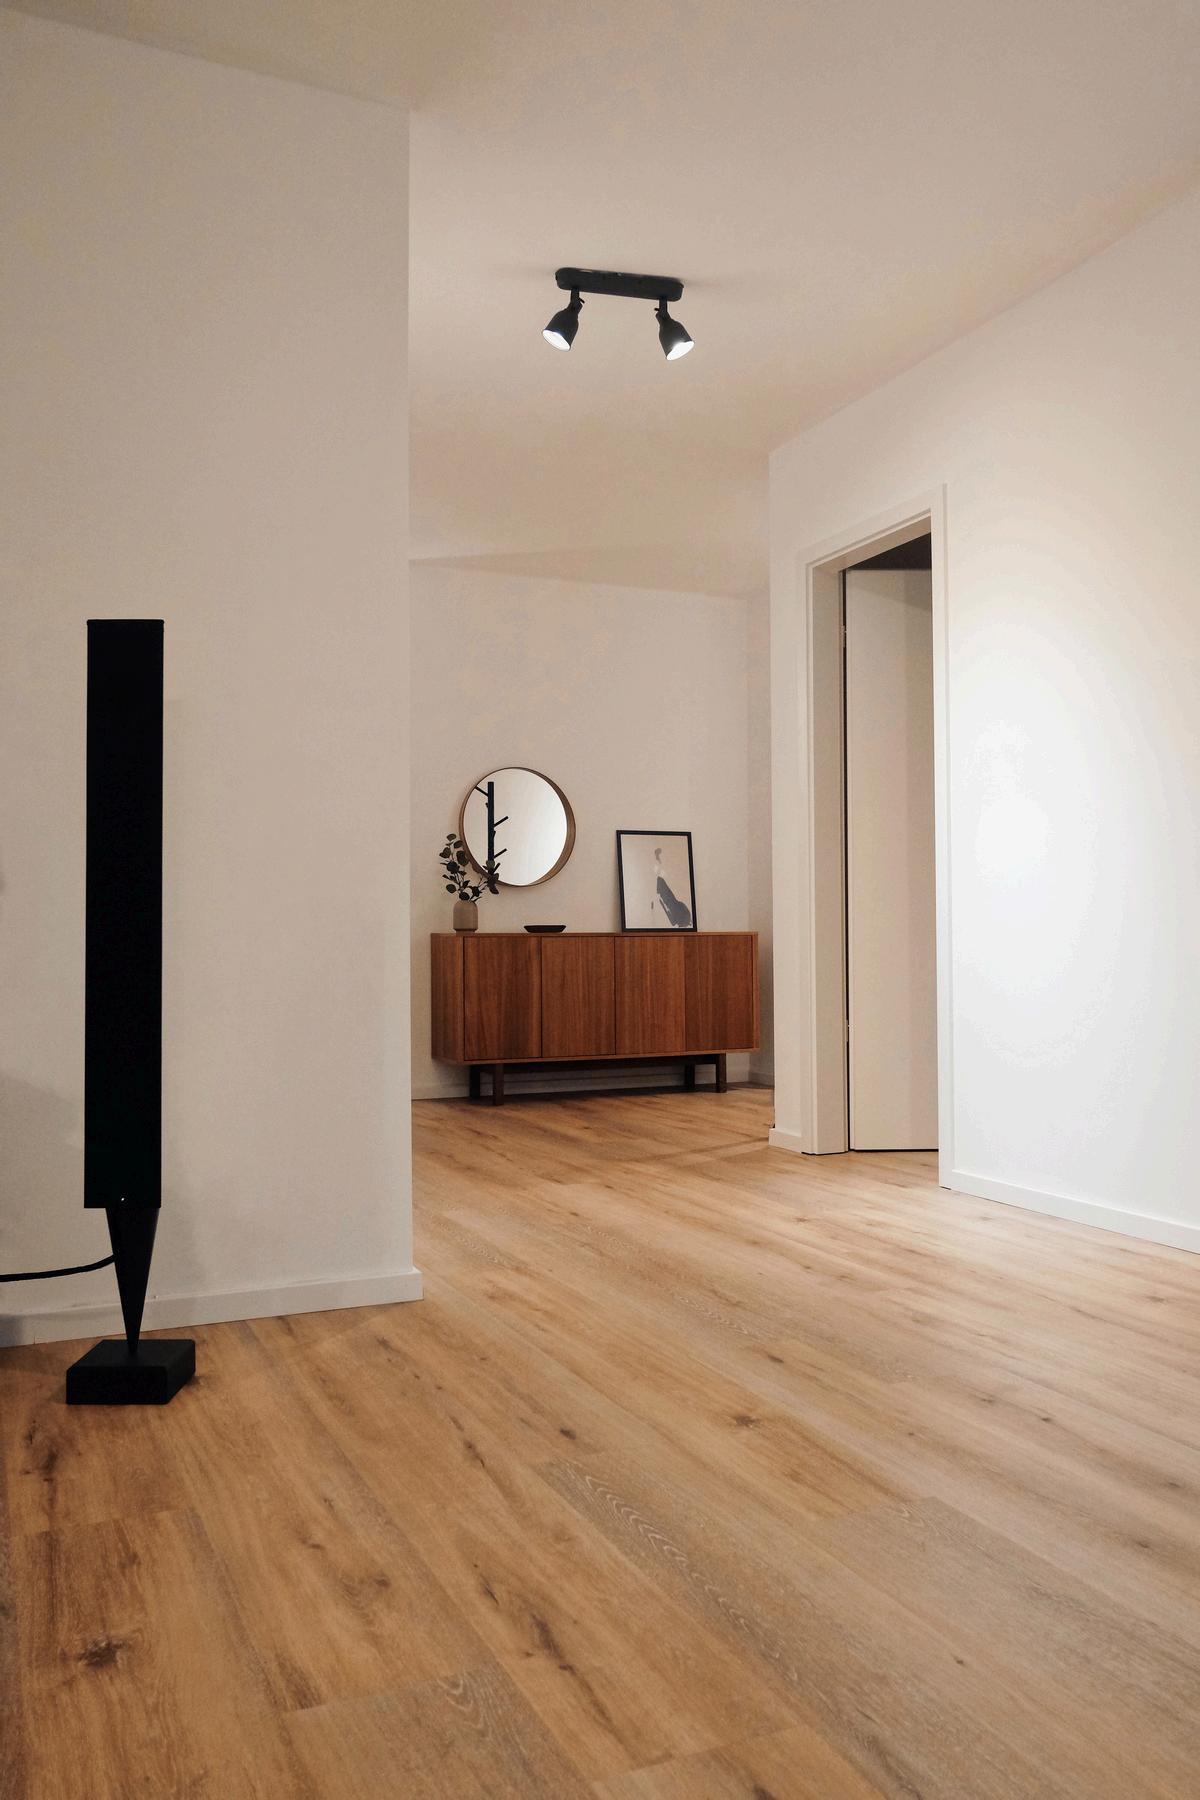
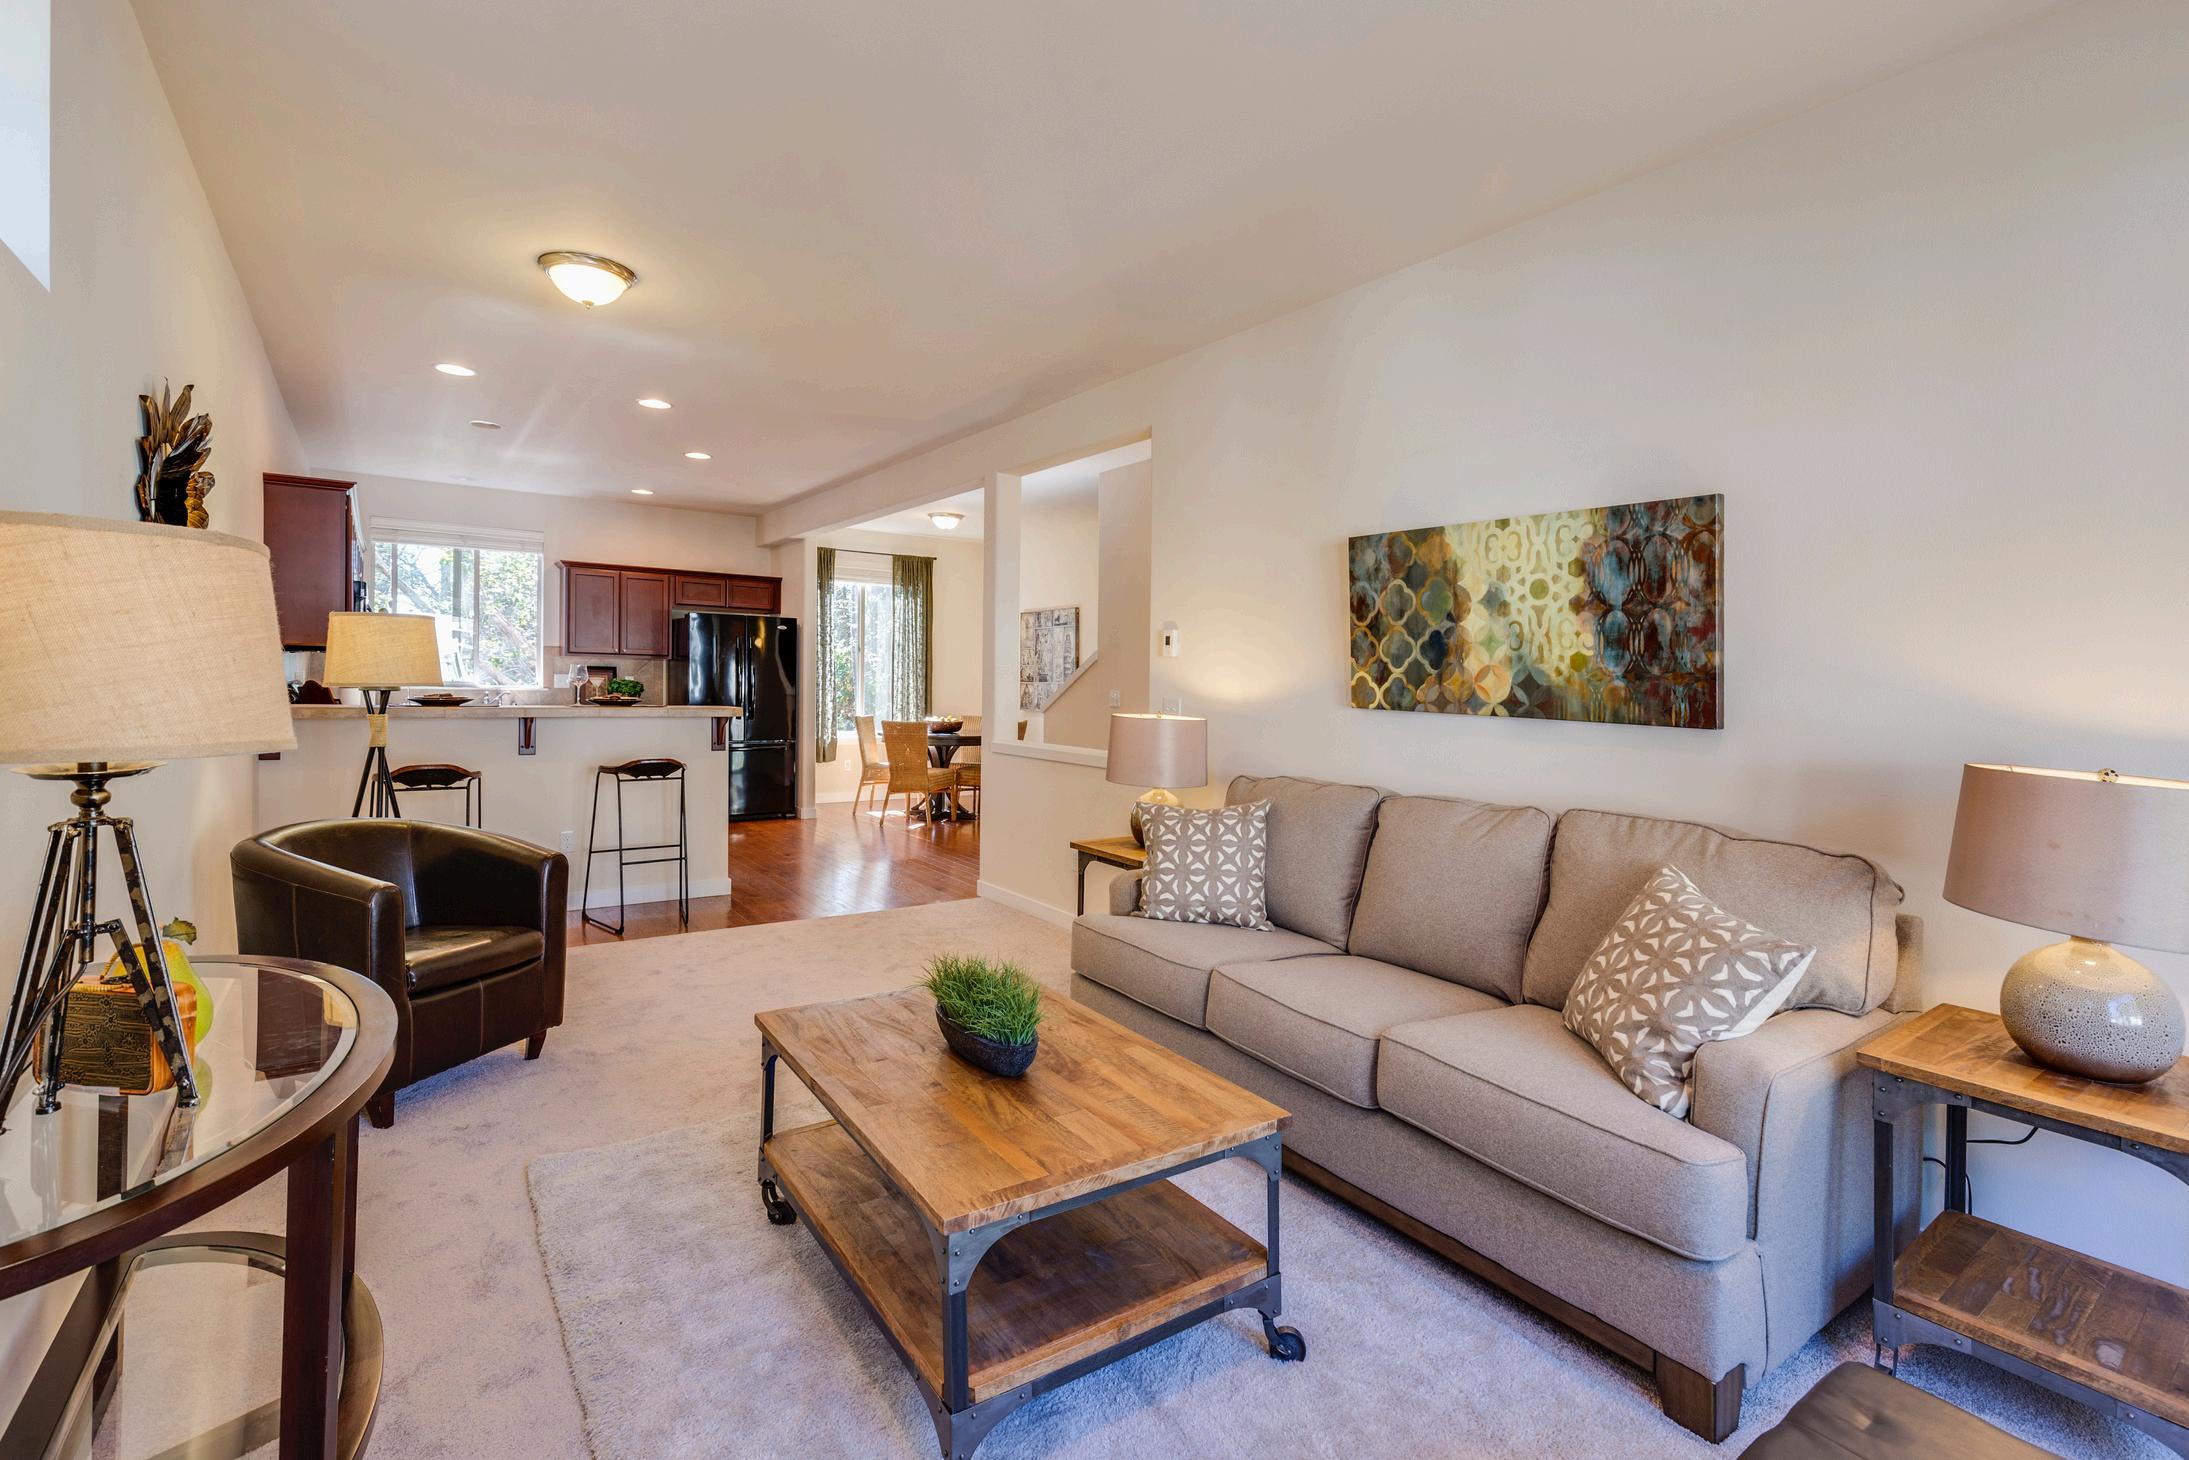
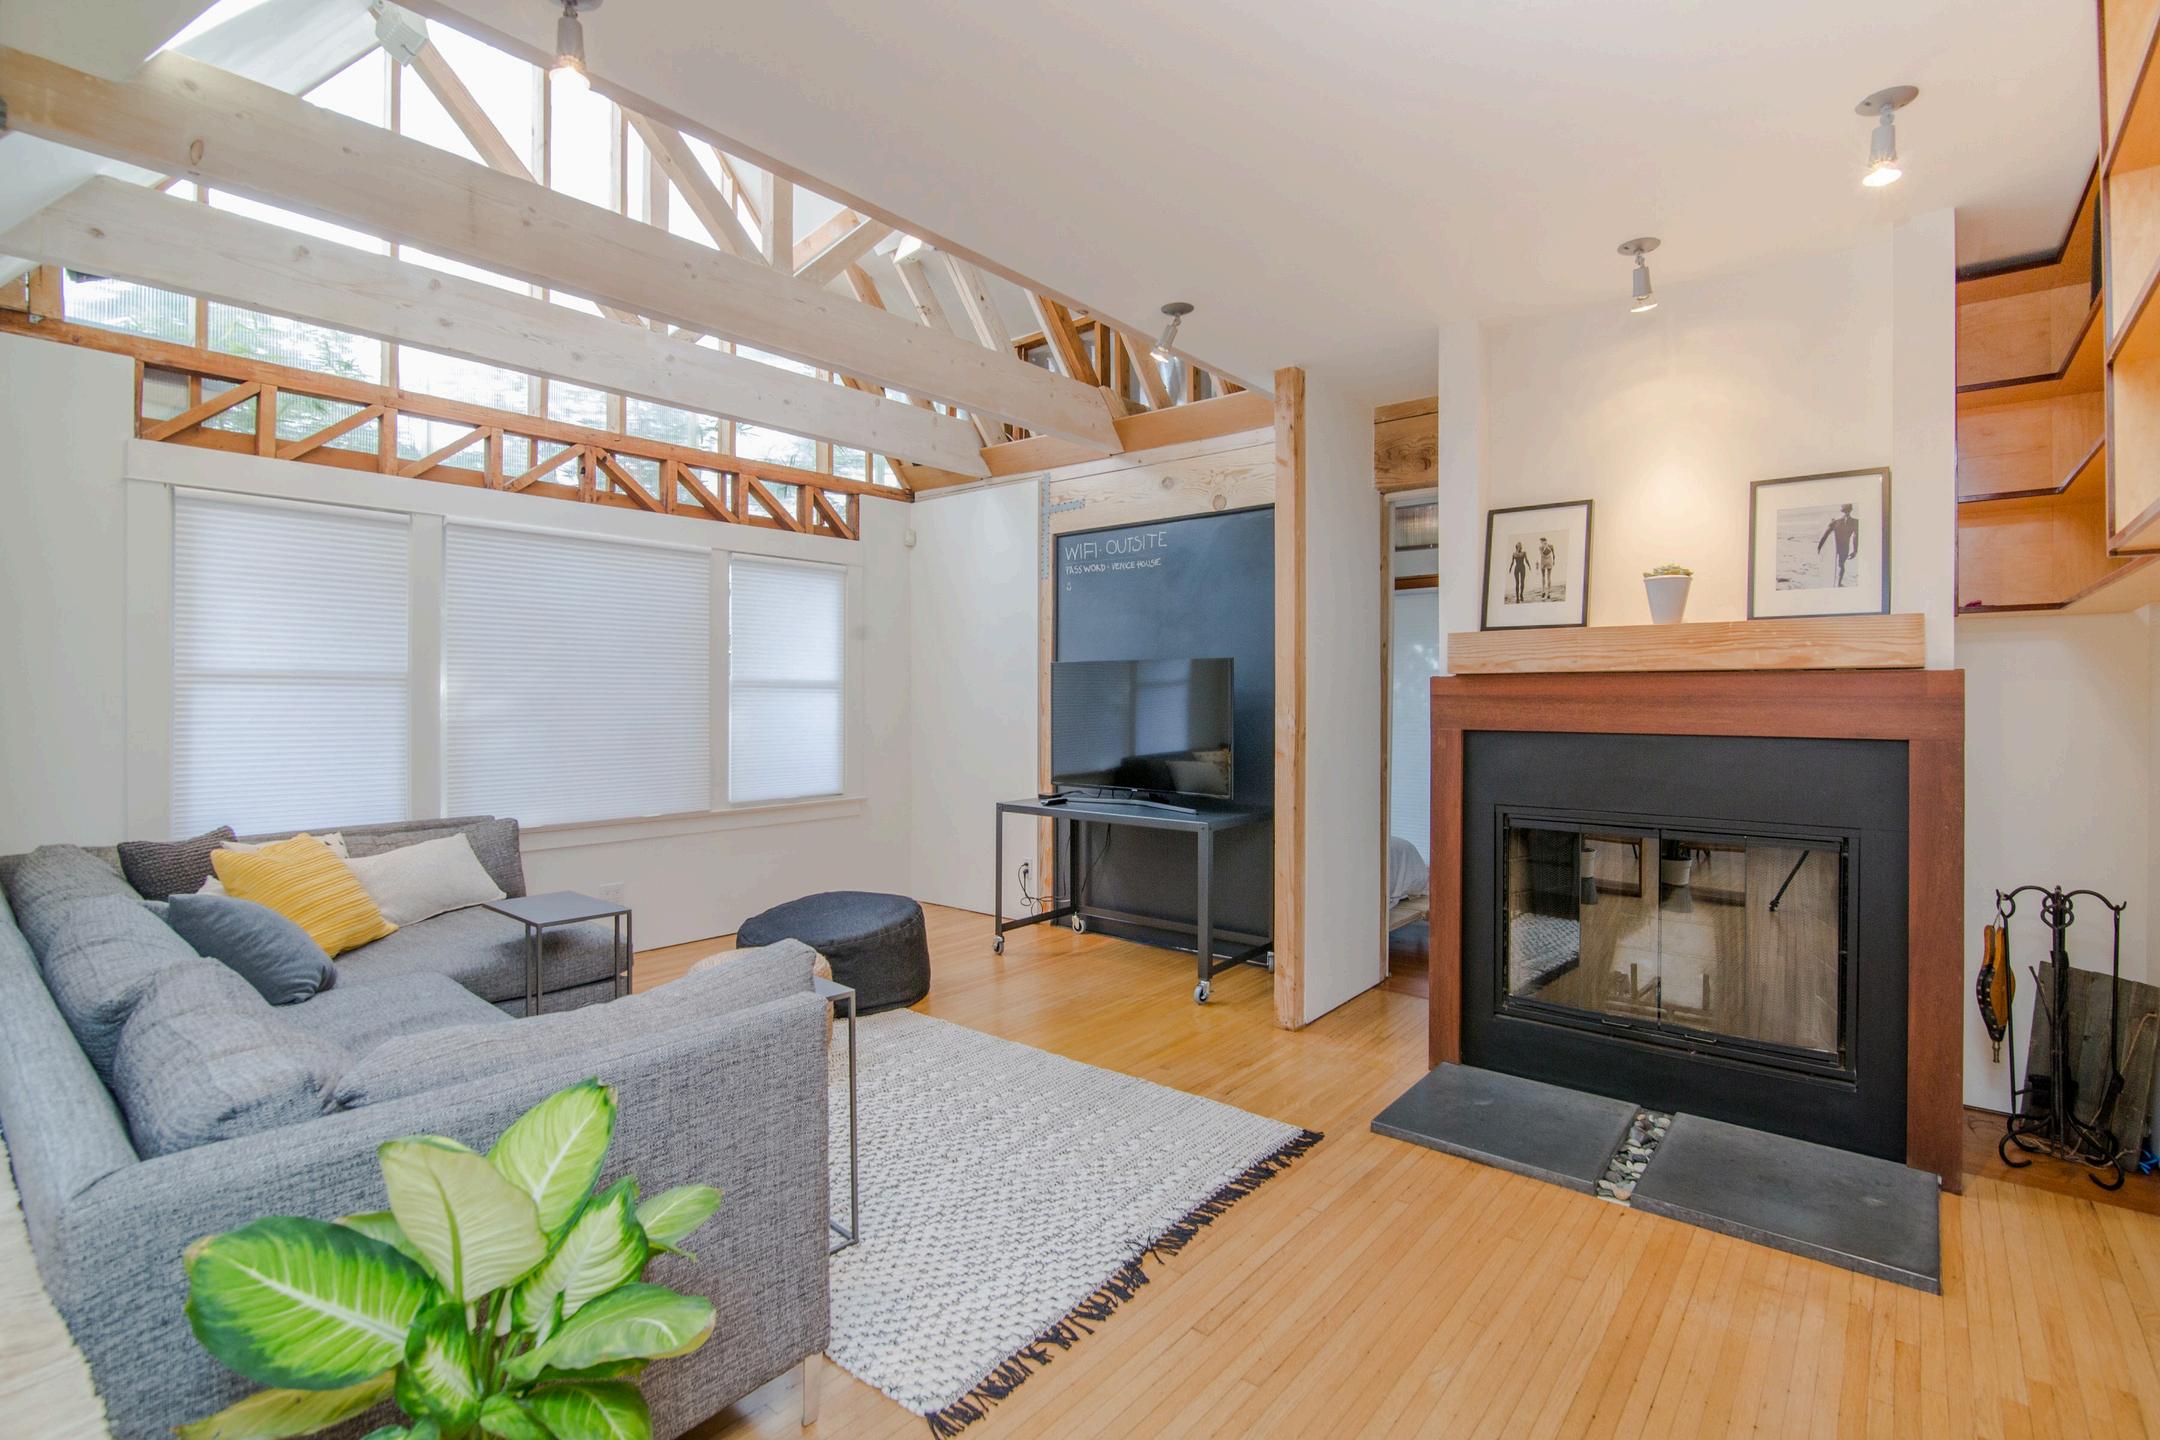
HomeRenovationsThatCanMakea BIG IMPACT AccordingtoExperts
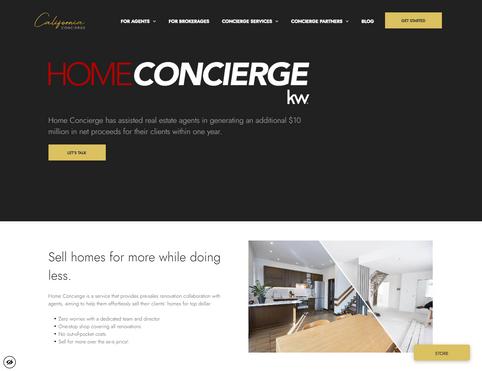
Enhancing Property Value and Family Living Space with an Acton ADU
The Anenberg-Essert family in Campbell collaborated with Acton ADU to create a versatile, comfortable, and valuable addition to their property. This ADU project is a shining example of how a well-designed accessory dwelling unit can increase property value and serve a family’s unique needs.
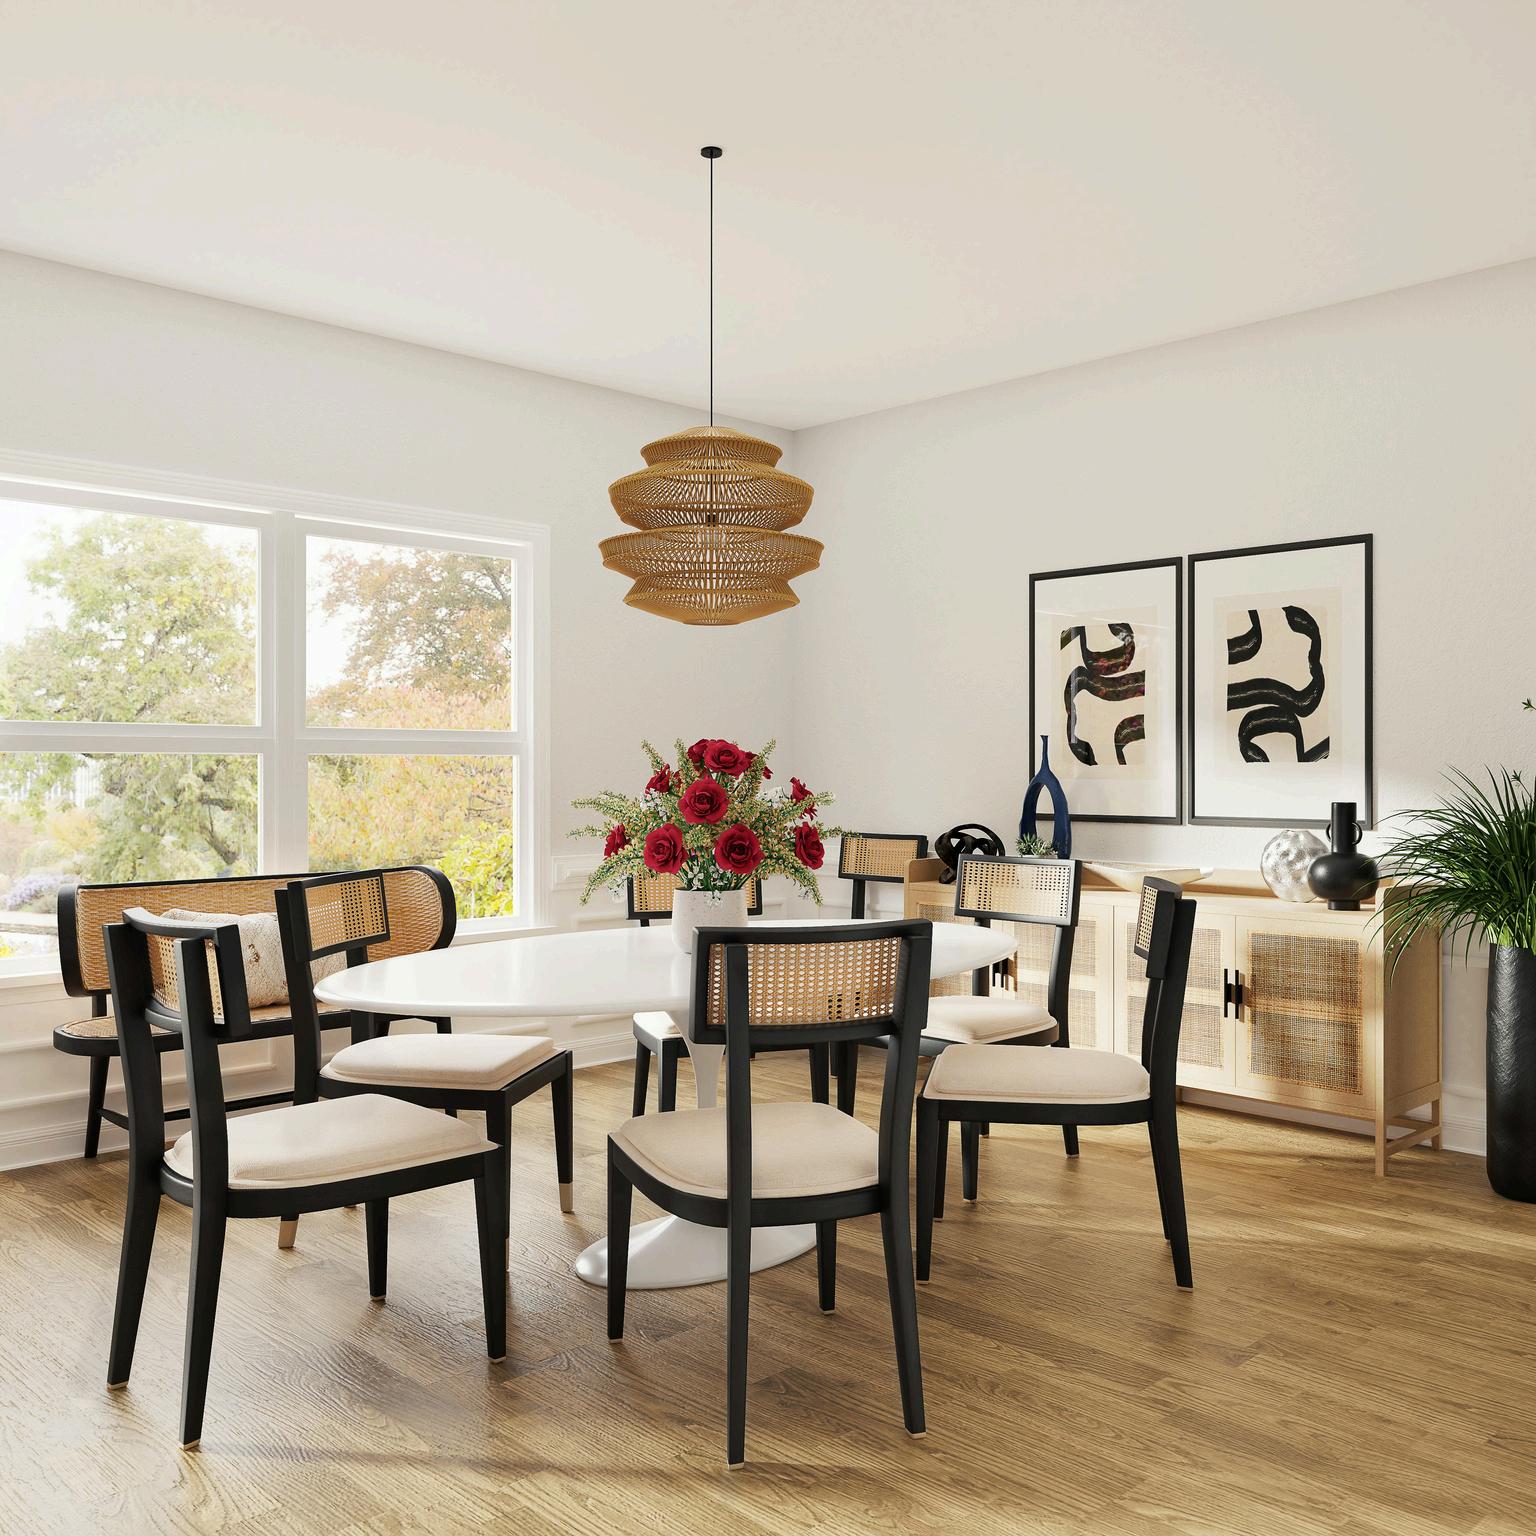
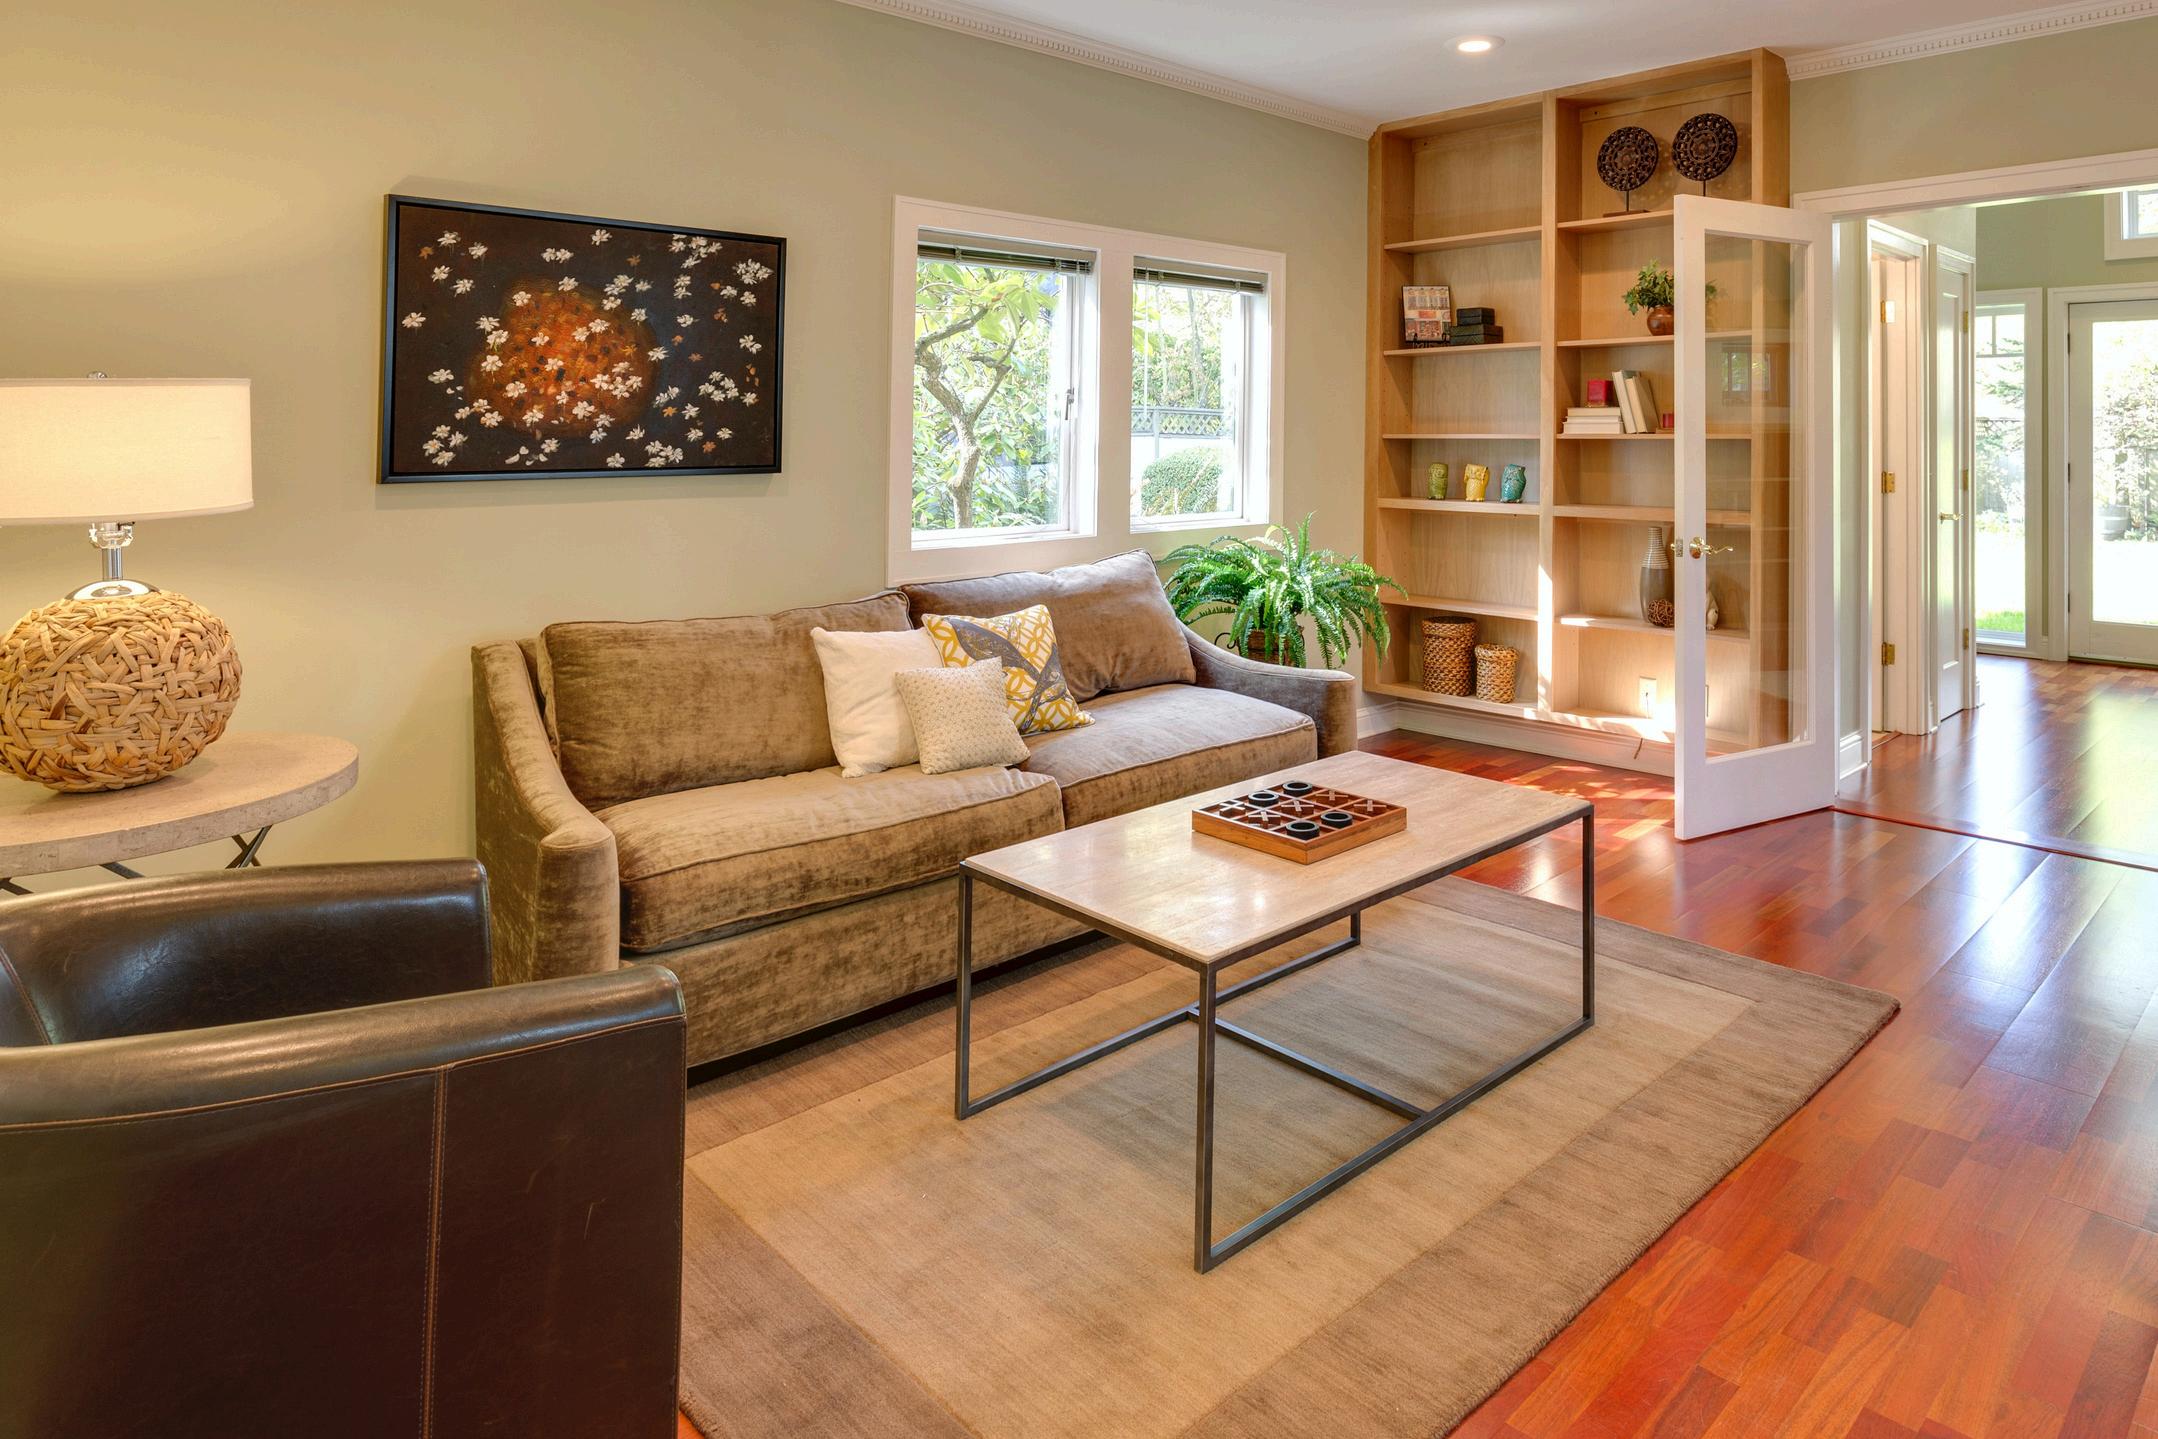
GoalsandVision
The family envisioned an ADU that would function as an independent living space for family members, enhance their property’s worth, and provide seamless integration with the main home They wanted a space that balanced privacy with connectivity, feeling like a natural extension of their residence
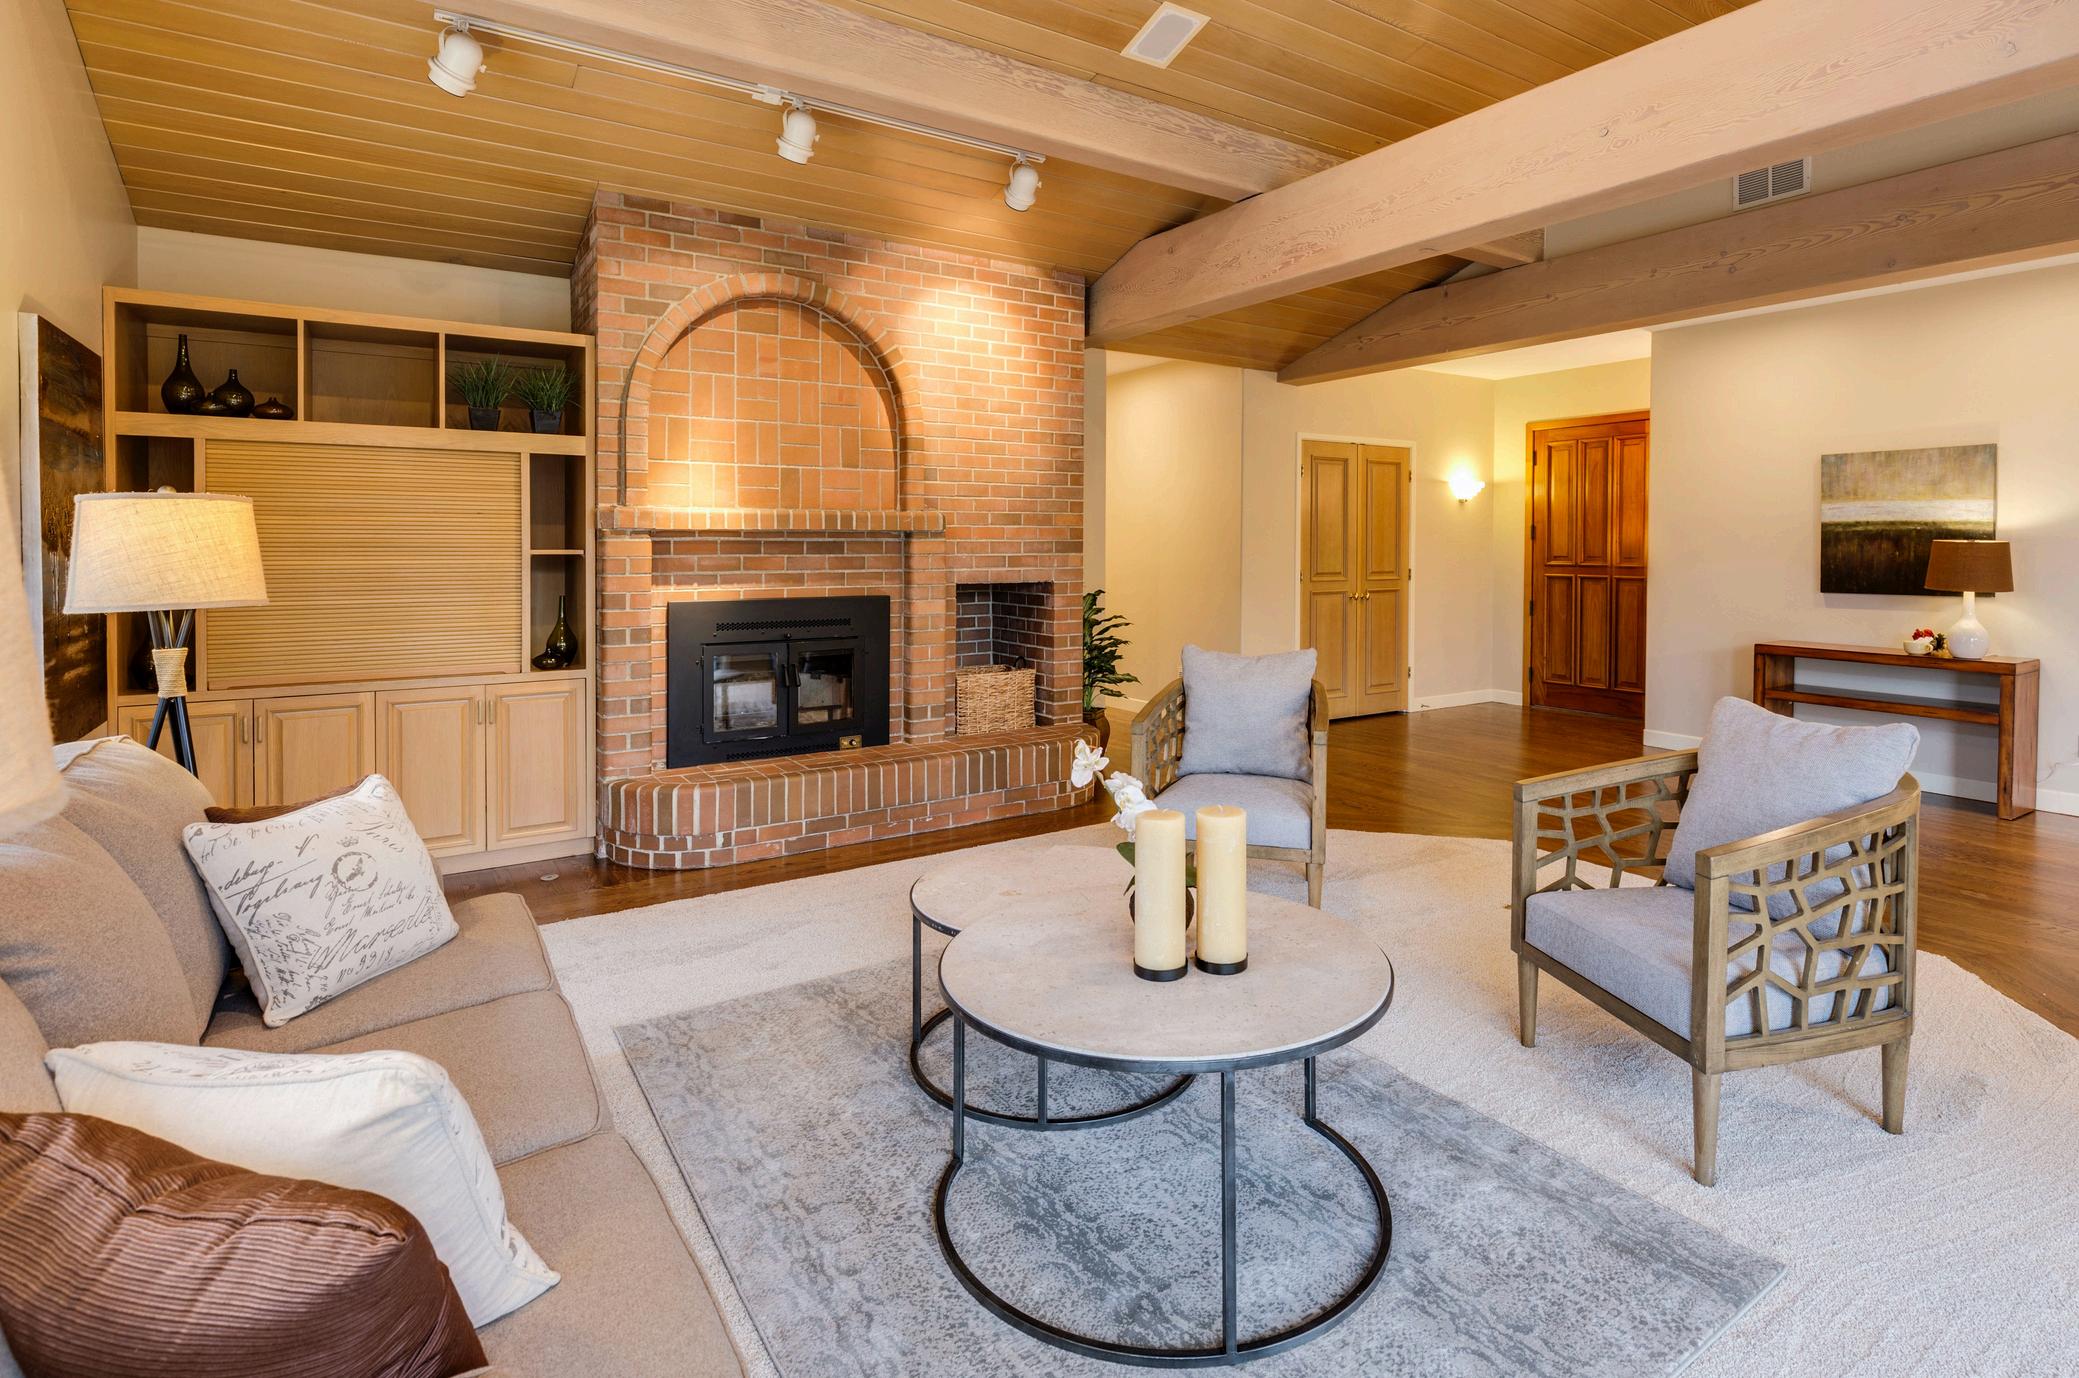
Design and Construction Details
Constructed at 747 square feet, this ADU was designed with modern, high-quality finishes to serve both aesthetic and practical needs. Key features include:
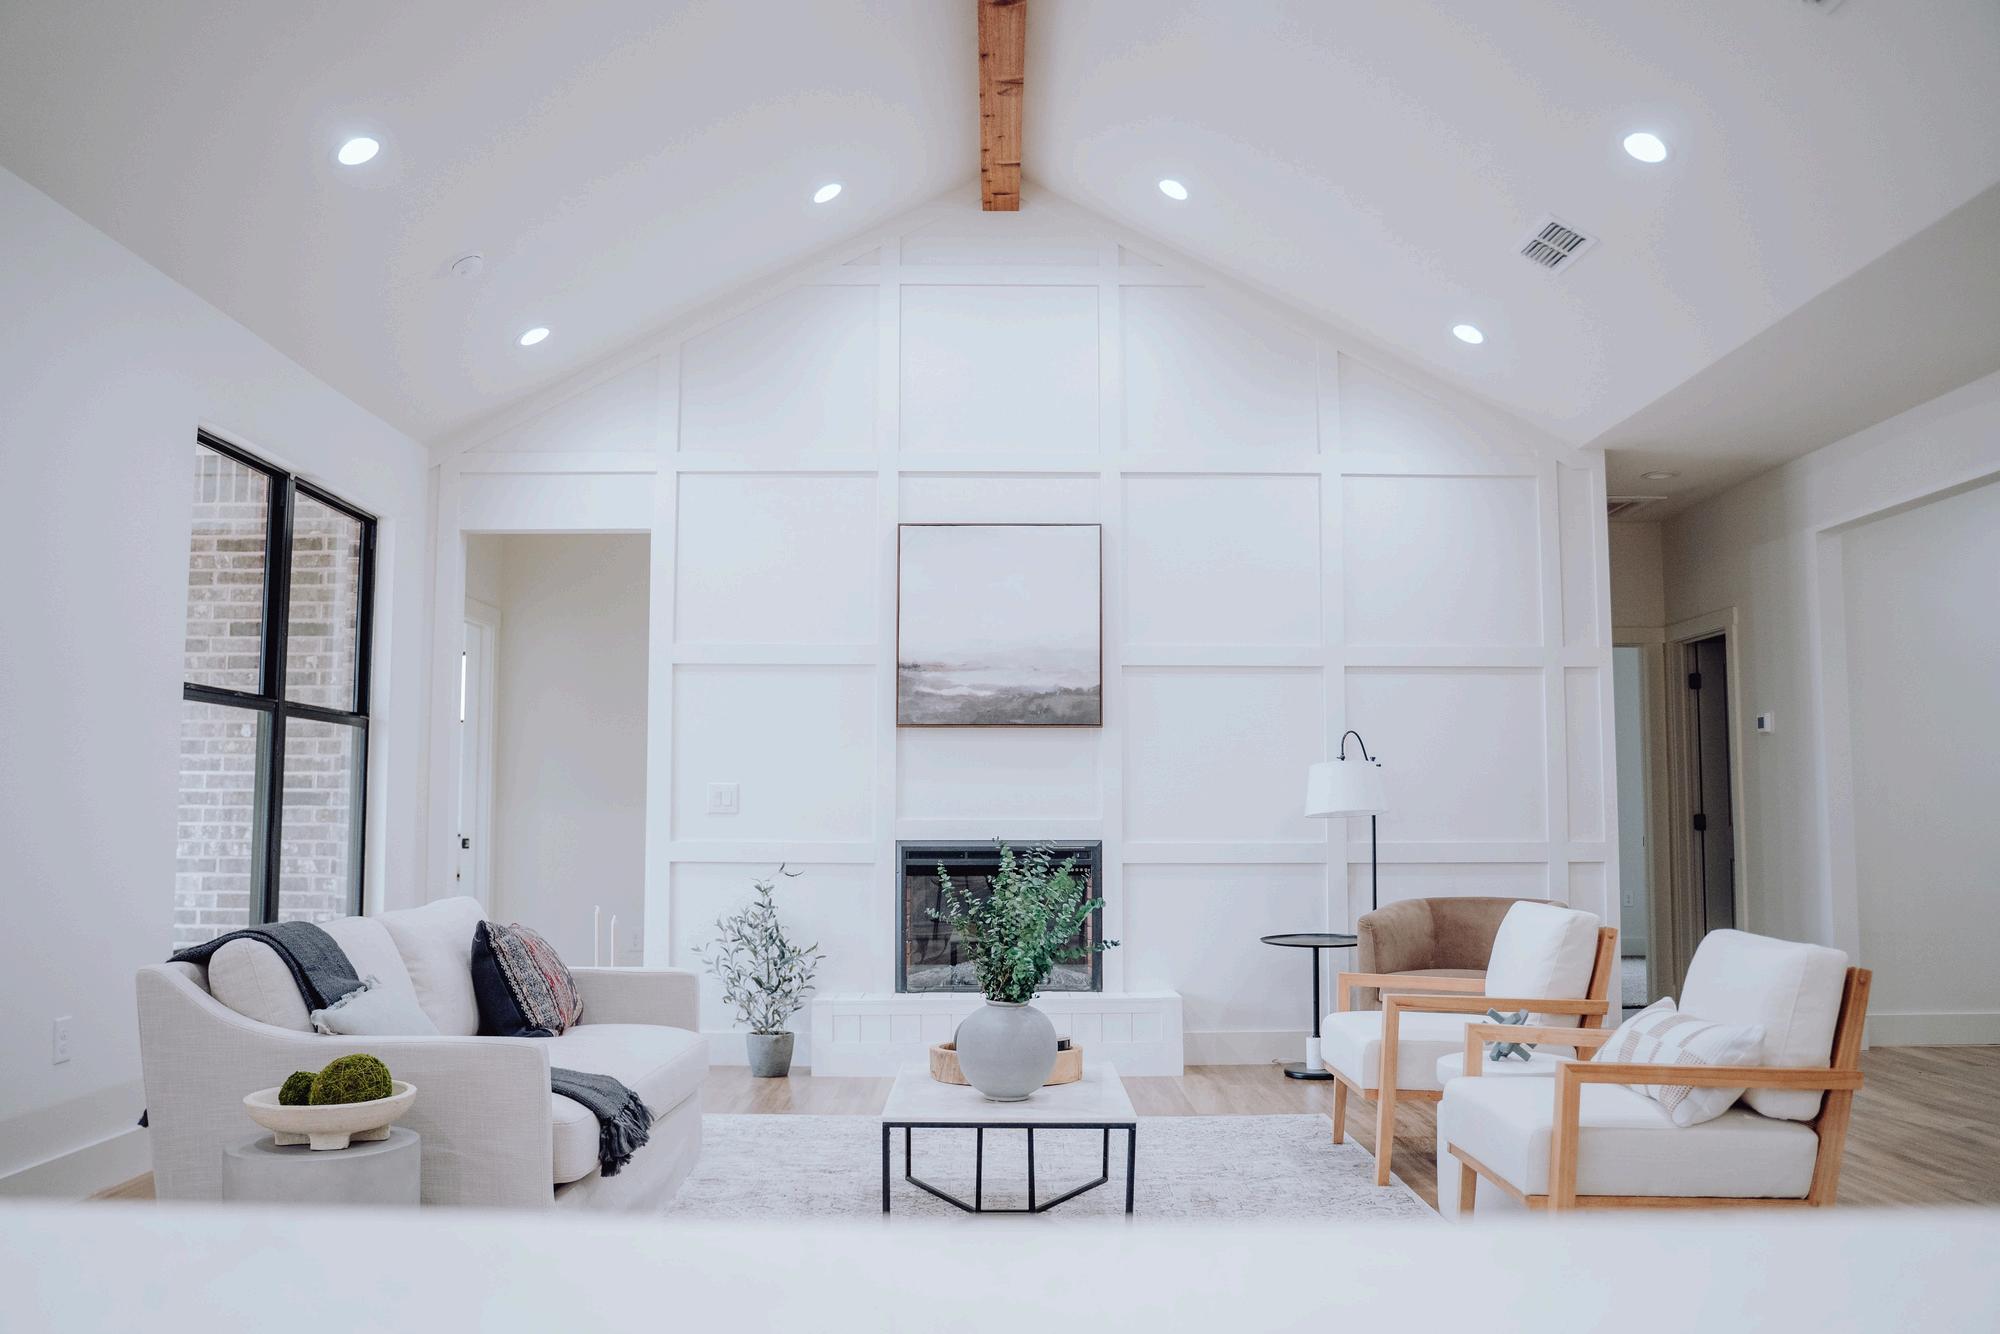
Vaulted Ceilings
Creates a spacious, open atmosphere
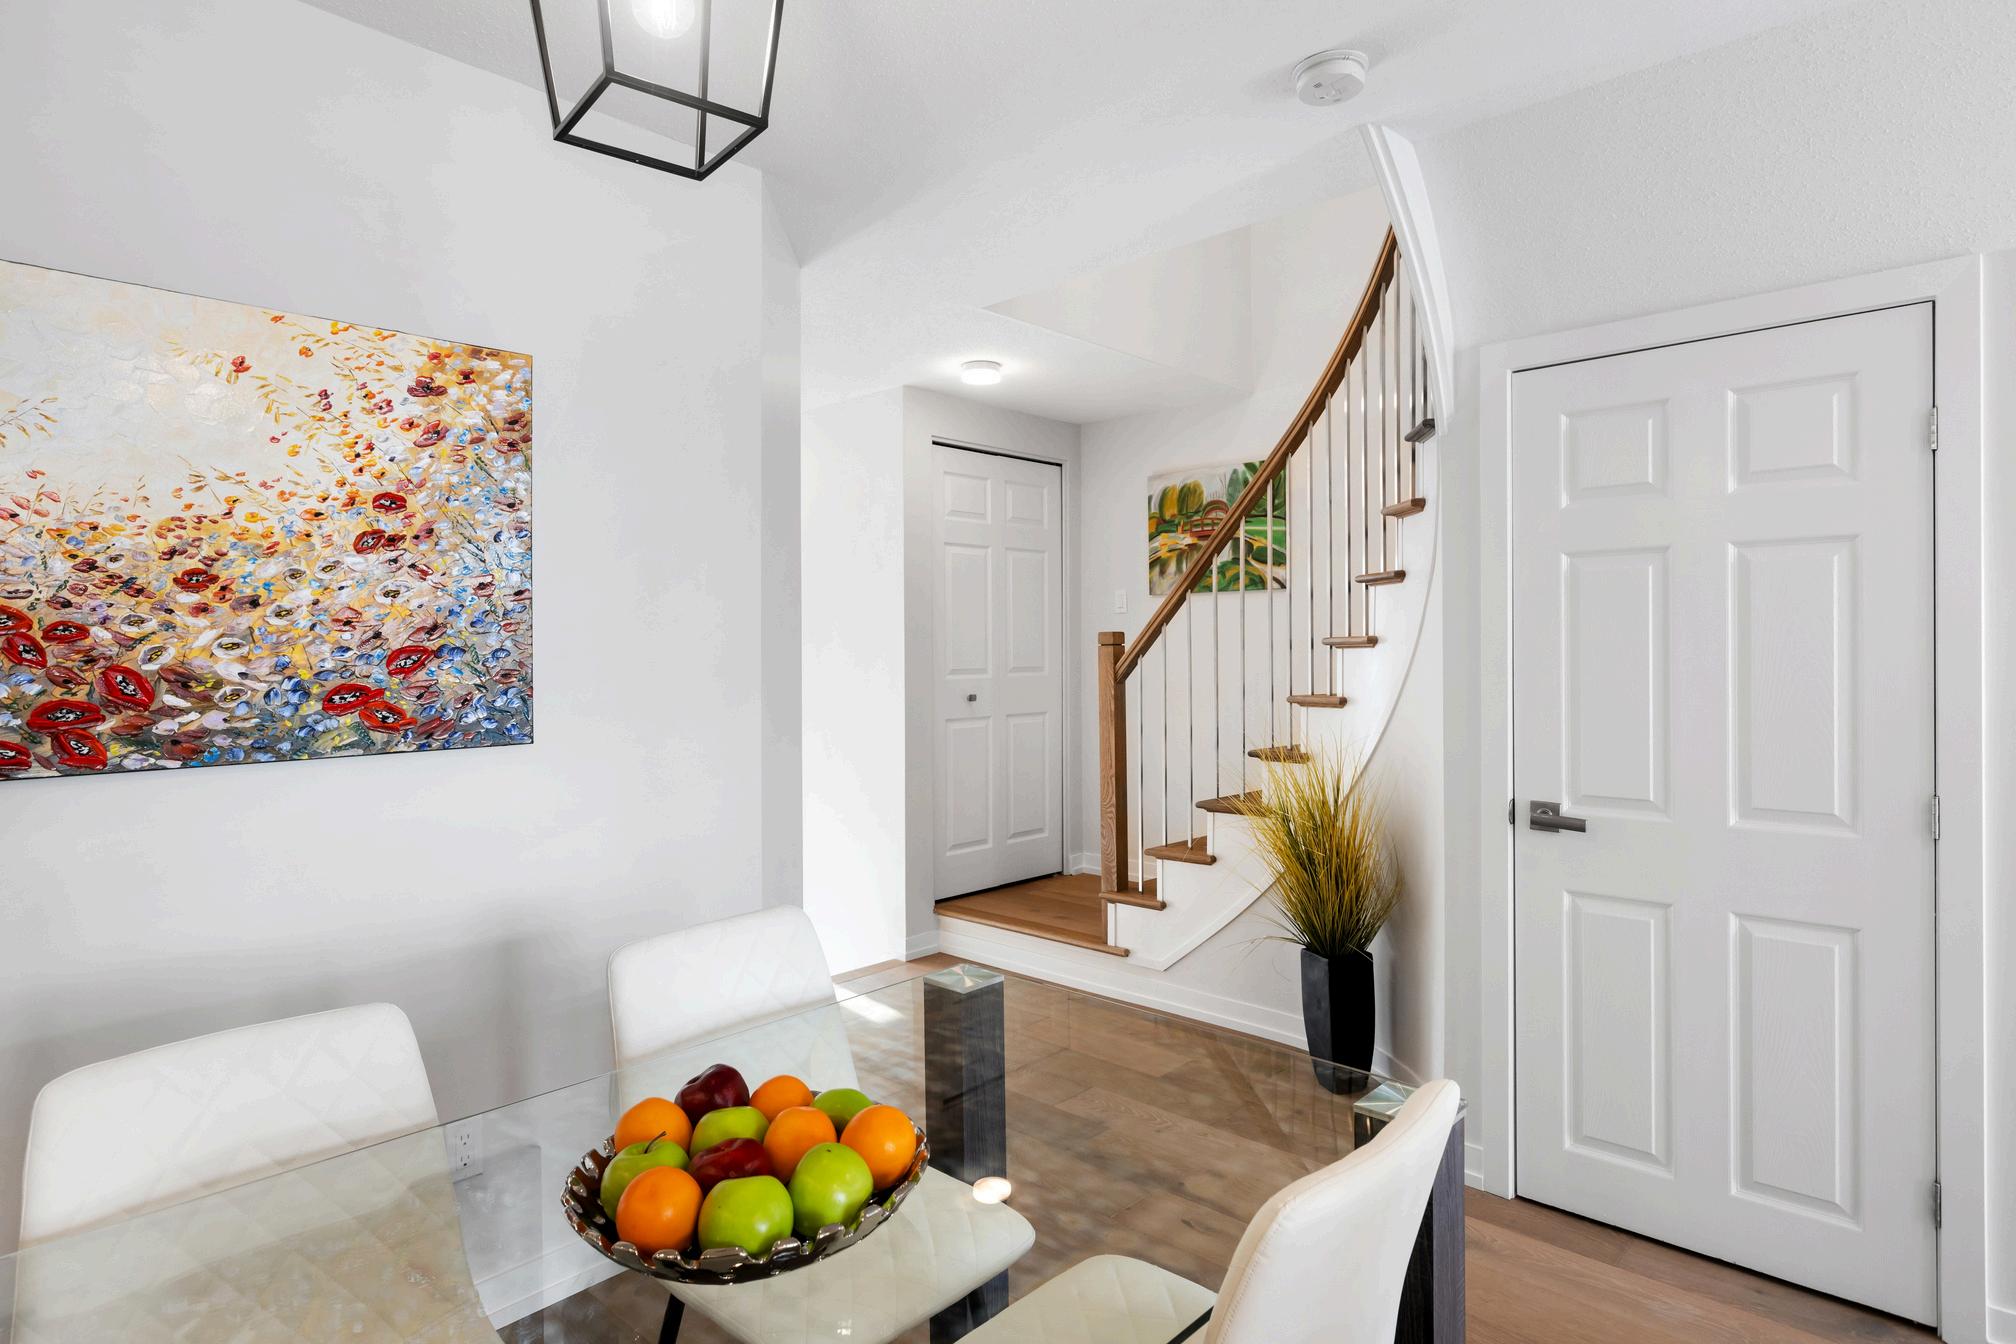
Senior-Friendly Living
Safe, independent space for elderly family members
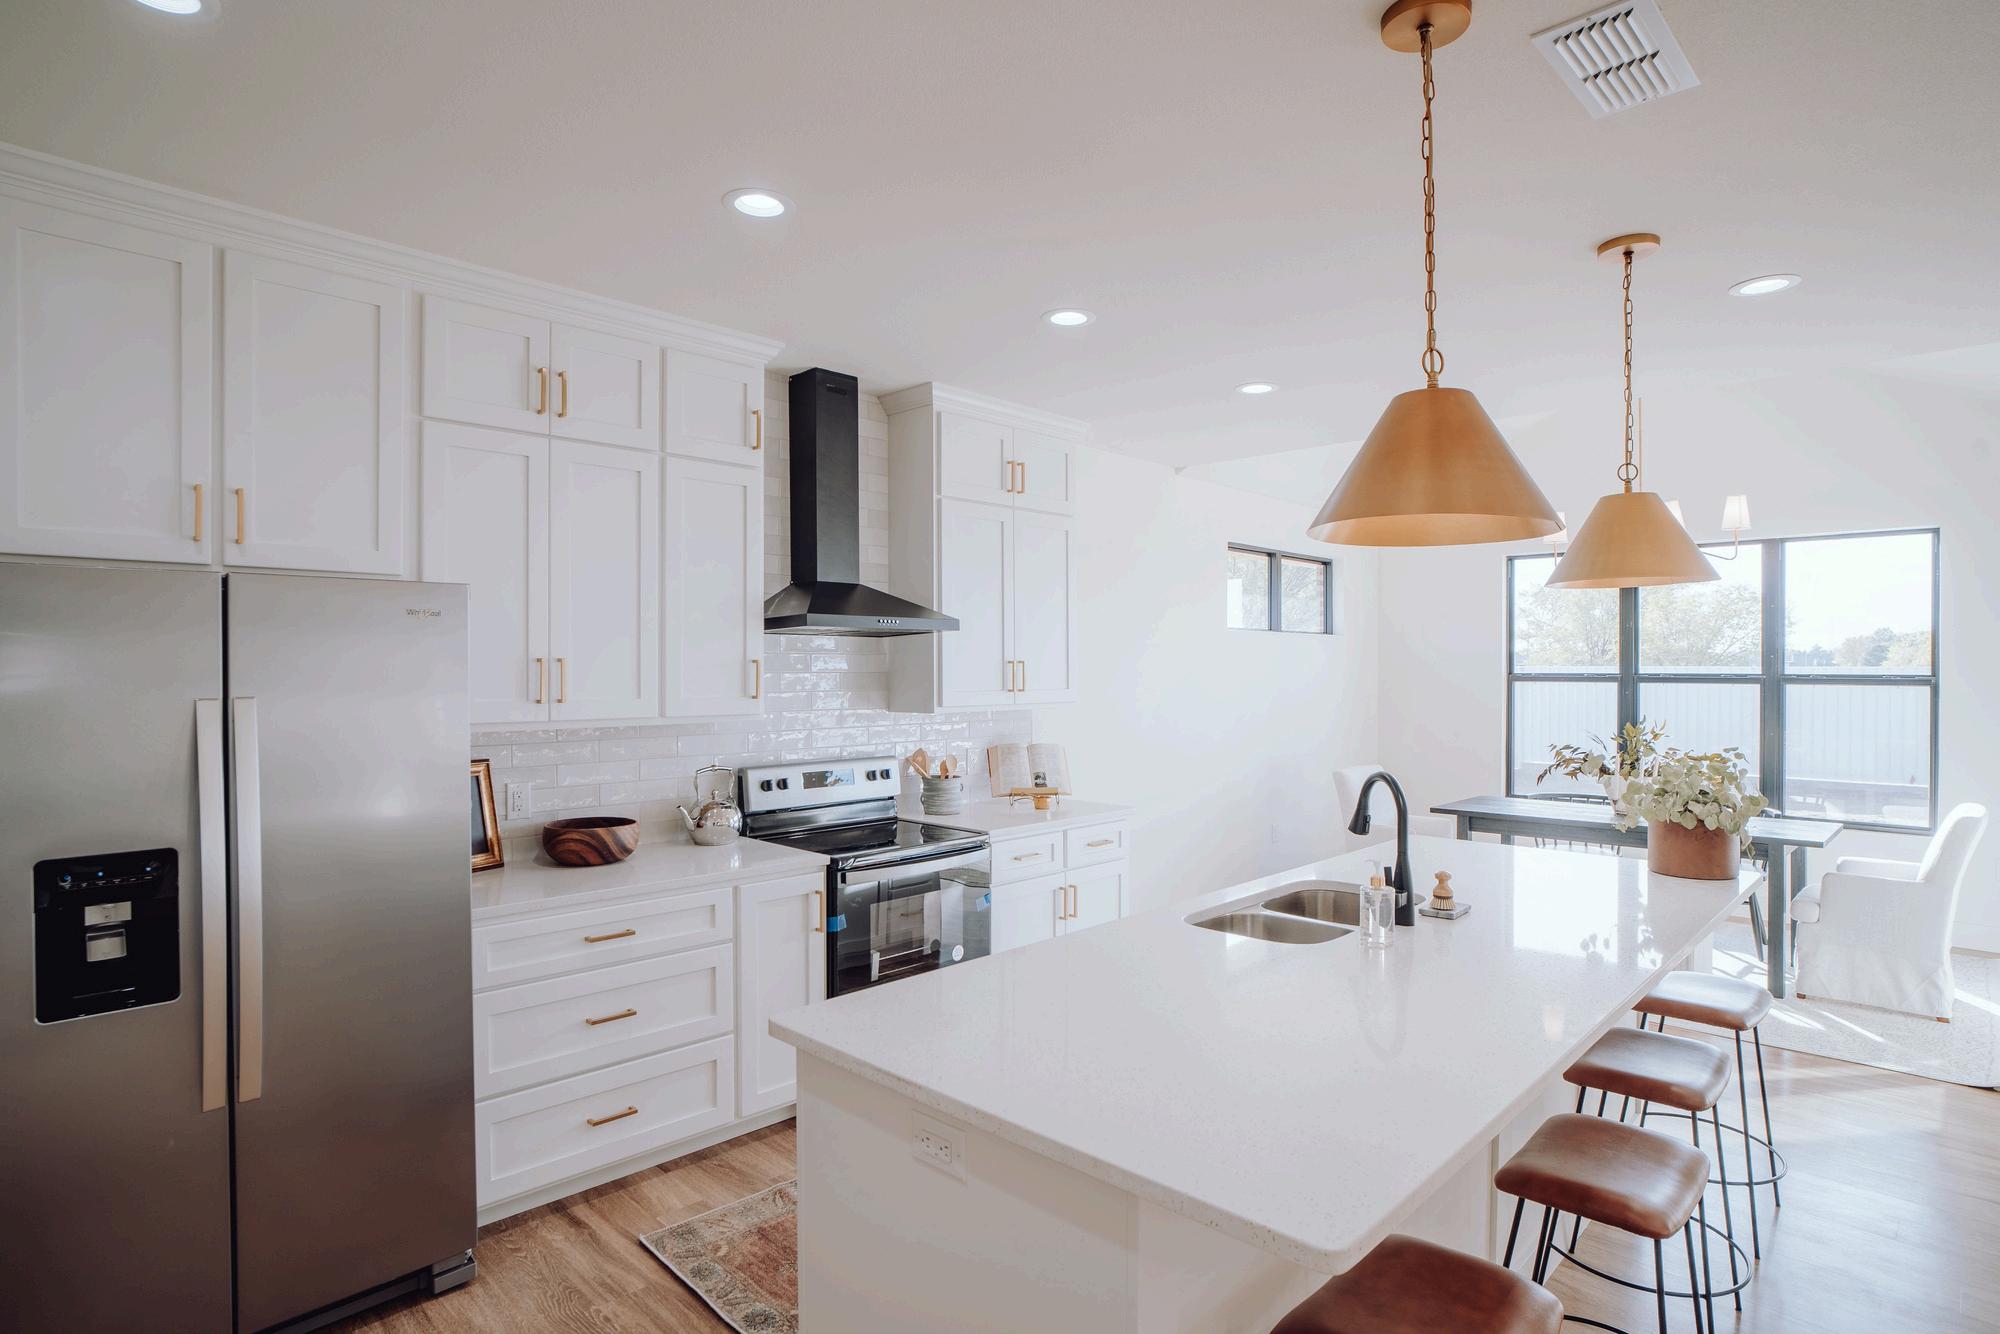
Fully Equipped Kitchen
Modern amenities for everyday convenience
Open Living Area
Multipurpose area for relaxation and entertainment
Results and Impact
The completion of the Anenberg-Essert ADU led to several valuable outcomes:
Increased Property Value
The ADU addition significantly boosted property value
Flexible Living Space
A versatile space for family, guests, or as a rental
Modern Comforts
High-end finishes and amenities enhance both function and style.
Enhanced Family Living
The ADU enriches the AnenbergEssert family’s home with both privacy and connection
VENDOR DIRECTORY
When it comes to home ownership, knowing who you can trust is crucial. That's why we've curated a select list of trusted vendors who are ready to help with your home goals.
Alameda
What's in the Alameda data?
There were 2,037 single-family homes for sale, providing 1.5 months of inventory. There were 1,052 new listings, and 624 homes sold at a median price of $1.3m. The median overbid percentage was at 108.7%, with an average of 20 days on the market.
There were 1,074 condo and townhome units for sale, providing 3 1 months of inventory There were 459 new listings and 203 units sold at a median sale price of $765k. The median overbid percentage was at 100.6%, with an average of 34 days on the market.
mily Homes
2 ory
624 Sold Listings
$1.3M Median Sale Price
7% ist
20 Avg Days on Market
InfoSparks, includes all single-family homes, condos and California Area above from March 2024 to March 2025. This may and may vary from the time the data was gathered. All data is guaranteed. DRE# 01995149. Copyright KW Advisors San Francisco | Napa Valley 2025. Each office is independently owned and operated.
Condo & Townhomes
459
New Listings
203
Sold Listings
3.1
Months of Inventory
100.6%
Median Sale vs List
$765K
Median Sale Price
34
Avg Days on Market
AlamedaCounty
MARCH 2024 - MARCH 2025
Single-Family Homes
Last 12 months, year-over-year.
Condos & Townhomes
Last 12 months, year-over-year
Single-Family Homes
The median sale price has decreased from $1 4m last March 2024, to $1 3m as of March 2025
Condos & Townhomes
The median sale price has decreased from $778k last March 2024, to $765k as of March 2025
AVGDays OntheMarket
Single-Family Homes
The average time spent on the market went up from 16 days last March 2024, to 20 days as of March 2025
Condos & Townhomes
The average time spent on the market went up from 23 days in March 2024, to 34 days as of March 2025.
Overbids
Single-Family Homes
The overbid percentage has increased from 108 3% last March 2024, to 108 7% a year later
Condos & Townhomes
The overbid percentage has decreased from 103.4% last March 2024, to 100.6% a year later.
Contra Costa
What's in the Contra Costa data?
There were 1,256 single-family homes for sale, providing 2 months of inventory. There were 990 new listings, and 570 homes sold at a median price of $909k. The median overbid percentage was at 101%, with an average of 26 days on the market.
There were 515 condo and townhome units for sale, providing 3 months of inventory. There were 319 new listings and 172 units sold at a median sale price of $659k. The median overbid percentage was at 100%, with an average of 32 days on the market
Single-Family Homes
990
New Listings
570 Sold Listings
2 Months of Inventory
$909K
Median Sale Price
101%
Median Sale vs List
26
Avg Days on Market
The data, sourced from InfoSparks, includes all single-family homes, condos and townhomes in the California Area above from March 2024 to March 2025. This may include preliminary data, and may vary from the time the data was gathered. All data is deemed reliable but not guaranteed. DRE# 01995149. Copyright KW Advisors San Francisco | Napa Valley 2025. Each office is independently owned and operated.
MARCH 2024 - MARCH 2025
mes year-over-year.
omes , year-over-year
Median SalesPrice
Single-Family Homes
The median sale price has increased from $890k last March 2024, to $909k as of March 2025
Condos & Townhomes
The median sale price has increased from $625k last March 2024, to $659k as of March 2025
AVGDays OntheMarket
Single-Family Homes
The average time spent on the market went up from 22 days last March 2024, to 26 days as of March 2025
Condos & Townhomes
The average time spent on the market remained the same from 32 days in March 2024, to 32 days as of March 2025.
Overbids
Single-Family Homes
The overbid percentage has decreased from 102% last March 2024, to 101% a year later
Condos & Townhomes
The overbid percentage has remained the same from 100% last March 2024, to 100% a year later.
Napa County
What's in the Napa County data?
There were 354 single-family homes for sale, providing 5.1 months of inventory. There were 89 new listings, and 57 homes sold at a median price of $990k. The median overbid percentage was at 100%, with an average of 54 days on the market
There were 46 condo and townhome units for sale, providing 4.6 months of inventory. There were 12 new listings and 5 units sold at a median sale price of $625k. The median overbid percentage was at 100%, with an average of 62 days on the market.
89 New Listings
57 Sold Listings
5.1 Months of Inventory
$990K Median Sale Price
100% Median Sale vs List
54 Avg Days on Market
New Listings 4.6
Months of Inventory $625K
Median Sale Price
Median Sale vs List 62 Avg Days on Market 5 Sold Listings
NapaCounty
MARCH 2024 - MARCH 2025
Single-Family Homes
Last 12 months, year-over-year.
Condos & Townhomes
Last 12 months, year-over-year
Median SalesPrice
Single-Family Homes
The median sale price has increased from $910k last March 2024, to $990k as of March 2025
Condos & Townhomes
The median sale price has decreased from $699k last March 2024, to $625k as of March 2025
AVGDays OntheMarket
Single-Family Homes
The average time spent on the market went down from 75 days last March 2024, to 54 days as of March 2025
Condos & Townhomes
The average time spent on the market went down from 68 days in March 2024, to 62 days as of March 2025.
Overbids
Single-Family Homes
The overbid percentage has increased from 97 8% last March 2024, to 100% a year later
Condos & Townhomes
The overbid percentage has increased from 97.6% last March 2024, to 100% a year later.
San Francisco County
What's in the San Francisco County data?
There were 271 single-family homes for sale, providing 1.5 months of inventory. There were 286 new listings, and 182 homes sold at a median price of $1.9m. The median overbid percentage was at 113.3%, with an average of 21 days on the market.
There were 634 condo and townhome units for sale, providing 3.6 months of inventory. There were 350 new listings and 195 units sold at a median sale price of $1m. The median overbid percentage was at 100%, with an average of 45 days on the market.
286 New Listings
mily Homes
182 Sold Listings
1.5 Months of Inventory
$1.9M Median Sale Price
113.3%
Median Sale vs List
21 Avg Days on Market
InfoSparks, includes all single-family homes, condos and California Area above from March 2024 to March 2025. This may and may vary from the time the data was gathered. All data is guaranteed. DRE# 01995149. Copyright KW Advisors San Francisco | Napa Valley 2025. Each office is independently owned and operated.
350
New Listings
195
Sold Listings
3.6
Months of Inventory
$1M
Median Sale Price 100%
Median Sale vs List
45 Avg Days on Market
SanFranciscoCounty
MARCH 2024 - MARCH 2025
LISTINGS FOR SALE SOLD LISTINGS
gle-Family Homes
t 12 months, year-over-year.
ndos & Townhomes
t 12 months, year-over-year
Median SalesPrice
Single-Family Homes
The median sale price has increased from $1 7m last March 2024, to $1 9m as of March 2025
Condos & Townhomes
The median sale price has decreased from $1 1m last March 2024, to $1m as of March 2025
AVGDays OntheMarket
Single-Family Homes
The average time spent on the market went down from 27 days last March 2024, to 21 days as of March 2025
Condos & Townhomes
The average time spent on the market went down from 48 days in March 2024, to 45 days as of March 2025.
Overbids
Single-Family Homes
The overbid percentage has increased from 107 9% last March 2024, to 113 3% a year later
Condos & Townhomes
The overbid percentage has remained the same from 100% last March 2024, to 100% a year later.
He-Family Homes
468 New Listings
276 Sold Listings
1.4 Months of Inventory
$2M
Median Sale Price
107.2%
Median Sale vs List
19 Avg Days on Market
sourced from InfoSparks, includes all single-family homes, condos and in the California Area above from March 2024 to March 2025. This may minary data, and may vary from the time the data was gathered. All data is reliable but not guaranteed. DRE# 01995149. Copyright KW Advisors San Francisco | Napa Valley 2025. Each office is independently owned and operated.
New Listings
Sold Listings
2.7
Months of Inventory $970K
Median Sale Price
Median Sale vs List 32 Avg Days on Market
Median SalesPrice
Single-Family Homes
The median sale price has increased from $2m last March 2024, to $2 08m as of March 2025
Condos & Townhomes
The median sale price has decreased from $1m last March 2024, to $970k as of March 2025
AVGDays OntheMarket
Single-Family Homes
The average time spent on the market went down from 20 days last March 2024, to 19 days as of March 2025
Condos & Townhomes
The average time spent on the market went down from 44 days in March 2024, to 32 days as of March 2025.
Overbids
Single-Family Homes
The overbid percentage has increased from 103 2% last March 2024, to 107 2% a year later
Condos & Townhomes
The overbid percentage has decreased from 101% last March 2024, to 100% a year later.
SantaC County
What's in the Sant County data?
There were 892 single-family providing 1.3 months of inve 1,139 new listings, and 650 h median price of $2.1m. The m percentage was at 106 9%, w days on the market.
There were 689 condo and to sale, providing 2.3 months of were 626 new listings and 32 median sale price of $1.1m. percentage was at 101.7%, w days on the market
1,139 New Listings
1.3 Months of Inventory
106.9% Median Sale vs List
650 Sold Listings
$2.1M Median Sale Price
14 Avg Days on Market
homes, condos and March 2025. This may was gathered. All data is Copyright KW Advisors San Francisco | Napa Valley 2025. Each office is independently owned and operated.
Condo 626
New Listings
326
Sold Listings
2.3
Months of Inventory $1.1M
Median Sale Price 101.7%
Median Sale vs List 21 Avg Days on Market
Median SalesPrice
Single-Family Homes
The median sale price has increased from $1 9m last March 2024, to $2 1m as of March 2025
Condos & Townhomes
The median sale price has increased from $970k last March 2024, to $1 1m as of March 2025
AVGDays OntheMarket
Single-Family Homes
The average time spent on the market went down from 15 days last March 2024, to 14 days as of March 2025
Condos & Townhomes
The average time spent on the market went up from 20 days in March 2024, to 21 days as of March 2025.
Overbids
Single-Family Homes
The overbid percentage has decreased from 107 1% last March 2024, to 106 9% a year later
Condos & Townhomes
The overbid percentage has decreased from 102.9% last March 2024, to 101.7% a year later.
Solano County
What's in the Solano County
data?
There were 625 single-family homes for sale, providing 2.1 months of inventory. There were 356 new listings, and 251 homes sold at a median price of $579k. The median overbid percentage was at 100%, with an average of 50 days on the market.
There were 89 condo and townhome units for sale, providing 3.5 months of inventory. There were 37 new listings and 23 units sold at a median sale price of $430k. The median overbid percentage was at 100%, with an average of 43 days on the market
Single-Family Homes
356 New Listings
251 Sold Listings
2.1 Months of Inventory
$579K
Median Sale Price
100%
Median Sale vs List
50 Avg Days on Market
The data, sourced from InfoSparks, includes all single-family homes, condos and townhomes in the California Area above from March 2024 to March 2025. This may include preliminary data, and may vary from the time the data was gathered. All data is deemed reliable but not guaranteed. DRE# 01995149. Copyright KW Advisors San Francisco | Napa Valley 2025. Each office is independently owned and operated.
New Listings
3.5
Sold Listings
Months of Inventory $430K
Median Sale Price 100%
Median Sale vs List 43 Avg Days on Market 23
Median SalesPrice
Single-Family Homes
The median sale price has decreased from $585k last March 2024, to $579k as of March 2025
Condos & Townhomes
The median sale price has increased from $335k last March 2024, to $430k as of March 2025
AVGDays OntheMarket
Single-Family Homes
The average time spent on the market went up from 47 days last March 2024, to 50 days as of March 2025
Condos & Townhomes
The average time spent on the market went up from 38 days in March 2024, to 43 days as of March 2025.
Overbids
Single-Family Homes
The overbid percentage has remained the same from 100% last March 2024, to 100% a year later
Condos & Townhomes
The overbid percentage has remained the same from 100% last March 2024, to 100% a year later.
Sonoma County
What's in the Sonoma data?
There were 736 single-family homes for sale, providing 2.3 months of inventory. There were 269 new listings, and 241 homes sold at a median price of $868k. The median overbid percentage was at 100%, with an average of 55 days on the market.
There were 124 condo and townhome units for sale, providing 3.1 months of inventory. There were 39 new listings and 26 units sold at a median sale price of $463k. The median overbid percentage was at 99%, with an average of 51 days on the market.
269 New Listings
241 Sold Listings
2.3 Months of Inventory
$868K Median Sale Price
100%
Median Sale vs List
55 Avg Days on Market
New Listings 3.1
Months of Inventory $463K
Median Sale Price 99%
Median Sale vs List 51 Avg Days on Market 26 Sold Listings
Median SalesPrice
Single-Family Homes
The median sale price has decreased from $868 9k last March 2024, to $868k as of March 2025
Condos & Townhomes
The median sale price has increased from $450k last March 2024, to $463k as of March 2025
AVGDays OntheMarket
Single-Family Homes
The average time spent on the market went up from 54 days last March 2024, to 55 days as of March 2025
Condos & Townhomes
The average time spent on the market remained the same from 51 days in March 2024, to 51 days as of March 2025.
Overbids
Single-Family Homes
The overbid percentage has remained the same from 100% last March 2024, to 100% a year later
Condos & Townhomes
The overbid percentage has decreased from 100% last March 2024, to 99% a year later.
Southe Centra Marin
What's in the Sout Marin data?
There were 270 single-family providing 1.8 months of inve new listings, and 147 homes price of $1.7m. The median was at 100.1%, with an avera market.
There were 114 condo and to sale, providing 2.7 months o were 35 new listings and 39 sale price of $855k. The med percentage was at 99%, with days on the market.
35 New Listings
1.8 Months of Inventory
100.1% Median Sale vs List
147 Sold Listings
$1.7M Median Sale Price
35 Avg Days on Market
homes, condos and March 2025. This may gathered. All data is Copyright KW Advisors San Francisco | Napa Valley 2025. Each office is independently owned and operated.
New Listings
2.7
Sold Listings
Months of Inventory $855K
Median Sale Price 99%
Median Sale vs List 48 Avg Days on Market 39
Median SalesPrice
Single-Family Homes
The median sale price has decreased from $1 9m last March 2024, to $1 7m as of March 2025
Condos & Townhomes
The median sale price has increased from $775k last March 2024, to $855k as of March 2025
AVGDays OntheMarket
Single-Family Homes
The average time spent on the market went up from 29 days last March 2024, to 35 days as of March 2025
Condos & Townhomes
The average time spent on the market went down from 49 days in March 2024, to 48 days as of March 2025.
Overbids
Single-Family Homes
The overbid percentage has remained the same from 100 1% last March 2024, to 100 1% a year later
Condos & Townhomes
The overbid percentage has decreased from 100% last March 2024, to 99% a year later.