


San Francisco Bay Area and 10 Districts


Jump to Alameda Report
Jump to Contra Costa Report
Jump to Napa County Report
San Francisco County
Jump to San Francisco County Report
San Francisco County
Jump to San Francisco County Report
Jump to San Mateo Report
Jump to Santa Clara Report
Jump to Solano County Report
Jump to Sonoma County Report

Southern/Central Marin
Jump to Southern/Central Marin
Sea
Jump to District 1 - Northwest
Jump to District 6 - Central North
That's the question you should be asking yourself.
Our market is incredibly diverse and rapidly changing. Values vary not just by neighborhood but by street. Your home isn't necessarily worth what your neighbors' home is. It's the current market that sets the value of your home.
So, do you know what your home is worth in today's market?
Icanhelp...
Contact me for a confidential, no obligation assessment of your home's value.

If you’ve been putting off buying a home because you thought getting approved would be too hard, know this: qualifying for a mortgage is starting to get a bit more achievable, but lending standards are still strong.
Lenders are making it slightly easier for well-qualified buyers to access financing, which is opening more doors for people ready to make a move.
So, if strict requirements were holding you back, this shift could be the opportunity you’ve been waiting for, without repeating the risky lending practices that led to the housing crash back in 2008.


Secure Your Dream Home Today

Navigating the mortgage application process can be a breeze with a little preparation. To ensure a successful application and closing, consider these helpful tips for what to avoid.


3
4 5 6 1 2
Avoid major purchases like furniture, cars, or vacations to keep your credit profile stable. Maintain your current employment to show financial stability. Always consult your mortgage professional before making large financial moves.
Avoid paying off debts or collections without professional advice.
Use verified funds for deposits to prevent closing delays.
Don't have your credit report pulled too many times - this can hurt your credit score.


In2024,thehomebuyingmarketfacessignificantchallenges highprices, steepinterestrates,andlimitedhousinginventory Formany,renovatingtheir currenthomeisamoreattractiveoptionthanpurchasinganewone.Whilethe LIRAreportpredictsadeclineinrenovationspending,expertsemphasizethat small-scaleupdatesortargetedlargerprojectscanstilldelivermajorbenefits.
Beforedivingintoarenovation,it’sessentialtoplan carefullyandbudgetwisely.Workingwithreputable professionalsiskey,especiallythoseoffering financingoptionsandtransferablewarranties.Sharing yourbudgetwithcontractorsupfrontandinvolving designersearlyensuresthatyourrenovationruns smoothlyandachievesbothfinancialandfunctional success Adetailedplanwillkeeptheprojectontrack andhelpavoidcostlysurprises


Bathrooms are a safe investment. Simple changes like a new vanity, upgraded flooring, or fresh lighting can completely transform the space. For a luxurious touch, consider adding a freestanding tub for a spa-like experience


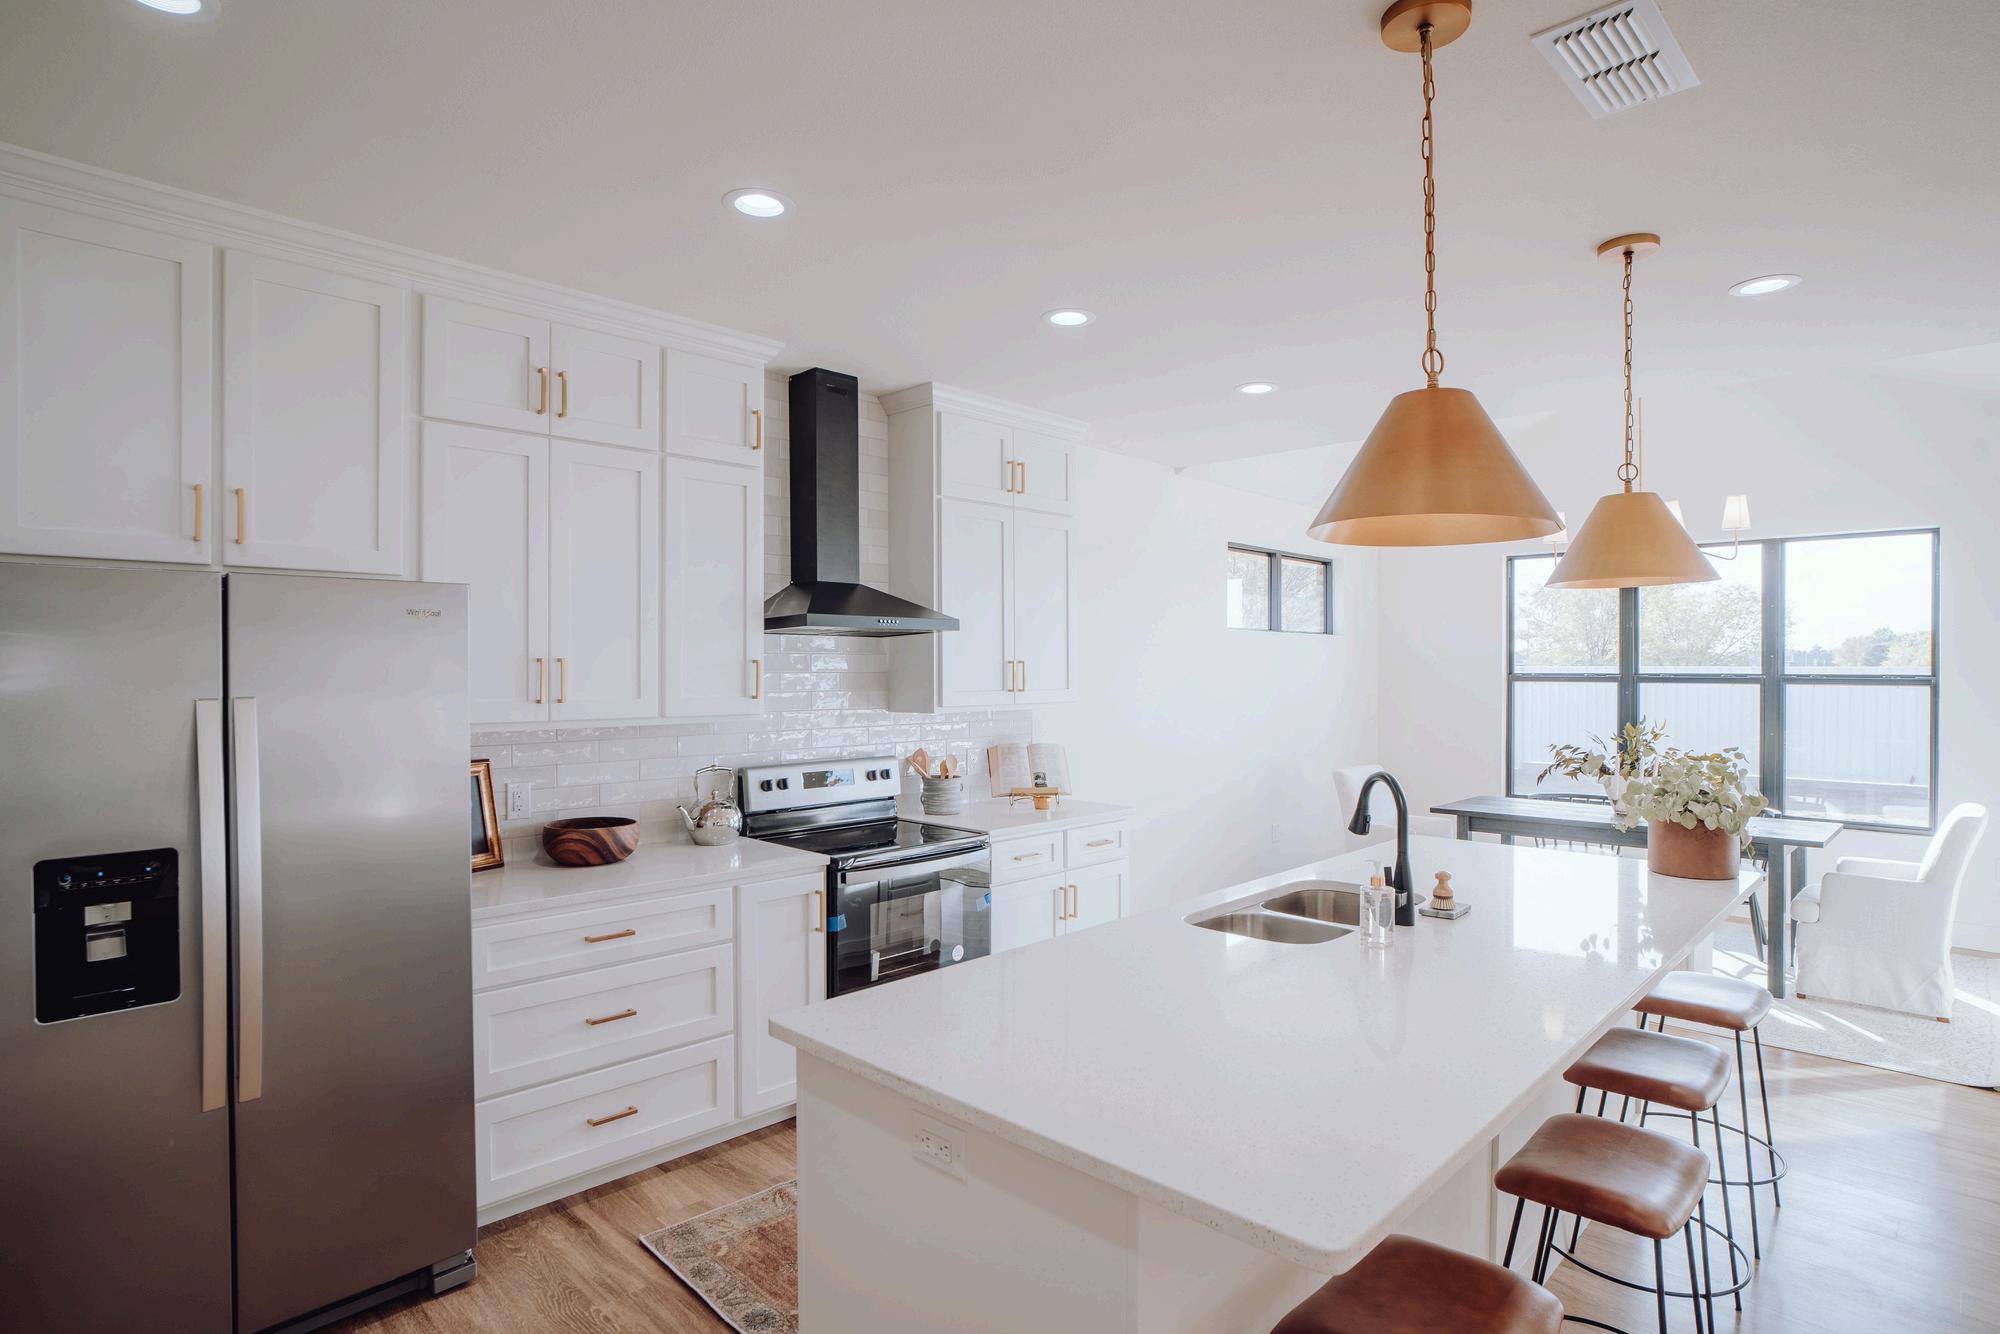
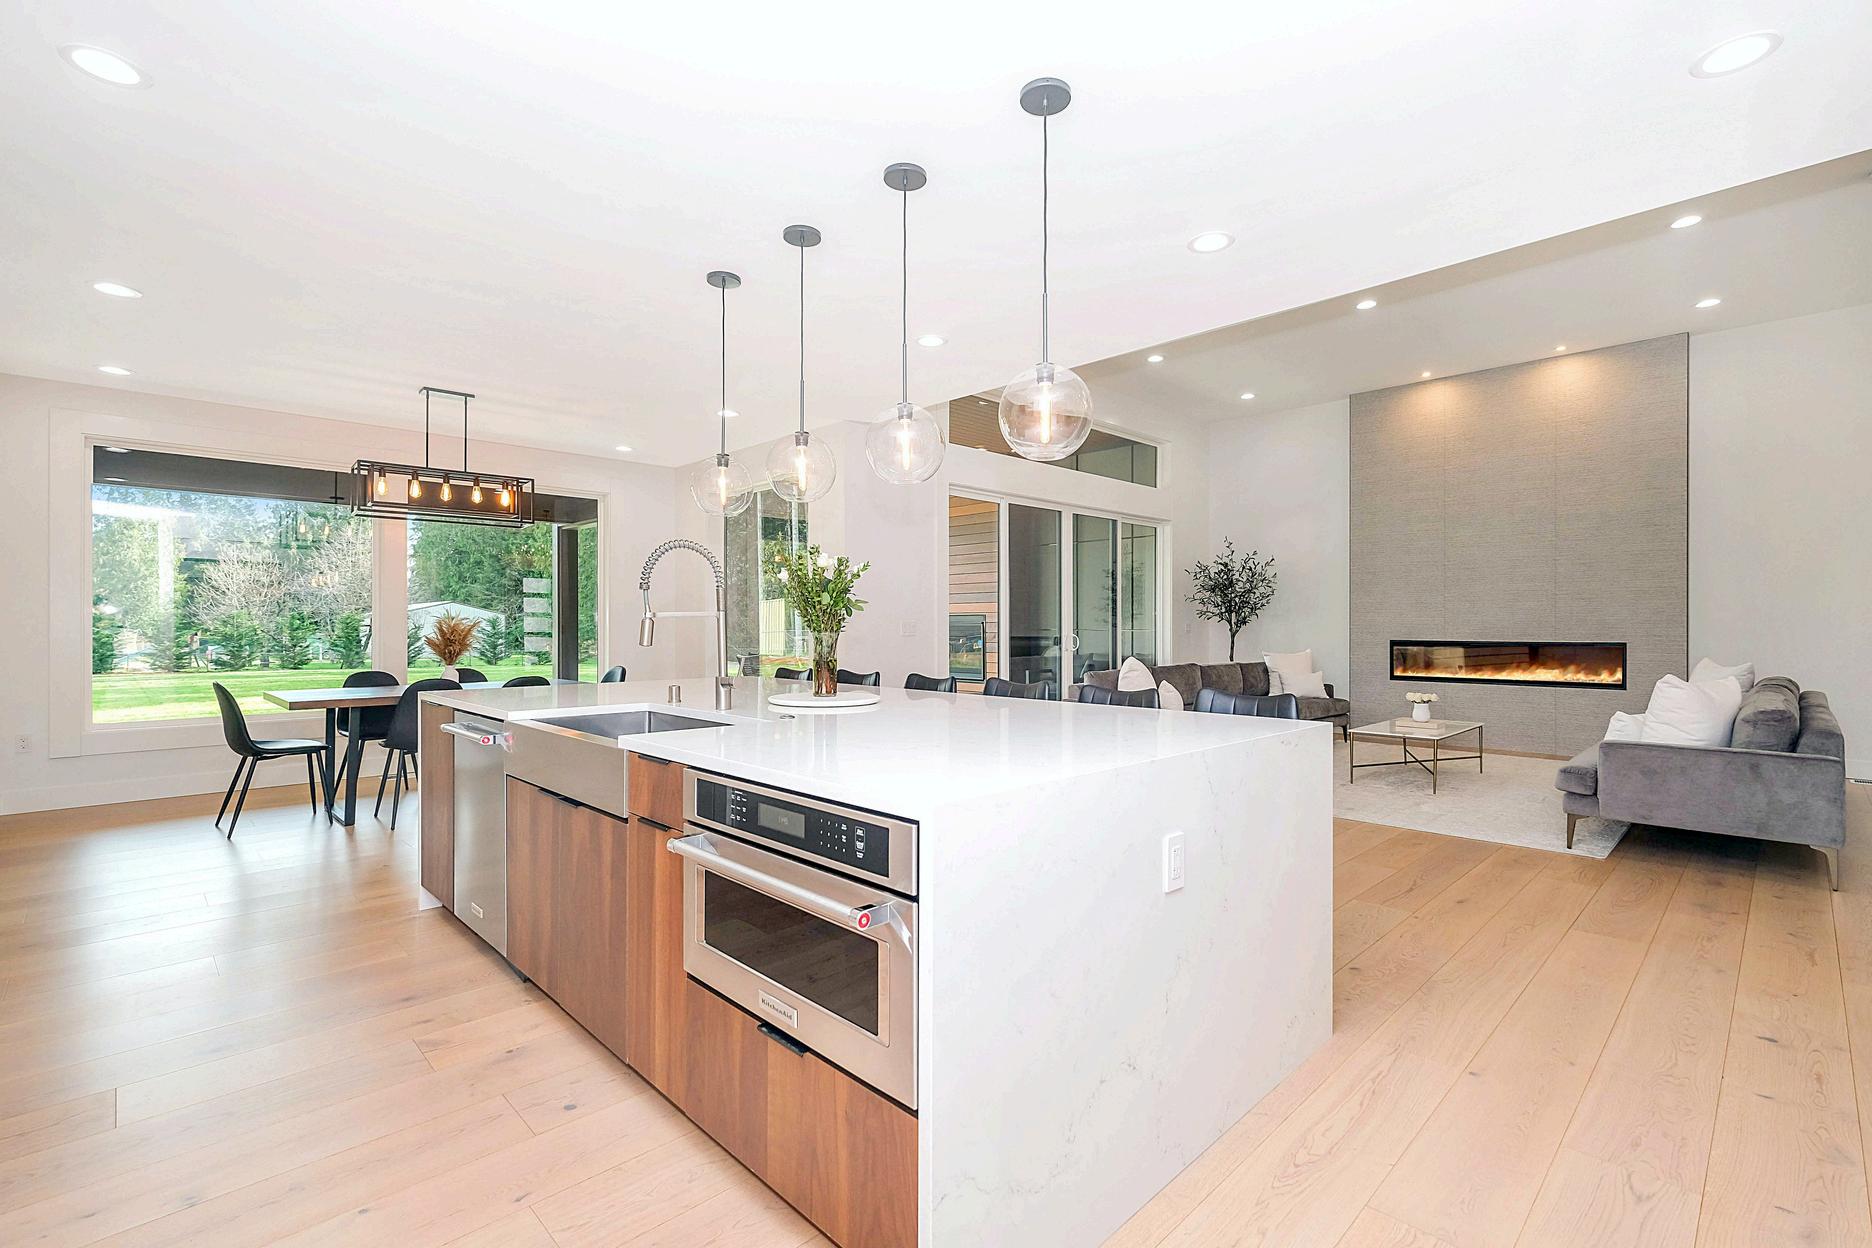
The kitchen is a crucial space for resale value. Opening up the space or adding functional features can make a big difference Smaller updates, like upgrading appliances, cabinets, or flooring, can give your kitchen a fresh, modern feel


Bold design choices, such as statement wallpaper, unique lighting, or striking color palettes, can refresh any room. Layering textiles or mixing traditional and modern styles creates a space that feels cohesive and impactful


Renovations focusing on health are becoming increasingly popular. Use non-toxic materials free from Red List chemicals like BPA and VOCs. Consider adding air purifiers, water filtration systems, and better ventilation to create a healthier living environment


First impressions matter, and curb appeal can greatly impact your home's value. Exterior upgrades like siding, roofing, and landscaping enhance both aesthetics and security. Adding outdoor living spaces, such as a garden or entertainment area, boosts appeal even more.


Tailor renovations to your family’s lifestyle. Flexible spaces that accommodate workfrom-home needs, growing children, or future buyers will add lasting value. Think about both how your family uses the space and how it will appeal to future buyers.


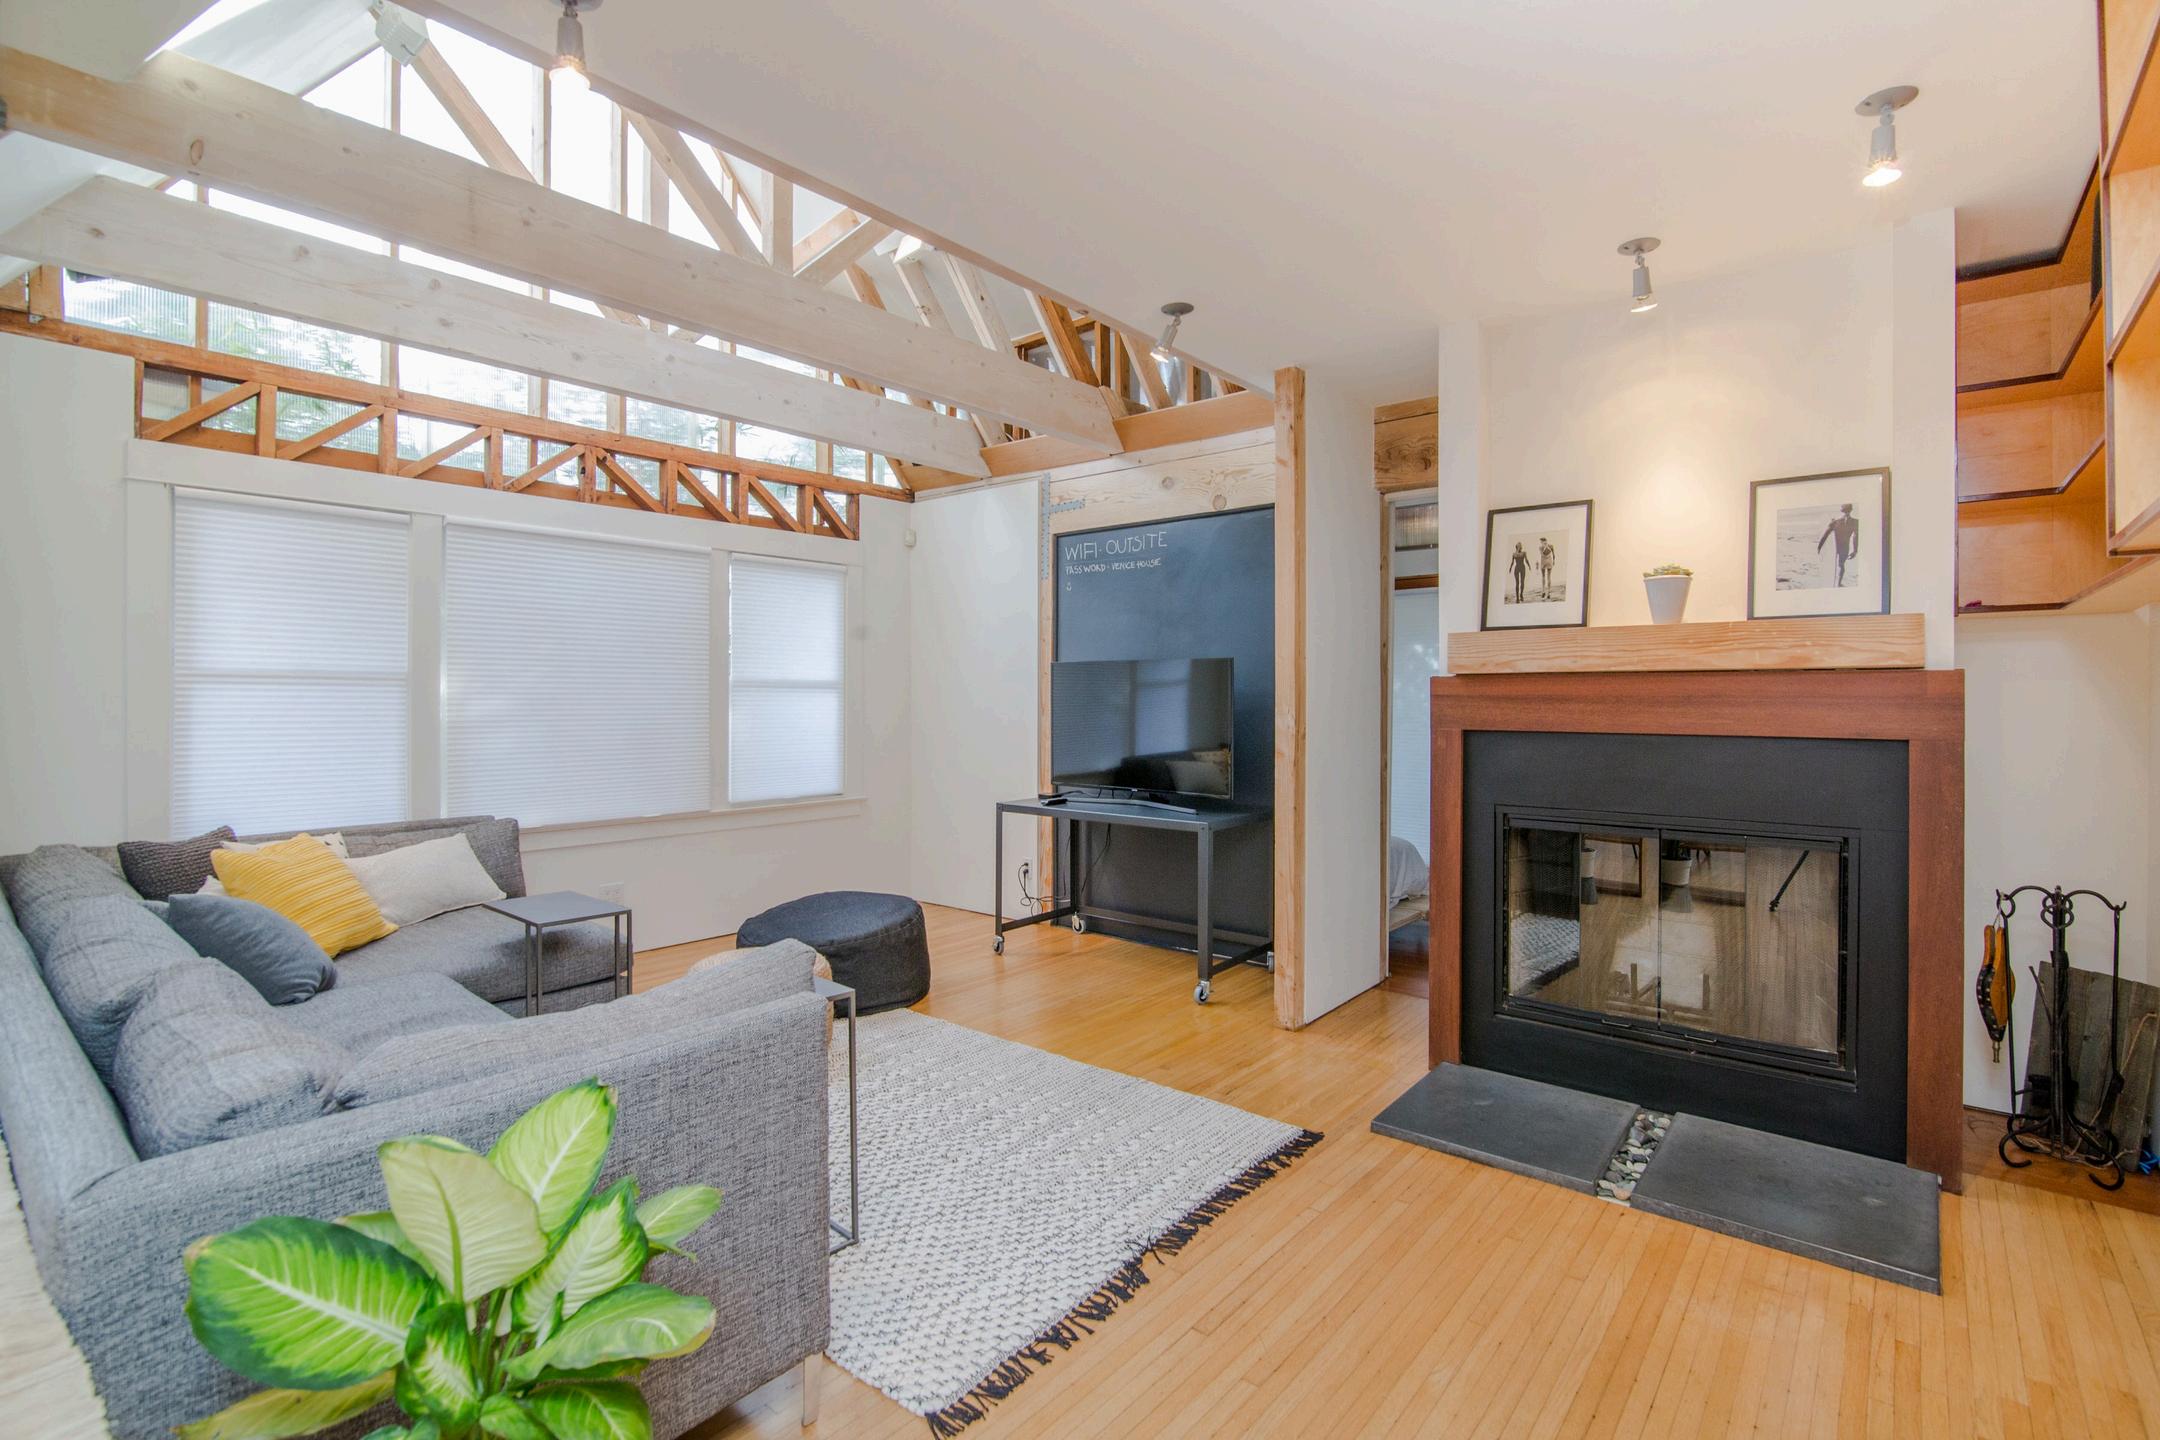
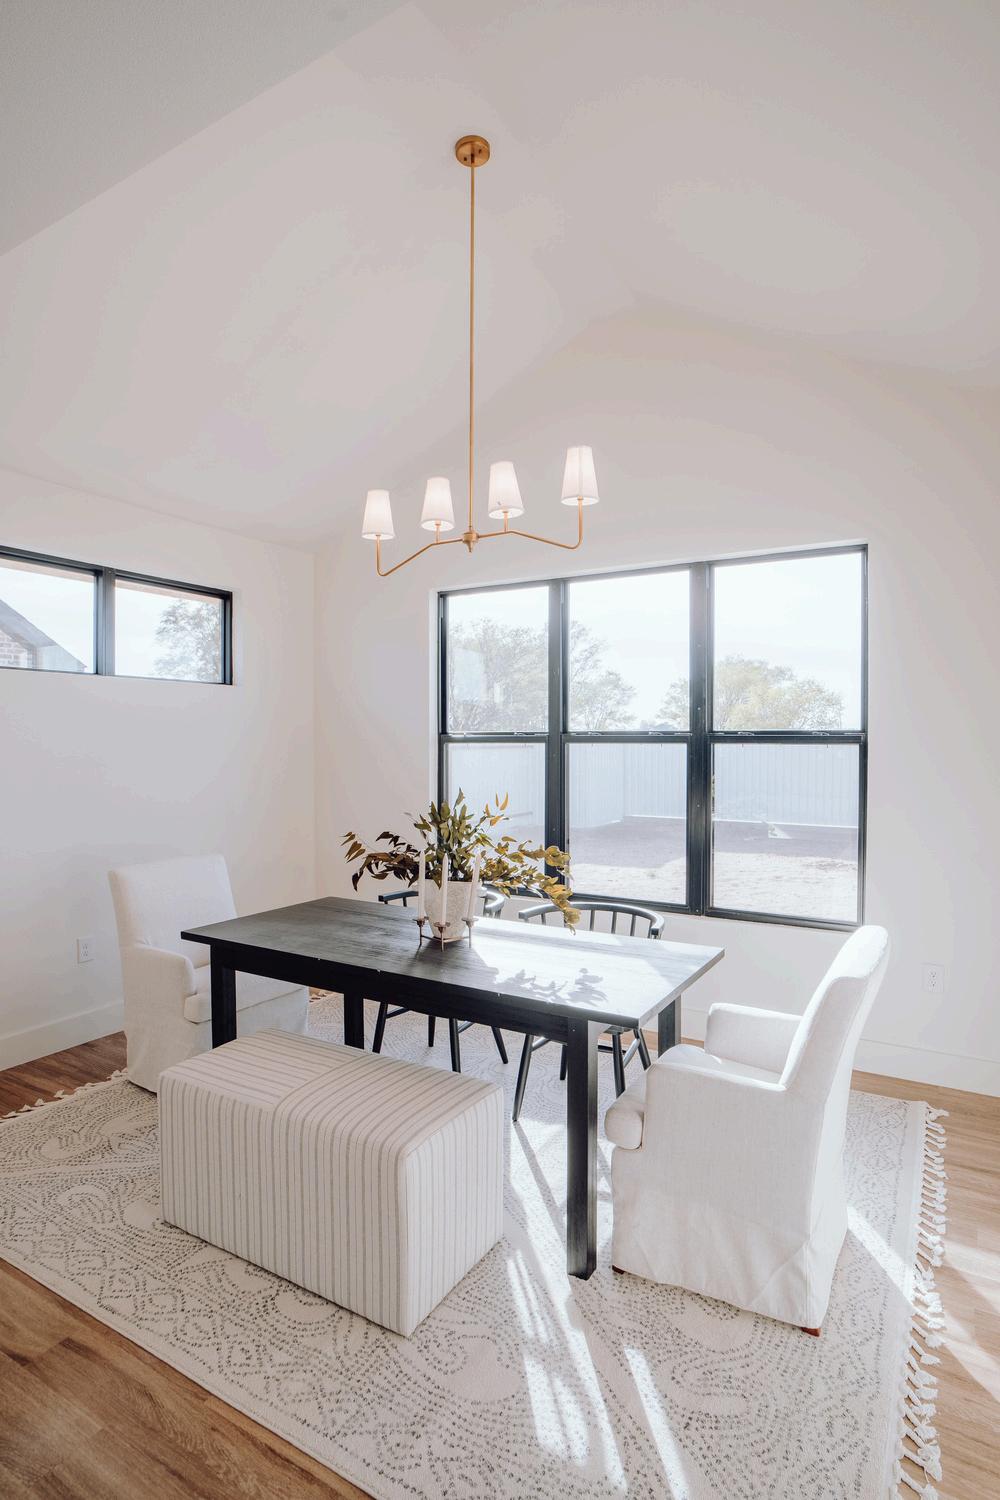
The Anenberg-Essert family in Campbell collaborated with Acton ADU to create a versatile, comfortable, and valuable addition to their property. This ADU project is a shining example of how a well-designed accessory dwelling unit can increase property value and serve a family’s unique needs.
The family envisioned an ADU that would function as an independent living space for family members, enhance their property’s worth, and provide seamless integration with the main home They wanted a space that balanced privacy with connectivity, feeling like a natural extension of their residence
Constructed at 747 square feet, this ADU was designed with modern, high-quality finishes to serve both aesthetic and practical needs. Key features include:
Vaulted Ceilings
Creates a spacious, open atmosphere
Senior-Friendly Living
Safe, independent space for elderly family members
Fully Equipped Kitchen
Modern amenities for everyday convenience
Open Living Area
Multipurpose area for relaxation and entertainment
The completion of the Anenberg-Essert ADU led to several valuable outcomes:
Increased Property Value
The ADU addition significantly boosted property value
Flexible Living Space
A versatile space for family, guests, or as a rental
Modern Comforts
High-end finishes and amenities enhance both function and style.
Enhanced Family Living
The ADU enriches the AnenbergEssert family’s home with both privacy and connection

Thinking about how an ADU could fit into your family’s lifestyle or property investment strategy?
Trust Acton ADU to guide you every step of the way.

When it comes to home ownership, knowing who you can trust is crucial. That's why we've curated a select list of trusted vendors who are ready to help with your home goals.


There were 0 single-family homes for sale, providing 0 months of inventory. There were 0 new listings, and 0 homes sold at a median price of $0. The median overbid percentage was at 0%, with an average of 0 days on the market.
There were 0 condo and townhome units for sale, providing 0 months of inventory. There were 0 new listings and 0 units sold at a median sale price of $0. The median overbid percentage was at 0%, with an average of 0 days on the market.

0 Sold Listings
ory
$0 Median Sale Price ist
0 Avg Days on Market
InfoSparks, includes all single-family homes, condos and California Area above from September 2024 to September 2025. This data, and may vary from the time the data was gathered. All but not guaranteed. DRE# 01995149. Copyright KW Advisors San Francisco | Napa Valley 2025. Each office is independently owned and operated.
New Listings
Sold Listings
Months of Inventory
Median Sale Price 0%
Median Sale vs List 0
Avg Days on Market
SEPTEMBER 2024 - SEPTEMBER 2025
Nodatatodisplay
Single-Family Homes
Last 12 months, year-over-year.
Condos & Townhomes
Nodatatodisplay
Last 12 months, year-over-year
The median sale price has increased from $0 last September 2024, to $0 as of September 2025
The median sale price has increased from $0 last September 2024, to $0 as of September 2025
No data to display
No data to display
The average time spent on the market went up from 0 days last September 2024, to 0 days as of September 2025
The average time spent on the market went up from 0 days in September 2024, to 0 days as of September 2025.
The overbid percentage has increased from 0% last September 2024, to 0% a year later
The overbid percentage has increased from 0% last September 2024, to 0% a year later.
No data to display

There were 0 single-family homes for sale, providing 0 months of inventory. There were 0 new listings, and 0 homes sold at a median price of $0. The median overbid percentage was at 0%, with an average of 0 days on the market
There were 0 condo and townhome units for sale, providing 0 months of inventory. There were 0 new listings and 0 units sold at a median sale price of $0. The median overbid percentage was at 0%, with an average of 0 days on the market.

0 New Listings
0 Sold Listings
0 Months of Inventory
$0
Median Sale Price
0%
Median Sale vs List
0
Avg Days on Market
The data, sourced from InfoSparks, includes all single-family homes, condos and townhomes in the California Area above from September 2024 to September 2025. This may include preliminary data, and may vary from the time the data was gathered. All data is deemed reliable but not guaranteed. DRE# 01995149. Copyright KW Advisors San Francisco | Napa Valley 2025. Each office is independently owned and operated.
New Listings
Sold Listings
Months of Inventory
Median Sale Price
Median Sale vs List
Avg Days on Market

SEPTEMBER 2024 - SEPTEMBER 2025
Nodatatodisplay
mes year-over-year.
Nodatatodisplay
omes , year-over-year
The median sale price has increased from $0 last September 2024, to $0 as of September 2025
The median sale price has increased from $0 last September 2024, to $0 as of September 2025
No data to display
No data to display
The average time spent on the market went up from 0 days last September 2024, to 0 days as of September 2025
The average time spent on the market went up from 0 days in September 2024, to 0 days as of September 2025.
The overbid percentage has increased from 0% last September 2024, to 0% a year later
The overbid percentage has increased from 0% last September 2024, to 0% a year later.
No data to display

What's in the Napa County
There were 0 single-family homes for sale, providing 0 months of inventory. There were 0 new listings, and 0 homes sold at a median price of $0. The median overbid percentage was at 0%, with an average of 0 days on the market
There were 0 condo and townhome units for sale, providing 0 months of inventory. There were 0 new listings and 0 units sold at a median sale price of $0. The median overbid percentage was at 0%, with an average of 0 days on the market.

0 New Listings
0 Sold Listings
0 Months of Inventory
$0 Median Sale Price
0%
Median Sale vs List
0 Avg Days on Market
New Listings
Sold Listings
Months of Inventory
Median Sale Price 0%
Median Sale vs List
Avg Days on Market

SEPTEMBER 2024 - SEPTEMBER 2025
Nodatatodisplay
Single-Family Homes
Last 12 months, year-over-year.
Condos & Townhomes
Nodatatodisplay
Last 12 months, year-over-year
The median sale price has increased from $0 last September 2024, to $0 as of September 2025
The median sale price has increased from $0 last September 2024, to $0 as of September 2025
No data to display
No data to display
The average time spent on the market went up from 0 days last September 2024, to 0 days as of September 2025
The average time spent on the market went up from 0 days in September 2024, to 0 days as of September 2025.
The overbid percentage has increased from 0% last September 2024, to 0% a year later
The overbid percentage has increased from 0% last September 2024, to 0% a year later.
No data to display

There were 0 single-family homes for sale, providing 0 months of inventory. There were 0 new listings, and 0 homes sold at a median price of $0. The median overbid percentage was at 0%, with an average of 0 days on the market.
There were 0 condo and townhome units for sale, providing 0 months of inventory There were 0 new listings and 0 units sold at a median sale price of $0. The median overbid percentage was at 0%, with an average of 0 days on the market.

0 New Listings
0 Sold Listings
0 Months of Inventory
$0 Median Sale Price
0%
Median Sale vs List
0 Avg Days on Market
InfoSparks, includes all single-family homes, condos and California Area above from September 2024 to September 2025. This data, and may vary from the time the data was gathered. All but not guaranteed. DRE# 01995149. Copyright KW Advisors San Francisco | Napa Valley 2025. Each office is independently owned and operated.
New Listings
Sold Listings
Months of Inventory
Median Sale Price 0%
Median Sale vs List
Avg Days on Market

SEPTEMBER 2024 - SEPTEMBER 2025
Nodatatodisplay
gle-Family Homes
t 12 months, year-over-year.
ndos & Townhomes
Nodatatodisplay
t 12 months, year-over-year
The median sale price has increased from $0 last September 2024, to $0 as of September 2025
The median sale price has increased from $0 last September 2024, to $0 as of September 2025
No data to display
No data to display
The average time spent on the market went up from 0 days last September 2024, to 0 days as of September 2025
The average time spent on the market went up from 0 days in September 2024, to 0 days as of September 2025.
The overbid percentage has increased from 0% last September 2024, to 0% a year later
The overbid percentage has increased from 0% last September 2024, to 0% a year later.
No data to display

0 New Listings
0 Sold Listings
0 Months of Inventory
$0 Median Sale Price
0%
Median Sale vs List
0 Avg Days on Market
sourced from InfoSparks, includes all single-family homes, condos and in the California Area above from September 2024 to September 2025. This preliminary data, and may vary from the time the data was gathered. All deemed reliable but not guaranteed. DRE# 01995149. Copyright KW Advisors San Francisco | Napa Valley 2025. Each office is independently owned and operated.
New Listings
Months of Inventory
Median Sale vs List

Sold Listings
The median sale price has increased from $0 last September 2024, to $0 as of September 2025
The median sale price has increased from $0 last September 2024, to $0 as of September 2025
No data to display
No data to display
The average time spent on the market went up from 0 days last September 2024, to 0 days as of September 2025
The average time spent on the market went up from 0 days in September 2024, to 0 days as of September 2025.
The overbid percentage has increased from 0% last September 2024, to 0% a year later
The overbid percentage has increased from 0% last September 2024, to 0% a year later.
No data to display

There were 0 single-family ho providing 0 months of invent new listings, and 0 homes so of $0. The median overbid pe with an average of 0 days on
There were 0 condo and tow providing 0 months of invent new listings and 0 units sold price of $0. The median over at 0%, with an average of 0 d
0
New Listings
0 Months of Inventory
0% Median Sale vs List
0 Sold Listings
$0 Median Sale Price
0 Avg Days on Market
homes, condos and September 2025. This data was gathered. All Copyright KW Advisors San Francisco | Napa Valley 2025. Each office is independently owned and operated.
New Listings
Months of Inventory
Median Sale vs List

Sold Listings
The median sale price has increased from $0 last September 2024, to $0 as of September 2025
The median sale price has increased from $0 last September 2024, to $0 as of September 2025
No data to display
No data to display
The average time spent on the market went up from 0 days last September 2024, to 0 days as of September 2025
The average time spent on the market went up from 0 days in September 2024, to 0 days as of September 2025.
The overbid percentage has increased from 0% last September 2024, to 0% a year later
The overbid percentage has increased from 0% last September 2024, to 0% a year later.
No data to display

There were 0 single-family homes for sale, providing 0 months of inventory. There were 0 new listings, and 0 homes sold at a median price of $0. The median overbid percentage was at 0%, with an average of 0 days on the market
There were 0 condo and townhome units for sale, providing 0 months of inventory. There were 0 new listings and 0 units sold at a median sale price of $0. The median overbid percentage was at 0%, with an average of 0 days on the market.

0 New Listings
0 Sold Listings
0 Months of Inventory
$0 Median Sale Price
0%
Median Sale vs List
0 Avg Days on Market
The data, sourced from InfoSparks, includes all single-family homes, condos and townhomes in the California Area above from September 2024 to September 2025. This may include preliminary data, and may vary from the time the data was gathered. All data is deemed reliable but not guaranteed. DRE# 01995149. Copyright KW Advisors San Francisco | Napa Valley 2025. Each office is independently owned and operated.
New Listings
Months of Inventory

Sold Listings
The median sale price has increased from $0 last September 2024, to $0 as of September 2025
The median sale price has increased from $0 last September 2024, to $0 as of September 2025
No data to display
No data to display
The average time spent on the market went up from 0 days last September 2024, to 0 days as of September 2025
The average time spent on the market went up from 0 days in September 2024, to 0 days as of September 2025.
The overbid percentage has increased from 0% last September 2024, to 0% a year later
The overbid percentage has increased from 0% last September 2024, to 0% a year later.
No data to display
There were 0 single-family homes for sale, providing 0 months of inventory. There were 0 new listings, and 0 homes sold at a median price of $0. The median overbid percentage was at 0%, with an average of 0 days on the market.
There were 0 condo and townhome units for sale, providing 0 months of inventory. There were 0 new listings and 0 units sold at a median sale price of $0. The median overbid percentage was at 0%, with an average of 0 days on the market.

0
New Listings
0 Sold Listings
0 Months of Inventory
$0 Median Sale Price
0%
Median Sale vs List
0 Avg Days on Market
New Listings
Sold Listings
The median sale price has increased from $0 last September 2024, to $0 as of September 2025
The median sale price has increased from $0 last September 2024, to $0 as of September 2025
The overbid percentage has increased from 0% last September 2024, to 0% a year later
The overbid percentage has increased from 0% last September 2024, to 0% a year later.
No data to display
No data to display
The average time spent on the market went up from 0 days last September 2024, to 0 days as of September 2025
The average time spent on the market went up from 0 days in September 2024, to 0 days as of September 2025.
No data to display
There were 0 single-family h providing 0 months of invent new listings, and 0 homes so of $0. The median overbid pe with an average of 0 days on
There were 0 condo and tow providing 0 months of invent new listings and 0 units sold price of $0. The median over at 0%, with an average of 0 d

0
New Listings
0 Months of Inventory
0% Median Sale vs List
0 Sold Listings
$0 Median Sale Price
0 Avg Days on Market
homes, condos and September 2025. This data was gathered. All Copyright KW Advisors San Francisco | Napa Valley 2025. Each office is independently owned and operated.
New Listings
Months of Inventory
Median Sale vs List

Sold Listings
The median sale price has increased from $0 last September 2024, to $0 as of September 2025
The median sale price has increased from $0 last September 2024, to $0 as of September 2025
No data to display
No data to display
The average time spent on the market went up from 0 days last September 2024, to 0 days as of September 2025
The average time spent on the market went up from 0 days in September 2024, to 0 days as of September 2025.
The overbid percentage has increased from 0% last September 2024, to 0% a year later
The overbid percentage has increased from 0% last September 2024, to 0% a year later.
No data to display


ntory
0 Sold Listings
$0 Median Sale Price s List
0 Avg Days on Market
from InfoSparks, includes all single-family homes, condos and California Area above from September 2024 to September 2025. This preliminary data, and may vary from the time the data was gathered. All reliable but not guaranteed. DRE# 01995149. Copyright KW Advisors San Francisco | Napa Valley 2025. Each office is independently owned and operated.
New Listings
Months of Inventory M 0%
Median Sale vs List Av

SEPTEMBER 2024 - SEPTEMBER 2025 , y y
SOLD LISTINGS
odisplay
odisplay
The median sale price has increased from $0 last September 2024, to $0 as of September 2025
The median sale price has increased from $0 last September 2024, to $0 as of September 2025
The overbid percentage has increased from 0% last September 2024, to 0% a year later
The overbid percentage has increased from 0% last September 2024, to 0% a year later.
No data to display
No data to display
The average time spent on the market went up from 0 days last September 2024, to 0 days as of September 2025
The average time spent on the market went up from 0 days last September 2024, to 0 days as of September 2025.
No data to display

Sunset & Parkside (Inner, Central, Outer), Golden Gate Heights
There were 0 single-family homes for sale, providing 0 months of inventory. There were 0 new listings, and 0 homes sold at a median price of $0. The median overbid percentage was at 0%, with an average of 0 days on the market.
There were 0 condo and townhome units for sale, providing 0 months of inventory. There was 0 new listings and 0 units sold at a median sale price of $0. The median overbid percentage was at 0%, with an average of 0 days on the market.

0
New Listings
0 Sold Listings
0 Months of Inventory
$0
Median Sale Price
0%
Median Sale vs List
0
Avg Days on Market
The data, sourced from InfoSparks, includes all single-family homes, condos and townhomes in the California Area above from September 2024 to September 2025. This may include preliminary data, and may vary from the time the data was gathered. All data is deemed reliable but not guaranteed. DRE# 01995149. Copyright KW Advisors San Francisco | Napa Valley 2025. Each office is independently owned and operated.
New Listings
Sold Listings
Months of Inventory
Median Sale Price
Median Sale vs List
Avg Days on Market

SEPTEMBER 2024 - SEPTEMBER 2025
Nodatatodisplay
Single-Family Homes
Last 12 months, year-over-year.
Condos & Townhomes
Nodatatodisplay
Last 12 months, year-over-year
The median sale price has increased from $0 last September 2024, to $0 as of September 2025
The median sale price has increased from $0 last September 2024, to $0 as of September 2025
The overbid percentage has increased from 0% last September 2024, to 0% a year later
The overbid percentage has increased from 0% last September 2024, to 0% a year later.
No data to display
No data to display
The average time spent on the market went up from 0 days last September 2024, to 0 days as of September 2025
The average time spent on the market went up from 0 days last September 2024, to 0 days as of September 2025.
No data to display

Lake Shore, Lakeside, Merced Manor, Merced Heights, Ingleside, Ingleside Heights, Oceanview
There were 0 single-family homes for sale, providing 0 months of inventory. There were 0 new listings, and 0 homes sold at a median price of $0. The median overbid percentage was at 0%, with an average of 0 days on the market
There were 0 condo and townhome units for sale, providing 0 months of inventory. There was 0 new listings and 0 units sold at a median sale price of $0. The median overbid percentage was at 0%, with an average of 0 days on the market.
0 New Listings
0 Sold Listings
0 Months of Inventory
$0
Median Sale Price
0%
Median Sale vs List
0 Avg Days on Market
The data, sourced from InfoSparks, includes all single-family homes, condos and townhomes in the California Area above from September 2024 to September 2025. This may include preliminary data, and may vary from the time the data was gathered. All data is deemed reliable but not guaranteed. DRE# 01995149. Copyright KW Advisors San Francisco | Napa Valley 2025. Each office is independently owned and operated.

SEPTEMBER 2024 - SEPTEMBER 2025
Nodatatodisplay
amily Homes
months, year-over-year. & Townhomes
Nodatatodisplay
months, year-over-year
The median sale price has increased from $0 last September 2024, to $0 as of September 2025
The median sale price has increased from $0 last September 2024, to $0 as of September 2025
The overbid percentage has increased from 0% last September 2024, to 0% a year later
The overbid percentage has increased from 0% last September 2024, to 0% a year later.
No data to display
No data to display
The average time spent on the market went up from 0 days last September 2024, to 0 days as of September 2025
The average time spent on the market went up from 0 days last September 2024, to 0 days as of September 2025.
No data to display

St. Francis Wood, Forest Hill, West Portal, Forest Knolls, Diamond Heights, Midtown Terrace, Miraloma Park, Sunnyside, Balboa Terrace, Ingleside Terrace, Mt Davidson Manor, Sherwood Forest, Monterey Heights, Westwood Highlands
There were 0 single-family homes for sale, providing 0 months of inventory. There were 0 new listings, and 0 homes sold at a median price of $0. The median overbid percentage was at 0%, with an average of 0 days on the market.
There were 0 condo and townhome units for sale, providing 0 months of inventory. There was 0 new listings and 0 units sold at a median sale price of $0. The median overbid percentage was at 0%, with an average of 0 days on the market.

0
New Listings
0 Sold Listings
0 Months of Inventory
$0 Median Sale Price
0%
Median Sale vs List
0
Avg Days on Market
The data, sourced from InfoSparks, includes all single-family homes, condos and townhomes in the California Area above from September 2024 to September 2025. This may include preliminary data, and may vary from the time the data was gathered. All data is deemed reliable but not guaranteed. DRE# 01995149. Copyright KW Advisors San Francisco | Napa Valley 2025. Each office is independently owned and operated.
New Listings
Sold Listings
Months of Inventory
Median Sale Price 0%
Median Sale vs List
Avg Days on Market

SEPTEMBER 2024 - SEPTEMBER 2025
Nodatatodisplay
Single-Family Homes
Last 12 months, year-over-year.
Condos & Townhomes
Nodatatodisplay
Last 12 months, year-over-year
The median sale price has increased from $0 last September 2024, to $0 as of September 2025
The median sale price has increased from $0 last September 2024, to $0 as of September 2025
The overbid percentage has increased from 0% last September 2024, to 0% a year later
The overbid percentage has increased from 0% last September 2024, to 0% a year later.
No data to display
No data to display
The average time spent on the market went up from 0 days last September 2024, to 0 days as of September 2025
The average time spent on the market went up from 0 days last September 2024, to 0 days as of September 2025.
No data to display

Noe Valley, Eureka Valley/Dolores Heights (Castro, Liberty Hill), Cole Valley, Glen Park, Corona Heights, Clarendon Heights, Ashbury Heights, Buena Vista Park, Haight Ashbury, Duboce Triangle, Twin Peaks, Mission Dolores, Parnassus Heights
There were 0 single-family homes for sale, providing 0 months of inventory. There were 0 new listings, and 0 homes sold at a median price of $0. The median overbid percentage was at 0%, with an average of 0 days on the market.
There were 0 condo and townhome units for sale, providing 0 months of inventory. There was 0 new listings and 0 units sold at a median sale price of $0. The median overbid percentage was at 0%, with an average of 0 days on the market.

0 New Listings
0 Sold Listings
0 Months of Inventory
$0
Median Sale Price
0%
Median Sale vs List
0
Avg Days on Market
The data, sourced from InfoSparks, includes all single-family homes, condos and townhomes in the California Area above from September 2024 to September 2025. This may include preliminary data, and may vary from the time the data was gathered. All data is deemed reliable but not guaranteed. DRE# 01995149. Copyright KW Advisors San Francisco | Napa Valley 2025. Each office is independently owned and operated.
SEPTEMBER 2024 - SEPTEMBER 2025
Nodatatodisplay
mes
year-over-year.
omes
Nodatatodisplay
year-over-year
The median sale price has increased from $0 last September 2024, to $0 as of September 2025
The median sale price has increased from $0 last September 2024, to $0 as of September 2025
The overbid percentage has increased from 0% last September 2024, to 0% a year later
The overbid percentage has increased from 0% last September 2024, to 0% a year later.
No data to display
No data to display
The average time spent on the market went up from 0 days last September 2024, to 0 days as of September 2025
The average time spent on the market went up from 0 days last September 2024, to 0 days as of September 2025.
No data to display

Hayes Valley, North of Panhandle (NOPA), Alamo Square, Western Addition, Anza Vista, Lower Pacific Heights
There were 0 single-family homes for sale, providing 0 months of inventory. There were 0 new listings, and 0 homes sold at a median price of $0. The median overbid percentage was at 0%, with an average of 0 days on the market
There were 0 condo and townhome units for sale, providing 0 months of inventory. There was 0 new listings and 0 units sold at a median sale price of $0. The median overbid percentage was at 0%, with an average of 0 days on the market.

0 ew Listings
0 Sold Listings
0 Months of Inventory
$0 Median Sale Price
0%
Median Sale vs List
0 Avg Days on Market
The data, sourced from InfoSparks, includes all single-family homes, condos and townhomes in the California Area above from September 2024 to September 2025. This may include preliminary data, and may vary from the time the data was gathered. All data is deemed reliable but not guaranteed. DRE# 01995149. Copyright KW Advisors San Francisco | Napa Valley 2025. Each office is independently owned and operated.
New Listings
Sold Listings
Months of Inventory
Median Sale Price
Median Sale vs List
Avg Days on Market

SEPTEMBER 2024 - SEPTEMBER 2025
Nodatatodisplay
Single-Family Homes
Last 12 months, year-over-year.
Condos & Townhomes
Nodatatodisplay
Last 12 months, year-over-year
The median sale price has increased from $0 last September 2024, to $0 as of September 2025
The median sale price has increased from $0 last September 2024, to $0 as of September 2025
The overbid percentage has increased from 0% last September 2024, to 0% a year later
The overbid percentage has increased from 0% last September 2024, to 0% a year later.
No data to display
No data to display
The average time spent on the market went up from 0 days last September 2024, to 0 days as of September 2025
The average time spent on the market went up from 0 days last September 2024, to 0 days as of September 2025.
No data to display

Pacific Heights, Presidio H Hollow, Marina
There were 0 single-family h providing 0 months of invent new listings, and 0 homes so of $0. The median overbid pe with an average of 0 days on
There were 0 condo and tow providing 0 months of invent listings and 0 units sold at a $0. The median overbid perc with an average of 0 days on
homes, condos and September 2025. This data was gathered. All Copyright KW Advisors San Francisco | Napa Valley 2025. Each office is independently owned and operated.
New Listings
Months of Inventory
Median Sale vs List
The median sale price has increased from $0 last September 2024, to $0 as of September 2025
The median sale price has increased from $0 last September 2024, to $0 as of September 2025
The overbid percentage has increased from 0% last September 2024, to 0% a year later
The overbid percentage has increased from 0% last September 2024, to 0% a year later.
No data to display
No data to display
The average time spent on the market went up from 0 days last September 2024, to 0 days as of September 2025
The average time spent on the market went up from 0 days last September 2024, to 0 days as of September 2025.
No data to display
Russian Hill, Nob Hill, Telegraph Hill, North Beach, Financial District, North Waterfront, Downtown, Van Ness/Civic Center, Tenderloin
There were 0 single-family homes for sale, providing 0 months of inventory. There were 0 new listings, and 0 homes sold at a median price of $0. The median overbid percentage was at 0%, with an average of 0 days on the market
There were 0 condo and townhome units for sale, providing 0 months of inventory. There was 0 new listings and 0 units sold at a median sale price of $0. The median overbid percentage was at 0%, with an average of 0 days on the market.
New Listing
Months of Inventor 0%
Median Sale vs Lis
The median sale price has increased from $0 last September 2024, to $0 as of September 2025
The median sale price has increased from $0 last September 2024, to $0 as of September 2025
The overbid percentage has increased from 0% last September 2024, to 0% a year later
The overbid percentage has increased from 0% last September 2024, to 0% a year later.
No data to display
No data to display
The average time spent on the market went up from 0 days last September 2024, to 0 days as of September 2025
The average time spent on the market went up from 0 days last September 2024, to 0 days as of September 2025.
No data to display
SoMa, South Beach, Mission Bay, Potrero Hill, Dogpatch, Bernal Heights, Inner Mission, Yerba Buena
What's in the District 9 - East data?
There were 0 single-family homes for sale, providing 0 months of inventory. There were 0 new listings, and 0 homes sold at a median price of $0. The median overbid percentage was at 0%, with an average of 0 days on the market.
There were 0 condo and townhome units for sale, providing 0 months of inventory. There was 0 new listings and 0 units sold at a median sale price of $0. The median overbid percentage was at 0%, with an average of 0 days on the market.
0 New Listings
0 Sold Listings
0 Months of Inventory
$0 Median Sale Price
0%
Median Sale vs List
0 Avg Days on Market
The data, sourced from InfoSparks, includes all single-family homes, condos and townhomes in the California Area above from September 2024 to September 2025. This may include preliminary data, and may vary from the time the data was gathered. All data is deemed reliable but not guaranteed. DRE# 01995149. Copyright KW Advisors San Francisco | Napa Valley 2025. Each office is independently owned and operated.
New Listings
Months of Inventory
Median Sale vs List
The median sale price has increased from $0 last September 2024, to $0 as of September 2025
The median sale price has increased from $0 last September 2024, to $0 as of September 2025
The overbid percentage has increased from 0% last September 2024, to 0% a year later
The overbid percentage has increased from 0% last September 2024, to 0% a year later.
No data to display
No data to display
The average time spent on the market went up from 0 days last September 2024, to 0 days as of September 2025
The average time spent on the market went up from 0 days last September 2024, to 0 days as of September 2025.
No data to display
Bayview, Bayview Heights
Portola, Visitacion Valley,
Mission Terrace, Crocker
Mission
There were 0 single-family ho providing 0 months of invent new listings, and 0 homes so of $0. The median overbid pe with an average of 0 days on
There were 0 condo and tow providing 0 months of invent listings and 0 units sold at a $0. The median overbid perc with an average of 0 days on
homes, condos and September 2025. This data was gathered. All Copyright KW Advisors San Francisco | Napa Valley 2025. Each office is independently owned and operated.
New Listings
Months of Inventory
Median Sale vs List
The median sale price has increased from $0 last September 2024, to $0 as of September 2025
The median sale price has increased from $0 last September 2024, to $0 as of September 2025
The overbid percentage has increased from 0% last September 2024, to 0% a year later
The overbid percentage has increased from 0% last September 2024, to 0% a year later.
No data to display
No data to display
The average time spent on the market went up from 0 days last September 2024, to 0 days as of September 2025
The average time spent on the market went up from 0 days last September 2024, to 0 days as of September 2025.
No data to display