That's the question you should be asking yourself.
Our market is incredibly diverse and rapidly changing. Values vary not just by neighborhood but by street. Your home isn't necessarily worth what your neighbors' home is. It's the current market that sets the value of your home.
So, do you know what your home is worth in today's market?
Icanhelp...
Contact me for a confidential, no obligation assessment of your home's value.
When you put your house on the market, you want to sell it quickly and for the best price possible; that’s generally the goal. But too many sellers are shooting too high right now. They don’t realize the market has shifted as inventory has grown. The side effect? Price cuts are on the rise, but they really don’t have to be. Here’s why.
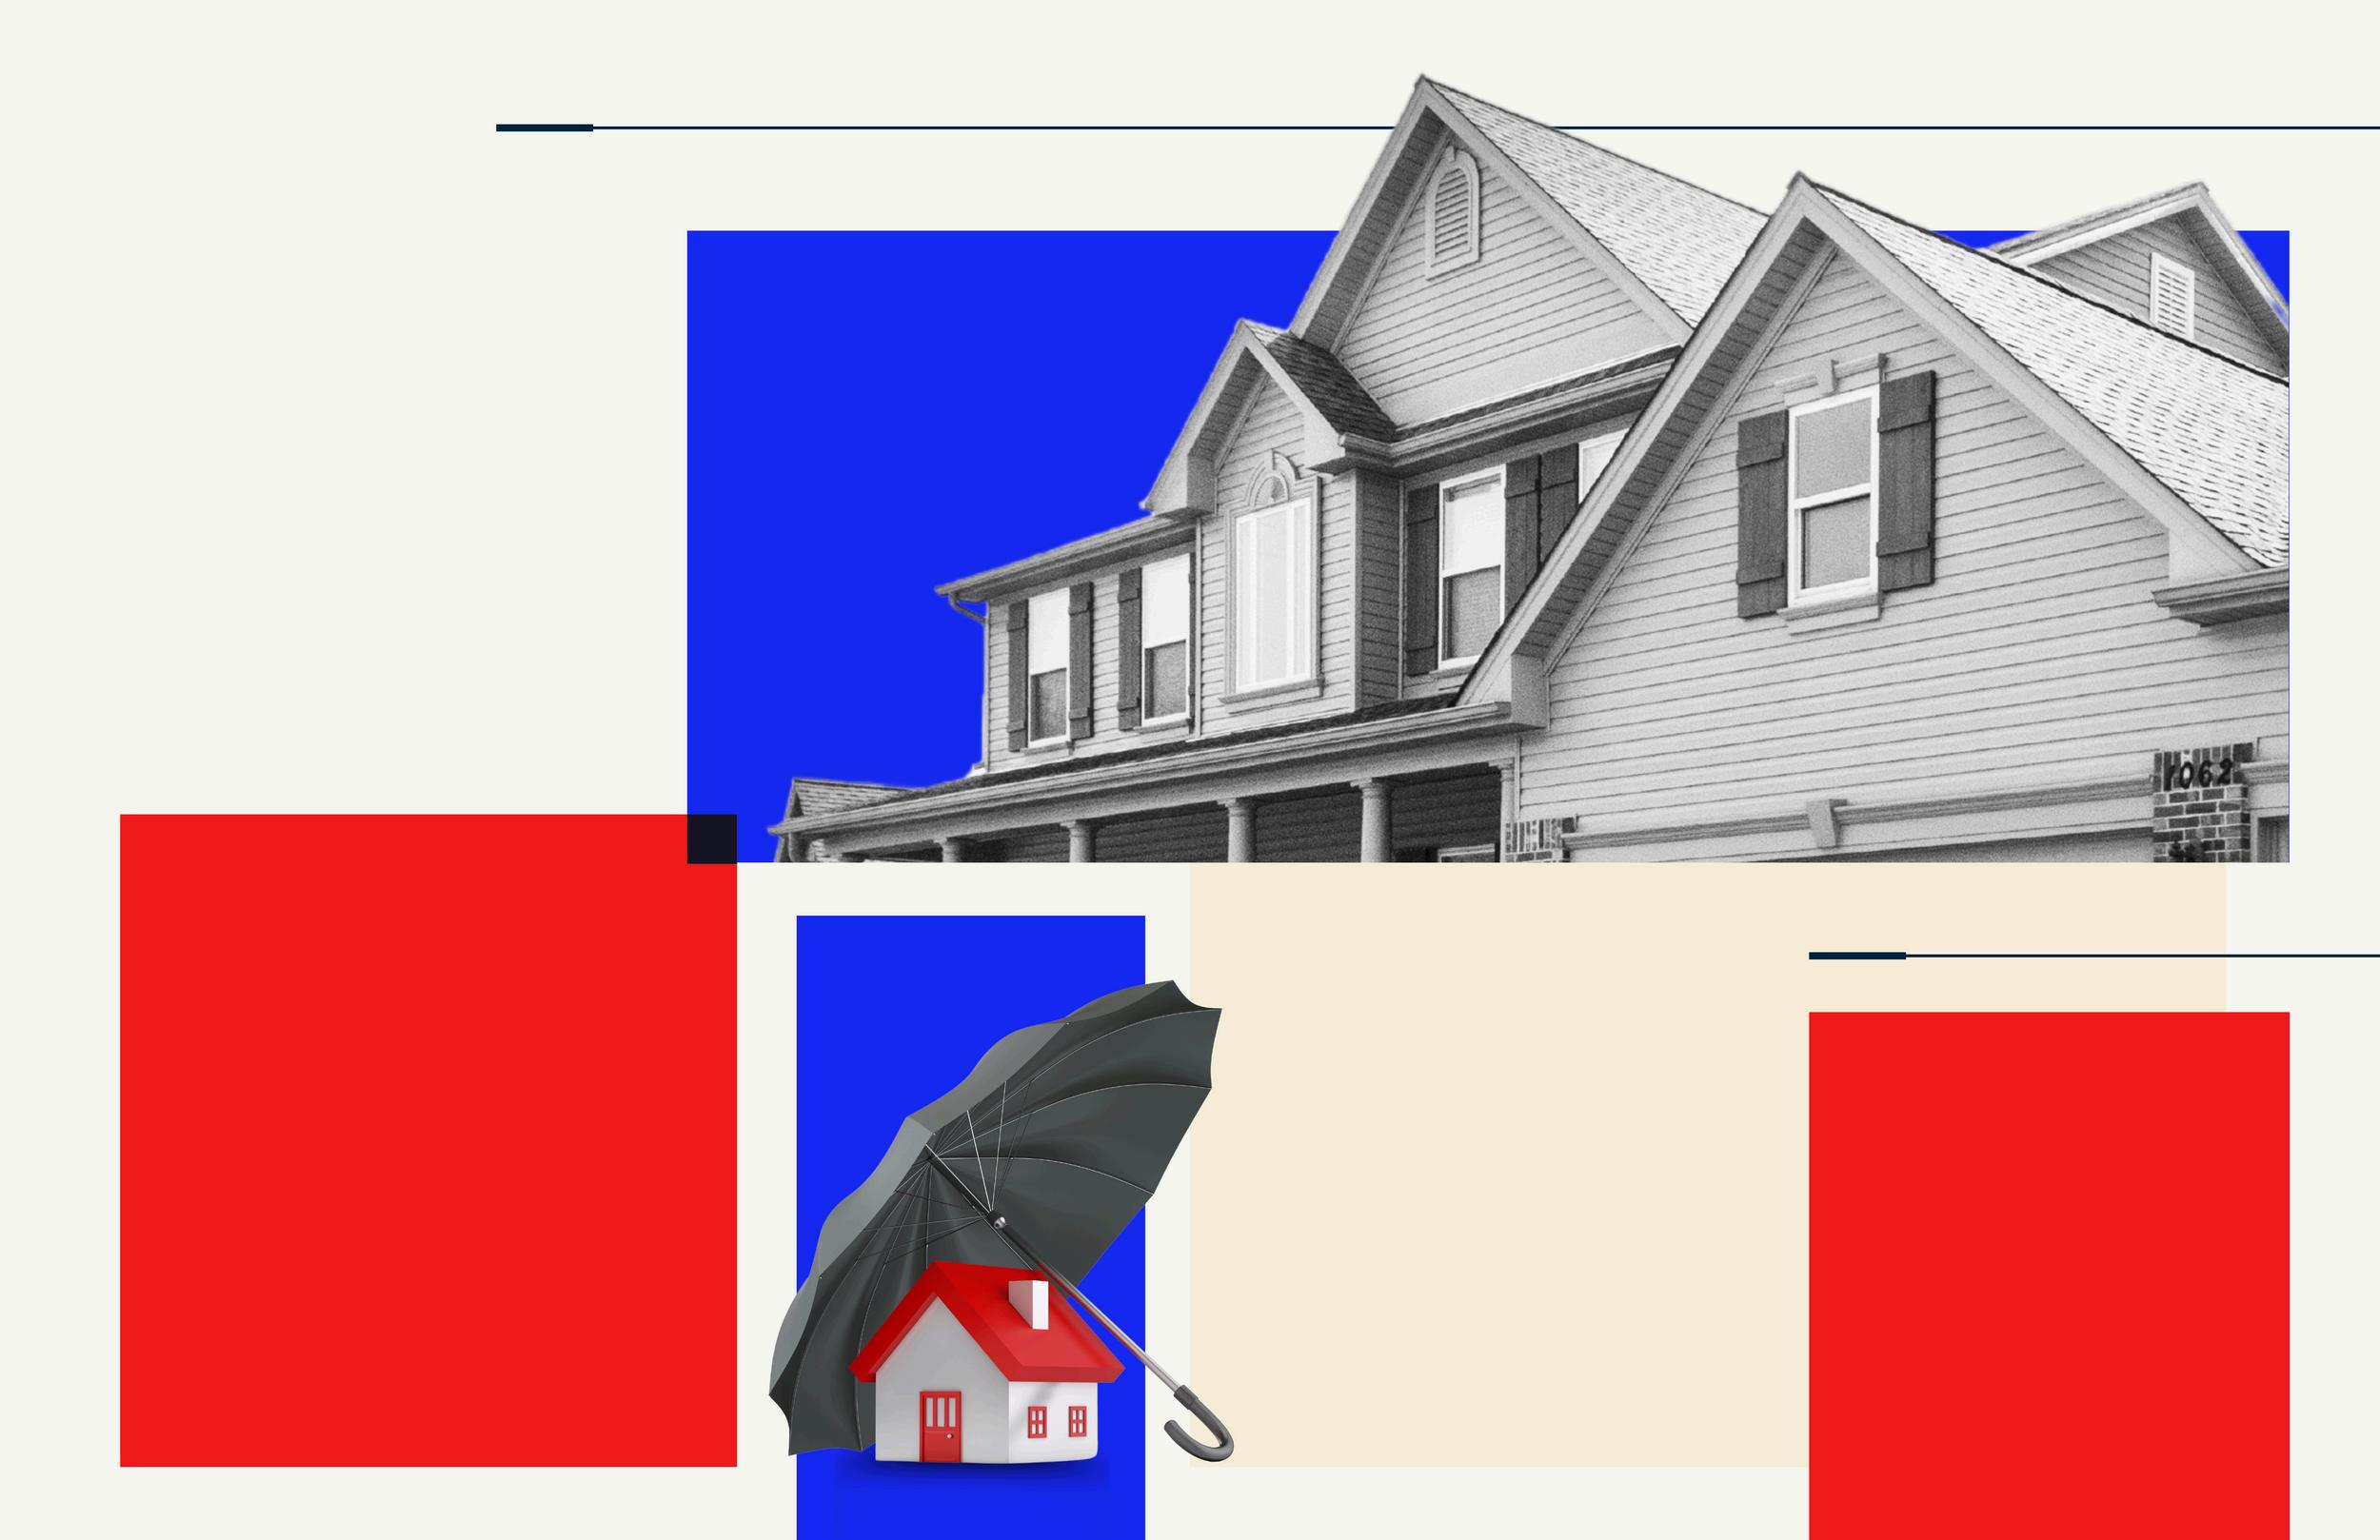
Smart Strategies for a Mortgage Application
Avoid paying off debts or collections without professional advice.
Don't have your credit report pulled too many times - this can hurt your credit score. 3 4 5 6 1 2
Always consult your mortgage professional before making large financial moves. Use verified funds for deposits to prevent closing delays.
HomeRenovationsThatCanMakea BIG IMPACT AccordingtoExperts
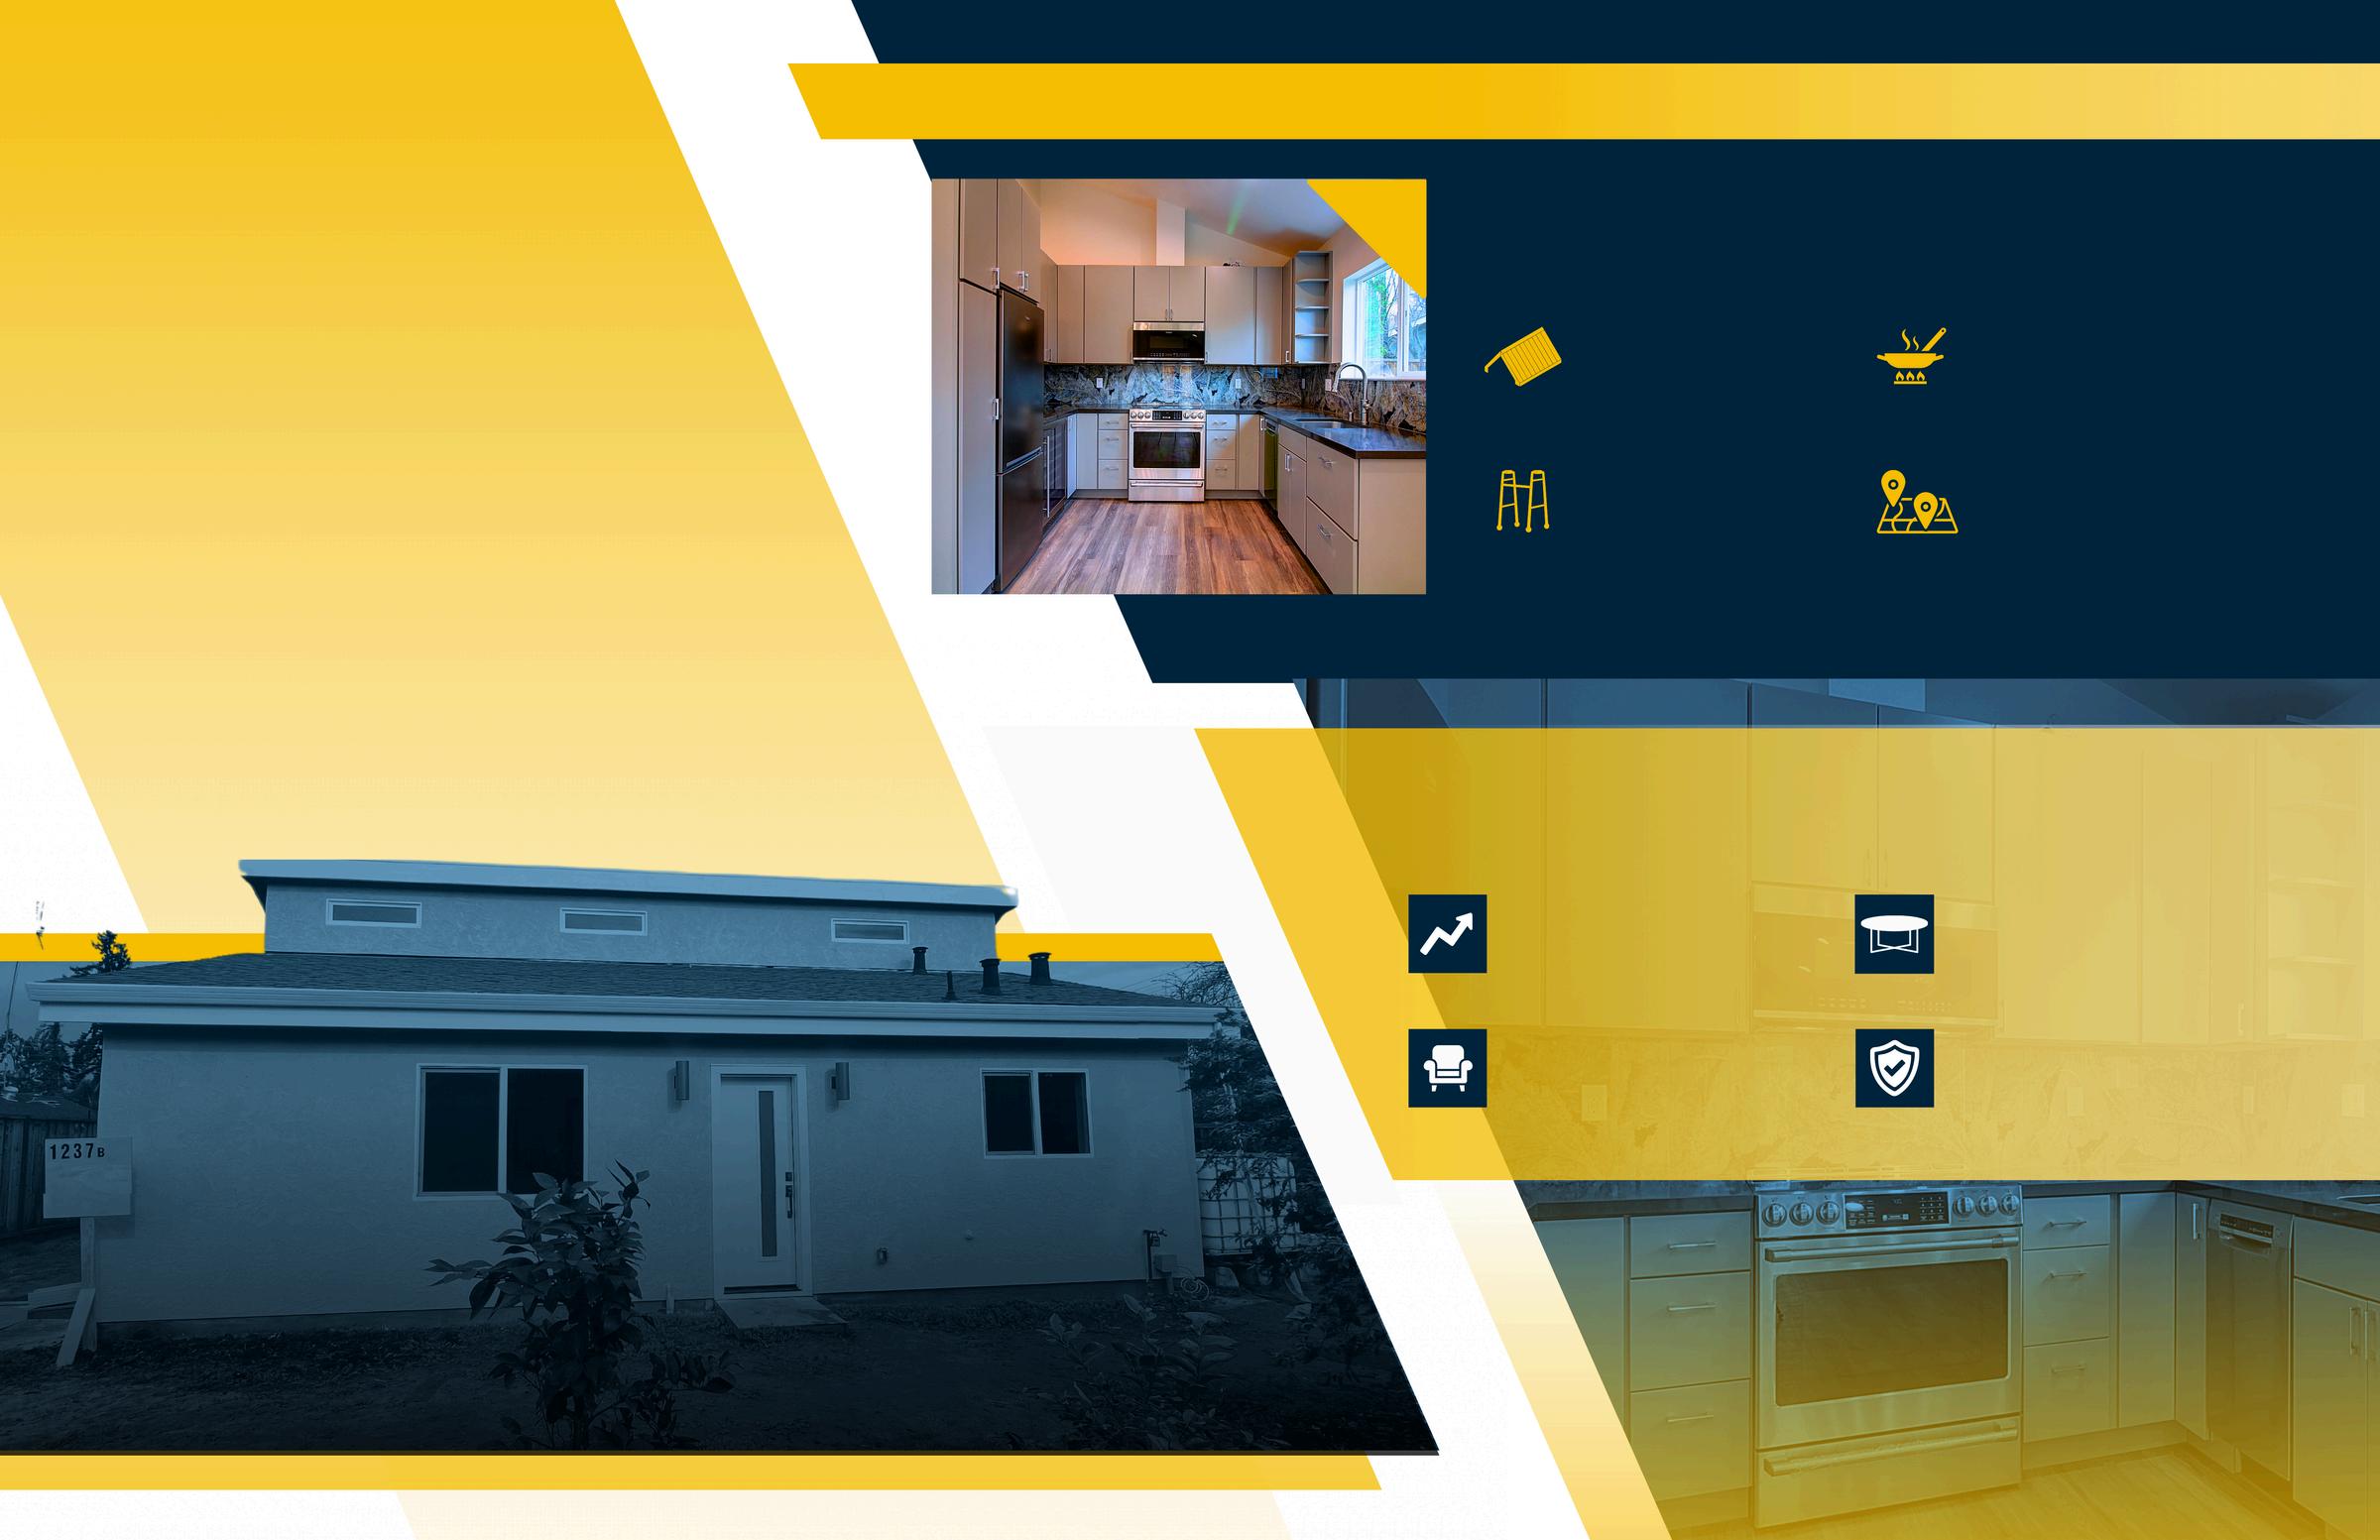
Enhancing Property Value and Family Living Space with an Acton ADU
The Anenberg-Essert family in Campbell collaborated with Acton ADU to create a versatile, comfortable, and valuable addition to their property. This ADU project is a shining example of how a well-designed accessory dwelling unit can increase property value and serve a family’s unique needs.
GoalsandVision
The family envisioned an ADU that would function as an independent living space for family members, enhance their property’s worth, and provide seamless integration with the main home They wanted a space that balanced privacy with connectivity, feeling like a natural extension of their residence
Design and Construction Details
Constructed at 747 square feet, this ADU was designed with modern, high-quality finishes to serve both aesthetic and practical needs. Key features include:
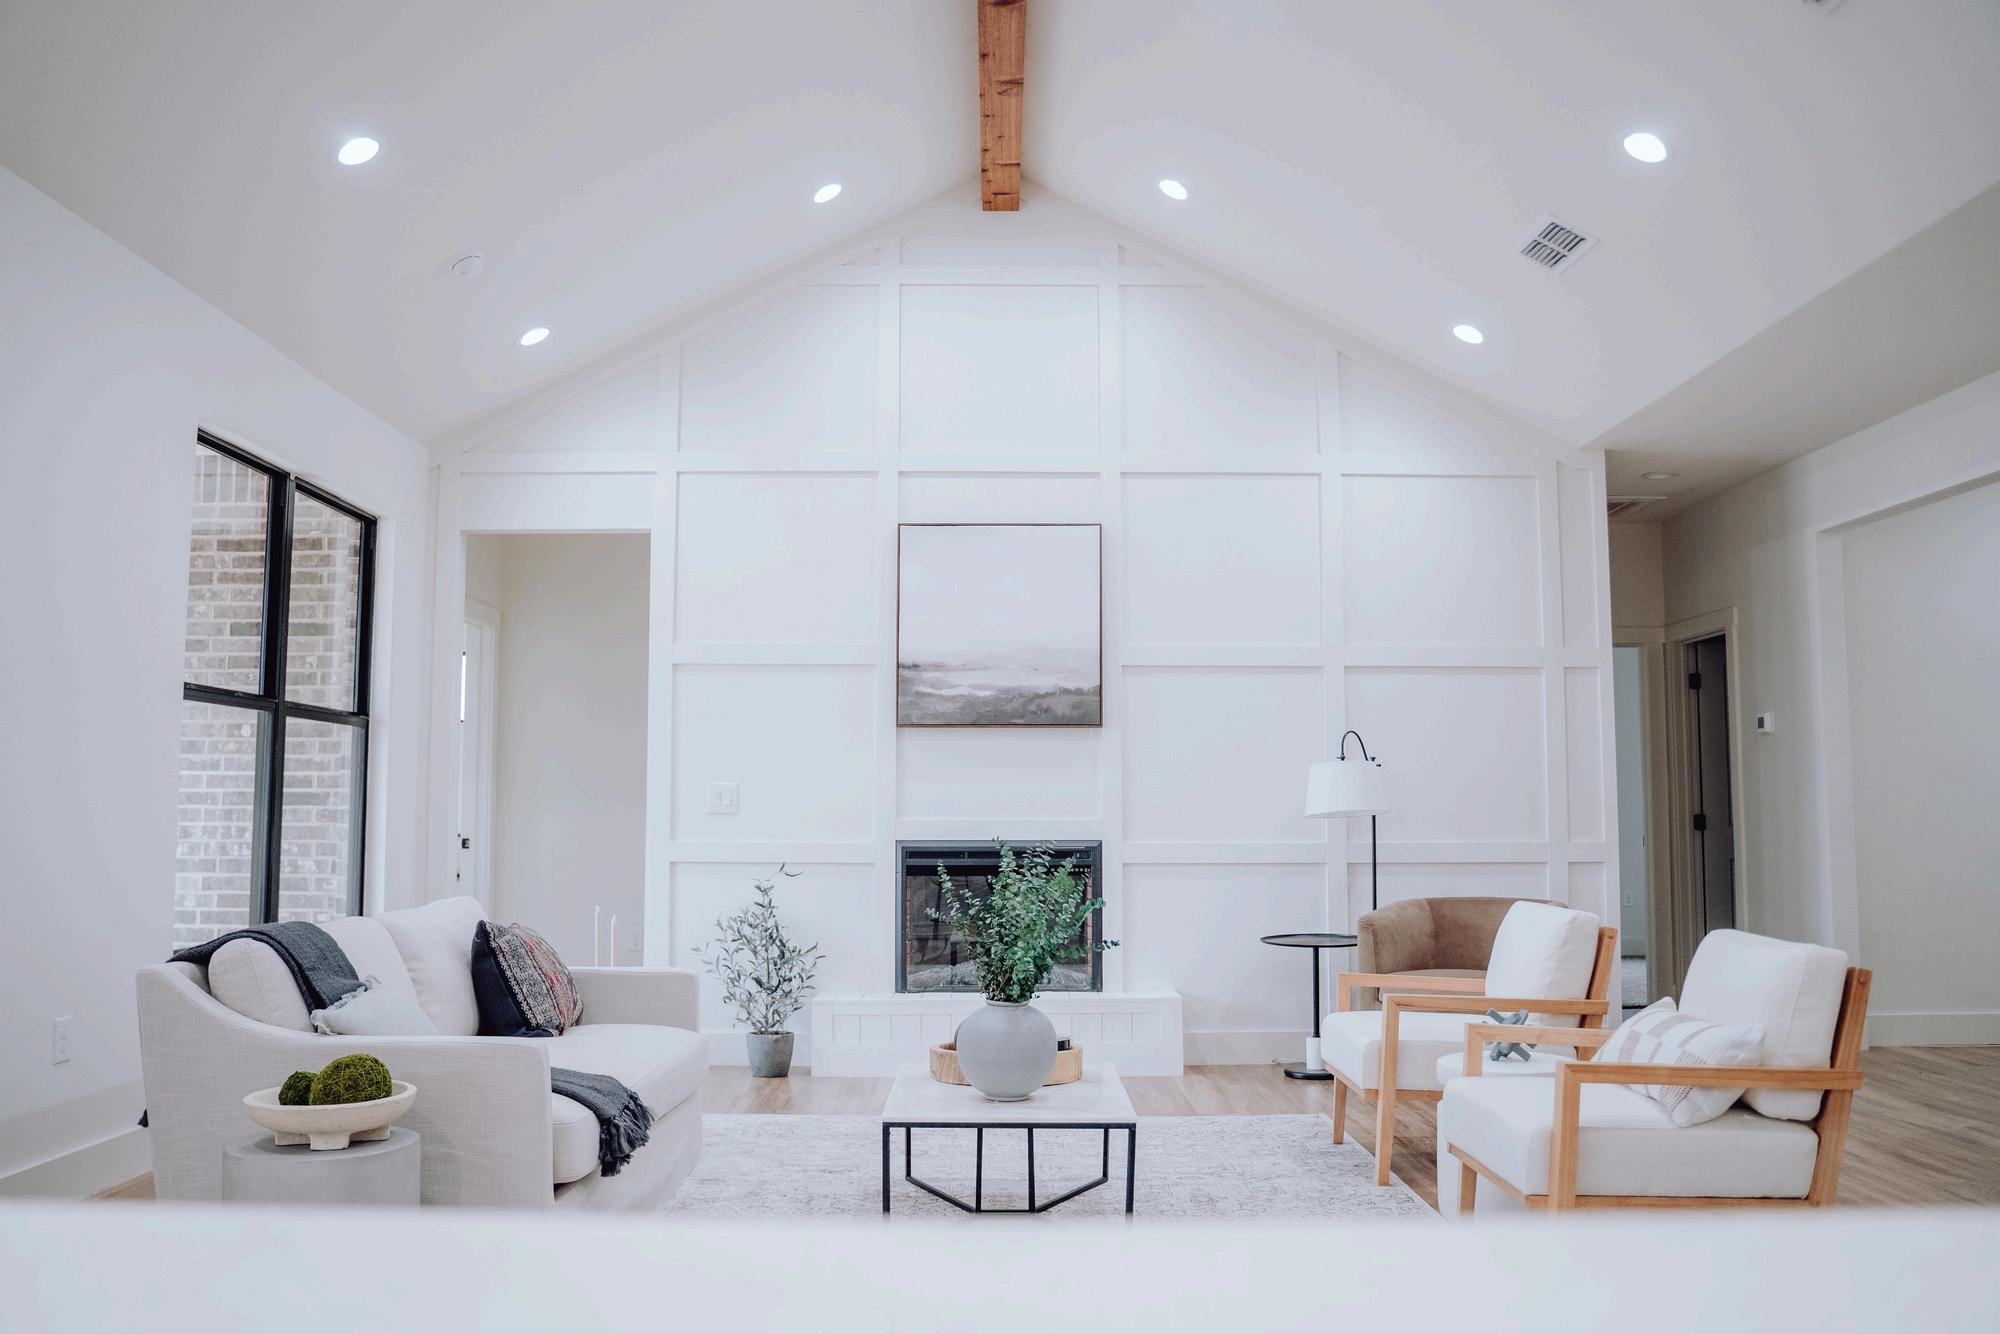
Vaulted Ceilings
Creates a spacious, open atmosphere
Senior-Friendly Living
Safe, independent space for elderly family members
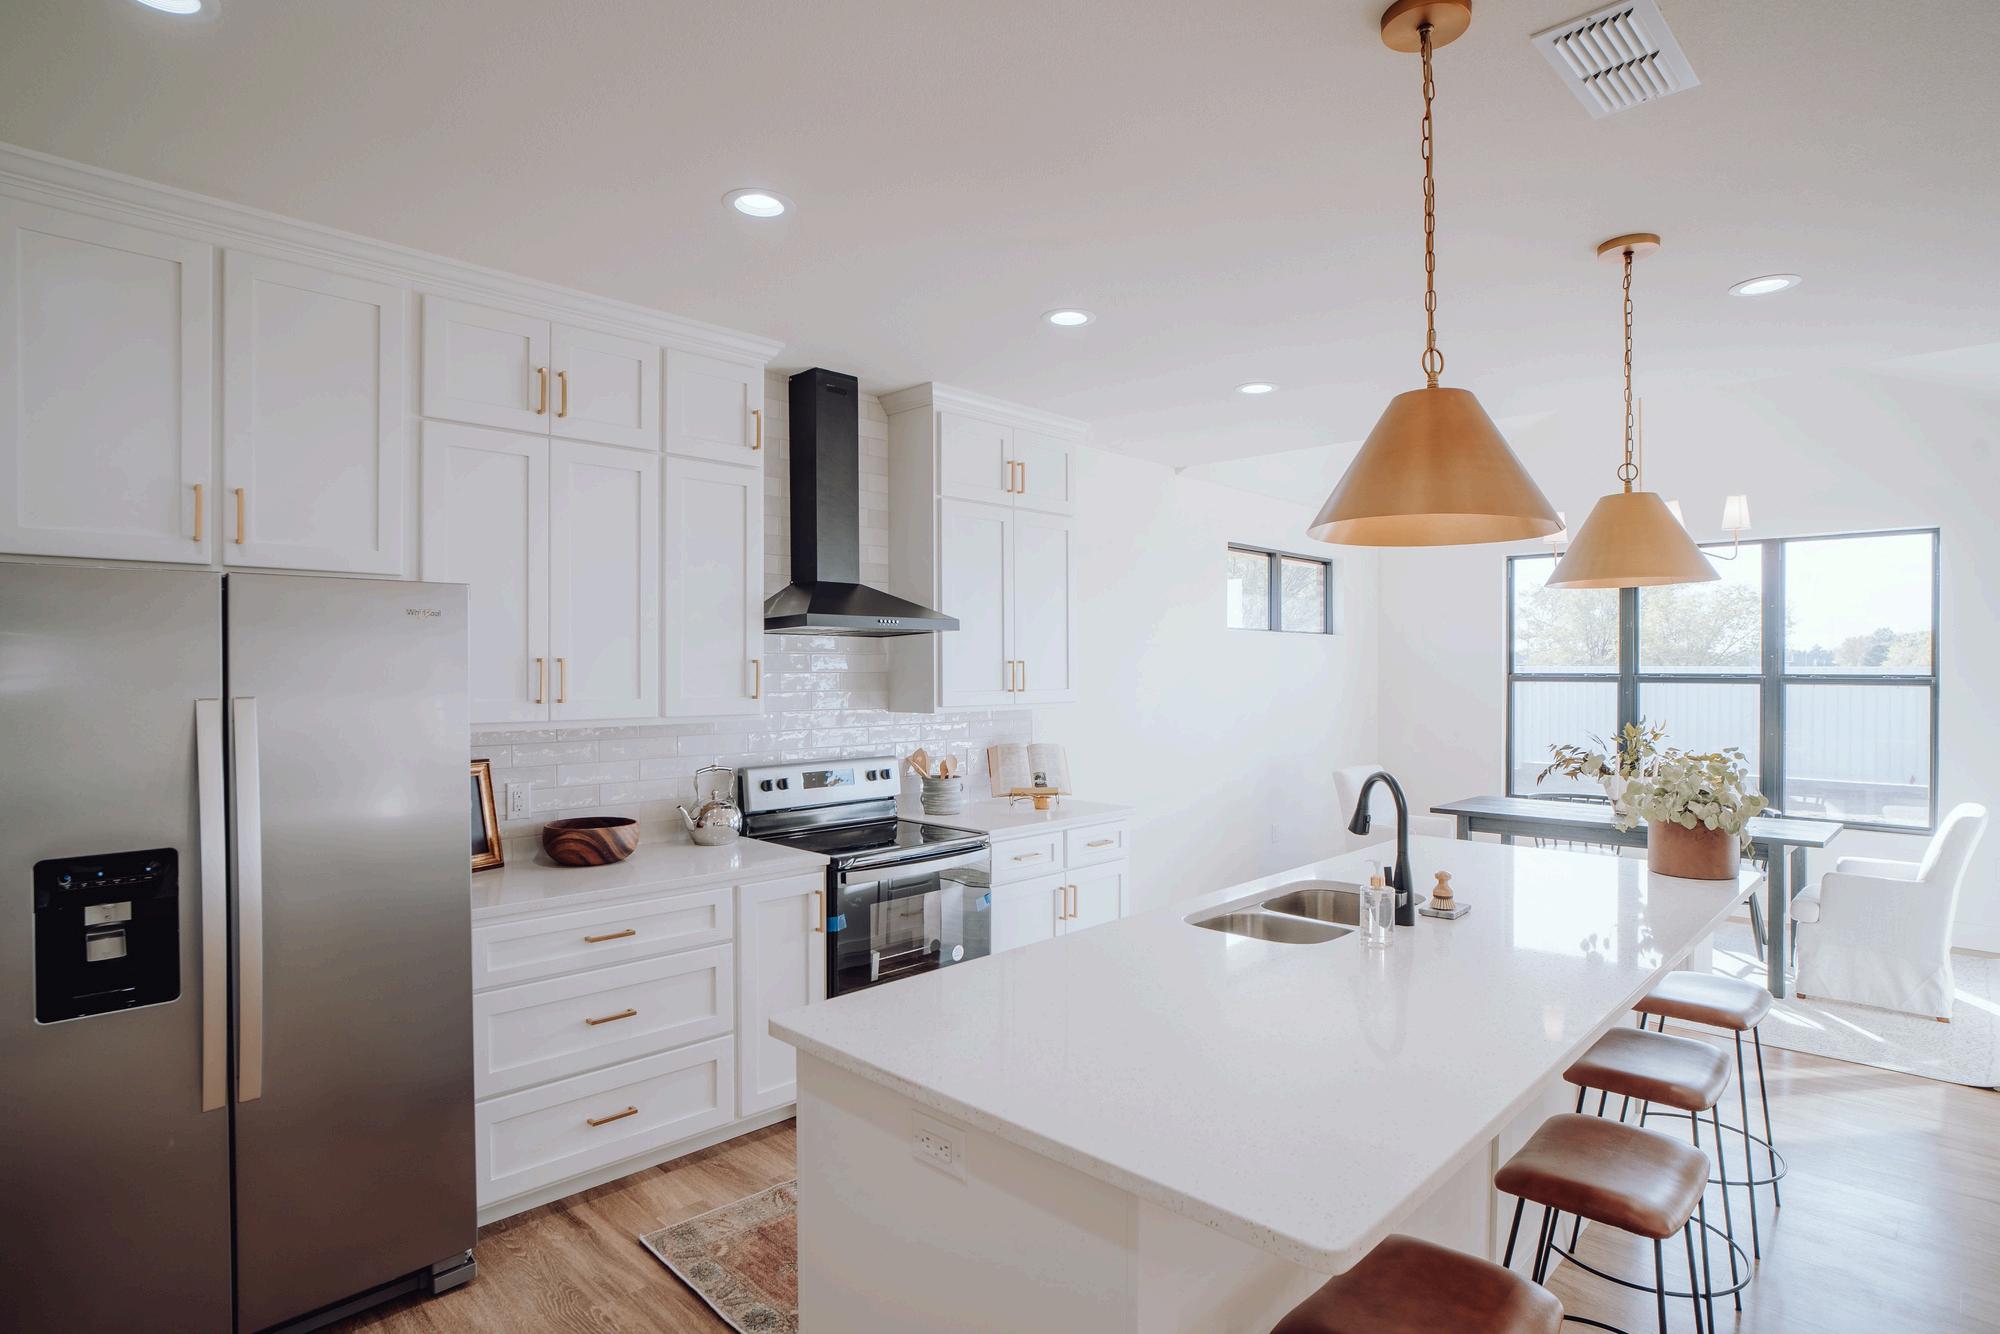
Fully Equipped Kitchen
Modern amenities for everyday convenience
Open Living Area
Multipurpose area for relaxation and entertainment
Results and Impact
The completion of the Anenberg-Essert ADU led to several valuable outcomes:
Increased Property Value
The ADU addition significantly boosted property value
Flexible Living Space
A versatile space for family, guests, or as a rental
Modern Comforts
High-end finishes and amenities enhance both function and style.
Enhanced Family Living
The ADU enriches the AnenbergEssert family’s home with both privacy and connection
VENDOR DIRECTORY
When it comes to home ownership, knowing who you can trust is crucial. That's why we've curated a select list of trusted vendors who are ready to help with your home goals.
Milpitas
What's in the Milpitas data?
There were 59 single-family homes for sale, providing 1.4 months of inventory. There were 31 new listings, and 13 homes sold at a median price of $1.4m. The median overbid percentage was at 105.3%, with an average of 16 days on the market.
There were 84 condo and townhome units for sale, providing 3 months of inventory. There were 41 new listings and 16 units sold at a median sale price of $1 3m The median overbid percentage was at 107.7%, with an average of 15 days on the market.
mily Homes tory
13 Sold Listings
$1.4M Median Sale Price
3% List
16 Avg Days on Market
Broker Metrics, includes all single-family homes, condos and rnia Area from March 2024 to March 2025. This may include vary from the time the data was gathered. All data is deemed eed. DRE# 01345026. Copyright KW Advisors Fremont 2025. Each office is independently owned and operated.
41
New Listings
16 Sold Listings
3 Months of Inventory
$1.3M
Median Sale Price 107.7%
Median Sale vs List 15 Avg Days on Market
MARCH 2024 - MARCH 2025
Single-Family Homes
Last 12 months, year-over-year.
Condos & Townhomes
Last 12 months, year-over-year
Median SalesPrice
Single-Family Homes
The median sale price has decreased from $1 6m last March 2024, to $1 4m as of March 2025
Condos & Townhomes
The median sale price has increased from $1 2m last March 2024, to $1 3m as of March 2025
AVGDays OntheMarket
Single-Family Homes
The average time spent on the market went up from 10 days last March 2024, to 16 days as of March 2025
Condos & Townhomes
The average time spent on the market went down from 19 days in March 2024, to 15 days as of March 2025.
Overbids
Single-Family Homes
The overbid percentage has decreased from 110 8% last March 2024, to 105 3% a year later
Condos & Townhomes
The overbid percentage has increased from 104.3% last March 2024, to 107.7% a year later.
Fremont
What's in the Fremont data?
There were 199 single-family homes for sale, providing 1.2 months of inventory. There were 116 new listings, and 74 homes sold at a median price of $1.8m. The median overbid percentage was at 107.2%, with an average of 11 days on the market.
There were 159 condo and townhome units for sale, providing 2.8 months of inventory. There were 79 new listings and 40 units sold at a median sale price of $900k. The median overbid percentage was at 101.7%, with an average of 33 days on the market.
SFH
Single-Family Homes
116 New Listings
74 Sold Listings
1.2 Months of Inventory
$1.8M
Median Sale Price
107.2%
Median Sale vs List
11 Avg Days on Market
The data, sourced from Broker Metrics, includes all single-family homes, condos and townhomes in the California Area from March 2024 to March 2025. This may include preliminary data, and may vary from the time the data was gathered. All data is deemed reliable but not guaranteed. DRE# 01345026. Copyright KW Advisors Fremont 2025. Each office is independently owned and operated.
79 New Listings
Listings
MARCH 2024 - MARCH 2025
mes year-over-year.
omes , year-over-year
Median SalesPrice
Single-Family Homes
The median sale price has increased from $1 7m last March 2024, to $1 8m as of March 2025
Condos & Townhomes
The median sale price has decreased from $1m last March 2024, to $900k as of March 2025
AVGDays OntheMarket
Single-Family Homes
The average time spent on the market went up from 8 days last March 2024, to 11 days as of March 2025
Condos & Townhomes
The average time spent on the market went up from 11 days in March 2024, to 33 days as of March 2025.
Overbids
Single-Family Homes
The overbid percentage has decreased from 111 4% last March 2024, to 107 2% a year later
Condos & Townhomes
The overbid percentage has decreased from 103.8% last March 2024, to 101.7% a year later.
Newark
What's in the Newark data?
There were 57 single-family homes for sale, providing 1.4 months of inventory. There were 35 new listings, and 18 homes sold at a median price of $1.4m. The median overbid percentage was at 106.2%, with an average of 12 days on the market.
There were 44 condo and townhome units for sale, providing 2 months of inventory. There were 21 new listings and 13 units sold at a median sale price of $760k. The median overbid percentage was at 101.5%, with an average of 19 days on the market.
35 New Listings
18 Sold Listings
1.4 Months of Inventory
$1.4M Median Sale Price
106.2%
Median Sale vs List
12 Avg Days on Market
21
New Listings
13
Sold Listings
2
Months of Inventory $760K
Median Sale Price 101.5%
Median Sale vs List
19 Avg Days on Market
MARCH 2024 - MARCH 2025
Single-Family Homes
Last 12 months, year-over-year.
Condos & Townhomes
Last 12 months, year-over-year
Median SalesPrice
Single-Family Homes
The median sale price has decreased from $1 44m last March 2024, to $1 41m as of March 2025
Condos & Townhomes
The median sale price has decreased from $1m last March 2024, to $760k as of March 2025
AVGDays OntheMarket
Single-Family Homes
The average time spent on the market went up from 9 days last March 2024, to 12 days as of March 2025
Condos & Townhomes
The average time spent on the market went up from 17 days in March 2024, to 19 days as of March 2025.
Overbids
Single-Family Homes
The overbid percentage has decreased from 113 5% last March 2024, to 106 2% a year later
Condos & Townhomes
The overbid percentage has decreased from 105.3% last March 2024, to 101.5% a year later.
UnionCity
What's in the Union City data?
There were 58 single-family homes for sale, providing 1.2 months of inventory. There were 36 new listings, and 23 homes sold at a median price of $1.5m. The median overbid percentage was at 104.9%, with an average of 12 days on the market.
There were 35 condo and townhome units for sale, providing 2.6 months of inventory. There were 15 new listings and 9 units sold at a median sale price of $680k. The median overbid percentage was at 103.4%, with an average of 25 days on the market.
36 New Listings
mily Homes
23 Sold Listings
1.2 Months of Inventory
$1.5M Median Sale Price
104.9%
Median Sale vs List
12 Avg Days on Market
Broker Metrics, includes all single-family homes, condos and rnia Area from March 2024 to March 2025. This may include vary from the time the data was gathered. All data is deemed eed. DRE# 01345026. Copyright KW Advisors Fremont 2025. Each office is independently owned and operated.
15
New Listings
9
Sold Listings
2.6
Months of Inventory
$680K
Median Sale Price
103.4%
Median Sale vs List
25 Avg Days on Market
UnionCity
MARCH 2024 - MARCH 2025
gle-Family Homes
t 12 months, year-over-year.
ndos & Townhomes
t 12 months, year-over-year
Single-Family Homes
The median sale price has decreased from $1 56m last March 2024, to $1 52m as of March 2025
Condos & Townhomes
The median sale price has decreased from $887k last March 2024, to $680k as of March 2025
AVGDays OntheMarket
Single-Family Homes
The average time spent on the market went up from 8 days last March 2024, to 12 days as of March 2025
Condos & Townhomes
The average time spent on the market went up from 9 days in March 2024, to 25 days as of March 2025.
Overbids
Single-Family Homes
The overbid percentage has decreased from 109 8% last March 2024, to 104 9% a year later
Condos & Townhomes
The overbid percentage has increased from 102.3% last March 2024, to 103.4% a year later.
86 New Listings
Homes
39 Sold Listings
1.6 Months of Inventory
$940K
Median Sale Price
105.5%
Median Sale vs List
17 Avg Days on Market
sourced from Broker Metrics, includes all single-family homes, condos and in the California Area from March 2024 to March 2025. This may include ata, and may vary from the time the data was gathered. All data is deemed not guaranteed. DRE# 01345026. Copyright KW Advisors Fremont 2025. Each office is independently owned and operated.
New Listings
3.5
Months of Inventory $810K Median Sale Price
102.1%
Median Sale vs List 43 Avg Days on Market 21 Sold Listings
Median SalesPrice
Single-Family Homes
The median sale price has increased from $930k last March 2024, to $940k as of March 2025
Condos & Townhomes
The median sale price has increased from $680k last March 2024, to $810k as of March 2025
AVGDays OntheMarket
Single-Family Homes
The average time spent on the market went down from 21 days last March 2024, to 17 days as of March 2025
Condos & Townhomes
The average time spent on the market went up from 23 days in March 2024, to 43 days as of March 2025.
Overbids
Single-Family Homes
The overbid percentage has decreased from 106 3% last March 2024, to 105 5% a year later
Condos & Townhomes
The overbid percentage has decreased from 103.2% last March 2024, to 102.1% a year later.
Castro Valley
What's in the Cast data?
There were 64 single-family h providing 1 month of invento new listings, and 27 homes s of $1.2m. The median overbi 105 2%, with an average of 2
There were 32 condo and tow sale, providing 7 months of in 12 new listings and 4 units s price of $1m. The median ov at 96.6%, with an average of market.
43 New Listings
1 Month of Inventory
105.2% Median Sale vs List
27 Sold Listings
$1.2M Median Sale Price
20 Avg Days on Market
single-family homes, condos and 2025. This may include gathered. All data is deemed Advisors Fremont 2025.
New Listings
7 Months of Inventory $1M Median Sale Price 96.6% Median Sale vs List 47 Avg Days on Market 4 Sold Listings
Median SalesPrice
Single-Family Homes
The median sale price has increased from $1 25m last March 2024, to $1 28m as of March 2025
Condos & Townhomes
The median sale price has increased from $887k last March 2024, to $1m as of March 2025
AVGDays OntheMarket
Single-Family Homes
The average time spent on the market went down from 21 days last March 2024, to 20 days as of March 2025
Condos & Townhomes
The average time spent on the market went up from 9 days in March 2024, to 47 days as of March 2025.
Overbids
Single-Family Homes
The overbid percentage has increased from 102% last March 2024, to 105 2% a year later
Condos & Townhomes
The overbid percentage has decreased from 107.4% last March 2024, to 96.6% a year later.
San Leandro
What's in the San Leandro data?
There were 84 single-family homes for sale, providing 1.7 months of inventory. There were 38 new listings, and 29 homes sold at a median price of $875k. The median overbid percentage was at 102 8%, with an average of 16 days on the market
There were 35 condo and townhome units for sale, providing 1.9 months of inventory. There were 12 new listings and 8 units sold at a median sale price of $657k. The median overbid percentage was at 101.2%, with an average of 27 days on the market.
SFH
Single-Family Homes
38 New Listings
29 Sold Listings
1.7 Months of Inventory
$875K
Median Sale Price
102.8%
Median Sale vs List
16 Avg Days on Market
The data, sourced from Broker Metrics, includes all single-family homes, condos and townhomes in the California Area from March 2024 to March 2025. This may include preliminary data, and may vary from the time the data was gathered. All data is deemed reliable but not guaranteed. DRE# 01345026. Copyright KW Advisors Fremont 2025. Each office is independently owned and operated.
New Listings
1.9 Months of Inventory $657K Median Sale Price 101.2% Median Sale vs List 27 Avg Days on Market 8 Sold Listings
Median SalesPrice
Single-Family Homes
The median sale price has decreased from $909k last March 2024, to $875k as of March 2025
Condos & Townhomes
The median sale price has increased from $610k last March 2024, to $657k as of March 2025
AVGDays OntheMarket
Single-Family Homes
The average time spent on the market went up from 12 days last March 2024, to 16 days as of March 2025
Condos & Townhomes
The average time spent on the market went down from 50 days in March 2024, to 27 days as of March 2025.
Overbids
Single-Family Homes
The overbid percentage has decreased from 108% last March 2024, to 102 8% a year later
Condos & Townhomes
The overbid percentage has increased from 99.9% last March 2024, to 101.2% a year later.
Tri-Cities
What's in the Tri-Cities data?
There were 314 single-family homes for sale, providing 1 2 months of inventory There were 187 new listings, and 115 homes sold at a median price of $1.7m. The median overbid percentage was at 106.7%, with an average of 11 days on the market.
There were 238 condo and townhome units for sale, providing 2.6 months of inventory. There were 115 new listings and 62 units sold at a median sale price of $851k. The median overbid percentage was at 101.8%, with an average of 28 days on the market.
187 New Listings
115 Sold Listings
1.2 Months of Inventory
$1.7M Median Sale Price
106.7%
Median Sale vs List
11 Avg Days on Market
New Listings
62 Sold Listings
2.6
Months of Inventory $851K Median Sale Price
101.8%
Median Sale vs List
28 Avg Days on Market
Median SalesPrice
Single-Family Homes
The median sale price has increased from $1 6m last March 2024, to $1 7m as of March 2025
Condos & Townhomes
The median sale price has decreased from $1m last March 2024, to $851k as of March 2025
AVGDays OntheMarket
Single-Family Homes
The average time spent on the market went up from 8 days last March 2024, to 11 days as of March 2025
Condos & Townhomes
The average time spent on the market went up from 12 days in March 2024, to 28 days as of March 2025.
Overbids
Single-Family Homes
The overbid percentage has decreased from 111 5% last March 2024, to 106 7% a year later
Condos & Townhomes
The overbid percentage has decreased from 104% last March 2024, to 101.8% a year later.
Pleasan
What's in the Plea
There were 150 single-family providing 1.4 months of inve new listings, and 37 homes s of $1.8m. The median overb 101%, with an average of 18
There were 48 condo and tow sale, providing 4.1 months o were 26 new listings and 10 sale price of $780k. The med percentage was at 100.5%, w days on the market.
92 New Listings
1.4 Months of Inventory
101% Median Sale vs List
37 Sold Listings
$1.8M Median Sale Price
18 Avg Days on Market
homes, condos and 2025. This may include gathered. All data is deemed Advisors Fremont 2025.
Condo 26
New Listings
4.1
Sold Listings
Months of Inventory $780K Median Sale Price
100.5%
Median Sale vs List 40 Avg Days on Market 10
Median SalesPrice
Single-Family Homes
The median sale price has decreased from $2m last March 2024, to $1 8m as of March 2025
Condos & Townhomes
The median sale price has increased from $725k last March 2024, to $780k as of March 2025
AVGDays OntheMarket
Single-Family Homes
The average time spent on the market went up from 15 days last March 2024, to 18 days as of March 2025
Condos & Townhomes
The average time spent on the market went up from 8 days in March 2024, to 40 days as of March 2025.
Overbids
Single-Family Homes
The overbid percentage has decreased from 102 7% last March 2024, to 101% a year later
Condos & Townhomes
The overbid percentage has decreased from 103.7% last March 2024, to 100.5% a year later.
SanRamon
What's in the San Ramon data?
There were 106 single-family homes for sale, providing 1.6 months of inventory. There were 69 new listings, and 38 homes sold at a median price of $2m. The median overbid percentage was at 100.4%, with an average of 14 days on the market.
There were 83 condo and townhome units for sale, providing 3 months of inventory. There were 38 new listings and 14 units sold at a median sale price of $1m. The median overbid percentage was at 99.3%, with an average of 18 days on the market.
SFH
Single-Family Homes
69 New Listings
38 Sold Listings
1.6 Months of Inventory
$2M Median Sale Price
100.4%
Median Sale vs List
14 Avg Days on Market
The data, sourced from Broker Metrics, includes all single-family homes, condos and townhomes in the California Area from March 2024 to March 2025. This may include preliminary data, and may vary from the time the data was gathered. All data is deemed reliable but not guaranteed. DRE# 01345026. Copyright KW Advisors Fremont 2025. Each office is independently owned and operated.
Single-Family Homes
Last 12 months, year-over-year.
Condos & Townhomes
Last 12 months, year-over-year
Median SalesPrice
Single-Family Homes
The median sale price has increased from $1 6m last March 2024, to $2m as of March 2025
Condos & Townhomes
The median sale price has increased from $860k last March 2024, to $1m as of March 2025
AVGDays OntheMarket
Single-Family Homes
The average time spent on the market went up from 9 days last March 2024, to 14 days as of March 2025
Condos & Townhomes
The average time spent on the market went down from 22 days in March 2024, to 18 days as of March 2025.
Overbids
Single-Family Homes
The overbid percentage has decreased from 107 2% last March 2024, to 100 4% a year later
Condos & Townhomes
The overbid percentage has decreased from 102.1% last March 2024, to 99.3% a year later.
Livermore
What's in the Livermore data?
There were 173 single-family homes for sale, providing 1 month of inventory. There were 105 new listings, and 65 homes sold at a median price of $1.2m. The median overbid percentage was at 102.1%, with an average of 12 days on the market.
There were 43 condo and townhome units for sale, providing 1.7 months of inventory. There were 26 new listings and 18 units sold at a median sale price of $750k. The median overbid percentage was at 99.8%, with an average of 21 days on the market.
SFH
Single-Family Homes
105 New Listings
65 Sold Listings
1 Month of Inventory
$1.2M
Median Sale Price
102.1%
Median Sale vs List
12 Avg Days on Market
The data, sourced from Broker Metrics, includes all single-family homes, condos and townhomes in the California Area from March 2024 to March 2025. This may include preliminary data, and may vary from the time the data was gathered. All data is deemed reliable but not guaranteed. DRE# 01345026. Copyright KW Advisors Fremont 2025. Each office is independently owned and operated.
MARCH 2024 - MARCH 2025
R SALE SOLD LISTINGS
mes year-over-year.
omes year-over-year
Median SalesPrice
Single-Family Homes
The median sale price has increased from $1 25m last March 2024, to $1 26m as of March 2025
Condos & Townhomes
The median sale price has decreased from $1m last March 2024, to $750k as of March 2025
AVGDays OntheMarket
Single-Family Homes
The average time spent on the market went down from 13 days last March 2024, to 12 days as of March 2025
Condos & Townhomes
The average time spent on the market went up from 13 days in March 2024, to 21 days as of March 2025.
Overbids
Single-Family Homes
The overbid percentage has decreased from 103% last March 2024, to 102 1% a year later
Condos & Townhomes
The overbid percentage has decreased from 102.8% last March 2024, to 99.8% a year later.
Cupert
What's in the Cupe
There were 71 single-family h providing 1.9 months of inve new listings, and 24 homes s of $3.6m. The median overbi 112.8%, with an average of 1
There were 35 condo and tow sale, providing 0.9 months of were 21 new listings and 14 sale price of $1.3m. The med percentage was at 100.7%, w days on the market.
37 New Listings
1.9 Months of Inventory
112.8% Median Sale vs List
24 Sold Listings
$3.6M Median Sale Price
10 Avg Days on Market
homes, condos and 2025. This may include gathered. All data is deemed Advisors Fremont 2025.
Condo
21
New Listings
0.9
Sold Listings
Months of Inventory $1.3M
Median Sale Price 100.7%
Median Sale vs List 8 Avg Days on Market 14
Median SalesPrice
Single-Family Homes
The median sale price has increased from $3 5m last March 2024, to $3 6m as of March 2025
Condos & Townhomes
The median sale price has decreased from $1 39m last March 2024, to $1 38m as of March 2025
AVGDays OntheMarket
Single-Family Homes
The average time spent on the market went down from 11 days last March 2024, to 10 days as of March 2025
Condos & Townhomes
The average time spent on the market went down from 20 days in March 2024, to 8 days as of March 2025.
Overbids
Single-Family Homes
The overbid percentage has increased from 109 1% last March 2024, to 112 8% a year later
Condos & Townhomes
The overbid percentage has decreased from 114.7% last March 2024, to 100.7% a year later.
Oakla
What's in the
There were 761 single providing 2.2 months new listings, and 181 price of $1m. The med at 112.9%, with an ave market.
There were 323 condo sale, providing 4 8 mo were 104 new listings median sale price of $ percentage was at 98 days on the market.
311 New Listings
181 Sold Listings
2.2 Months of Inventory $1M Median Sale Price
112.9%
Median Sale vs List
31 Avg Days on Market
single-family homes, condos and to March 2025. This may include was gathered. All data is deemed
Copyright KW Advisors Fremont 2025.
104 New Listings
37 Sold Listings
Oakland
MARCH 2024 - MARCH 2025
ngle-Family Homes ast 12 months, year-over-year.
ondos & Townhomes ast 12 months, year-over-year
Median SalesPrice
Single-Family Homes
The median sale price has increased from $999k last March 2024, to $1m as of March 2025
Condos & Townhomes
The median sale price has decreased from $669k last March 2024, to $615k as of March 2025
AVGDays OntheMarket
Single-Family Homes
The average time spent on the market went up from 21 days last March 2024, to 31 days as of March 2025
Condos & Townhomes
The average time spent on the market went up from 30 days in March 2024, to 46 days as of March 2025.
Overbids
Single-Family Homes
The overbid percentage has increased from 109 3% last March 2024, to 112 9% a year later
Condos & Townhomes
The overbid percentage has decreased from 102.6% last March 2024, to 98.8% a year later.