



LosGatos/MonteSereno
Jump to Los Gatos/Monte Sereno Report
Jump to Cambrian (San Jose) Report Cambrian(SanJose)
Jump to Saratoga Report Saratoga
Jump to Santa Clara County Report SantaClaraCounty
Jump to Almaden Valley (San Jose) Report Almaden Valley (San Jose)
Jump to Blossom Valley (San Jose) Report BlossomValley(SanJose)
Jump to Campbell Report Campbell
Jump to Cupertino Report Cupertino
Jump to Los Altos Report LosAltos
Jump to Santa Teresa (San Jose) Report Santa Teresa (San Jose)

Jump to Santa Clara City Report SantaClaraCity
Jump to South San Jose Report SouthSanJose
Jump to Sunnyvale Report Sunnyvale
Jump to Willow Glen (San Jose) Report WillowGlen(SanJose)


The past few years have been challenging for homebuyers, especially with higher home prices and mortgage rates. And if you’re trying to buy a home, it’s easy to worry you won’t be able to find something in your budget.
But here’s what you need to know. The number of homes for sale has grown a whole lot lately and that’s true for both existing (previously lived-in) and newly built homes. Here’s a look at those two bright spots for buyers right now and why they may make it a bit easier to find the home you’re been looking for.


The market for Single Family Homes, Condo, and Townhomes units saw 24 closed sales at a median price of $2.6m. There was a total of 57 new listings with an average of 39 days on the market without price reduction and with an average price per square foot of $1,412.


January 2025
57
+137.5% Year-over-Year
Average Price Per SqFt
$1,412
+26 9% Year-over-Year
24
$2.6M Median Sale Price +71.4% Year-over-Year
+21% Year-over-Year

39
+18.2% Year-over-Year
$68.1M Total Volume
+89 2% Year-over-Year
Data includes all single family, townhome, and condominium sales in the Bay Area sourced from MLS Listings The most recent month’s data is based on available numbers but may change with late reported activity Data from sources deemed reliable but may contain errors and are subject to revision

Sales

SqFt
$58.1M Total Volume
Data


20 New Listings
30 Average Days-on Market
$1.4M Median Sale Price
7 Closed Sales
$992 Average Price Per SqFt
$10M Total Volume


The market for Single Family Homes, Condo, and Townhomes units saw 24 closed sales at a median price of $1.7m. There was a total of 49 new listings with an average of 16 days on the market without price reduction and with an average price per square foot of $1,161.


January 2025
New Listings Closed Sales
49
+32.4% Year-over-Year
Average Price Per SqFt
$1,161
+4.5% Year-over-Year
24
$1.7M Median Sale Price +9.1% Year-over-Year -1 7% Year-over-Year

Average Days-on-Market
16
$40.8M Total Volume +23.1% Year-over-Year -4 2% Year-over-Year
Data includes all single family, townhome, and condominium sales in the Bay Area sourced from MLS Listings The most recent month’s data is based on available numbers but may change with late reported activity Data from sources deemed reliable but may contain errors and are subject to revision

40 New Listings

10 Average Days-on-Market
$1.8M
Median Sale Price
20 Closed Sales
$1,254
Average Price Per SqFt
$38.5M
Total Volume
Data includes all single family, townhome, and condominium sales in the Bay Area sourced from MLS Listings. The most recent month’s data is based on available numbers but may change with late reported activity. Data from sources deemed reliable but may contain errors and are subject to revision.


48 Average Days-on Market
$578K Median Sale Price
4 Closed Sales
$699 Average Price Per SqFt
$2.3M Total Volume




What's in the Saratoga data?
The market for Single Family Homes, Condo, and Townhomes units saw 19 closed sales at a median price of $4.2m. There was a total of 34 new listings with an average of 16 days on the market without price reduction and with an average price per square foot of $1,572.


January 2025
34
+126.7% Year-over-Year
$1,572 Average Price Per SqFt
+9 7% Year-over-Year
19
$4.2M Median Sale Price +26.7% Year-over-Year +2 9% Year-over-Year
16
$72.9M Total Volume -23.8% Year-over-Year +19 9% Year-over-Year
Data includes all single family, townhome, and condominium sales in the Bay Area sourced from MLS Listings The most recent month’s data is based on available numbers but may change with late reported activity Data from sources deemed reliable but may contain errors and are subject to revision


SqFt $4.2M Median Sale Price 18
$70.3M Total Volume


18 Average Days-on Market
$2.6M Median Sale Price
1 Closed Sale
$987 Average Price Per SqFt
$2.6M Total Volume


Jan2024Feb2024Mar2024Apr2024May2024Jun2024Jul2024Aug2024Sep2024Oct2024Nov2024Dec2024Jan2025


The market for Single Family Homes, Condo, and Townhomes units saw 556 closed sales at a median price of $1.5m. There was a total of 1,338 new listings with an average of 31 days on the market without price reduction and with an average price per square foot of $1,035.


January 2025
1,338
+52.4% Year-over-Year
Average Price Per SqFt
$1,035
+3 9% Year-over-Year
556
$1.5M Median Sale Price +7.8% Year-over-Year +4 1% Year-over-Year

31 $1B Total Volume +10.7% Year-over-Year +14 7% Year-over-Year

812
New Listings

25
Average Days-on-Market
$1.8M
Median Sale Price
376 Closed Sales
$1,147
Average Price Per SqFt
$836M
Total Volume
Data includes all single family, townhome, and condominium sales in the Bay Area sourced from MLS Listings. The most recent month’s data is based on available numbers but may change with late reported activity. Data from sources deemed reliable but may contain errors and are subject to revision.


526 New Listings
43 Average Days-on Market
$917K Median Sale Price
180 Closed Sales
$801 Average Price Per SqFt
$188.6M Total Volume



What's in
The market for Single Family Homes, Condo, and Townhomes units saw 16 closed sales at a median price of $2.3m. There was a total of 32 new listings with an average of 27 days on the market without price reduction and with an average price per square foot of $921.


32
16
January 2025 Data includes all single family, townhome, and condominium sales in the Bay Area sourced from MLS Listings The most recent month’s data is based on available numbers but may change with late reported activity Data from sources deemed reliable but may contain errors and are subject to revision
$921 Average Price Per SqFt
+45.5% Year-over-Year -4 8% Year-over-Year
$2.3M Median Sale Price +23.1% Year-over-Year +13 9% Year-over-Year
27 $36.1M Total Volume +92.9% Year-over-Year +36 7% Year-over-Year


3
New Listings
44 Average Days-on Market
$1.3M Median Sale Price
2 Closed Sales
$836 Average Price Per SqFt
$2.6M Total Volume


Jan2024Feb2024Mar2024Apr2024May2024Jun2024Jul2024Aug2024Sep2024Oct2024Nov2024Dec2024Jan2025


What's
The market for Single Family Homes, Condo, and Townhomes units saw 41 closed sales at a median price of $1.4m. There was a total of 73 new listings with an average of 23 days on the market without price reduction and with an average price per square foot of $936.


January 2025
73
+37.7% Year-over-Year
41
Average Price Per SqFt
$936 New Listings
+12 9% Year-over-Year
Median Sale Price
$1.4M Closed Sales
+8 4% Year-over-Year
Average Days-on-Market
23
+51.9% Year-over-Year
+27.8% Year-over-Year
Total Volume
$55.5M
+59 6% Year-over-Year
Data includes all single family, townhome, and condominium sales in San Mateo County sourced from MLS Listings The most recent month’s data is based on available numbers, but may change with late reported activity Data from sources deemed reliable but may contain errors and are subject to revision


21 New Listings
32 Average Days-on Market
$600K Median Sale Price
7 Closed Sales
$678 Average Price Per SqFt
$4.5M Total Volume
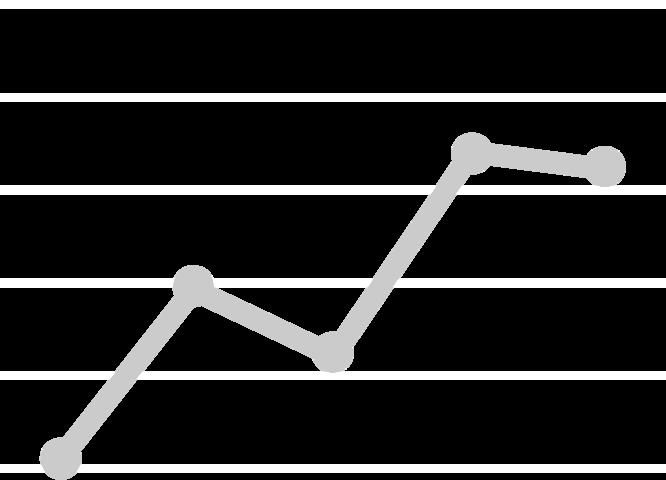
BY MONTH, YEAR-OVER-YEAR
(+$3,000,000 & Above)
Current Year
Previous Year
BY MONTH, YEAR-OVER-YEAR
(+$3,000,000 & Above)
Current Year
Previous Year



What's in the Campbell data?
The market for Single Family Homes, Condo, and Townhomes units saw 11 closed sales at a median price of $1.6m. There was a total of 26 new listings with an average of 21 days on the market without price reduction and with an average price per square foot of $1,155.


January 2025
26
+30% Year-over-Year
Average Price Per SqFt
$1,155
+0 4 Year-over-Year
11
$1.6M Median Sale Price +22.2% Year-over-Year -9 3% Year-over-Year
21
$19.8M Total Volume -47.5% Year-over-Year
+25% Year-over-Year
Data includes all single family, townhome, and condominium sales in the Bay Area sourced from MLS Listings The most recent month’s data is based on available numbers but may change with late reported activity Data from sources deemed reliable but may contain errors and are subject to revision New Listings


Listings

20 Average Days-on-Market
8 Closed Sales
$1,277
Average Price Per SqFt $2M
Median Sale Price
$16.6M
Total Volume
Data includes all single family, townhome, and condominium sales in the Bay Area sourced from MLS Listings. The most recent month’s data is based on available numbers but may change with late reported activity. Data from sources deemed reliable but may contain errors and are subject to revision.


13 New Listings
26 Average Days-on Market
$1.1M Median Sale Price
3 Closed Sales
$829 Average Price Per SqFt
$3.1M Total Volume



What's in the Cupertino data?
The market for Single Family Homes, Condo, and Townhomes units saw 16 closed sales at a median price of $2.6m. There was a total of 32 new listings with an average of 30 days on the market without price reduction and with an average price per square foot of $1,449.


January 2025
32
$1,449 Average Price Per SqFt -3% Year-over-Year -12 5% Year-over-Year
16
$2.6M Median Sale Price +6.7% Year-over-Year +25 7% Year-over-Year
30
$44.5M Total Volume +36.4% Year-over-Year
+22 8% Year-over-Year
Data includes all single family, townhome, and condominium sales in the Bay Area sourced from MLS Listings The most recent month’s data is based on available numbers but may change with late reported activity Data from sources deemed reliable but may contain errors and are subject to revision


Listings
20 Average Days-on-Market $1,646 Average Price Per SqFt $3.2M Median Sale Price 11 Closed Sales
$37.4M
Total Volume
Data includes all single family, townhome, and condominium sales in the Bay Area sourced from MLS Listings. The most recent month’s data is based on available numbers but may change with late reported activity. Data from sources deemed reliable but may contain errors and are subject to revision.


New Listings
5 Closed Sales
51 Average Days-on Market
$1.1M Median Sale Price
$1,017 Average Price Per SqFt
$7.1M Total Volume


What's in the Los Altos data?
The market for Single Family Homes, Condo, and Townhomes units saw 15 closed sales at a median price of $3.8m. There was a total of 35 new listings with an average of 34 days on the market without price reduction and with an average price per square foot of $1,604.


January 2025
35
15
105.9% Year-over-Year -3 8% Year-over-Year
$1,604 Average Price Per SqFt

$3.8M Median Sale Price +114.3% Year-over-Year -5% Year-over-Year
34
$57.4M Total Volume +47.8% Year-over-Year +128 9% Year-over-Year

18 New Listings

36 Average Days-on-Market
8 Closed Sales
$1,817
Average Price Per SqFt $5.4M
Median Sale Price
$45.1M
Total Volume
Data includes all single family, townhome, and condominium sales in the Bay Area sourced from MLS Listings. The most recent month’s data is based on available numbers but may change with late reported activity. Data from sources deemed reliable but may contain errors and are subject to revision.


33 Average Days-on Market
$1.2M Median Sale Price
$1,361 Average Price Per SqFt
7 Closed Sale $12.3M Total Volume


What's in the
The market for Single Family Homes, Condo, and Townhomes units saw 16 closed sales at a median price of $1.3m. There was a total of 29 new listings with an average of 31 days on the market without price reduction and with an average price per square foot of $777.


January 2025
29
$777 Average Price Per SqFt +52.6% Year-over-Year -4 8% Year-over-Year
16
$1.3M Median Sale Price +128.6% Year-over-Year +1% Year-over-Year
31
$20.6M Total Volume -27.9% Year-over-Year
+150 5% Year-over-Year
Data includes all single family, townhome, and condominium sales in the Bay Area sourced from MLS Listings The most recent month’s data is based on available numbers but may change with late reported activity Data from sources deemed reliable but may contain errors and are subject to revision


Sales

SqFt
$13.5M Total Volume
Data includes all single family, townhome, and condominium sales in the Bay Area sourced from MLS Listings. The most recent month’s data is based on available numbers but may change with late reported activity. Data from sources deemed reliable but may contain errors and are subject to revision.


49 Average Days-on Market
$1M Median Sale Price
7 Closed Sales
$698 Average Price Per SqFt
$7M Total Volume




What's in the Santa
The market for Single Family Homes, Condo, and Townhomes units saw 36 closed sales at a median price of $1.5m. There was a total of 94 new listings with an average of 29 days on the market without price reduction and with an average price per square foot of $1,140.


January 2025
New Listings
94
+135% Year-over-Year
Average Price Per SqFt
$1,140
+0 5% Year-over-Year
36
$1.5M Closed Sales Median Sale Price +71.4% Year-over-Year -1 4% Year-over-Year
+20.8% Year-over-Year
Total Volume
29 $56M Average Days-on-Market
+73% Year-over-Year
Data includes all single family, townhome, and condominium sales in the Bay Area sourced from MLS Listings The most recent month’s data is based on available numbers but may change with late reported activity Data from sources deemed reliable but may contain errors and are subject to revision


16 Average Days-on-Market
Average Price Per SqFt $1.7M Median Sale Price 24 Closed Sales
$45.6M
Total Volume
Data
Listings.


54 Average Days-on Market
$752K Median Sale Price
12 Closed Sales $10.4M Total Volume
$745 Average Price Per SqFt


What's in the South San Jose data?
The market for Single Family Homes, Condo, and Townhomes units saw 28 closed sales at a median price of $887k. There was a total of 44 new listings with an average of 40 days on the market without price reduction and with an average price per square foot of $688.


January 2025
44
+7.3% Year-over-Year
Average Price Per SqFt
$688 New Listings
+5 2% Year-over-Year
28
$887K Closed Sales Median Sale Price +7.7% Year-over-Year -11 6% Year-over-Year
Total Volume +37.9% Year-over-Year
40 $26.2M Average Days-on-Market
+6 6% Year-over-Year
Data includes all single family, townhome, and condominium sales in the Bay Area sourced from MLS Listings The most recent month’s data is based on available numbers but may change with late reported activity Data from sources deemed reliable but may contain errors and are subject to revision




46 Average Days-on Market
$692K Median Sale Price
16 Closed Sales $12.2M Total Volume
$622 Average Price Per SqFt





What's in the Sunnyvale data?
The market for Single Family Homes, Condo, and Townhomes units saw 22 closed sales at a median price of $1.7m. There was a total of 102 new listings with an average of 17 days on the market without price reduction and with an average price per square foot of $1,295.


January 2025
New Listings
102
+41.7% Year-over-Year
Average Price Per SqFt
$1,295
+4 9% Year-over-Year
22
$1.7M Closed Sales Median Sale Price -33.3% Year-over-Year -10 3% Year-over-Year
17
Total Volume -26% Year-over-Year
$42.5M Average Days-on-Market
-32% Year-over-Year
Data includes all single family, townhome, and condominium sales in the Bay Area sourced from MLS Listings The most recent month’s data is based on available numbers but may change with late reported activity Data from sources deemed reliable but may contain errors and are subject to revision


42 New Listings

8 Average Days-on-Market
10 Closed Sales
$1,664
Average Price Per SqFt $2.7M
Median Sale Price
$26.2M
Total Volume
Data includes all single family, townhome, and condominium sales in the Bay Area sourced from MLS Listings. The most recent month’s data is based on available numbers but may change with late reported activity. Data from sources deemed reliable but may contain errors and are subject to revision.


Listings
24 Average Days-on Market
$1.4M Median Sale Price
12 Closed Sales
$987 Average Price Per SqFt
$16.3M Total Volume


The market for Single Family Homes, Condo, and Townhomes units saw 23 closed sales at a median price of $1.8m. There was a total of 63 new listings with an average of 24 days on the market without price reduction and with an average price per square foot of $1,063.


January 2025
63
+53.7% Year-over-Year
Average Price Per SqFt
$1,063 New Listings
+5 3% Year-over-Year
23
$1.8M Closed Sales Median Sale Price -14.8% Year-over-Year -2 1% Year-over-Year
24
$47.8M Average Days-on-Market
Total Volume +14.3% Year-over-Year -4 2% Year-over-Year
Data includes all single family, townhome, and condominium sales in the Bay Area sourced from MLS Listings The most recent month’s data is based on available numbers but may change with late reported activity Data from sources deemed reliable but may contain errors and are subject to revision


42 New Listings

18 Average Days-on-Market
19 Closed Sales
$1,136
Average Price Per SqFt $1.9M
Median Sale Price
$43.5M
Total Volume
Data includes all single family, townhome, and condominium sales in the Bay Area sourced from MLS Listings. The most recent month’s data is based on available numbers but may change with late reported activity. Data from sources deemed reliable but may contain errors and are subject to revision.


New Listings
51 Average Days-on Market
$1.1M Median Sale Price
4 Closed Sales
$717 Average Price Per SqFt
$4.2M Total Volume

Being an independently owned and operated franchise of Keller Williams, KW Bay Area Estates has the position as the Bay Area’s foremost luxury real estate services firm with the execution of best-in-class customer service. KWBAE’s unparalleled team consists of more than 250 associates and professionals strategically located in Los Gatos and Saratoga. Under the same ownership, we have our division of KW South Bay Commercial.
With uncompromising principles, KW Bay Area Estates has established a new standard of excellence within the industry. The company’s growth has been strategic and exciting. Since its inception, the team has successfully represented more than 9,000 transactions, totaling more than $12 billion in total sales.
Dedicated to upholding unparalleled standards for integrity and client care, they strive to create a culture where agents thrive while developing their own businesses to their maximum potential. KW Bay Area Estates has given their agents over $2.6 million in profit share.


