


Copyright by KW Advisors 2024 May 2024
Peninsula Estates
San Francisco County
Jump to San Francisco County Report
San Mateo County
Jump to San Mateo County Report
Belmont
Jump to Belmont Report
Burlingame
Jump to Burlingame Report
Daly City
Jump to Daly City Report
Foster City
Jump to Foster City Report
Half Moon Bay
Jump to Half Moon Bay Report
Hillsborough
Jump to Hillsborough Report
Jump to Millbrae Report Millbrae
Jump to Pacifica Report
Pacifica
San Bruno
Jump to San Bruno Report
San Carlos
Jump to San Carlos Report
San Mateo
Jump to San Mateo Report

South San Francisco
Jump to South San Francisco Report
What’syourhome reallyworthin today’smarket?
That's the question you should be asking yourself.
Our market is incredibly diverse and rapidly changing. Values vary not just by neighborhood but by street. Your home isn't necessarily worth what your neighbors' home is. It's the current market that sets the value of your home.
So, do you know what your home is worth in today's market?
Wecanhelp...
Contact us for a confidential, no obligation assessment of your home's value.


WhatIsGoingonwith MortgageRates?

You may have heard mortgage rates are going to stay a bit higher for longer than originally expected. And if you’re wondering why, the answer lies in the latest economic data. Here’s a quick overview of what’s happening with mortgage rates and what experts say is ahead.
Economic Factors That Impact Mortgage Rates
When it comes to mortgage rates, things like the job market, the pace of inflation, consumer spending, geopolitical uncertainty, and more all have an impact. Another factor at play is the Federal Reserve (the Fed) and its decisions on monetary policy. And that’s what you may be hearing a lot about right now. Here’s why.
The Fed decided to start raising the Federal Funds Rate to try to slow down the economy (and inflation) in early 2022. That rate impacts how much it costs banks to borrow money from each other. It doesn’t determine mortgage rates, but mortgage rates do respond when this happens. And that’s when mortgage rates started to really climb.


Get instant pre-approval and FAST closing -plus a dedicated loan advisor -- for the ultimate mortgage journey. The Customer-Centric Mortgage
The Simplest Mortgage Approval Ever
Buying a home should be painless. Find your financing right here! Contact me, your Real Estate Expert, for support and to learn more about REMA. Get Pre-Approved Online In Minutes without affecting your credit score! Our Fast Digital Loan Process... Get pre-approved online in minutes! Your personal Finance Manager is there to help! Your Finance Manager sources a vast array of wholesale & retail lenders for your best rate. Your Finance Manager does the heavy lifting. So you get to funding quickly & easily. Get Fast Loan Pre-Approval Find A Great Rate Quickly Stop Worrying Your Personal "Easy" button A Dedicated Loan Advisor... Let our financial tools work hard for you. We gather the largest array of wholesale & retail lenders to compete for your loan! So you get the lowest rate while we do the work. Enjoy our silky smooth platform, along with passionate, live support from your dedicated Finance Manager. Mortgage expertise at every step! You work hard for your money.

PROTECT
WHAT YOU DON’T EXPECT
You can’t always see a breakdown coming, but you can plan for it with American Home Shield. Our home service plans help fix or replace covered home systems and appliances, and help you stay on budget. Protect what you don’t expect.

CLICK HERE TO WATCH THE VIDEO
Contact me, your Real Estate Expert, for support and to learn more about AHS. READY TO GET STARTED?

Looking to lighten the mood in your laundry room?
EIGHTEYECATCHING
Laundry Room Colors
To Look Out For

These refreshing colors make the wash-and-dry chore a little more pleasant.
Tranquil Blue
View it here
Sage Green
View it here
Eight Colrs fo Laundry
White
View it here
Yellow
View it here
Gray
View it here
Dusty Pink
View it here
View it here
Navy Blue Purple
View it here
Create a tranquil laundry space with Benjamin Moore's Beach Glass Its light blue shade, coupled with a subtle gray undertone, offers a clean and versatile aesthetic that avoids any baby nursery associations.
Transform your space with earthy tones like October Mist and Gloucester Sage from Benjamin Moore. Test out the trendy sage in your laundry room for a lowcommitment update easy to change and customize, ensuring lasting satisfaction with your design choice.
Create an elegant laundry room with Chantilly Lace by Benjamin Moore The classic white choice adds sophistication, opens up the space, and simplifies stain detection.
Elevate your laundry space with the energizing touch of yellow. Behr's Roasted Corn or Upbeat bring warmth and optimism, while Pearly White offers a mellow option a yellow-based white that brings a perfect harmony of vibrancy and calmness
Gray remains a top choice for laundry room walls, providing a timeless and serene backdrop A soft gray for a whisper of sophistication, easily personalized with printed patterned tile flooring or Behr's bold 2024 Color of the Year, Cracked Pepper.
Sherwin-Williams' Rosebud for a touch of romance in laundry rooms. The dusty pink hue, paired with gold accents, adds a luxurious and warm atmosphere
Navy as the key to a striking laundry room. Beyond lighter blues, navy paired with lighter accents or white fixtures, especially Benjamin Moore's Hale Navy, creates a bold choice that makes the laundry room stand out.
Dare to take a style risk in your laundry room with a pop of color Opt for the subtle smoky lavender of Farrow & Ball's Peignoir for a neutral touch or go all-out glam with Backdrop's dark and vampy McQueen, drawing inspiration from the famous fashion designer.
Source : https://www familyhandyman com/list/laundry-room-colors/
Want to know how Home Concierge can help with your listing? Contact me today!


Want to know how Acton ADU can help add an Accessory Dwelling Unit to your property to increase its value? Contact me today! YOUR TRUSTED ADU BUILDERS IN CALIFORNIA Bringing Families Closer with Custom Living Spaces for Over 30 Years! See Our 5-Star Reviews!
Be amazed at your property’s potential. Our experts use advanced 3D visualization and 3D model building to turn your ideas into tangible ADU plans
BEAUTIFUL PERSONALIZED AND
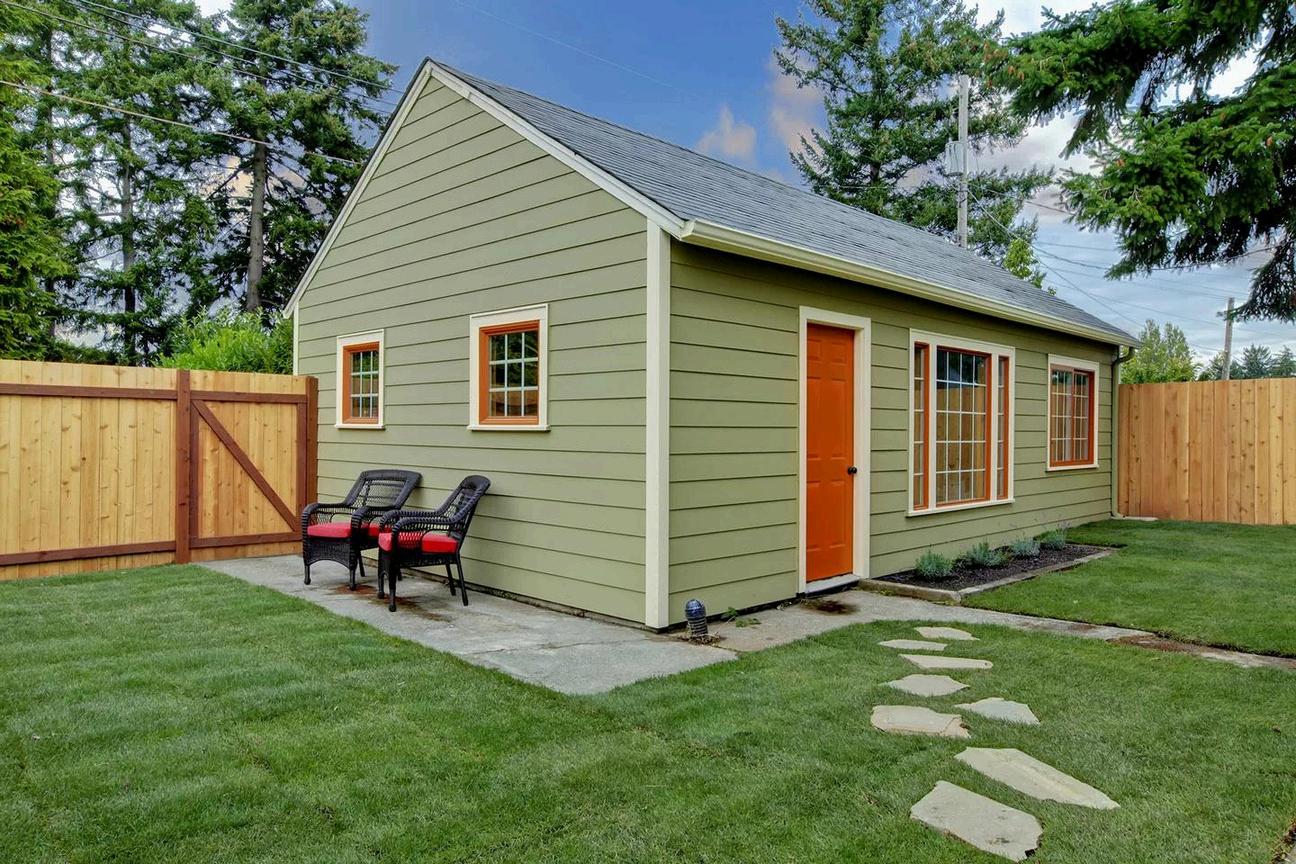
Leave the paperwork to us. Acton ADU simplifies the permitting process, allowing you to focus on what matters most while we handle the details
With 30+ years of craftsmanship behind our belts, our skilled team creates your dream ADU – tailored to your family’s needs and designed for modern living
ACTONADULICENSENUMBER:#638333

VENDOR DIRECTORY
When it comes to home ownership, knowing who you can trust is crucial. That's why we've curated a select list of trusted vendors who are ready to help with your home goals.


CLICK HERE CLICK HERE
for your mortgage needs for your home warranty needs


HERE for your home renovation needs for your insurance needs for
CLICK
CLICK HERE CLICK
your all-in-one solution to ADUs (Accessory Dwelling Units)
HERE
San Francisco County
What's in the San Francisco County data?
There were 292 single-family homes for sale, providing 1.3 months of inventory. There were 291 new listings, and 220 homes sold at a median price of $1.7m. The median overbid percentage was at 113.4%, with an average of 22 days on the market.
There were 677 condo and townhome units for sale, providing 3.1 months of inventory. There were 355 new listings and 217 units sold at a median sale price of $1.1m. The median overbid percentage was at 101.8%, with an average of 51 days on the market.

SFH
Single-Family Homes
291 New Listings
220 Sold Listings
1.3 Months of Inventory
$1.7M
Median Sale Price
113.4%
Median Sale vs List
22 Avg Days on Market
The data, sourced from MLS Listings Inc, includes all single-family homes, condos and townhomes in the California Area from April 2023 to April 2024. This may include preliminary data, and may vary from the time the data was gathered. All data is deemed reliable but not guaranteed. DRE# 01906450. Copyright KW Advisors Peninsula Estates | Burlingame | San Mateo 2024. Each office is independently owned and operated.
New Listings
3.1
Months of Inventory
101.8%
Median Sale vs List

C
355
Condo
County , y y ISTINGS 3 Jan2024 Feb2024 Mar2024 Apr2024 3 Jan2024 Feb2024 Mar2024 Apr2024
Median SalesPrice
Single-Family Homes
The median sale price has increased from $1 5m last April 2023, to $1 7m as of April 2024
Condos & Townhomes
The median sale price has decreased from $1 19m last April 2023, to $1 13m as of April 2024
AVGDays OntheMarket
Single-Family Homes
The average time spent on the market went down from 30 days last April 2023, to 22 days as of April 2024
Condos & Townhomes
The average time spent on the market went down from 54 days in April 2023, to 51 days as of April 2024.
Overbids
Single-Family Homes
The overbid percentage has increased from 106 9% last April 2023, to 113 4% a year later
Condos & Townhomes
The overbid percentage has increased from 99.9% last April 2023, to 101.8% a year later.
Back to Table of Contents $0 $500,000 $1,000,000 $1,500,000 $2,000,000 Apr2023May2023 Jun2023 Jul2023Aug2023Sep2023Oct2023Nov2023Dec2023 Jan2024Feb2024Mar2024Apr2024 0 20 40 60 80 Apr2023May2023 Jun2023 Jul2023Aug2023Sep2023 Oct2023Nov2023Dec2023 Jan2024 Feb2024Mar2024 Apr2024 000% 2000% 4000% 6000% 8000% 10000% 12000% Apr2023May2023 Jun2023 Jul2023Aug2023Sep2023 Oct2023Nov2023Dec2023 Jan2024 Feb2024Mar2024Apr2024

SanMateo County
What's in the San Mateo County data?
There were 493 single-family homes for sale, providing 1.5 months of inventory. There were 506 new listings, and 333 homes sold at a median price of $2m. The median overbid percentage was at 107 2%, with an average of 18 days on the market.
There were 223 condo and townhome units for sale, providing 2.2 months of inventory. There were 169 new listings and 102 units sold at a median sale price of $952k. The median overbid percentage was at 103.1%, with an average of 23 days on the market

SFH
Single-Family Homes
506 New Listings
333 Sold Listings
1.5 Months of Inventory
$2M Median Sale Price
107.2%
Median Sale vs List
18 Avg Days on Market
The data, sourced from MLS Listings Inc, includes all single-family homes, condos and townhomes in the California Area from April 2023 to April 2024. This may include preliminary data, and may vary from the time the data was gathered. All data is deemed reliable but not guaranteed. DRE# 01906450. Copyright KW Advisors Peninsula Estates | Burlingame | San Mateo 2024. Each office is independently owned and operated.
Condo & Townhomes
169
New Listings
102
Sold Listings
2.2
Months of Inventory
$952K
Median Sale Price
103.1%
Median Sale vs List
23 Avg Days on Market

CONDO
SanMateoCounty
APRIL 2023 - APRIL 2024
LISTINGS FOR SALE SOLD LISTINGS
Single-Family Homes
Last 12 months, year-over-year.
Condos & Townhomes
Last 12 months, year-over-year
0 100 200 300 400 500 600 Apr2023 May2023 Jun2023 Jul2023 Aug2023 Sep2023 Oct2023 Nov2023 Dec2023 Jan2024 Feb2024 Mar2024 Apr2024 0 50 100 150 200 250 Apr2023 May2023 Jun2023 Jul2023 Aug2023 Sep2023 Oct2023 Nov2023 Dec2023 Jan2024 Feb2024 Mar2024 Apr2024
Median SalesPrice
Single-Family Homes
The median sale price has increased from $1 8m last April 2023, to $2m as of April 2024
Condos & Townhomes
The median sale price has increased from $857k last April 2023, to $952k as of April 2024
AVGDays OntheMarket
Single-Family Homes
The average time spent on the market went down from 23 days last April 2023, to 18 days as of April 2024
Condos & Townhomes
The average time spent on the market went down from 33 days in April 2023, to 23 days as of April 2024.
Overbids
Single-Family Homes
The overbid percentage has increased from 102 8% last April 2023, to 107 2% a year later
Condos & Townhomes
The overbid percentage has increased from 101.8% last April 2023, to 103.1% a year later.
Back to Table of Contents $0 $500,000 $1,000,000 $1,500,000 $2,000,000 $2,500,000 Apr2023May2023 Jun2023 Jul2023Aug2023Sep2023Oct2023Nov2023Dec2023 Jan2024Feb2024Mar2024Apr2024 0 10 20 30 40 50 60 70 Apr2023May2023 Jun2023 Jul2023Aug2023Sep2023 Oct2023Nov2023Dec2023 Jan2024 Feb2024Mar2024 Apr2024 000% 2000% 4000% 6000% 8000% 10000% 12000% Apr2023May2023 Jun2023 Jul2023Aug2023Sep2023 Oct2023Nov2023Dec2023 Jan2024 Feb2024Mar2024Apr2024

Belmon
What's in the Belm
There were 11 single-family h providing 0.5 months of inve new listings, and 19 homes s of $2.3m. The median overbi 110.8%, with an average of 1
There were 7 condo and tow providing 1.4 months of inve new listings and 5 units sold price of $1.1m. The median o was at 101.2%, with an avera market.
single-family homes, condos and 2024. This may include gathered. All data is deemed Advisors Peninsula Estates | Burlingame | San Mateo 2024. Each office is independently owned and operated.
Price
3M
s Market

10
Mon
Me
LISTINGS 2023 Jan2024 Feb2024 Mar2024 Apr2024 2023 Jan2024 Feb2024 Mar2024 Apr2024
Median SalesPrice
Single-Family Homes
The median sale price has decreased from $2 4m last April 2023, to $2 3m as of April 2024
Condos & Townhomes
The median sale price has decreased from $1 3m last April 2023, to $1 1m as of April 2024
AVGDays OntheMarket
Single-Family Homes
The average time spent on the market went down from 24 days last April 2023, to 18 days as of April 2024
Condos & Townhomes
The average time spent on the market went up from 15 days in April 2023, to 34 days as of April 2024.
Overbids
Single-Family Homes
The overbid percentage has increased from 102 2% last April 2023, to 110 8% a year later
Condos & Townhomes
The overbid percentage has decreased from 103.5% last April 2023, to 101.2% a year later.
Back to Table of Contents $0 $500,000 $1,000,000 $1,500,000 $2,000,000 $2,500,000 $3,000,000 Apr2023May2023 Jun2023 Jul2023Aug2023Sep2023Oct2023Nov2023Dec2023 Jan2024Feb2024Mar2024Apr2024 0 20 40 60 80 100 120 140 Apr2023May2023 Jun2023 Jul2023Aug2023Sep2023 Oct2023Nov2023Dec2023 Jan2024 Feb2024Mar2024 Apr2024 000% 2000% 4000% 6000% 8000% 10000% 12000% Apr2023May2023 Jun2023 Jul2023Aug2023Sep2023 Oct2023Nov2023Dec2023 Jan2024 Feb2024Mar2024Apr2024

Burling
What's in the Burli
There were 24 single-family h providing 1.8 months of inve new listings, and 13 homes s of $2.6m. The median overbi 103.8%, with an average of 1
There were 6 condo and tow providing 1.2 months of inve new listings and 5 units sold price of $1m. The median ov at 101.2%, with an average o market.

single-family homes, condos and 2024. This may include gathered. All data is deemed Advisors Peninsula Estates | Burlingame | San Mateo 2024. Each office is independently owned and operated. 6M
Price s Market
Condo & Townhomes
7
New Listings
5 Sold Listings
1.2
Months of Inventory
$1M
Median Sale Price
101.2%
Median Sale vs List
15 Avg Days on Market

CONDO
APRIL 2023 - APRIL 2024
TINGS FOR SALE SOLD LISTINGS
Family Homes
2 months, year-over-year.
s & Townhomes
2 months, year-over-year
urlingame
May2023 Jun2023 Jul2023 Aug2023 Sep2023 Oct2023 Nov2023 Dec2023 Jan2024 Feb2024 Mar2024 Apr2024 May2023 Jun2023 Jul2023 Aug2023 Sep2023 Oct2023 Nov2023 Dec2023 Jan2024 Feb2024 Mar2024 Apr2024
Median SalesPrice
Single-Family Homes
The median sale price has decreased from $2 9m last April 2023, to $2 6m as of April 2024
Condos & Townhomes
The median sale price has decreased from $1 4m last April 2023, to $1m as of April 2024
AVGDays OntheMarket
Single-Family Homes
The average time spent on the market went down from 32 days last April 2023, to 15 days as of April 2024
Condos & Townhomes
The average time spent on the market went down from 32 days in April 2023, to 15 days as of April 2024.
Overbids
Single-Family Homes
The overbid percentage has increased from 100 8% last April 2023, to 103 8% a year later
Condos & Townhomes
The overbid percentage has increased from 100% last April 2023, to 101.2% a year later.
Back to Table of Contents $0 $500,000 $1,000,000 $1,500,000
Apr2023May2023 Jun2023 Jul2023Aug2023Sep2023Oct2023Nov2023Dec2023 Jan2024Feb2024Mar2024Apr2024 0 10 20 30 40 50 60 Apr2023May2023 Jun2023 Jul2023Aug2023Sep2023 Oct2023Nov2023Dec2023 Jan2024 Feb2024Mar2024 Apr2024 000% 2000% 4000% 6000% 8000% 10000% 12000% Apr2023May2023 Jun2023 Jul2023Aug2023Sep2023 Oct2023Nov2023Dec2023 Jan2024 Feb2024Mar2024Apr2024
$2,000,000 $2,500,000 $3,000,000 $3,500,000

DalyCity
What's in the Daly City data?
There were 32 single-family homes for sale, providing 1.4 months of inventory. There wer new listings, and 23 homes sold at a median of $1.2m. The median overbid percentage wa 110.8%, with an average of 16 days on the m
There were 14 condo and townhome units fo sale, providing 1.4 months of inventory. Ther were 11 new listings and 10 units sold at a m sale price of $689k. The median overbid percentage was at 102.6%, with an average o days on the market.

11
New Listings
10
Sold Listings
1.4
Months of Inventory
$689K
Median Sale Price
102.6%
Median Sale vs List
28 Avg Days on Market

CONDO
Condo & Townhomes
DalyCity
APRIL 2023 - APRIL 2024
Single-Family Homes
Last 12 months, year-over-year.
Condos & Townhomes
Last 12 months, year-over-year
LISTINGS
SOLD LISTINGS
10 20 30 40 Apr2023 May2023 Jun2023 Jul2023 Aug2023 Sep2023 Oct2023 Nov2023 Dec2023 Jan2024 Feb2024 Mar2024 Apr2024 0 5 10 15 20 25 30 Apr2023 May2023 Jun2023 Jul2023 Aug2023 Sep2023 Oct2023 Nov2023 Dec2023 Jan2024 Feb2024 Mar2024 Apr2024
FOR SALE
0
Median SalesPrice
Single-Family Homes
The median sale price has increased from $1 1m last April 2023, to $1 2m as of April 2024
Condos & Townhomes
The median sale price has increased from $557k last April 2023, to $689k as of April 2024
AVGDays OntheMarket
Single-Family Homes
The average time spent on the market went down from 22 days last April 2023, to 16 days as of April 2024
Condos & Townhomes
The average time spent on the market went up from 24 days in April 2023, to 28 days as of April 2024.
Overbids
Single-Family Homes
The overbid percentage has increased from 105 7% last April 2023, to 110 8% a year later
Condos & Townhomes
The overbid percentage has increased from 101.3% last April 2023, to 102.6% a year later.
Back to Table of Contents $0 $200,000 $400,000 $600,000 $800,000 $1,000,000 $1,200,000 $1,400,000 Apr2023May2023 Jun2023 Jul2023Aug2023Sep2023Oct2023Nov2023Dec2023 Jan2024Feb2024Mar2024Apr2024 0 10 20 30 40 50 60 Apr2023May2023 Jun2023 Jul2023Aug2023Sep2023 Oct2023Nov2023Dec2023 Jan2024 Feb2024Mar2024 Apr2024 000% 2000% 4000% 6000% 8000% 10000% 12000% Apr2023May2023 Jun2023 Jul2023Aug2023Sep2023 Oct2023Nov2023Dec2023 Jan2024 Feb2024Mar2024Apr2024

FosterCity
What's in the Foster City data?
There were 9 single-family homes for sale, providing 0.7 months of inventory. There were 21 new listings, and 13 homes sold at a median price of $2.3m. The median overbid percentage was at 105.6%, with an average of 13 days on the market.
There were 18 condo and townhome units for sale, providing 4.5 months of inventory. There were 21 new listings and 4 units sold at a median sale price of $1.5m. The median overbid percentage was at 107.4%, with an average of 8 days on the market.

Single-Family Homes
21 ew Listings
13 Sold Listings
0.7 Months of Inventory
$2.3M Median Sale Price
105.6%
Median Sale vs List
13 Avg Days on Market
The data, sourced from MLS Listings Inc, includes all single-family homes, condos and townhomes in the California Area from April 2023 to April 2024. This may include preliminary data, and may vary from the time the data was gathered. All data is deemed reliable but not guaranteed. DRE# 01906450. Copyright KW Advisors Peninsula Estates | Burlingame | San Mateo 2024. Each office is independently owned and operated.
SFH
Condo & Townhomes
21
New Listings
4 Sold Listings
4.5
Months of Inventory
$1.5M
Median Sale Price
107.4%
Median Sale vs List
8 Avg Days on Market

CONDO
FosterCity
year-over-year.
LISTINGS FOR SALE SOLD LISTINGS 0 2 4 6 8 10 12 14 Apr2023 May2023 Jun2023 Jul2023 Aug2023 Sep2023 Oct2023 Nov2023 Dec2023 Jan2024 Feb2024 Mar2024 Apr2024 0 5 10 15 20 25 30 Apr2023 May2023 Jun2023 Jul2023 Aug2023 Sep2023 Oct2023 Nov2023 Dec2023 Jan2024 Feb2024 Mar2024 Apr2024
APRIL 2023 - APRIL 2024 Single-Family Homes Last 12 months,
Condos & Townhomes Last 12 months, year-over-year
Median SalesPrice
Single-Family Homes
The median sale price has decreased from $2 4m last April 2023, to $2 3m as of April 2024
Condos & Townhomes
The median sale price has increased from $1m last April 2023, to $1 5m as of April 2024
AVGDays OntheMarket
Single-Family Homes
The average time spent on the market went up from 9 days last April 2023, to 13 days as of April 2024
Condos & Townhomes
The average time spent on the market went down from 13 days in April 2023, to 8 days as of April 2024.
Overbids
Single-Family Homes
The overbid percentage has increased from 103 5% last April 2023, to 105 6% a year later
Condos & Townhomes
The overbid percentage has increased from 103.6% last April 2023, to 107.4% a year later.
Back to Table of Contents $0 $500,000 $1,000,000 $1,500,000 $2,000,000 $2,500,000 $3,000,000 Apr2023May2023 Jun2023 Jul2023Aug2023Sep2023Oct2023Nov2023Dec2023 Jan2024Feb2024Mar2024Apr2024 0 10 20 30 40 50 Apr2023May2023 Jun2023 Jul2023Aug2023Sep2023 Oct2023Nov2023Dec2023 Jan2024 Feb2024Mar2024 Apr2024 000% 2000% 4000% 6000% 8000% 10000% 12000% Apr2023May2023 Jun2023 Jul2023Aug2023Sep2023 Oct2023Nov2023Dec2023 Jan2024 Feb2024Mar2024Apr2024

HalfMoon Bay
What's in the Half Moon Bay data?
There were 29 single-family homes for sale, providing 5.8 months of inventory. There were 13 new listings, and 5 homes sold at a median price of $1.8m. The median overbid percentage was at 97%, with an average of 94 days on the market
There were 0 condo and townhome units for sale, providing 0 months of inventory. There were 3 new listings and 2 units sold at a median sale price of $775k. The median overbid percentage was at 103.2%, with an average of 17 days on the market.

Single-Family Homes
13 New Listings
5 Sold Listings
5.8 Months of Inventory
$1.8M Median Sale Price
97%
Median Sale vs List
94 Avg Days on Market
The data, sourced from MLS Listings Inc, includes all single-family homes, condos and townhomes in the California Area from April 2023 to April 2024. This may include preliminary data, and may vary from the time the data was gathered. All data is deemed reliable but not guaranteed. DRE# 01906450. Copyright KW Advisors Peninsula Estates | Burlingame | San Mateo 2024. Each office is independently owned and operated.
SFH
Condo & Townhomes
3
New Listings
2 Sold Listings
0 Months of Inventory
$775K
Median Sale Price
103.2%
Median Sale vs List
17 Avg Days on Market

CONDO
HalfMoonBay
APRIL 2023 - APRIL 2024
Single-Family Homes
Last 12 months, year-over-year.
Condos & Townhomes
Last 12 months, year-over-year
LISTINGS
SOLD LISTINGS 0 5 10 15 20 25 30 Apr2023 May2023 Jun2023 Jul2023 Aug2023 Sep2023 Oct2023 Nov2023 Dec2023 Jan2024 Feb2024 Mar2024 Apr2024 0 1 2 3 4 Apr2023 May2023 Jun2023 Jul2023 Aug2023 Sep2023 Oct2023 Nov2023 Dec2023 Jan2024 Feb2024 Mar2024 Apr2024
FOR SALE
Median SalesPrice
Single-Family Homes
The median sale price has increased from $1 6m last April 2023, to $1 8m as of April 2024
Condos & Townhomes
The median sale price has increased from $0 last April 2023, to $775k as of April 2024
AVGDays OntheMarket
Single-Family Homes
The average time spent on the market went up from 53 days last April 2023, to 94 days as of April 2024
Condos & Townhomes
The average time spent on the market went up from 0 days in April 2023, to 17 days as of April 2024.
Overbids
Single-Family Homes
The overbid percentage has decreased from 99% last April 2023, to 97% a year later
Condos & Townhomes
The overbid percentage has increased from 0% last April 2023, to 103.2% a year later.
Back to Table of Contents $0 $500,000 $1,000,000 $1,500,000 $2,000,000 $2,500,000 $3,000,000 Apr2023May2023 Jun2023 Jul2023Aug2023Sep2023Oct2023Nov2023Dec2023 Jan2024Feb2024Mar2024Apr2024 0 20 40 60 80 100 Apr2023May2023 Jun2023 Jul2023Aug2023Sep2023 Oct2023Nov2023Dec2023 Jan2024 Feb2024Mar2024 Apr2024 000% 2000% 4000% 6000% 8000% 10000% 12000% 14000% Apr2023May2023 Jun2023 Jul2023Aug2023Sep2023 Oct2023Nov2023Dec2023 Jan2024 Feb2024Mar2024Apr2024

Hillsborough
What's in the Hillsborough data?
There were 33 single-family homes for sale, providing 4.1 months of inventory. There were 17 new listings, and 8 homes sold at a median price of $5.9m. The median overbid percentage was at 100%, with an average of 22 days on the market.
There was no data for condo and townhouse units for this month.

Single-Family Homes
17 New Listings
8 Sold Listings
4.1 Months of Inventory
$5.9M Median Sale Price
100%
Median Sale vs List
22 Avg Days on Market
The data, sourced from MLS Listings Inc, includes all single-family homes, condos and townhomes in the California Area from April 2023 to April 2024. This may include preliminary data, and may vary from the time the data was gathered. All data is deemed reliable but not guaranteed. DRE# 01906450. Copyright KW Advisors Peninsula Estates | Burlingame | San Mateo 2024. Each office is independently owned and operated.
SFH
CONDO
Condo & Townhomes
No data for this month.

illsborough
APRIL 2023 - APRIL 2024
TINGS FOR SALE SOLD LISTINGS
Family Homes
2 months, year-over-year.
No data for this month.
s & Townhomes
2 months, year-over-year
May2023 Jun2023 Jul2023 Aug2023 Sep2023 Oct2023 Nov2023 Dec2023 Jan2024 Feb2024 Mar2024 Apr2024 May2023 Jun2023 Jul2023 Aug2023 Sep2023 Oct2023 Nov2023 Dec2023 Jan2024 Feb2024 Mar2024 Apr2024
Median SalesPrice
Single-Family Homes
The median sale price has increased from $5 2m last April 2023, to $5 9m as of April 2024
Condos & Townhomes
No data for this month
$7,000,000
$5,000,000 $6,000,000
AVGDays OntheMarket
Single-Family Homes
The average time spent on the market went up from 11 days last April 2023, to 22 days as of April 2024
Condos & Townhomes
No data for this month
Overbids
Single-Family Homes
The overbid percentage has increased from 99 5% last April 2023, to 100% a year later
Condos & Townhomes
No data for this month
Back to Table of Contents $0
$1,000,000 $2,000,000 $3,000,000 $4,000,000
Apr2023May2023 Jun2023 Jul2023Aug2023Sep2023Oct2023Nov2023Dec2023 Jan2024Feb2024Mar2024Apr2024 0 20 40 60 80 100 120 Apr2023May2023 Jun2023 Jul2023Aug2023Sep2023 Oct2023Nov2023Dec2023 Jan2024 Feb2024Mar2024 Apr2024 000% 2000% 4000% 6000% 8000% 10000% 12000% Apr2023May2023 Jun2023 Jul2023Aug2023Sep2023 Oct2023Nov2023Dec2023 Jan2024
Feb2024Mar2024Apr2024

Millbra
What's in the Millb
There were 5 single-family ho providing 0.3 months of inve new listings, and 19 homes s of $2.3m. The median overbi 110.9%, with an average of 1
There were 2 condo and tow providing 1 month of invento listings and 2 units sold at a $1.2m. The median overbid p 98.5%, with an average of 66

single-family homes, condos and 2024. This may include gathered. All data is deemed Advisors Peninsula Estates | Burlingame | San Mateo 2024. Each office is independently owned and operated.
3M Price s Market
Condo & Townhomes
2
New Listings
2 Sold Listings
1 Month of Inventory $1.2M
Median Sale Price 98.5%
Median Sale vs List 66 Avg Days on Market

CONDO
APRIL 2023 - APRIL 2024
Single-Family Homes
Last 12 months, year-over-year.
Condos & Townhomes
Last 12 months, year-over-year
Millbrae
SOLD LISTINGS 0 5 10 15 20 Apr2023 May2023 Jun2023 Jul2023 Aug2023 Sep2023 Oct2023 Nov2023 Dec2023 Jan2024 Feb2024 Mar2024 Apr2024 0 1 2 3 4 5 6 Apr2023 May2023 Jun2023 Jul2023 Aug2023 Sep2023 Oct2023 Nov2023 Dec2023 Jan2024 Feb2024 Mar2024 Apr2024
LISTINGS FOR SALE
Median SalesPrice
Single-Family Homes
The median sale price has increased from $2m last April 2023, to $2 3m as of April 2024
Condos & Townhomes
The median sale price has increased from $0 last April 2023, to $1 2m as of April 2024
AVGDays OntheMarket
Single-Family Homes
The average time spent on the market went up from 10 days last April 2023, to 13 days as of April 2024
Condos & Townhomes
The average time spent on the market went up from 0 days in April 2023, to 66 days as of April 2024.
Overbids
Single-Family Homes
The overbid percentage has increased from 104 7% last April 2023, to 110 9% a year later
Condos & Townhomes
The overbid percentage has increased from 0% last April 2023, to 98.5% a year later.
Back to Table of Contents $0 $500,000 $1,000,000 $1,500,000 $2,000,000 $2,500,000 Apr2023May2023 Jun2023 Jul2023Aug2023Sep2023Oct2023Nov2023Dec2023 Jan2024Feb2024Mar2024Apr2024 0 20 40 60 80 100 Apr2023May2023 Jun2023 Jul2023Aug2023Sep2023 Oct2023Nov2023Dec2023 Jan2024 Feb2024Mar2024 Apr2024 000% 2000% 4000% 6000% 8000% 10000% 12000% Apr2023May2023 Jun2023 Jul2023Aug2023Sep2023 Oct2023Nov2023Dec2023 Jan2024 Feb2024Mar2024Apr2024

Paci
What's in t
There were 25 s providing 1.6 mo new listings, and of $1.2m. The m 106.3%, with an There were 10 c sale, providing 3 were 8 new listin sale price of $90 percentage was days on the mar

Median S

Ne
100.
Months of
y y
Apr2024 Apr2024
Median SalesPrice
Single-Family Homes
The median sale price has increased from $1 27m last April 2023, to $1 28m as of April 2024
Condos & Townhomes
The median sale price has increased from $782k last April 2023, to $900k as of April 2024
AVGDays OntheMarket
Single-Family Homes
The average time spent on the market went down from 19 days last April 2023, to 17 days as of April 2024
Condos & Townhomes
The average time spent on the market went up from 9 days in April 2023, to 130 days as of April 2024.
Overbids
Single-Family Homes
The overbid percentage has remained the same from 106 3% last April 2023, to 106 3% a year later
Condos & Townhomes
The overbid percentage has decreased from 107% last April 2023, to 100.5% a year later.
Back to Table of Contents $0 $500,000 $1,000,000 $1,500,000 $2,000,000 Apr2023May2023 Jun2023 Jul2023Aug2023Sep2023Oct2023Nov2023Dec2023 Jan2024Feb2024Mar2024Apr2024 0 20 40 60 80 100 120 140 Apr2023May2023 Jun2023 Jul2023Aug2023Sep2023 Oct2023Nov2023Dec2023 Jan2024 Feb2024Mar2024 Apr2024 000% 2000% 4000% 6000% 8000% 10000% 12000% Apr2023May2023 Jun2023 Jul2023Aug2023Sep2023 Oct2023Nov2023Dec2023 Jan2024 Feb2024Mar2024Apr2024

SanBru
What's in the San
There were 12 single-family h providing 0.8 months of inve new listings, and 16 homes s of $1.5m. The median overbi 107.1%, with an average of 1
There were 15 condo and tow sale, providing 2.5 months of were 8 new listings and 6 un sale price of $479k. The med percentage was at 99.2%, wi days on the market.

single-family homes, condos and 2024. This may include gathered. All data is deemed Advisors Peninsula Estates | Burlingame | San Mateo 2024. Each office is independently owned and operated. 5M
Price s Market
New Listings
2.5
Months of Inventory 99.2%
Median Sale vs List

C
Condo 8
, y y STINGS Jan2024 Feb2024 Mar2024 Apr2024 Jan2024 Feb2024 Mar2024 Apr2024
Median SalesPrice
Single-Family Homes
The median sale price has increased from $1 2m last April 2023, to $1 5m as of April 2024
Condos & Townhomes
The median sale price has decreased from $547k last April 2023, to $479k as of April 2024
AVGDays OntheMarket
Single-Family Homes
The average time spent on the market went up from 12 days last April 2023, to 17 days as of April 2024
Condos & Townhomes
The average time spent on the market went down from 64 days in April 2023, to 57 days as of April 2024.
Overbids
Single-Family Homes
The overbid percentage has decreased from 111 7% last April 2023, to 107 1% a year later
Condos & Townhomes
The overbid percentage has decreased from 102.9% last April 2023, to 99.2% a year later.
Back to Table of Contents $0 $500,000 $1,000,000 $1,500,000 $2,000,000 Apr2023May2023 Jun2023 Jul2023Aug2023Sep2023Oct2023Nov2023Dec2023 Jan2024Feb2024Mar2024Apr2024 0 20 40 60 80 Apr2023May2023 Jun2023 Jul2023Aug2023Sep2023 Oct2023Nov2023Dec2023 Jan2024 Feb2024Mar2024 Apr2024 000% 2000% 4000% 6000% 8000% 10000% 12000% Apr2023May2023 Jun2023 Jul2023Aug2023Sep2023 Oct2023Nov2023Dec2023 Jan2024 Feb2024Mar2024Apr2024

SanCa
What's in the San
There were 22 single-family h providing 1.2 months of inve new listings, and 19 homes s of $2.3m. The median overbi 110%, with an average of 11
There were 11 condo and tow sale, providing 1.6 months of were 6 new listings and 7 un sale price of $1.6m. The med percentage was at 101.4%, w days on the market.

single-family homes, condos and 2024. This may include gathered. All data is deemed Advisors Peninsula Estates | Burlingame | San Mateo 2024. Each office is independently owned and operated.
Price
3M
s Market
Cond
6
New Listings
1.6
Months of Inventory
101.4%
Median Sale vs List
C
, y y LISTINGS 2023 Jan2024 Feb2024 Mar2024 Apr2024 2023 Jan2024 Feb2024 Mar2024 Apr2024
Median SalesPrice
Single-Family Homes
The median sale price has increased from $2 2m last April 2023, to $2 3m as of April 2024
Condos & Townhomes
The median sale price has increased from $1 4m last April 2023, to $1 6m as of April 2024
AVGDays OntheMarket
Single-Family Homes
The average time spent on the market went down from 17 days last April 2023, to 11 days as of April 2024
Condos & Townhomes
The average time spent on the market went down from 35 days in April 2023, to 10 days as of April 2024.
Overbids
Single-Family Homes
The overbid percentage has increased from 103 6% last April 2023, to 110% a year later
Condos & Townhomes
The overbid percentage has decreased from 103.5% last April 2023, to 101.4% a year later.
Back to Table of Contents $0 $500,000 $1,000,000 $1,500,000 $2,000,000 $2,500,000 Apr2023May2023 Jun2023 Jul2023Aug2023Sep2023Oct2023Nov2023Dec2023 Jan2024Feb2024Mar2024Apr2024 0 50 100 150 200 Apr2023May2023 Jun2023 Jul2023Aug2023Sep2023 Oct2023Nov2023Dec2023 Jan2024 Feb2024Mar2024 Apr2024 000% 2000% 4000% 6000% 8000% 10000% 12000% Apr2023May2023 Jun2023 Jul2023Aug2023Sep2023 Oct2023Nov2023Dec2023 Jan2024 Feb2024Mar2024Apr2024

SanMateo
What's in the San Mateo data?
There were 48 single-family homes for sale, providing 1.2 months of inventory. There were 66 new listings, and 40 homes sold at a median price of $2.3m. The median overbid percentage was at 110.9%, with an average of 10 days on the market.
There were 76 condo and townhome units for sale, providing 2 months of inventory. There were 44 new listings and 38 units sold at a median sale price of $1m. The median overbid percentage was at 103.7%, with an average of 15 days on the market.

New Listings
2 Months of Inventory
103.7%
Median Sale vs List

C
Condo 44
, y y STINGS Jan2024 Feb2024 Mar2024 Apr2024 Jan2024 Feb2024 Mar2024 Apr2024
Median SalesPrice
Single-Family Homes
The median sale price has increased from $1 9m last April 2023, to $2 3m as of April 2024
Condos & Townhomes
The median sale price has increased from $750k last April 2023, to $1m as of April 2024
AVGDays OntheMarket
Single-Family Homes
The average time spent on the market went down from 33 days last April 2023, to 10 days as of April 2024
Condos & Townhomes
The average time spent on the market went down from 34 days in April 2023, to 15 days as of April 2024.
Overbids
Single-Family Homes
The overbid percentage has increased from 101 4% last April 2023, to 110 9% a year later
Condos & Townhomes
The overbid percentage has increased from 100.2% last April 2023, to 103.7% a year later.
Back to Table of Contents $0 $500,000 $1,000,000 $1,500,000 $2,000,000 $2,500,000 Apr2023May2023 Jun2023 Jul2023Aug2023Sep2023Oct2023Nov2023Dec2023 Jan2024Feb2024Mar2024Apr2024 0 20 40 60 80 100 Apr2023May2023 Jun2023 Jul2023Aug2023Sep2023 Oct2023Nov2023Dec2023 Jan2024 Feb2024Mar2024 Apr2024 000% 2000% 4000% 6000% 8000% 10000% 12000% Apr2023May2023 Jun2023 Jul2023Aug2023Sep2023 Oct2023Nov2023Dec2023 Jan2024 Feb2024Mar2024Apr2024

SouthSan Francisco
What's in the South San Francisco data?
There were 12 single-family homes for sale, providing 0.8 months of inventory. There were 23 new listings, and 16 homes sold at a median price of $1.4m. The median overbid percentage was at 110 2%, with an average of 7 days on the market
There were 15 condo and townhome units for sale, providing 2.1 months of inventory. There were 10 new listings and 7 units sold at a median sale price of $820k. The median overbid percentage was at 107.1%, with an average of 7 days on the market.

Single-Family Homes
23 New Listings
16 Sold Listings
0.8 Months of Inventory
$1.4M Median Sale Price
110.2%
Median Sale vs List
7 Avg Days on Market
The data, sourced from MLS Listings Inc, includes all single-family homes, condos and townhomes in the California Area from April 2023 to April 2024. This may include preliminary data, and may vary from the time the data was gathered. All data is deemed reliable but not guaranteed. DRE# 01906450. Copyright KW Advisors Peninsula Estates | Burlingame | San Mateo 2024. Each office is independently owned and operated.
SFH
Condo & Townhomes
New Listings
2.1
Months of Inventory
107.1%
Median Sale vs List
$820K
Median Sale Price
7 Avg Days on Market 7 Sold Listings

CONDO
10
,
y y
Median SalesPrice
Single-Family Homes
The median sale price has increased from $1 3m last April 2023, to $1 4m as of April 2024
Condos & Townhomes
The median sale price has decreased from $866k last April 2023, to $820k as of April 2024
AVGDays OntheMarket
Single-Family Homes
The average time spent on the market went down from 11 days last April 2023, to 7 days as of April 2024
Condos & Townhomes
The average time spent on the market went down from 41 days in April 2023, to 7 days as of April 2024.
Overbids
Single-Family Homes
The overbid percentage has increased from 106 7% last April 2023, to 110 2% a year later
Condos & Townhomes
The overbid percentage has increased from 104.1% last April 2023, to 107.1% a year later.
Back to Table of Contents $0 $500,000 $1,000,000 $1,500,000 $2,000,000 Apr2023May2023 Jun2023 Jul2023Aug2023Sep2023Oct2023Nov2023Dec2023 Jan2024Feb2024Mar2024Apr2024 0 20 40 60 80 Apr2023May2023 Jun2023 Jul2023Aug2023Sep2023 Oct2023Nov2023Dec2023 Jan2024 Feb2024Mar2024 Apr2024 000% 2000% 4000% 6000% 8000% 10000% 12000% Apr2023May2023 Jun2023 Jul2023Aug2023Sep2023 Oct2023Nov2023Dec2023 Jan2024 Feb2024Mar2024Apr2024


1430 Howard Avenue, Burlingame, CA 94010 KellerWilliamsPeninsulaEstates Peggy Greene REALTOR® | DRE #01258794 Peggy@GreeneSievers.com (650) 703-1331 Jody Sievers REALTOR® | DRE #02175212 Jody@GreeneSievers.com (415) 305-1979
