


Palo Alto Los Altos
Jump to Palo Alto Report
Jump to Redwood City Report
Portola Valley
Jump to Portola Valley Report
Menlo Park
Jump to Menlo Park Report
Jump to Atherton Report
Jump to Los Altos Report
Jump to San Jose Report
Mountain View
Jump to Mountain View Report
San Mateo County
Jump to San Mateo County Report
Santa Clara County
Jump to Santa Clara County Report
Jump to Monterey County Report
Jump to Santa Cruz County Report
Jump to East Palo Alto Report
Jump to Sunnyvale Report

Santa Clara City
Jump to Santa Clara City Report
Saratoga
Jump to Saratoga Report
That's the question you should be asking yourself.
Our market is incredibly diverse and rapidly changing. Values vary not just by neighborhood but by street. Your home isn't necessarily worth what your neighbors' home is. It's the current market that sets the value of your home.
So, do you know what your home is worth in today's market?
Icanhelp...
Contact me for a confidential, no obligation assessment of your home's value.
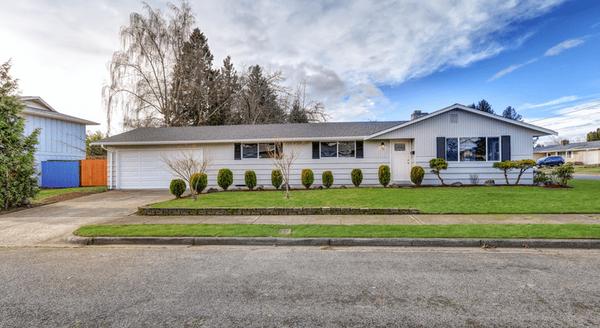
Want to know how to find the best deal possible in today’s housing market? Here’s the secret. Focus on homes that have been sitting on the market for a while.
Because when a listing lingers, sellers tend to get more realistic –and, more willing to negotiate. And that’s where the savviest buyers are finding homes other buyers overlook.


Secure Your Dream Home Today

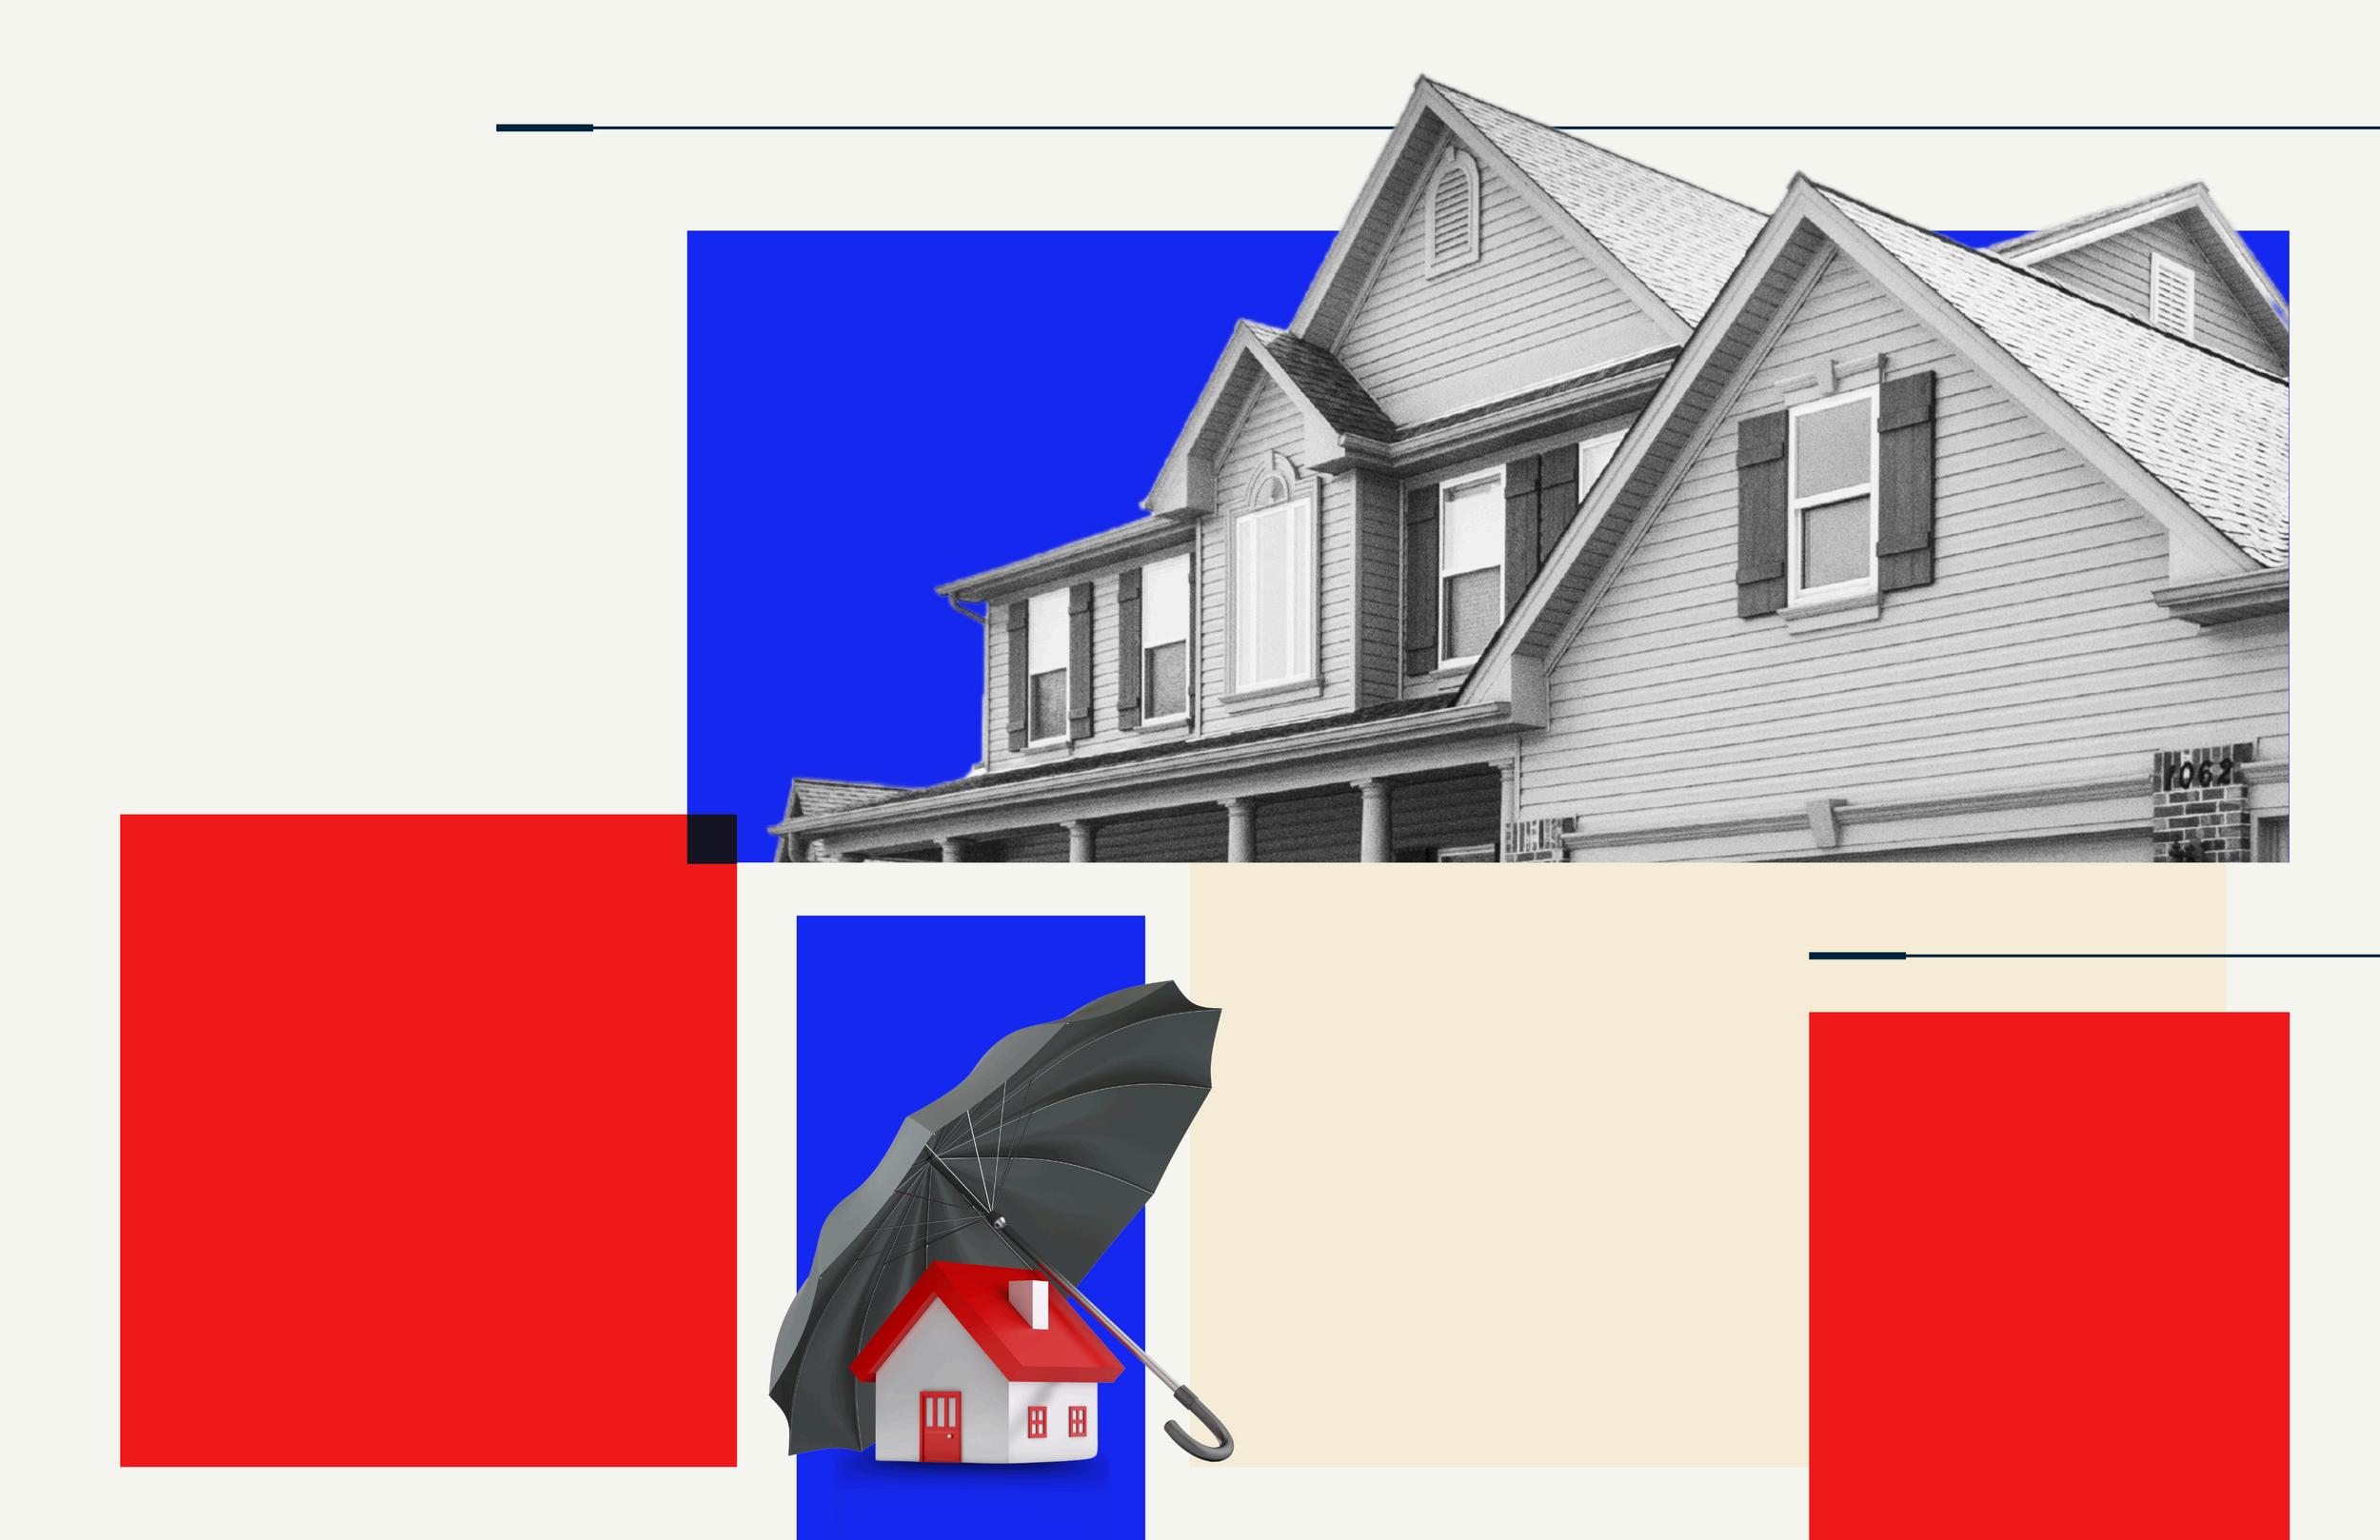
Navigating the mortgage application process can be a breeze with a little preparation. To ensure a successful application and closing, consider these helpful tips for what to avoid.


3
4 5 6 1 2
Avoid major purchases like furniture, cars, or vacations to keep your credit profile stable. Maintain your current employment to show financial stability. Always consult your mortgage professional before making large financial moves.
Avoid paying off debts or collections without professional advice.
Use verified funds for deposits to prevent closing delays.
Don't have your credit report pulled too many times - this can hurt your credit score.


In2024,thehomebuyingmarketfacessignificantchallenges highprices, steepinterestrates,andlimitedhousinginventory Formany,renovatingtheir currenthomeisamoreattractiveoptionthanpurchasinganewone.Whilethe LIRAreportpredictsadeclineinrenovationspending,expertsemphasizethat small-scaleupdatesortargetedlargerprojectscanstilldelivermajorbenefits.
Beforedivingintoarenovation,it’sessentialtoplan carefullyandbudgetwisely.Workingwithreputable professionalsiskey,especiallythoseoffering financingoptionsandtransferablewarranties.Sharing yourbudgetwithcontractorsupfrontandinvolving designersearlyensuresthatyourrenovationruns smoothlyandachievesbothfinancialandfunctional success Adetailedplanwillkeeptheprojectontrack andhelpavoidcostlysurprises


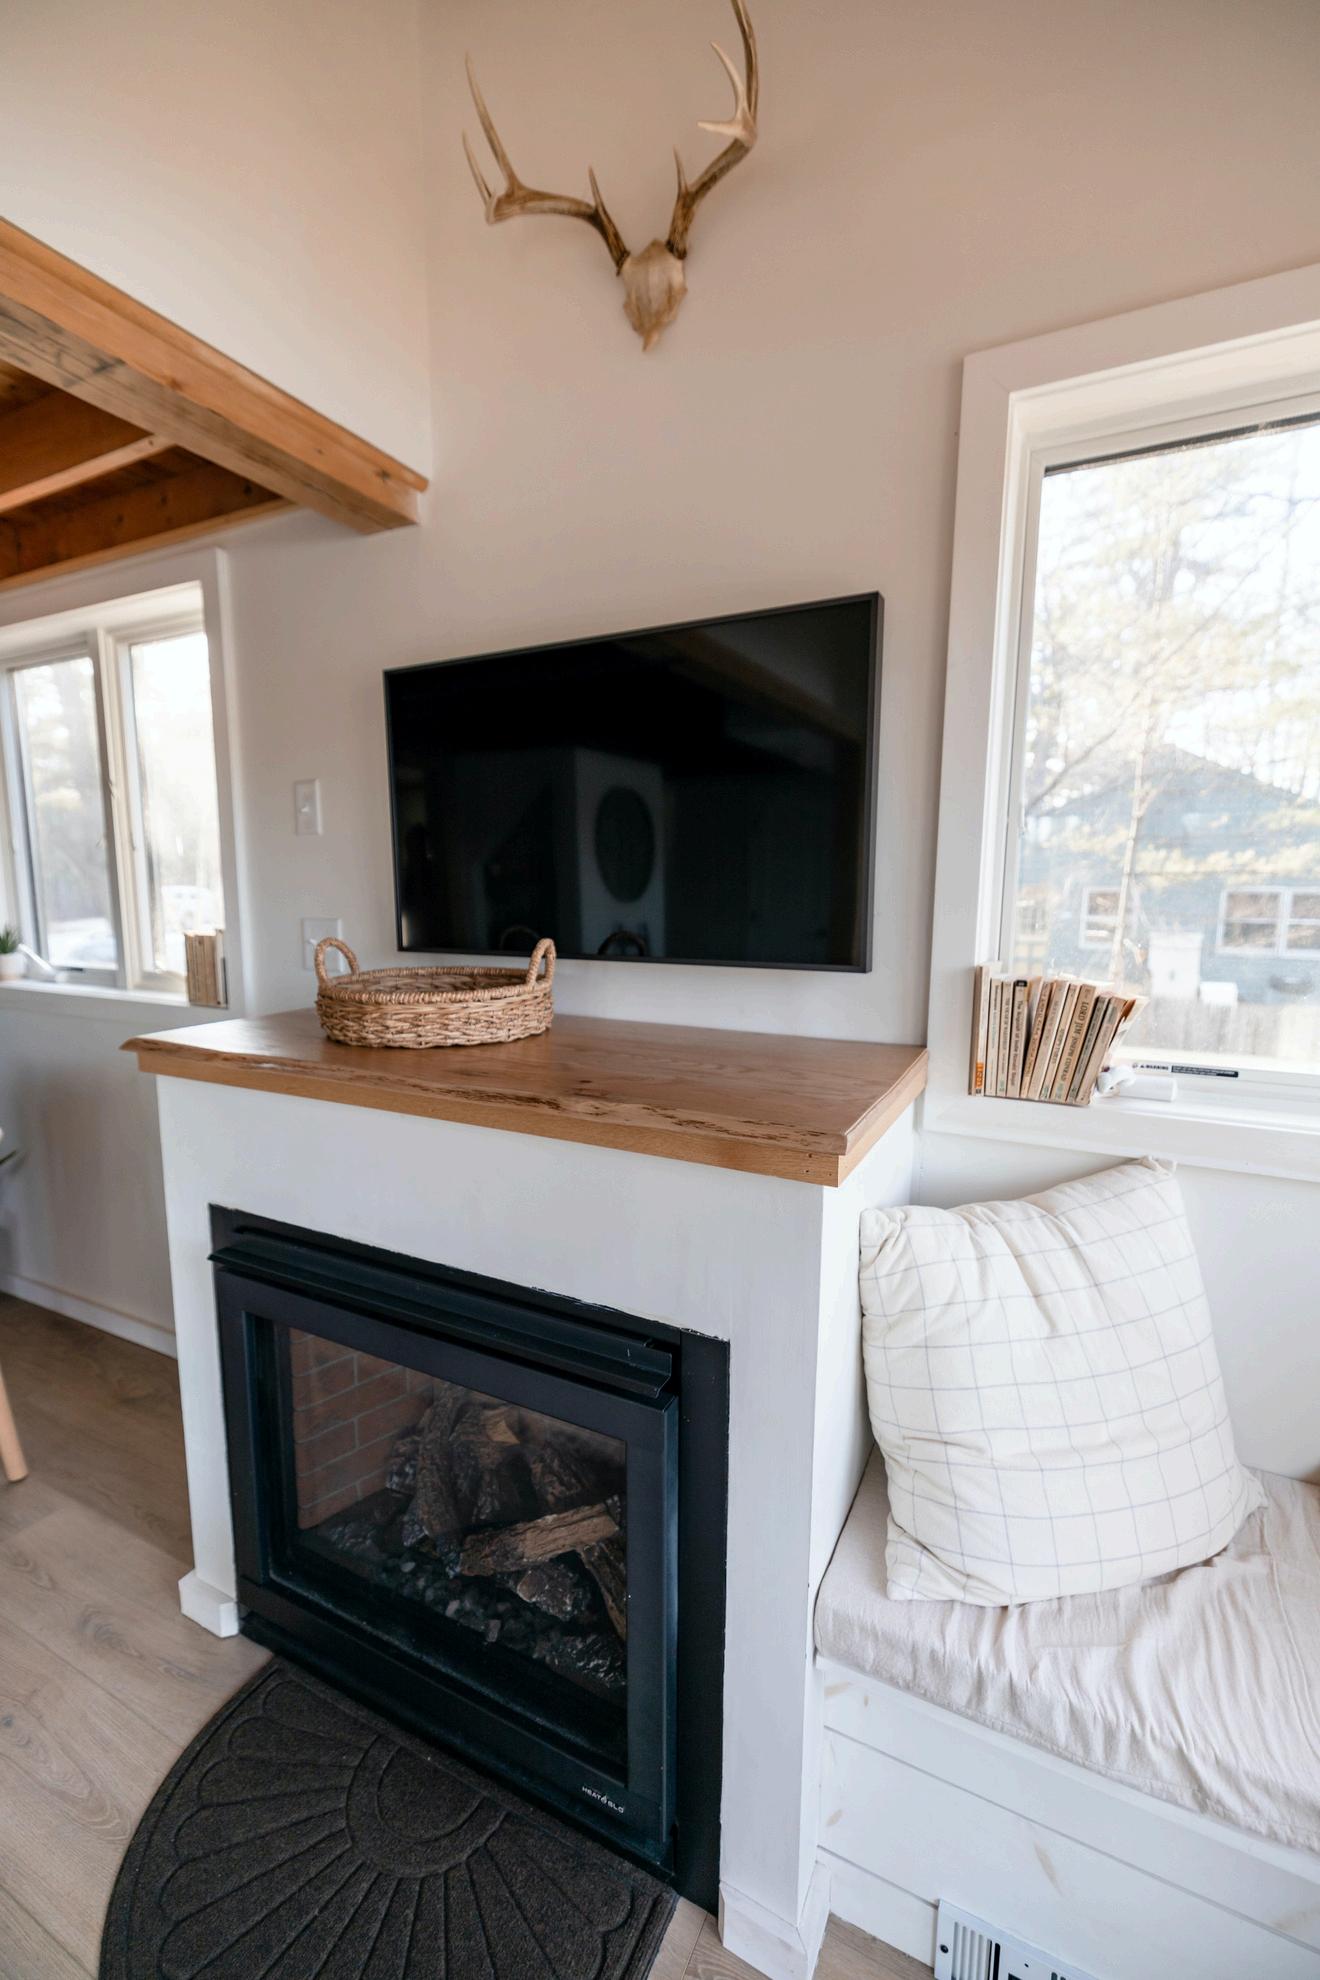
Bathrooms are a safe investment. Simple changes like a new vanity, upgraded flooring, or fresh lighting can completely transform the space. For a luxurious touch, consider adding a freestanding tub for a spa-like experience


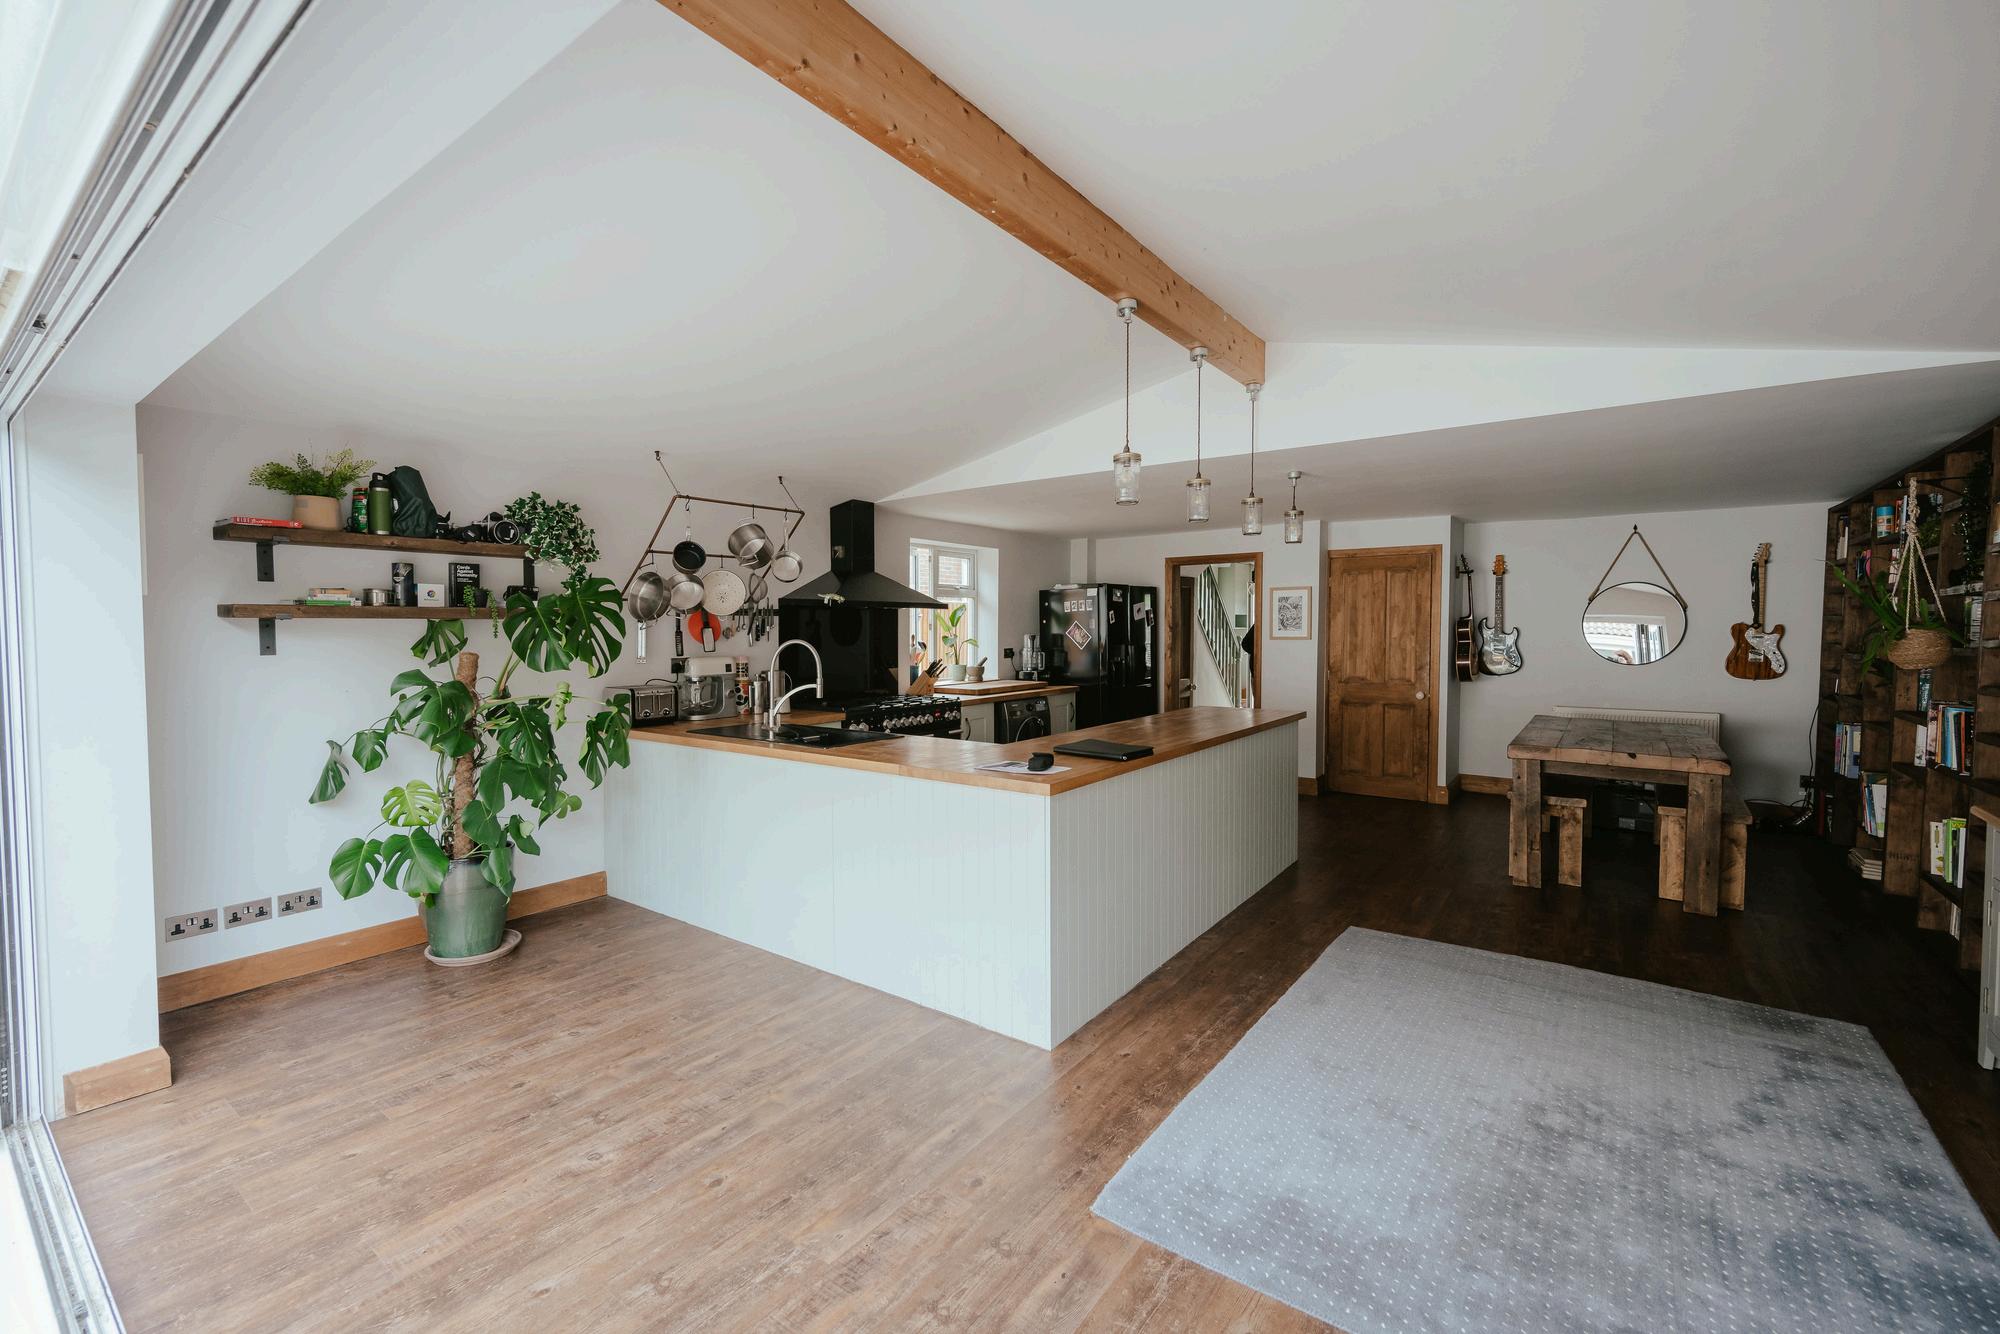
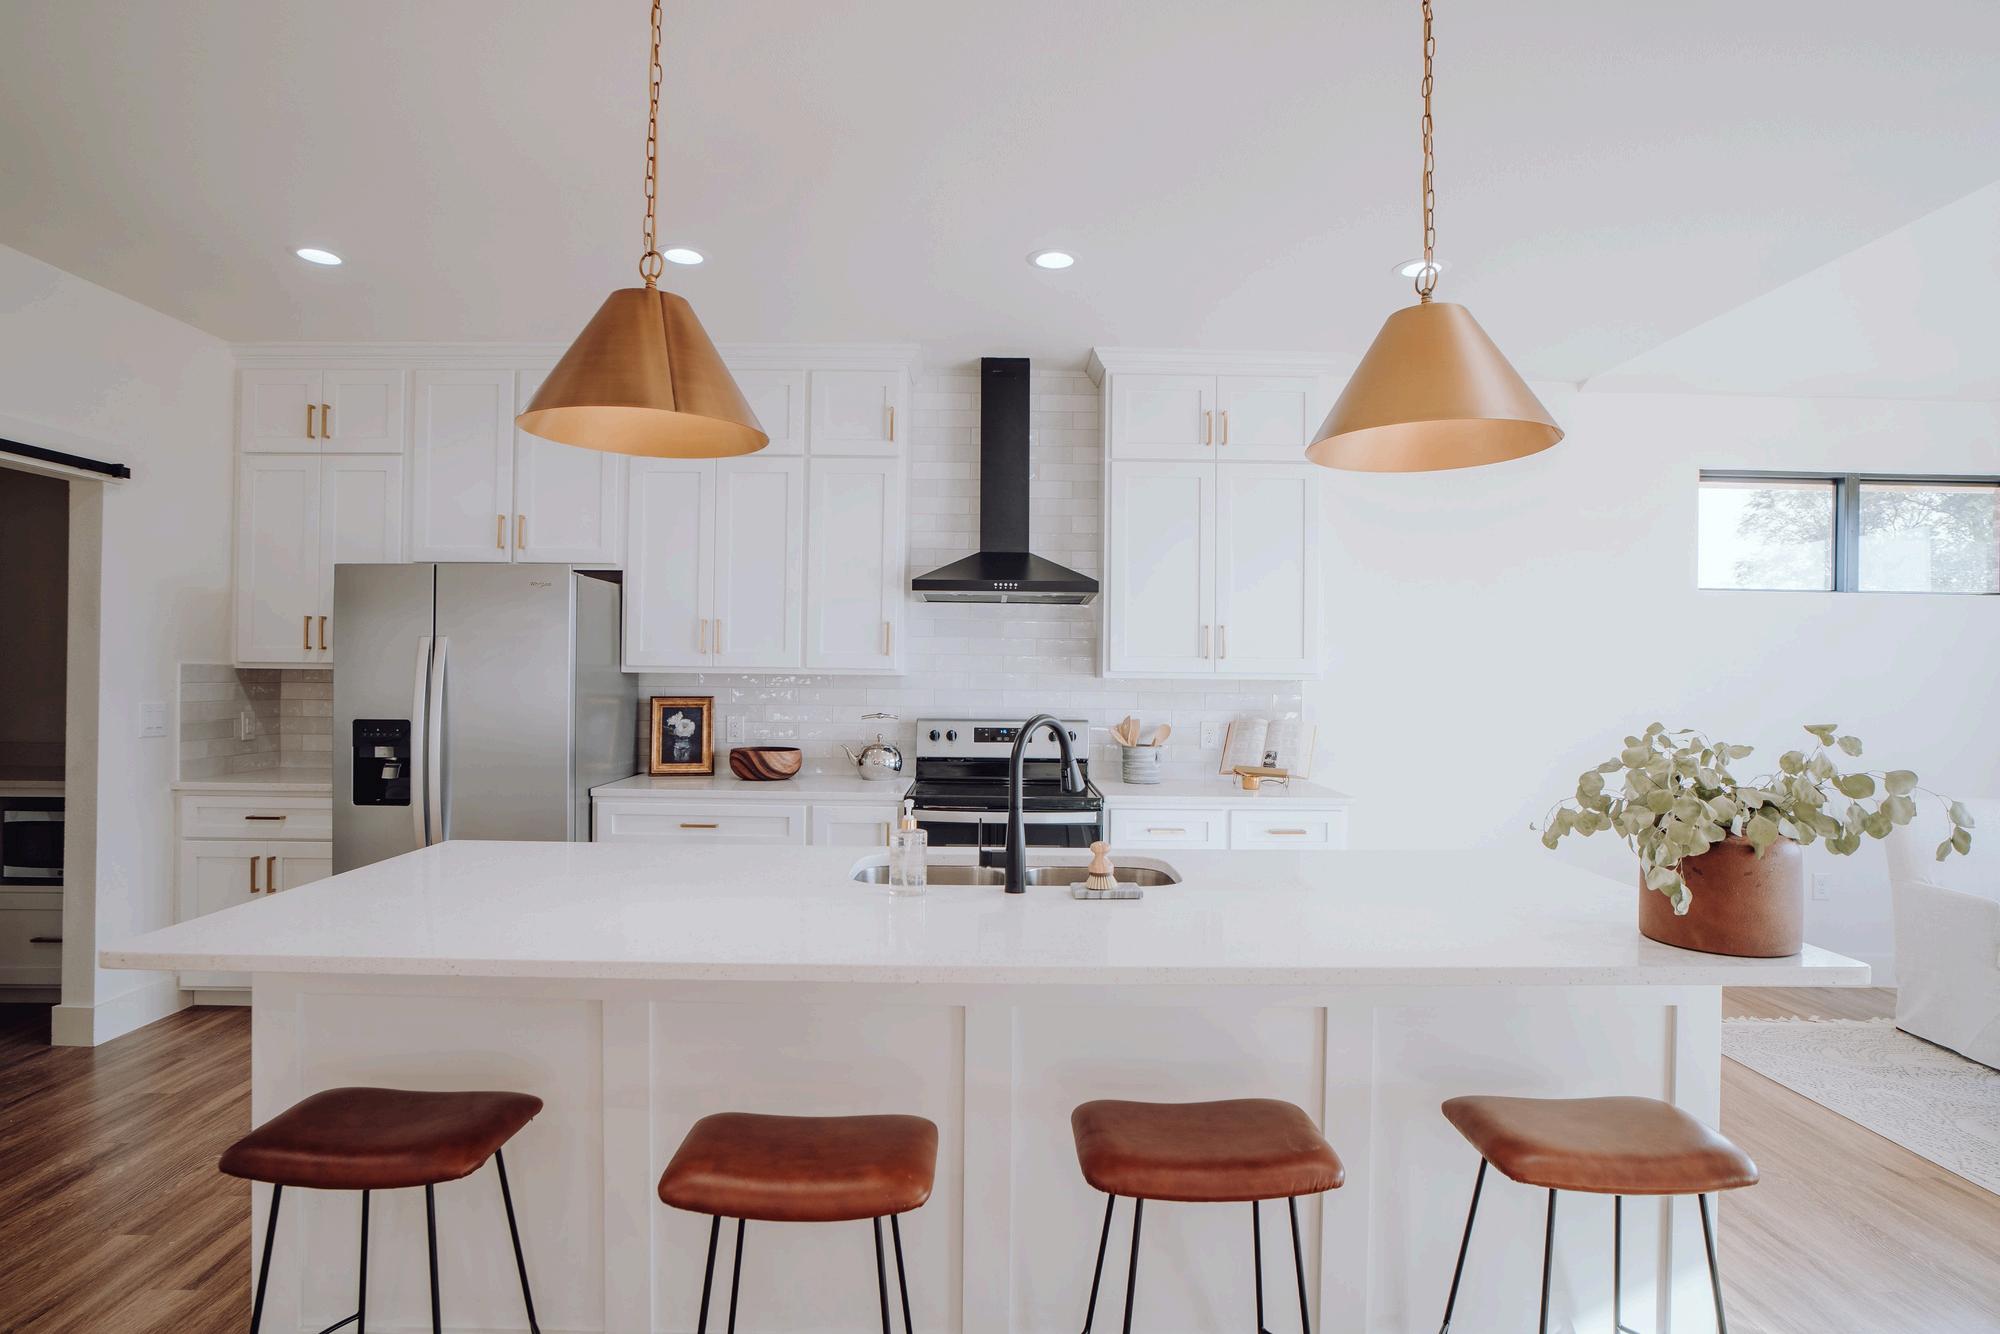
The kitchen is a crucial space for resale value. Opening up the space or adding functional features can make a big difference Smaller updates, like upgrading appliances, cabinets, or flooring, can give your kitchen a fresh, modern feel


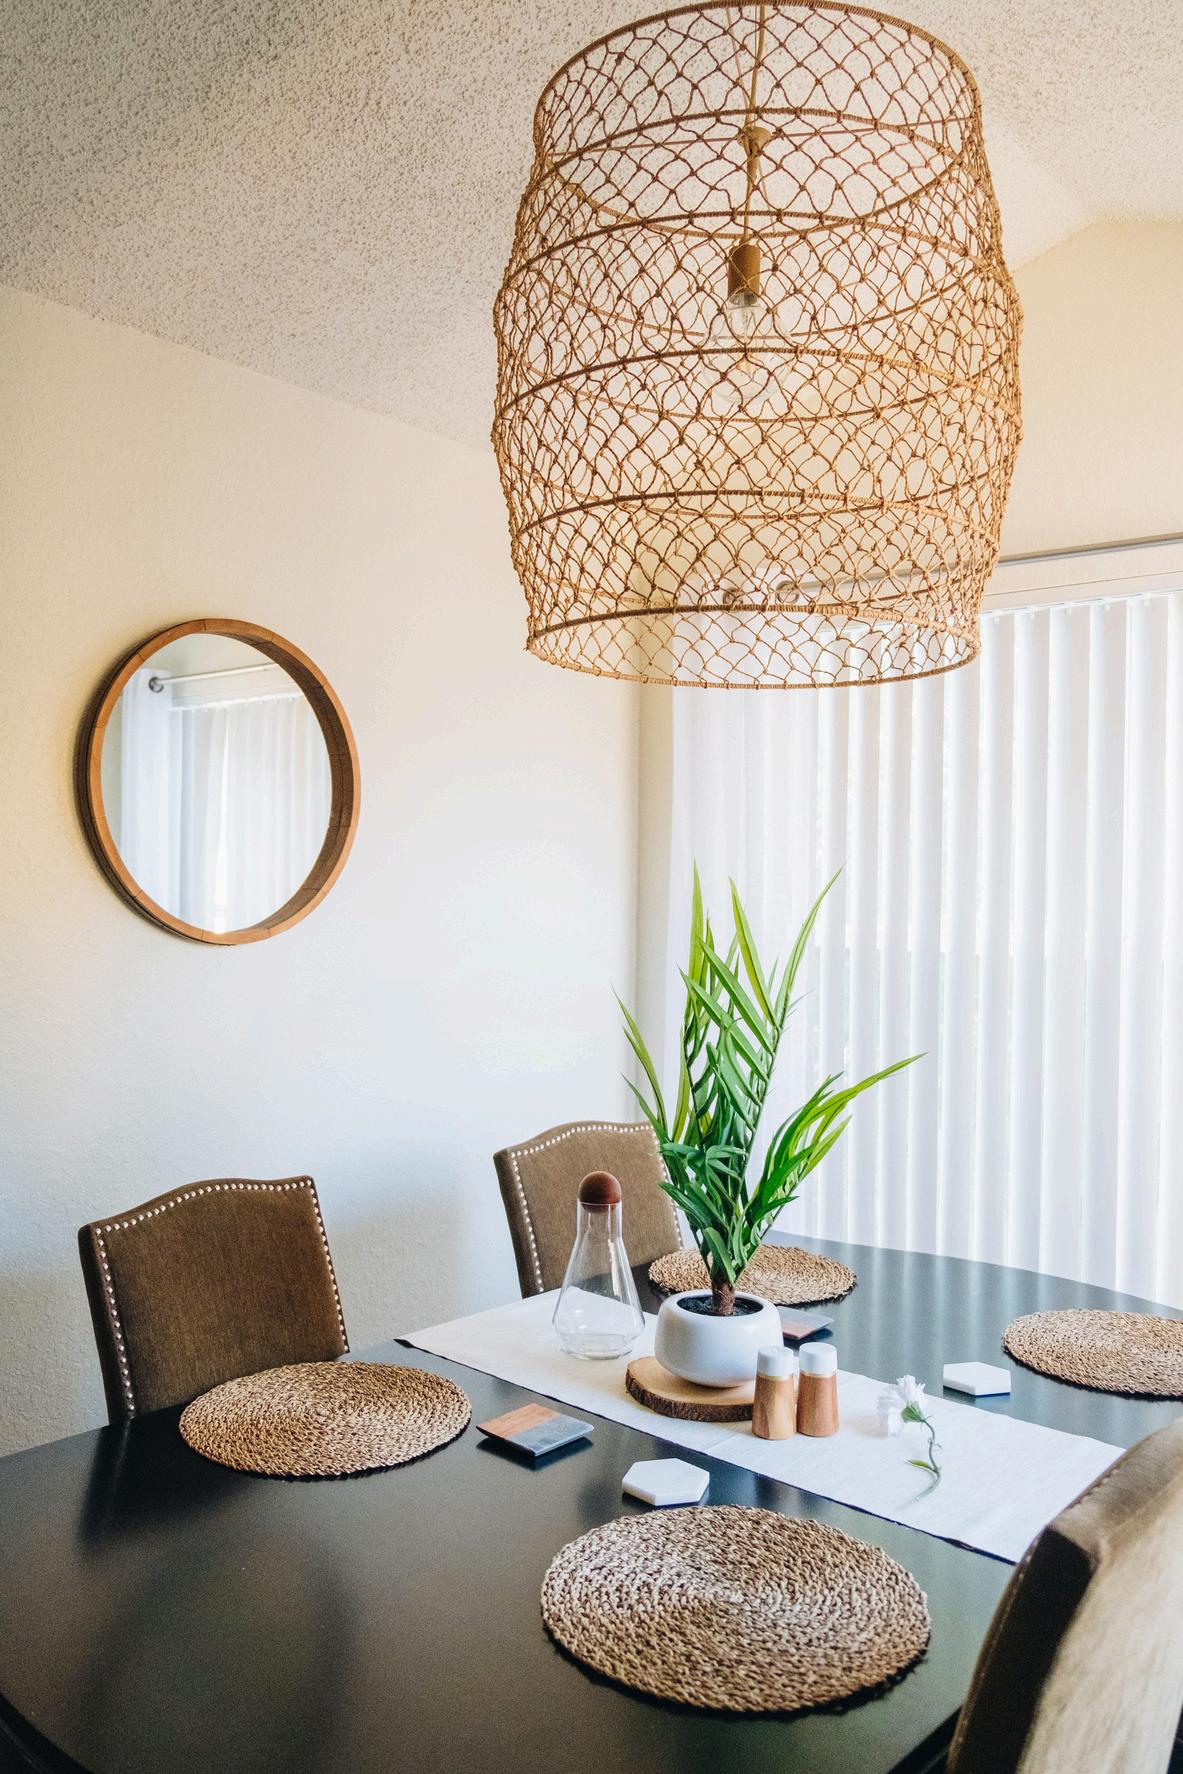
Bold design choices, such as statement wallpaper, unique lighting, or striking color palettes, can refresh any room. Layering textiles or mixing traditional and modern styles creates a space that feels cohesive and impactful


Renovations focusing on health are becoming increasingly popular. Use non-toxic materials free from Red List chemicals like BPA and VOCs. Consider adding air purifiers, water filtration systems, and better ventilation to create a healthier living environment


First impressions matter, and curb appeal can greatly impact your home's value. Exterior upgrades like siding, roofing, and landscaping enhance both aesthetics and security. Adding outdoor living spaces, such as a garden or entertainment area, boosts appeal even more.


Tailor renovations to your family’s lifestyle. Flexible spaces that accommodate workfrom-home needs, growing children, or future buyers will add lasting value. Think about both how your family uses the space and how it will appeal to future buyers.

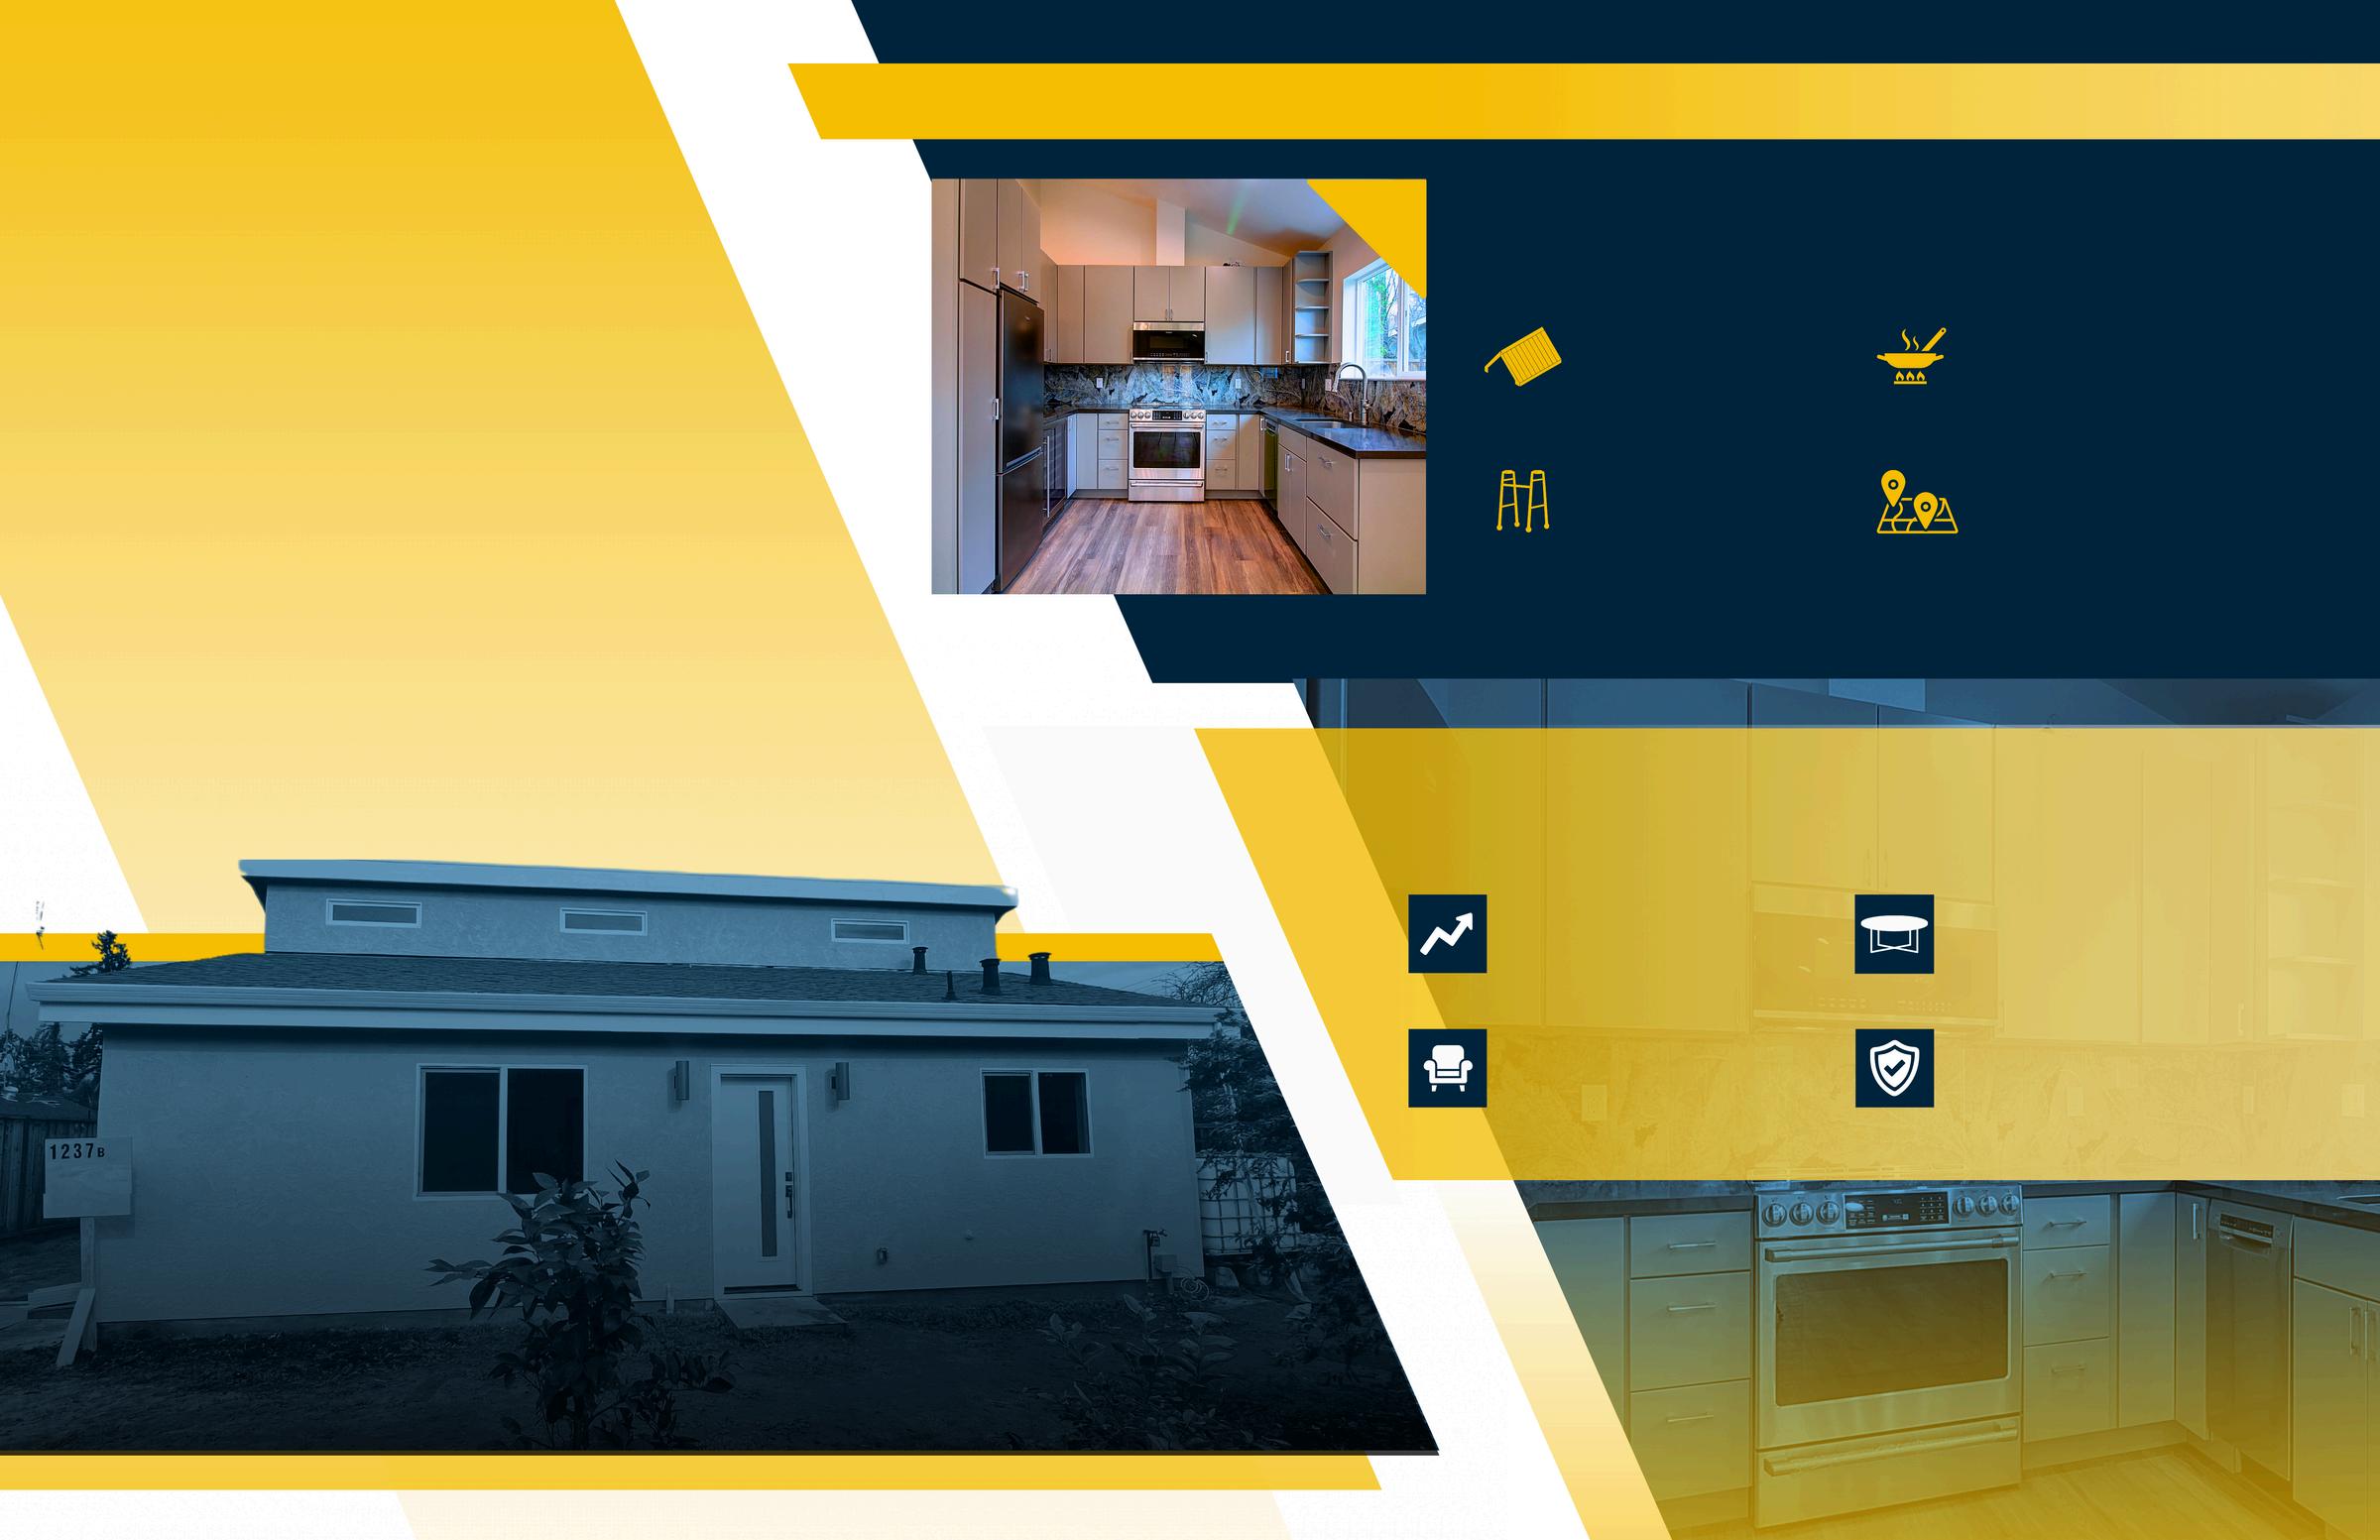

The Anenberg-Essert family in Campbell collaborated with Acton ADU to create a versatile, comfortable, and valuable addition to their property. This ADU project is a shining example of how a well-designed accessory dwelling unit can increase property value and serve a family’s unique needs.
The family envisioned an ADU that would function as an independent living space for family members, enhance their property’s worth, and provide seamless integration with the main home They wanted a space that balanced privacy with connectivity, feeling like a natural extension of their residence
Constructed at 747 square feet, this ADU was designed with modern, high-quality finishes to serve both aesthetic and practical needs. Key features include:
Vaulted Ceilings
Creates a spacious, open atmosphere
Senior-Friendly Living
Safe, independent space for elderly family members
Fully Equipped Kitchen
Modern amenities for everyday convenience
Open Living Area
Multipurpose area for relaxation and entertainment
The completion of the Anenberg-Essert ADU led to several valuable outcomes:
Increased Property Value
The ADU addition significantly boosted property value
Flexible Living Space
A versatile space for family, guests, or as a rental
Modern Comforts
High-end finishes and amenities enhance both function and style.
Enhanced Family Living
The ADU enriches the AnenbergEssert family’s home with both privacy and connection

Thinking about how an ADU could fit into your family’s lifestyle or property investment strategy?
Trust Acton ADU to guide you every step of the way.

When it comes to home ownership, knowing who you can trust is crucial. That's why we've curated a select list of trusted vendors who are ready to help with your home goals.


There were 41 single-family homes for sale, providing 2.1 months of inventory. There were 16 new listings, and 20 homes sold at a median price of $3.6m. The median overbid percentage was at 106%, with an average of 20 days on the market.
There were 25 condo and townhome units for sale, providing 5 months of inventory. There were 5 new listings and 5 units sold at a median sale price of $1.8m. The median overbid percentage was at 99.4%, with an average of 93 days on the market.
16 New Listings
20 Sold Listings
2.1 Months of Inventory
$3.6M
Median Sale Price
106%
Median Sale vs List
20 Avg Days on Market
The data, sourced from Courted.io, includes all single-family homes, condos and townhomes in the California Area above from November 2024 to November 2025. This may include preliminary data, and may vary from the time the data was gathered. All data is deemed reliable but not guaranteed. DRE# 01511642. Copyright KW Advisors Palo Alto 2025. Each office is independently owned and operated.
5 New Listings
5 Sold Listings
5 Months of Inventory $1.8M
Median Sale Price 99.4%
Median Sale vs List 93 Avg Days on Market

NOVEMBER 2024 - NOVEMBER 2025
Single-Family Homes
Last 12 months, year-over-year.
Condos & Townhomes
Last 12 months, year-over-year
Single-Family Homes
The median sale price has decreased from $3 7m last November 2024, to $3 6m as of November 2025
Condos & Townhomes
The median sale price has decreased from $1 9m last November 2024, to $1 8m as of November 2025
Single-Family Homes
The average time spent on the market went down from 34 days last November 2024, to 20 days as of November 2025
Condos & Townhomes
The average time spent on the market went up from 25 days in November 2024, to 93 days as of November 2025.
Single-Family Homes
The overbid percentage has increased from 105 2% last November 2024, to 106% a year later
Condos & Townhomes
The overbid percentage has decreased from 106.7% last November 2024, to 99.4% a year later.

There were 38 single-family homes for sale, providing 1.4 months of inventory. There were 21 new listings, and 28 homes sold at a median price of $2.2m. The median overbid percentage was at 104 1%, with an average of 29 days on the market
There were 27 condo and townhome units for sale, providing 27 months of inventory. There were 5 new listings and 1 unit sold at a median sale price of $700k. The median overbid percentage was at 96%, with an average of 55 days on the market.

21 New Listings
28 Sold Listings
1.4 Months of Inventory
$2.2M Median Sale Price
104.1%
Median Sale vs List
29 Avg Days on Market
The data, sourced from Courted.io, includes all single-family homes, condos and townhomes in the California Area above from November 2024 to November 2025. This may include preliminary data, and may vary from the time the data was gathered. All data is deemed reliable but not guaranteed. DRE# 01511642. Copyright KW Advisors Palo Alto 2025. Each office is independently owned and operated.
Listings 27 Months of Inventory
Median Sale vs List
Listing

NOVEMBER 2024 - NOVEMBER 2025 LISTINGS
Single-Family Homes
Last 12 months, year-over-year.
Condos & Townhomes
Last 12 months, year-over-year
Single-Family Homes
The median sale price has increased from $2 1m last November 2024, to $2 2m as of November 2025
Condos & Townhomes
The median sale price has decreased from $1 1m last November 2024, to $700k as of November 2025
The average time spent on the market went down from 31 days last November 2024, to 29 days as of November 2025
Condos & Townhomes
The average time spent on the market remained the same from 55 days in November 2024, to 55 days as of November 2025.
Single-Family Homes
The overbid percentage has increased from 102 6% last November 2024, to 104 1% a year later
Condos & Townhomes
The overbid percentage has decreased from 97.7% last November 2024, to 96% a year later.

There were 19 single-family homes for sale, providing 2.7 months of inventory. There was 1 new listing, and 7 homes sold at a median price of $3.5m. The median overbid percentage was at 103 2%, with an average of 120 days on the market.
There was no data for condo and townhouse units for this month.

1 New Listing
7 Sold Listings
2.7 Months of Inventory
$3.5M
Median Sale Price
103.2%
Median Sale vs List
120 Avg Days on Market
The data, sourced from Courted.io, includes all single-family homes, condos and townhomes in the California Area above from November 2024 to November 2025. This may include preliminary data, and may vary from the time the data was gathered. All data is deemed reliable but not guaranteed. DRE# 01511642. Copyright KW Advisors Palo Alto 2025. Each office is independently owned and operated.
No data available for November 2025.

No data for this month.
Single-Family Homes
The median sale price has decreased from $10m last November 2024, to $3 5m as of November 2025
Condos & Townhomes
No data for this month
Single-Family Homes
The average time spent on the market went down from 169 days last November 2024, to 120 days as of November 2025
Condos & Townhomes
No data for this month
Single-Family Homes
The overbid percentage has increased from 92% last November 2024, to 103 2% a year later
Condos & Townhomes
No data for this month

There were 27 single-family homes for sale, providing 1.7 months of inventory. There were 12 new listings, and 16 homes sold at a median pric of $3.8m. The median overbid percentage was at 101.1%, with an average of 19 days on the marke
There were 17 condo and townhome units for sale, providing 8.5 months of inventory. There were 4 new listings and 2 units sold at a median sale price of $1.4m. The median overbid percentage was at 100.4%, with an average of 16 days on the market.
12 New Listings
16 Sold Listings
1.7 Months of Inventory
$3.8M Median Sale Price
101.1% Median Sale vs List
19 Avg Days on Market
4
New Listings
2
Sold Listings
8.5
Months of Inventory
$1.4M
Median Sale Price
100.4%
Median Sale vs List
16 Avg Days on Market
Single-Family Homes
The median sale price has increased from $3 6m last November 2024, to $3 8m as of November 2025
Condos & Townhomes
The median sale price has decreased from $2 1m last November 2024, to $1 4m as of November 2025
The average time spent on the market went up from 15 days last November 2024, to 19 days as of November 2025
Condos & Townhomes
The average time spent on the market went down from 41 days in November 2024, to 16 days as of November 2025.
Single-Family Homes
The overbid percentage has decreased from 108 8% last November 2024, to 101 1% a year later
Condos & Townhomes
The overbid percentage has increased from 97.2% last November 2024, to 100.4% a year later.

There were 11 single-family homes for sale, providing 2.8 months of inventory. There were 4 new listings, and 4 homes sold at a median price of $14.9m. The median overbid percentage was at 111.3%, with an average of 52 days on the market.
There was no data for condo and townhouse units for this month.

4 New Listings
4 Sold Listings
2.8 Months of Inventory
$14.9M
Median Sale Price
111.3%
Median Sale vs List
52 Avg Days on Market
The data, sourced from Courted.io, includes all single-family homes, condos and townhomes in the California Area above from November 2024 to November 2025. This may include preliminary data, and may vary from the time the data was gathered. All data is deemed reliable but not guaranteed. DRE# 01511642. Copyright KW Advisors Palo Alto 2025. Each office is independently owned and operated.
No data available for November 2025.

NOVEMBER 2024 - NOVEMBER 2025
Single-Family Homes
Last 12 months, year-over-year.
No data for this month.
Condos & Townhomes
Last 12 months, year-over-year
Single-Family Homes
The median sale price has increased from $7 3m last November 2024, to $14 9m as of November 2025
Condos & Townhomes
No data for this month
Single-Family Homes
The average time spent on the market went up from 28 days last November 2024, to 52 days as of November 2025
Condos & Townhomes
No data for this month
Single-Family Homes
The overbid percentage has increased from 100 9% last November 2024, to 111 3% a year later
Condos & Townhomes
No data for this month

There we providing new listin of $4.5m 107%, wit
There we sale, prov 3 new list price of $ was at 97 market.

7 New Listings
17 Sold Listings
1.5 Months of Inventory
$4.5M Median Sale Price
107% Median Sale vs List
22 Avg Days on Market
condos and November 2025. This gathered. All data Advisors Palo Alto
3
New Listings
3 Sold Listings
4 Months of Inventory
$2.8M
Median Sale Price 97.5%
Median Sale vs List
38 Avg Days on Market
NOVEMBER 2024 - NOVEMBER 2025
Single-Family Homes
Last 12 months, year-over-year.
Condos & Townhomes
Last 12 months, year-over-year
The median sale price has decreased from $4 55m last November 2024, to $4 52m as of November 2025
The median sale price has increased from $1 7m last November 2024, to $2 8m as of November 2025
The average time spent on the market went down from 23 days last November 2024, to 22 days as of November 2025
The average time spent on the market went down from 53 days in November 2024, to 38 days as of November 2025.
The overbid percentage has increased from 106 9% last November 2024, to 107% a year later
Condos & Townhomes
The overbid percentage has decreased from 100.7% last November 2024, to 97.5% a year later.

There were 351 single providing 1.7 months new listings, and 210 price of $1.7m. The m was at 102.4%, with a market.
There were 357 condo sale, providing 5 3 mo were 91 new listings a sale price of $815k. T percentage was at 10 days on the market.
170 New Listings
210 Sold Listings
1.7 Months of Inventory
$1.7M Median Sale Price
102.4% Median Sale vs List
s single-family homes, condos and November 2024 to November 2025. This time the data was gathered. All data 511642. Copyright KW Advisors Palo Alto 2025. Each office is independently owned and operated.
26 Avg Days on Market
Condo & Tow 91
New Listings
68
Sold Listings
5.3
Months of Inventory $815K
Median Sale Price 100.4%
Median Sale vs List 43 Avg Days on Market
The median sale price has decreased from $1 71m last November 2024, to $1 70m as of November 2025
Condos & Townhomes
The median sale price has decreased from $892k last November 2024, to $815k as of November 2025
The average time spent on the market went up from 23 days last November 2024, to 26 days as of November 2025
Condos & Townhomes
The average time spent on the market went up from 35 days in November 2024, to 43 days as of November 2025.
Single-Family Homes
The overbid percentage has decreased from 105 1% last November 2024, to 102 4% a year later
Condos & Townhomes
The overbid percentage has decreased from 101.3% last November 2024, to 100.4% a year later.

There were 15 singleproviding 1.4 months new listings, and 11 h of $2.4m. The median 108 8%, with an avera
There were 48 condo sale, providing 3.4 mo were 16 new listings a sale price of $1.3m. T percentage was at 10 days on the market.
10 New Listings
11 Sold Listings
1.4 Months of Inventory
$2.4M Median Sale Price
108.8%
Median Sale vs List
s single-family homes, condos and November 2024 to November 2025. This time the data was gathered. All data 511642. Copyright KW Advisors Palo Alto 2025. Each office is independently owned and operated.
23 Avg Days on Market
16
New Listings
14 Sold Listings
3.4
Months of Inventory
$1.3M
Median Sale Price
103.4%
Median Sale vs List
29 Avg Days on Market

NOVEMBER 2024 - NOVEMBER 2025 LISTINGS FOR SALE
Single-Family Homes
Last 12 months, year-over-year.
Condos & Townhomes
Last 12 months, year-over-year
The median sale price has decreased from $2 7m last November 2024, to $2 4m as of November 2025
The median sale price has increased from $1 2m last November 2024, to $1 3m as of November 2025
The average time spent on the market went up from 18 days last November 2024, to 23 days as of November 2025
The average time spent on the market went down from 48 days in November 2024, to 29 days as of November 2025.
The overbid percentage has increased from 108 7% last November 2024, to 108 8% a year later
The overbid percentage has increased from 100.6% last November 2024, to 103.4% a year later.

There were 393 single providing 2.1 months new listings, and 184 price of $2m. The med at 104 8%, with an ave market.
There were 210 condo sale, providing 4 mont 49 new listings and 53 price of $859k. The m was at 98.1%, with an market

184 New Listings
184 Sold Listings
2.1 Months of Inventory
$2M Median Sale Price
104.8% Median Sale vs List
s single-family homes, condos and November 2024 to November 2025. This time the data was gathered. All data 511642. Copyright KW Advisors Palo Alto 2025. Each office is independently owned and operated.
31 Avg Days on Market
Listings

NOVEMBER 2024 - NOVEMBER 2025
Single-Family Homes
Last 12 months, year-over-year.
Condos & Townhomes
Last 12 months, year-over-year
The median sale price has decreased from $2 2m last November 2024, to $2m as of November 2025
Condos & Townhomes
The median sale price has decreased from $998k last November 2024, to $859k as of November 2025
The average time spent on the market went up from 29 days last November 2024, to 31 days as of November 2025
Condos & Townhomes
The average time spent on the market went up from 57 days in November 2024, to 64 days as of November 2025.
Single-Family Homes
The overbid percentage has increased from 104 7% last November 2024, to 104 8% a year later
Condos & Townhomes
The overbid percentage has decreased from 100.2% last November 2024, to 98.1% a year later.

There were 779 single-family homes for sale, providing 2 months of inventory. There were 340 new listings, and 399 homes sold at a median price of $1.9m. The median overbid percentage was at 103 3%, with an average of 26 days on the market.
There were 640 condo and townhome units for sale, providing 4.5 months of inventory. There were 168 new listings and 142 units sold at a median sale price of $960k. The median overbid percentage was at 100.9%, with an average of 42 days on the market

340 New Listings
399 Sold Listings
2 Months of Inventory
$1.9M
Median Sale Price
103.3%
Median Sale vs List
26 Avg Days on Market
The data, sourced from Courted.io, includes all single-family homes, condos and townhomes in the California Area above from November 2024 to November 2025. This may include preliminary data, and may vary from the time the data was gathered. All data is deemed reliable but not guaranteed. DRE# 01511642. Copyright KW Advisors Palo Alto 2025. Each office is independently owned and operated.
168
New Listings
142 Sold Listings
4.5
Months of Inventory
100.9%
Median Sale vs List
$960K
Median Sale Price
42
Avg Days on Market

NOVEMBER 2024 - NOVEMBER 2025
Single-Family Homes
Last 12 months, year-over-year.
Condos & Townhomes
Last 12 months, year-over-year
The median sale price has increased from $1 92m last November 2024, to $1 93m as of November 2025
Condos & Townhomes
The median sale price has decreased from $1m last November 2024, to $960k as of November 2025
The average time spent on the market remained the same from 26 days last November 2024, to 26 days as of November 2025
Condos & Townhomes
The average time spent on the market went up from 35 days in November 2024, to 42 days as of November 2025.
Single-Family Homes
The overbid percentage has decreased from 105 2% last November 2024, to 103 3% a year later
Condos & Townhomes
The overbid percentage has decreased from 101.8% last November 2024, to 100.9% a year later.

There were 465 single-family homes for sale, providing 5.5 months of inventory. There were 140 new listings, and 84 homes sold at a median price of $900k. The median overbid percentage was at 97 6%, with an average of 53 days on the market
There were 75 condo and townhome units for sale, providing 4.2 months of inventory. There were 22 new listings and 18 units sold at a median sale price of $1m. The median overbid percentage was at 95.6%, with an average of 85 days on the market.

140 New Listings
84 Sold Listings
5.5 Months of Inventory
$900K
Median Sale Price
97.6%
Median Sale vs List
53 Avg Days on Market
The data, sourced from Courted.io, includes all single-family homes, condos and townhomes in the California Area above from November 2024 to November 2025. This may include preliminary data, and may vary from the time the data was gathered. All data is deemed reliable but not guaranteed. DRE# 01511642. Copyright KW Advisors Palo Alto 2025. Each office is independently owned and operated.
22
New Listings
18 Sold Listings
4.2
Months of Inventory
$1M
Median Sale Price 95.6%
Median Sale vs List 85 Avg Days on Market

NOVEMBER 2024 - NOVEMBER 2025
Single-Family Homes
Last 12 months, year-over-year.
Condos & Townhomes
Last 12 months, year-over-year
Single-Family Homes
The median sale price has decreased from $930k last November 2024, to $900k as of November 2025
Condos & Townhomes
The median sale price has increased from $695k last November 2024, to $1m as of November 2025
The average time spent on the market went down from 68 days last November 2024, to 53 days as of November 2025
Condos & Townhomes
The average time spent on the market went up from 83 days in November 2024, to 85 days as of November 2025.
Single-Family Homes
The overbid percentage has decreased from 98 9% last November 2024, to 97 6% a year later
Condos & Townhomes
The overbid percentage has decreased from 98.6% last November 2024, to 95.6% a year later.

There were 380 single-family homes for sale, providing 6.2 months of inventory. There were 77 new listings, and 61 homes sold at a median price of $1.3m. The median overbid percentage was at 95.9%, with an average of 70 days on the market.
There were 116 condo and townhome units for sale, providing 9.7 months of inventory. There were 21 new listings and 12 units sold at a median sale price of $760k. The median overbid percentage was at 102.6%, with an average of 66 days on the market.

77 New Listings
61 Sold Listings
6.2 Months of Inventory
$1.3M
Median Sale Price
95.9%
Median Sale vs List
70
Avg Days on Market
The data, sourced from Courted.io, includes all single-family homes, condos and townhomes in the California Area above from November 2024 to November 2025. This may include preliminary data, and may vary from the time the data was gathered. All data is deemed reliable but not guaranteed. DRE# 01511642. Copyright KW Advisors Palo Alto 2025. Each office is independently owned and operated.
21
New Listings
12
Sold Listings
9.7
Months of Inventory
102.6%
Median Sale vs List
$760K
Median Sale Price
66
Avg Days on Market

NOVEMBER 2024 - NOVEMBER 2025
Single-Family Homes
Last 12 months, year-over-year.
Condos & Townhomes
Last 12 months, year-over-year
The median sale price has increased from $1 31m last November 2024, to $1 37m as of November 2025
Condos & Townhomes
The median sale price has decreased from $875k last November 2024, to $760k as of November 2025
The average time spent on the market went up from 55 days last November 2024, to 70 days as of November 2025
The average time spent on the market went up from 39 days in November 2024, to 66 days as of November 2025.
Single-Family Homes
The overbid percentage has decreased from 99 4% last November 2024, to 95 9% a year later
Condos & Townhomes
The overbid percentage has increased from 97.6% last November 2024, to 102.6% a year later.

6 New Listings
3 Sold Listings
5.3 Months of Inventory
$1.3M
Median Sale Price
98.6%
Median Sale vs List
58 Avg Days on Market
data, sourced from Courted.io, includes all single-family homes, condos and townhomes in the California Area above from November 2024 to November 2025. This include preliminary data, and may vary from the time the data was gathered. All data deemed reliable but not guaranteed. DRE# 01511642. Copyright KW Advisors Palo Alto 2025. Each office is independently owned and operated.
New Listing
Months of Inventory
Median Sale vs List
Sold Listings
Single-Family Homes
The median sale price has decreased from $1 37m last November 2024, to $1 35m as of November 2025
Condos & Townhomes
The median sale price has remained the same from $0 last November 2024, to $0 as of November 2025
The average time spent on the market went up from 14 days last November 2024, to 58 days as of November 2025
Condos & Townhomes
The average time spent on the market remained the same from 0 days in November 2024, to 0 days as of November 2025.
Single-Family Homes
The overbid percentage has decreased from 102 3% last November 2024, to 98 6% a year later
Condos & Townhomes
The overbid percentage has remained the same from 0% last November 2024, to 0% a year later.
There were 25 single providing 1.2 months new listings, and 21 h of $2.5m. The media 111.1%, with an avera
There were 44 condo sale, providing 4.4 m were 12 new listings sale price of $1.2m. T percentage was at 10 days on the market.

19 New Listings
21 Sold Listings
1.2 Months of Inventory
$2.5M Median Sale Price
111.1%
Median Sale vs List
16 Avg Days on Market
s single-family homes, condos and November 2024 to November 2025. This time the data was gathered. All data 511642. Copyright KW Advisors Palo Alto
12
New Listings
10
Sold Listings
4.4
Months of Inventory
$1.2M
Median Sale Price
103.5%
Median Sale vs List
40 Avg Days on Market

NOVEMBER 2024 - NOVEMBER 2025
Single-Family Homes
Last 12 months, year-over-year.
Condos & Townhomes
Last 12 months, year-over-year
Single-Family Homes
The median sale price has decreased from $2 6m last November 2024, to $2 5m as of November 2025
Condos & Townhomes
The median sale price has decreased from $1 3m last November 2024, to $1 2m as of November 2025
Single-Family Homes
The average time spent on the market went up from 14 days last November 2024, to 16 days as of November 2025
Condos & Townhomes
The average time spent on the market went up from 32 days in November 2024, to 40 days as of November 2025.
Single-Family Homes
The overbid percentage has increased from 110 1% last November 2024, to 111 1% a year later
Condos & Townhomes
The overbid percentage has decreased from 104.2% last November 2024, to 103.5% a year later.

There were 25 single providing 1.3 month new listings, and 19 of $1.7m. The media 105 3%, with an aver
There were 38 cond sale, providing 3.2 m were 11 new listings sale price of $1m. T was at 99.8%, with a market.
24 New Listings
19 Sold Listings
1.3 Months of Inventory
$1.7M Median Sale Price
105.3% Median Sale vs List
23 Avg Days on Market
all single-family homes, condos and November 2024 to November 2025. This the time the data was gathered. All data 511642. Copyright KW Advisors Palo Alto 2025. Each office is independently owned and operated.
New Listings
Sold Listings
3.2 Months of Inventory $1M Median Sale Price 99.8%
Median Sale vs List 37 Avg Days on Market 12

Single-Family Homes
The median sale price has remained the same from $1 7m last November 2024, to $1 7m as of November 2025
Condos & Townhomes
The median sale price has increased from $855k last November 2024, to $1m as of November 2025
The average time spent on the market went down from 27 days last November 2024, to 23 days as of November 2025
Condos & Townhomes
The average time spent on the market went up from 27 days in November 2024, to 37 days as of November 2025.
Single-Family Homes
The overbid percentage has decreased from 105 4% last November 2024, to 105 3% a year later
Condos & Townhomes
The overbid percentage has decreased from 102.1% last November 2024, to 99.8% a year later.

There were 32 single-family homes for sale, providing 2.9 months of inventory. There we new listings, and 11 homes sold at a median of $4.8m. The median overbid percentage w 103.5%, with an average of 30 days on the m
There were 18 condo and townhome units fo sale, providing 9 months of inventory. There new listing and 2 units sold at a median sale of $2.2m. The median overbid percentage w 98.6%, with an average of 124 days on the m

12 New Listings
11 Sold Listings
2.9 Months of Inventory
$4.8M
Median Sale Price
103.5%
Median Sale vs List
30 Avg Days on Market
sourced from Courted.io, includes all single-family homes, condos and the California Area above from November 2024 to November 2025. This preliminary data, and may vary from the time the data was gathered. All data reliable but not guaranteed. DRE# 01511642. Copyright KW Advisors Palo Alto 2025. Each office is independently owned and operated.
1 New Listing

2 Sold Listings
9 Months of Inventory
$2.2M
Median Sale Price 98.6%
Median Sale vs List 124 Avg Days on Market
NOVEMBER 2024 - NOVEMBER 2025
amily Homes months, year-over-year. & Townhomes months, year-over-year
Single-Family Homes
The median sale price has increased from $4 1m last November 2024, to $4 8m as of November 2025
Condos & Townhomes
The median sale price has increased from $1 3m last November 2024, to $2 2m as of November 2025
Single-Family Homes
The average time spent on the market went down from 49 days last November 2024, to 30 days as of November 2025
Condos & Townhomes
The average time spent on the market went up from 16 days in November 2024, to 124 days as of November 2025.
Single-Family Homes
The overbid percentage has increased from 103 1% last November 2024, to 103 5% a year later
Condos & Townhomes
The overbid percentage has decreased from 103.2% last November 2024, to 98.6% a year later.