FACTBOOK

ACADEMIC YEAR 2022/23
ku.ac.ae
Prepared by Institutional Research and Planning Department
TABLE OF CONTENTS
MESSAGE FROM THE EXECUTIVE VICE PRESIDENT
KU RANKINGS
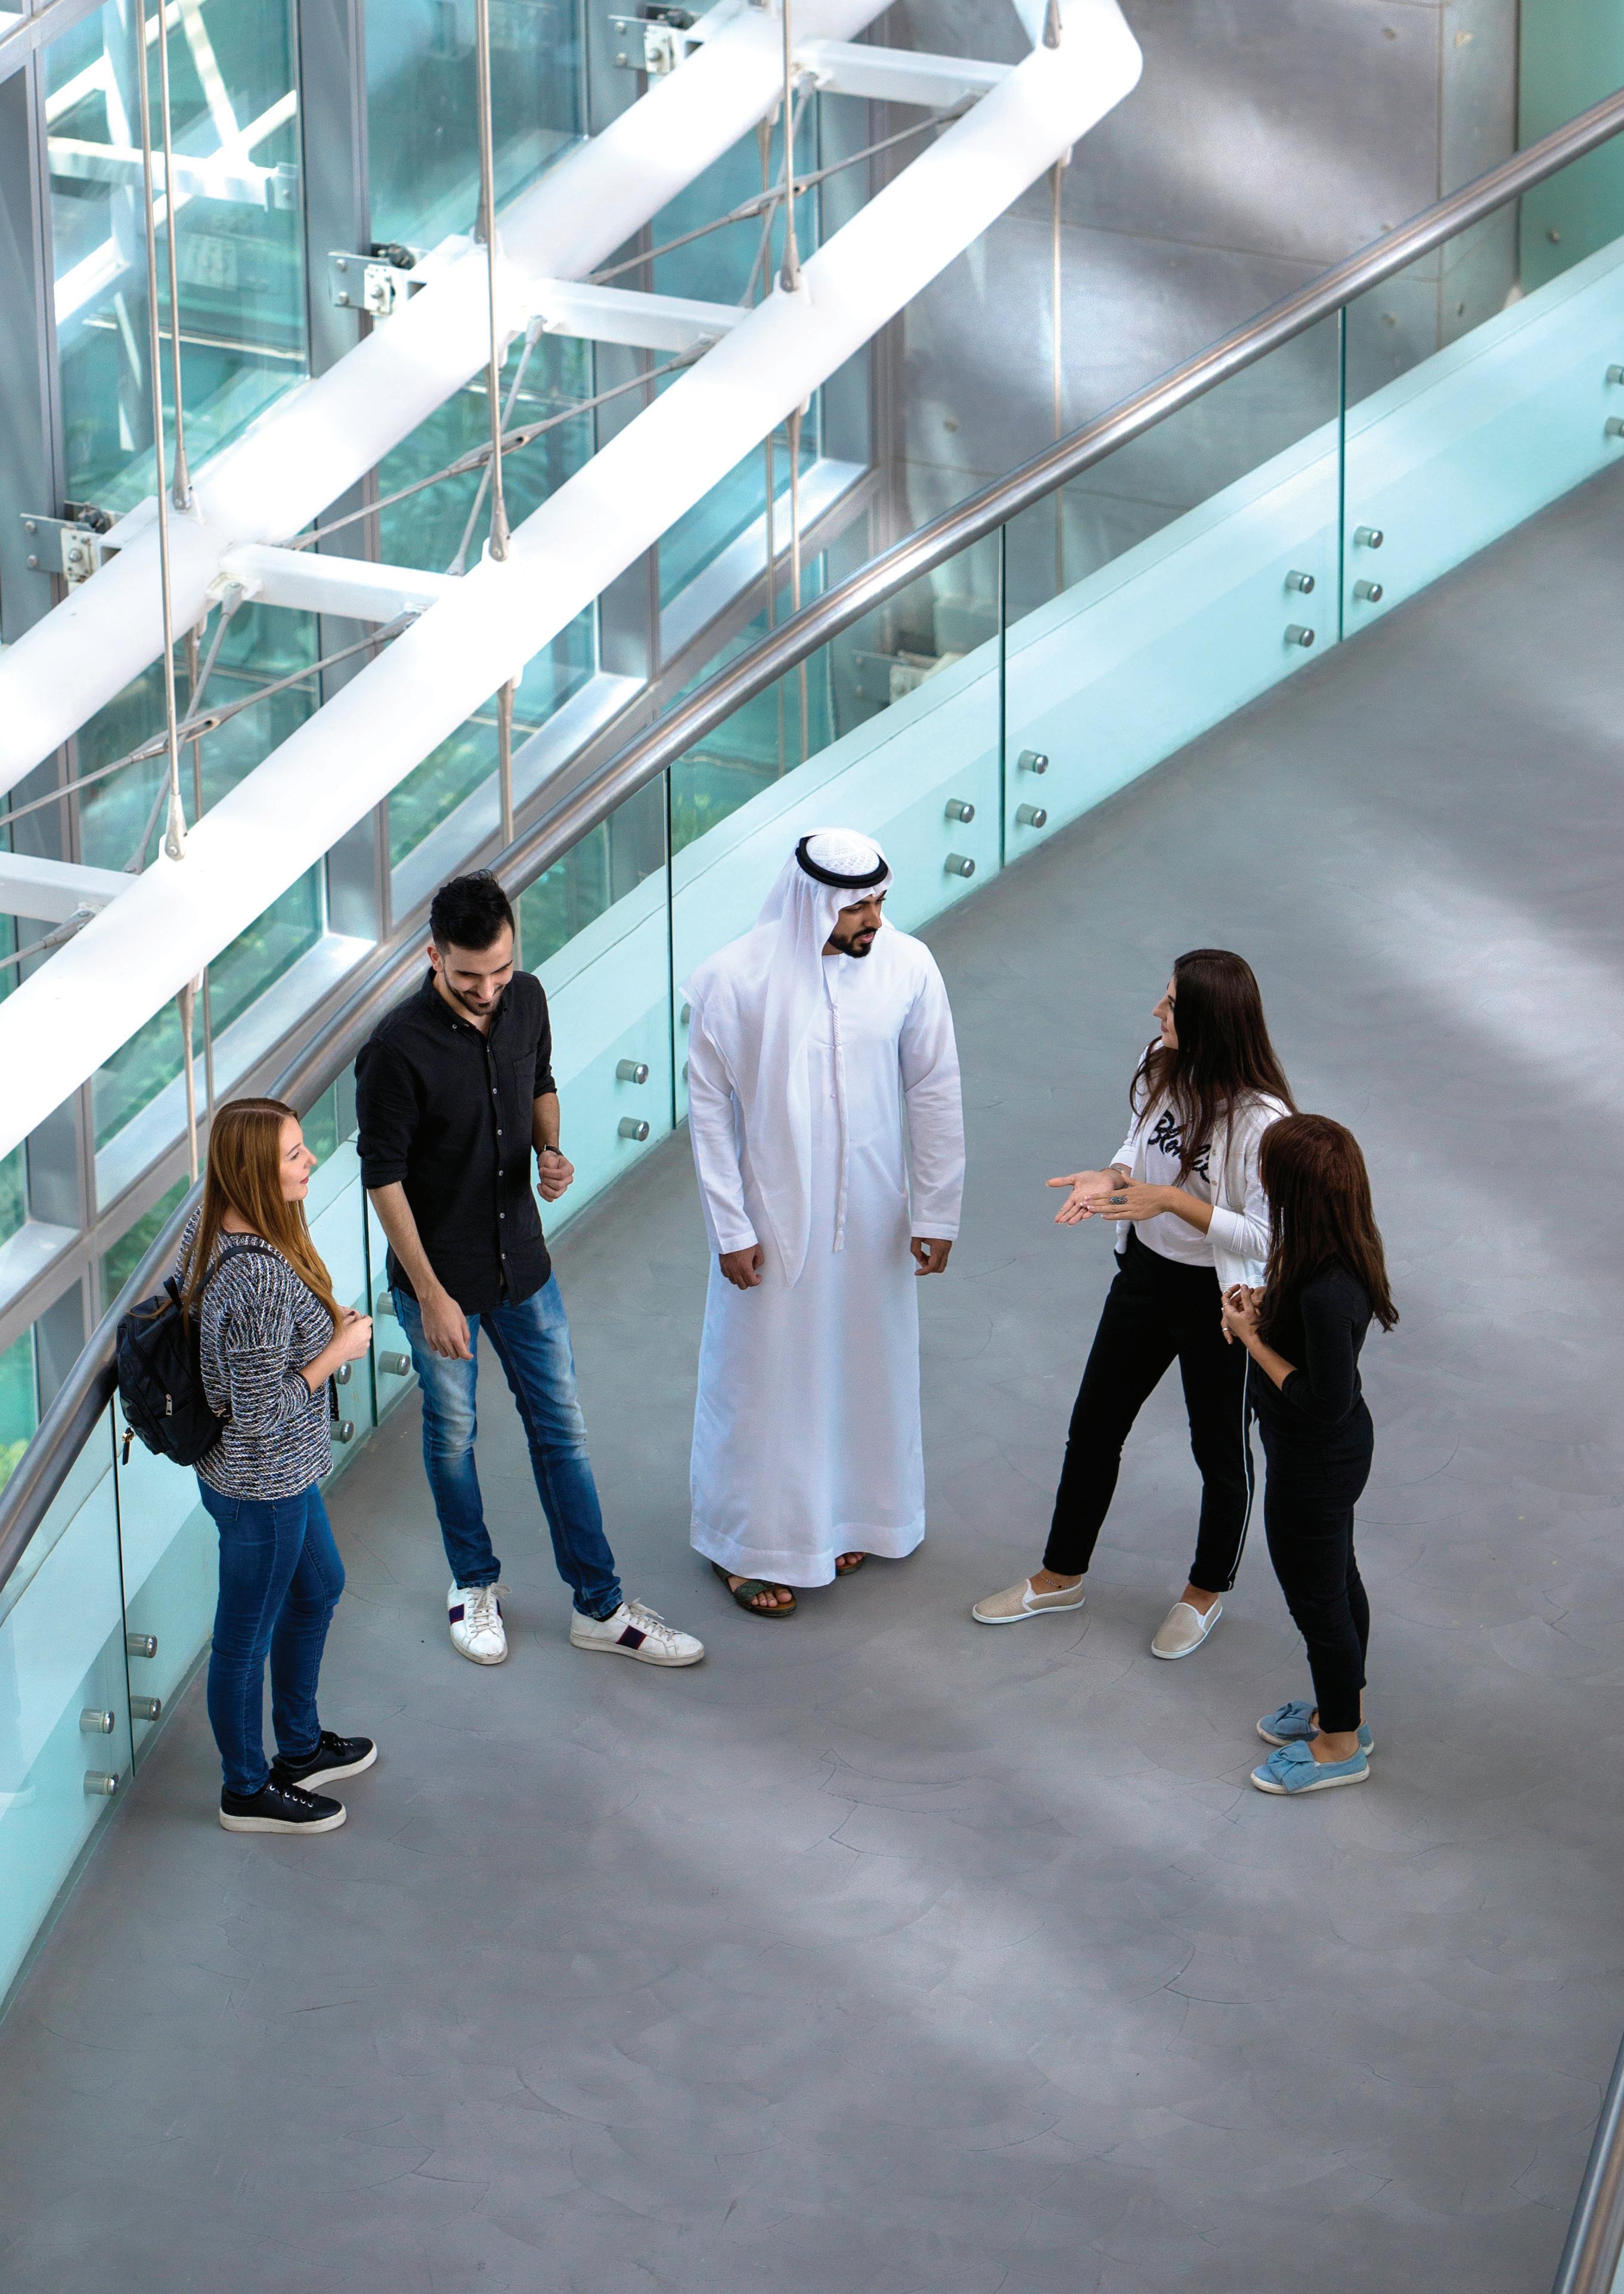
STUDENTS OVERVIEW
FALL 2022 INTAKE
FALL 2022/23 ENROLLMENT BY LEVEL
FALL 2022/23 ENROLLMENT BY REGION
FALL 2022/23 STUDENT TO FACULTY RATIO
FALL 2022/23 UNDERGRADUATE STUDENT ENROLLMENT
FALL 2022/23 UNDERGRADUATE NATIONAL STUDENTS BY HOME EMIRATE
FALL 2022/23 UNDERGRADUATE STUDENT ENROLLMENT BY GENDER
FALL 2022/23 UNDERGRADUATE STUDENT ENROLLMENT BY NATIONALITY
FALL 2022/23 UNDERGRADUATE STUDENT ENROLLMENT BY AGE GROUP DISTRIBUTION AND GENDER
FALL 2022/23 BACHELOR’S STUDENT ENROLLMENT BY PROGRAM
FALL 2022/23 BACHELOR’S STUDENT ENROLLMENT BY PROGRAM AND GENDER
FALL 2022/23 BACHELOR’S STUDENT ENROLLMENT BY PROGRAM AND NATIONALITY
FALL 2022/23 BACHELOR’S STUDENT ENROLLMENT BY PROGRAM AND CGPA DISTRIBUTION
FALL 2022/23 UNDERGRADUATE STUDENT ENROLLMENT FROM VOCATIONAL SCHOOLS
FALL 2022/23 POSTGRADUATE STUDENT ENROLLMENT
FALL 2022/23 POSTGRADUATE NATIONAL BY HOME EMIRATE
FALL 2022/23 POSTGRADUATE STUDENT ENROLLMENT BY GENDER
FALL 2022/23 POSTGRADUATE STUDENT ENROLLMENT BY NATIONALITY
FALL 2022/23 POSTGRADUATE STUDENT ENROLLMENT BY AGE GROUP DISTRIBUTION AND GENDER
FALL 2022/23 POSTGRADUATE STUDENT ENROLLMENT BY PROGRAM
FALL 2022/23 POSTGRADUATE STUDENT ENROLLMENT BY PROGRAM AND GENDER
FALL 2022/23 POSTGRADUATE STUDENT ENROLLMENT BY PROGRAM AND NATIONALITY
FALL 2022/23 POSTGRADUATE STUDENT ENROLLMENT BY PROGRAM AND CGPA DISTRIBUTION
2021/22 GRADUATES
2021/22 GRADUATES BY LEVEL
2021/22 GRADUATES BY LEVEL AND GENDER
2021/22 GRADUATES BY LEVEL AND NATIONALITY
2021/22 GRADUATES BY PROGRAM
2021/22 GRADUATES BY PROGRAM AND CGPA DISTRIBUTION
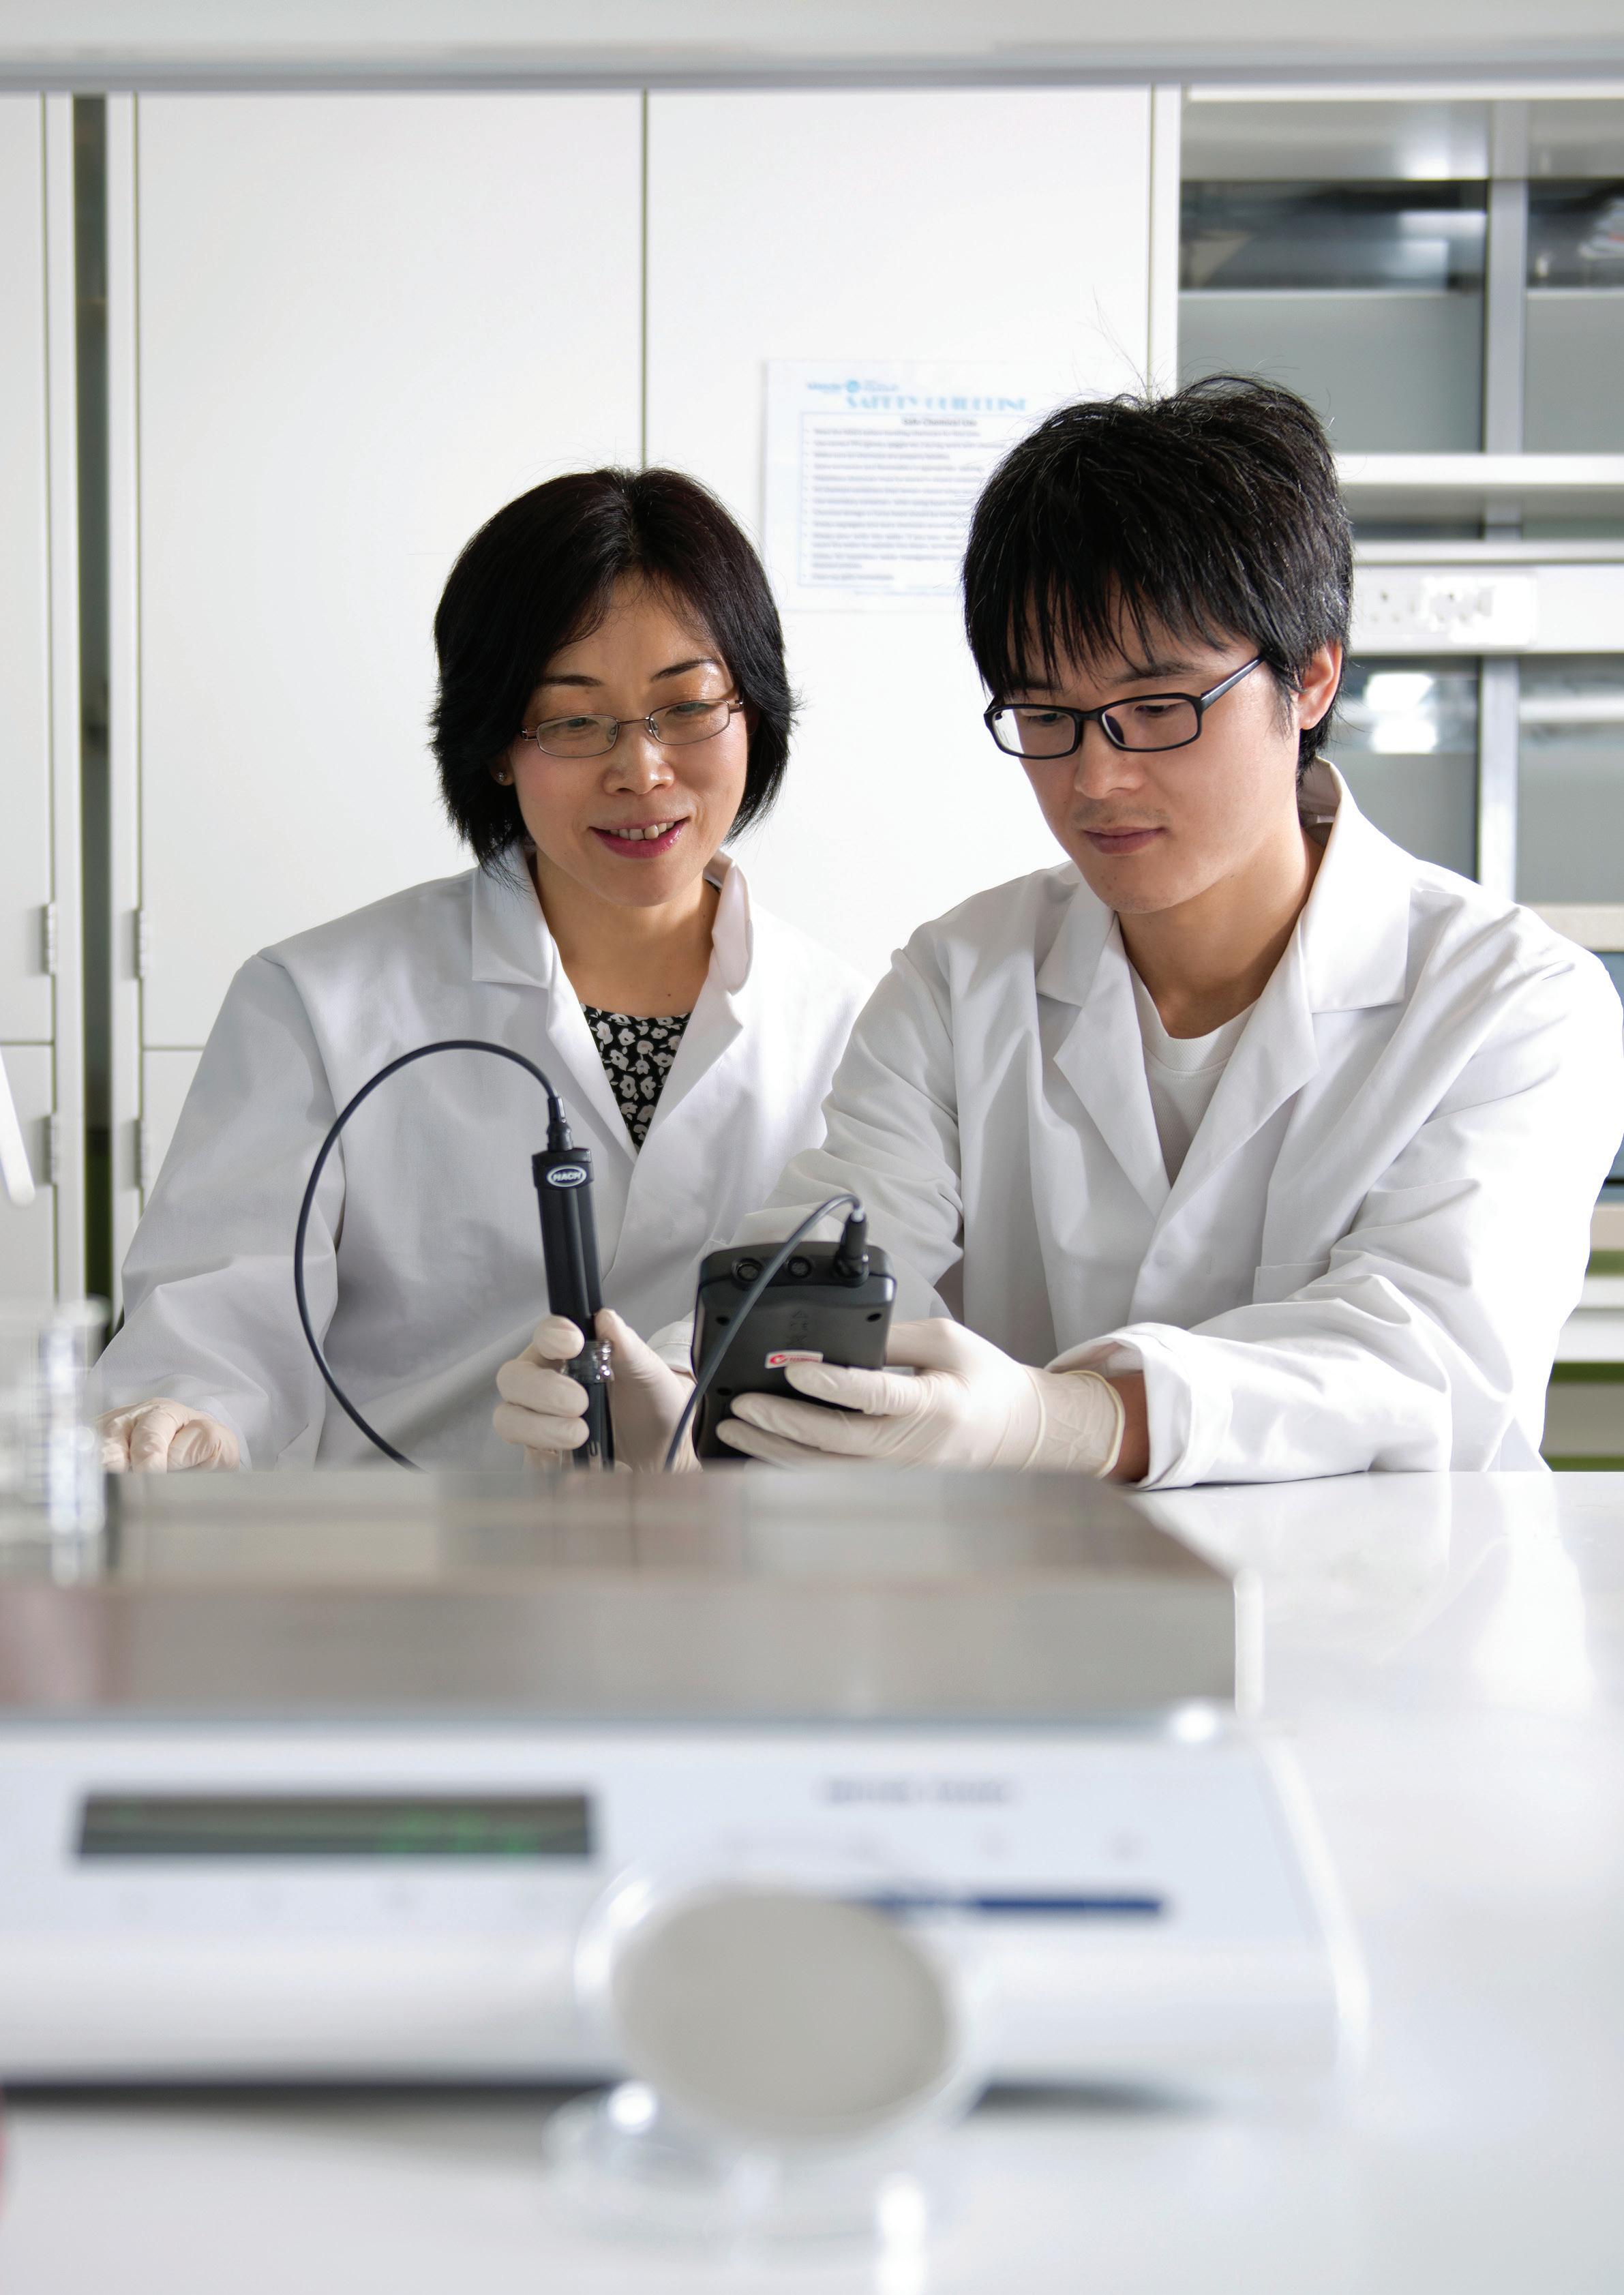
FALL 2022/23 FACULTY
FALL 2022/23 FACULTY BY COLLEGE
FALL 2022/23 FACULTY BY ACADEMIC DEPARTMENT
06 07 08 08 09 11 13 14 14 15 15 16 18 20 22 24 26 26 26 29 30 31 34 38 42 46 49 49 50 51 52 58 60 60 61
FALL 2022/23 FACULTY BY COLLEGE AND FACULTY RANK
FALL 2022/23 FACULTY BY ACADEMIC DEPARTMENT AND FACULTY RANK
FALL 2022/23 FACULTY BY COLLEGE AND AGE GROUP DISTRIBUTION
FALL 2022/23 FACULTY BY ACADEMIC DEPARTMENT AND AGE GROUP DISTRIBUTION
FALL 2022/23 FACULTY BY COLLEGE AND GENDER
FALL 2022/23 FACULTY BY ACADEMIC DEPARTMENT AND GENDER
FALL 2022/23 NATIONAL FACULTY BY COLLEGE
FALL 2022/23 NATIONAL FACULTY BY ACADEMIC DEPARTMENT
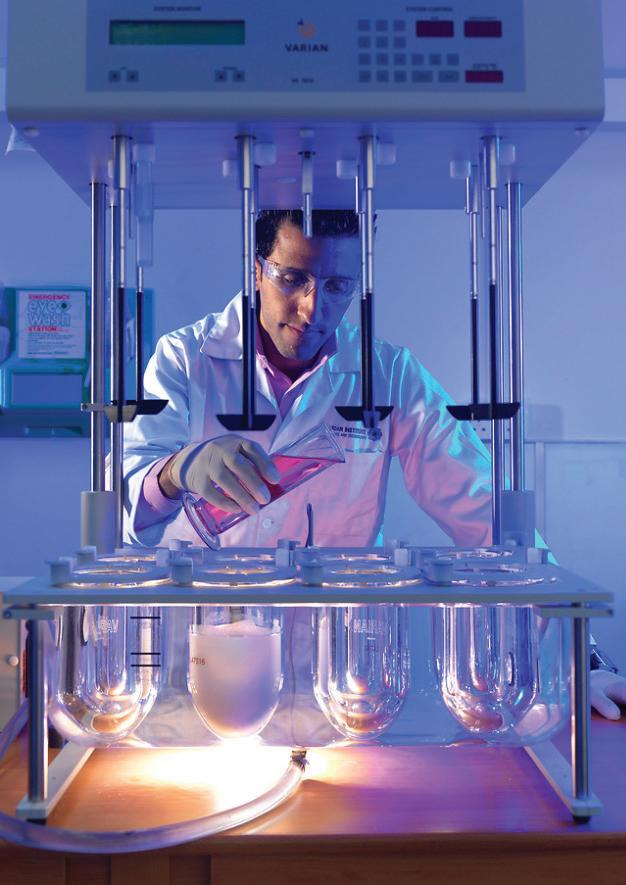
KU
2022/23 RESEARCHERS 2022/23 KHALIFA UNIVERSITY RESEARCH CENTERS 2022/23 RESEARCHERS IN RESEARCH CENTERS 2019-2022 RESEARCH PRODUCTIVITY AND ANALYSIS
SCHOLARLY OUTPUT
CITATION COUNT
KU
KU
FIELD-WEIGHTED CITATION IMPACT
OUTPUTS IN TOP CITATION PERCENTILES KU PUBLICATIONS IN JOURNAL QUARTILES KU PUBLICATIONS IN TOP JOURNAL PERCENTILES KU CITATIONS PER PUBLICATION KU CITED PUBLICATIONS KU COLLABORATION IMPACT 64 68 74 75 80 81 84 85 88 88 89 90 90 91 92 93 94 95 96 96 97
KU
EXECUTIVE VICE PRESIDENT
I am delighted to provide this introduction to Khalifa University’s Fact Book for the Academic Year 2022/23.
Khalifa University of Science and Technology is the UAE’s highest ranking research university and a global force for good.
In this time of profound disruption caused by the global pandemic, we strengthened our pledge to serving our students and our community, ensuring that we will emerge from this pandemic stronger, with expanded opportunities for students to excel and for our research to have a wider impact on the world.
We launched a number of new initiatives and programs in research and education in the Academic Year 2022/23, underscoring our commitment to educational excellence, and our goal to support wider innovation across our academic programs, pedagogy and research.
In the Academic Year 2022/23, a total of sixteen undergraduate degrees were offered, including six in the College of Arts and Sciences and ten in the College of Engineering. All eligible programs
have received ABET accreditation from the Engineering Accreditation Commission (EAC).
On the graduate level, twenty-eight degree options were offered by the university in the Academic Year 2022/23, including four Master’s degrees and five Doctoral degrees in the College of Arts and Sciences, sixteen Master’s degrees and two Doctoral degree in the College of Engineering, as well as one Doctor of Medicine in the College of Medicine and Health Sciences.
In this Fact Book, you will find some of the more significant accomplishments in academics, research and related areas that took place across the University during the past year, as well as information about student enrollment and demography, graduates and faculty. I hope you find this collection of information to be informative, and to provide an accurate indication of our status at the close of this academic year.
Dr. Arif Sultan Al Hammadi Executive Vice President Khalifa University of Science and Technology

KU FACTBOOK 2022/23 6
MESSAGE FROM THE
KU RANKINGS
QS Stars
5 out of 5
181st GLOBALLY

QS 2023 World University Rankings


15th Overall
QS 2021 Top 50 Under 50


7th in the Arab Region
QS 2023 Arab Region University Rankings

37th in Asia
2022 THE Asia University Rankings
5th in the Arab Region
THE 2022 Arab University Rankings

KU FACTBOOK 2022/23 7
STUDENTS OVERVIEW
* Exchange incoming students are excluded
KU FACTBOOK 2022/23 8
2022/23 Intake* Applied Offer Sent Accepted Admitted 10,209 996 636 169 990 208 143 45 705 190 136 36 508 162 98 35 Applied Offer Sent Accepted Admitted Bachelor's 10,209 990 705 508 Master's 996 208 190 162 Doctor of Philosophy 636 143 136 98 Doctor of Medicine 169 45 36 35 Total 12,010 1,386 1,067 803
Fall
KU FACTBOOK 2022/23 9 259 1,245 741 468 652 Fall 2022/23 Enrollment by Level Fall 2022/23 Enrollment Undergraduate Students - Level (Number) Undergraduate Level Number of Students Preparatory 259 Freshman 1,245 Sophomore 741 Junior 468 Senior 652 Total 3,365
KU FACTBOOK 2022/23 10 Postgraduate Level Number of Students Master’s 534 Doctor of Philosophy 466 Doctor of Medicine 144 Total 1,144 Fall 2022/23 Enrollment Postgraduate Students - Level (Number) 534 466 144
KU FACTBOOK 2022/23 11 Fall 2022/23 Enrollment by
Region Number of Undergraduate Students East Asia & Pacific 15 Europe & Central Asia 7 Latin America & Caribbean 3 Middle East & North Africa 3,170 North America 17 South Asia 59 Sub-Saharan Africa 94 Total 3,365 Fall 2022/23 Enrollment Undergraduate Students - Nationality (Number) 15 7 3 3,170 17 59 94
Region
KU FACTBOOK 2022/23 12 Fall 2022/23 Enrollment Postgraduate Students - Nationality (Number) 63 29 12 716 36 179 109 Region Number of Postgraduate Students East Asia & Pacific 63 Europe & Central Asia 29 Latin America & Caribbean 12 Middle East & North Africa 716 North America 36 South Asia 179 Sub-Saharan Africa 109 Total 1,144
4,509
400
11.3

KU FACTBOOK 2022/23 13
Fall 2022/23 Student to Faculty Ratio
FALL 2022/23 UNDERGRADUATE STUDENT ENROLLMENT
Fall 2022/23 Undergraduate National Students by Home Emirate*
KU FACTBOOK 2022/23 14
Undergraduate National Students - Home Emirate Number of Students Percentage Abu Dhabi 1,564 55% Ajman 103 4% Dubai 291 10% Fujairah 240 8% Ras Al Khaimah 365 13% Sharjah 239 8% Umm Al-Quwain 65 2% Total 2,867 100% Fall 2022/23 Enrollment Undergraduate National Students - Home Emirate (%)
55% 4% 10% 8% 13% 8% 2%
*Undergraduate includes Bachelor’s and Preparatory students
Fall 2022/23 Undergraduate Student Enrollment by Gender*
Fall 2022/23 Undergraduate Student Enrollment by Nationality*
KU FACTBOOK 2022/23 15
Gender Number of Students Percentage Male 1,307 39% Female 2,058 61% Total 3,365 100% Nationality Number of Students Percentage National 2,867 85% International 498 15% Total 3,365 100% Fall 2022/23 Enrollment Undergraduate Students - Gender (%) Fall 2022/23 Enrollment Undergraduate Students - Nationality (%)
39% 61% 85% 15%
*Undergraduate includes Bachelor’s and Preparatory students
Fall 2022/23 Undergraduate Student Enrollment
by Age Group Distribution and Gender*
Fall
*Undergraduate includes Bachelor’s and Preparatory students
KU FACTBOOK 2022/23 16
Undergraduate StudentsGender Age Group <20 Years Old Total % of Age Group <20 Years Old Age Group 20-24 Years Old Total % of Age Group 20-24 Years Old Age Group 25-29 Years Old Total % of Age Group 25-29 Years Old Grand Total Male 538 41% 750 57% 19 1% 1,307 Female 1,078 52% 970 47% 10 0.5% 2,058 Total 1,616 48% 1,720 51% 29 1% 3,365
2022/23 Enrollment Undergraduate StudentsAge Group Distribution and Gender (%)
% of Age Group <20 Years Old % of Age Group 20-24 Years Old % of Age Group 25-29 Years Old 1% 0.5% 41% 52% 57% 47%
Fall 2022/23 Bachelor’s Student Enrollment by Program
KU FACTBOOK 2022/23 18
Bachelor's Programs Number of Students Percentage Aerospace Engineering 289 9% Applied Mathematics and Statistics 64 2% Biomedical Engineering 388 12% Cell and Molecular Biology 70 2% Chemical Engineering 385 12% Chemistry 56 2% Civil Engineering 83 3% Computer Engineering 342 11% Computer Science 138 4% Earth and Planetary Science 14 0.45% Electrical and Electronic Engineering 1 0.03% Electrical Engineering 244 8% Industrial and Systems Engineering 153 5% Mechanical Engineering 220 7% Petroleum Engineering 21 1% Petroleum Geosciences 8 0.26% Physics 39 1% Undeclared* 591 19% Total 3,106 100% program - Phasing out program
Fall 2022/23 Enrollment
Bachelor’s Students - Program (%)
Applied Mathematics and Statistics
Biomedical Engineering
Cell and Molecular Biology
KU FACTBOOK 2022/23 19
Aerospace Engineering
Computer
Systems Engineering
Petroleum Engineering Petroleum Geosciences Physics Undeclared 9% 2% 12% 2% 12% 2% 3% 11% 4% 0.45% 0.03% 8% 5% 7% 1% 0.26% 1% 19%
Chemical Engineering Chemistry Civil Engineering Computer Engineering
Science Earth and Planetary Science Electrical and Electronic Engineering Electrical Engineering Industrial and
Mechanical Engineering
*Freshman and exchange incoming students
Fall 2022/23 Bachelor’s Student Enrollment by Program and Gender
KU FACTBOOK 2022/23 20
Bachelor's Programs Male Total % of Male Female Total % of Female Grand Total Aerospace Engineering 109 38% 180 62% 289 Applied Mathematics and Statistics 22 34% 42 66% 64 Biomedical Engineering 56 14% 332 86% 388 Cell and Molecular Biology 6 9% 64 91% 70 Chemical Engineering 137 36% 248 64% 385 Chemistry 9 16% 47 84% 56 Civil Engineering 28 34% 55 66% 83 Computer Engineering 184 54% 158 46% 342 Computer Science 76 55% 62 45% 138 Earth and Planetary Science 2 14% 12 86% 14 Electrical and Electronic Engineering 0 0% 1 100% 1 Electrical Engineering 133 55% 111 45% 244 Industrial and Systems Engineering 55 36% 98 64% 153 Mechanical Engineering 117 53% 103 47% 220 Petroleum Engineering 11 52% 10 48% 21 Petroleum Geosciences 3 38% 5 63% 8 Physics 16 41% 23 59% 39 Undeclared 278 47% 313 53% 591 Total 1,242 40% 1,864 60% 3,106 - Phasing out program
Fall 2022/23 Enrollment Bachelor’s Students - Program and Gender (%)
Aerospace Engineering
Applied Mathematics and Statistics
Biomedical Engineering
Cell and Molecular Biology
Chemical Engineering Chemistry
Civil Engineering
Computer Engineering
Computer Science
Earth and Planetary Science
Electrical and Electronic Engineering
Electrical Engineering
Industrial and Systems Engineering
Mechanical Engineering
Petroleum Engineering
Petroleum Geosciences Physics
*Freshman
KU FACTBOOK 2022/23 21 % OF MALE % OF FEMALE
Undeclared 38% 34% 14% 9% 36% 16% 34% 54% 55% 14% 0% 55% 36% 53% 52% 38% 41% 47% 62% 66% 86% 91% 64% 84% 66% 46% 45% 86% 100% 45% 64% 47% 48% 63% 59% 53%
and exchange incoming students
Fall 2022/23 Bachelor’s Student Enrollment by Program and Nationality
KU FACTBOOK 2022/23 22
Bachelor's Programs National Total % of National International Total % of International Grand Total Aerospace Engineering 270 93% 19 7% 289 Applied Mathematics and Statistics 12 19% 52 81% 64 Biomedical Engineering 337 87% 51 13% 388 Cell and Molecular Biology 53 76% 17 24% 70 Chemical Engineering 364 95% 21 5% 385 Chemistry 15 27% 41 73% 56 Civil Engineering 71 86% 12 14% 83 Computer Engineering 294 86% 48 14% 342 Computer Science 114 83% 24 17% 138 Earth and Planetary Science 12 86% 2 14% 14 Electrical and Electronic Engineering 1 100% 0 0% 1 Electrical Engineering 220 90% 24 10% 244 Industrial and Systems Engineering 145 95% 8 5% 153 Mechanical Engineering 199 90% 21 10% 220 Petroleum Engineering 20 95% 1 5% 21 Petroleum Geosciences 7 88% 1 13% 8 Physics 9 23% 30 77% 39 Undeclared 478 81% 113 19% 591 Total 2,621 84% 485 16% 3,106 - Phasing out program
Fall 2022/23 Enrollment Bachelor’s Students - Program and Nationality (%)
Aerospace Engineering
Applied Mathematics and Statistics
Biomedical Engineering
Cell and Molecular Biology
Chemical Engineering Chemistry
Civil Engineering
Computer Engineering
Computer Science
Earth and Planetary Science
Electrical and Electronic Engineering

Electrical Engineering
Industrial and Systems Engineering
Mechanical Engineering
Petroleum Engineering
Petroleum Geosciences Physics
*
KU FACTBOOK 2022/23 23
Undeclared % OF NATIONAL % OF INTERNATIONAL 93% 19% 87% 76% 95% 27% 86% 86% 83% 86% 100% 90% 95% 90% 95% 88% 23% 81% 7% 81% 13% 24% 5% 73% 14% 14% 17% 14% 0% 10% 5% 10% 5% 13% 77% 19%
Freshman and exchange incoming students
Fall 2022/23 Bachelor’s Student Enrollment by Program and CGPA Distribution*
KU FACTBOOK 2022/23 24
Bachelor's Programs CGPA <2 Total % of CGPA <2 CGPA 2-3 Total % of CGPA 2-3 CGPA 3-4 Total % of CGPA 3-4 Grand Total Aerospace Engineering 15 5% 163 57% 107 38% 285 Applied Mathematics and Statistics 1 2% 21 34% 40 65% 62 Biomedical Engineering 19 5% 175 45% 194 50% 388 Cell and Molecular Biology 4 6% 28 40% 38 54% 70 Chemical Engineering 20 5% 191 50% 174 45% 385 Chemistry 1 2% 22 39% 33 59% 56 Civil Engineering 2 2% 47 57% 33 40% 82 Computer Engineering 14 4% 158 47% 165 49% 337 Computer Science 8 6% 60 44% 69 50% 137 Earth and Planetary Science 0 0% 7 50% 7 50% 14 Electrical and Electronic Engineering 0 0% 1 100% 0 0% 1 Electrical Engineering 13 5% 124 51% 107 44% 244 Industrial and Systems Engineering 6 4% 84 55% 63 41% 153 Mechanical Engineering 10 5% 122 56% 87 40% 219 Petroleum Engineering 0 0% 14 67% 7 33% 21 Petroleum Geosciences 0 0% 6 75% 2 25% 8 Physics 0 0% 11 29% 27 71% 38 Undeclared 14 21% 29 43% 24 36% 67 Total 127 5% 1,263 49% 1,177 46% 2,567 - Phasing out program
Fall 2022/23 Enrollment
Bachelor’s Students - Program and CGPA Distribution (%)
* New students and Preparatory risers are excluded as CGPA is as of the beginning of Fall 2022/23.
KU FACTBOOK 2022/23 25
Engineering
Engineering
and Molecular
Chemical Engineering Chemistry Civil Engineering Computer Engineering Computer
and Planetary
Electronic
Electrical Engineering
and
Physics Undeclared 5% 2% 5% 6% 5% 2% 2% 4% 6% 0% 0% 5% 4% 5% 0% 0% 0% 21% 57% 34% 45% 40% 50% 39% 57% 47% 44% 50% 100% 51% 55% 56% 67% 75% 29% 43% 38% 65% 50% 54% 45% 59% 40% 49% 50% 50% 0% 44% 41% 40% 33% 25% 71% 36% % OF CGPA <2 % OF CGPA 2-3 % OF CGPA 3-4
Aerospace
Applied Mathematics and Statistics Biomedical
Cell
Biology
Science Earth
Science Electrical and
Engineering
Industrial
Systems Engineering Mechanical Engineering Petroleum Engineering Petroleum Geosciences
Fall 2022/23 Undergraduate Student Enrollment from Vocational Schools*
*Undergraduate includes Bachelor’s and Preparatory students
FALL 2022/23 POSTGRADUATE STUDENT ENROLLMENT
Fall 2022/23 Postgraduate Nationals by Home Emirate
KU FACTBOOK 2022/23 26 Percentage
Undergraduate Student Enrollment from vocational school 14%
Fall 2022/23 Enrollment Master’s National Students - Home Emirate (%) 69% 3% 9% 7% 5% 7% 0.4% Master's National Students - Home Emirate Number of Students Percentage Abu Dhabi 187 69% Ajman 7 3% Dubai 25 9% Fujairah 18 7% Ras Al Khaimah 13 5% Sharjah 19 7% Umm Al-Quwain 1 0.4% Total 270 100%
KU FACTBOOK 2022/23 27 Fall 2022/23 Enrollment Doctor of Philosophy National Students - Home Emirate (%) 64% 1% 4% 14% 10% 6% 0% Doctor of Philosophy National Students - Home Emirate Number of Students Percentage Abu Dhabi 44 64% Ajman 1 1% Dubai 3 4% Fujairah 10 14% Ras Al Khaimah 7 10% Sharjah 4 6% Umm Al-Quwain 0 0% Total 69 100%
KU FACTBOOK 2022/23 28 Doctor of Medicine National Students - Home Emirate Number of Students Percentage Abu Dhabi 39 66% Ajman 0 0% Dubai 8 14% Fujairah 2 3% Ras Al Khaimah 4 7% Sharjah 6 10% Umm Al-Quwain 0 0% Total 59 100% Fall 2022/23 Enrollment Doctor of Medicine National Students - Home Emirate (%) 66% 0% 14% 3% 7% 10% 0%
Fall 2022/23 Postgraduate Student Enrollment by Gender
Fall 2022/23 Enrollment
Master’s Students - Gender (%)
Fall 2022/23 Enrollment
Fall 2022/23 Enrollment
KU FACTBOOK 2022/23 29 Master's Students - Gender Number of Students Percentage Male 285 53% Female 249 47% Total 534 100%
Doctor of Philosophy Students - Gender (%)
Doctor of Philosophy Students - Gender Number of Students Percentage Male 274 59% Female 192 41% Total 466 100% Doctor of Medicine Students - Gender Number of Students Percentage Male 45 31% Female 99 69% Total 144 100% 53% 47% 59% 41% 31% 69%
Doctor of Medicine Students - Gender (%)
Fall 2022/23 Postgraduate Student Enrollment by
KU FACTBOOK 2022/23 30
Nationality Master's Students - Nationality Number of Students Percentage National 270 51% International 264 49% Total 534 100% Doctor of Philosophy Students - Nationality Number of Students Percentage National 69 15% International 397 85% Total 466 100% Doctor of Medicine Students - Nationality Number of Students Percentage National 59 41% International 85 59% Total 144 100%
Enrollment Master’s Students - Nationality (%)
Enrollment Doctor of Philosophy Students - Nationality (%)
Enrollment Doctor of Medicine Students - Nationality (%) 51% 49% 15% 85% 41% 59%
Fall 2022/23
Fall 2022/23
Fall 2022/23
Fall 2022/23 Postgraduate Student Enrollment
by Age Group Distribution and Gender
Fall 2022/23 Enrollment
Master’s Students - Age Group Distribution and Gender
KU FACTBOOK 2022/23 31 Master’s StudentsGender Age Group 20-24 Years Old Total % of Age Group 20-24 Years Old Age Group 25-29 Years Old Total % of Age Group 25-29 Years Old Age Group 30-34 Years Old Total % of Age Group 3034 Years Old Age Group 35-39 Years Old Total % of Age Group 35-39 Years Old Age Group 40-45 Years Old Total % of Age Group 40-45 Years Old Grand Total Male 142 50% 119 42% 19 7% 4 1% 1 0.4% 285 Female 136 55% 98 39% 12 5% 3 1% 0 0% 249 Total 278 52% 217 41% 31 6% 7 1% 1 0.2% 534
% of Age
20-24 Years Old % of Age Group 25-29 Years Old % of Age Group 30-34 Years Old % of Age Group 35-39 Years Old % of Age Group 40-45 Years Old 50% 55% 42% 39% 7% 5% 1% 1% 0.4% 0%
Group
Fall 2022/23 Enrollment
Doctor of Philosophy Students - Age Group Distribution and Gender (%)
% of Age Group 20-24 Years Old
% of Age Group 25-29 Years Old
% of Age Group 30-34 Years Old
% of Age Group 35-39 Years Old
% of Age Group 40-44 Years Old % of Age Group 45-49 Years Old % of Age Group 50-54 Years Old
KU FACTBOOK 2022/23 32 0% 0% 0.4% 0.5% Doctor of Philosophy StudentsGender Age Group 20-24 Years Old Total % of Age Group 20-24 Years Old Age Group 25-29 Years Old Total % of Age Group 25-29 Years Old Age Group 30-34 Years Old Total % of Age Group 30-34 Years Old Age Group 35-39 Years Old Total % of Age Group 35-39 Years Old Age Group 40-44 Years Old Total % of Age Group 40-44 Years Old Age Group 45-49 Years Old Total % of Age Group 45-49 Years Old Age Group 50-54 Years Old Total % of Age Group 50-54 Years Old Age Group 55-60 Years Old Total % of Age Group 55-60 Years Old Grand Total Male 16 6% 134 49% 93 34% 27 10% 3 1% 0 0% 0 0% 1 0.4% 274 Female 14 7% 101 53% 59 31% 11 6% 5 3% 1 0.5% 0 0% 1 0.5% 192 Total 30 6% 235 50% 152 33% 38 8% 8 2% 1 0.2% 0 0% 2 0.4% 466
6% 7% 1% 3% 0% 0.5% 49% 53% 34% 31% 10% 6%
% of Age Group 55-60 Years Old
KU FACTBOOK 2022/23 33 Doctor of Medicine Students - Gender Age Group 20-24 Years Old Total % of Age Group 20-24 Years Old Age Group 25-29 Years Old Total % of Age Group 25-29 Years Old Age Group 30-34 Years Old Total % of Age Group 30-34 Years Old Grand Total Male 22 49% 20 44% 3 7% 45 Female 38 38% 53 54% 8 8% 99 Total 60 42% 73 51% 11 8% 144 Fall 2022/23 Enrollment Doctor of Medicine Students - Age Group Distribution and Gender (%) % of Age Group 20-24 Years Old % of Age Group 25-29 Years Old % of Age Group 30-34 Years Old 49% 38% 44% 54% 7% 8%
Fall 2022/23 Postgraduate Student Enrollment by Program
KU FACTBOOK 2022/23 34
Master's Programs Number of Students Percentage Aerospace Engineering 16 3% Applied Chemistry 15 3% Biomedical Engineering 25 5% Chemical Engineering 50 9% Civil and Infrastructural Engineering 19 4% Computational Data Science 19 4% Computer Science 28 5% Cyber Security 7 1% Electrical and Computer Engineering 59 11% Engineering Systems and Management 75 14% Health, Safety and Environmental Engineering 19 4% International and Civil Security 24 4% Materials Science and Engineering 22 4% Mechanical Engineering 74 14% Medical Physics 5 1% Nuclear Engineering 12 2% Petroleum Engineering 12 2% Petroleum Geosciences 10 2% Sustainable Critical infrastructure 16 3% Undeclared* 13 2% Water and Environmental Engineering 14 3% Total 534 100%
Fall 2022/23 Enrollment Master’s Students - Program (%)


KU FACTBOOK 2022/23 35
Aerospace Engineering Applied Chemistry Biomedical Engineering Chemical Engineering Civil and Infrastructural Engineering Computational Data Science Computer Science Cyber Security Electrical and Computer Engineering Engineering Systems and Management Health, Safety and Environmental Engineering International and Civil Security Materials Science and Engineering Mechanical Engineering Medical Physics Nuclear Engineering Petroleum Engineering Petroleum Geosciences Sustainable Critical infrastructure Undeclared* Water and Environmental Engineering 3% 3% 5% 9% 4% 4% 5% 1% 11% 14% 4% 4% 4% 14% 1% 2% 2% 2% 3% 2% 3%
KU FACTBOOK 2022/23 36 Doctor of Philosophy Programs Number of Students Percentage Chemistry 20 4% Earth Sciences 18 4% Interdisciplinary Engineering 2 0.43% Mathematics 14 3% Petroleum Geosciences 4 1% PhD in Engineering 388 83% Physics 18 4% Undeclared* 2 0.43% Total 466 100%
Enrollment Doctor
Philosophy
(%) 4% 4% 0.43% 3% 1% 83% 4% 0.43%
- Phasing out program
Fall 2022/23
of
Students - Program
* Exchange incoming students

Fall 2022/23 Postgraduate Student Enrollment by Program
and Gender
KU FACTBOOK 2022/23 38
Master's Programs Male Total % of Male Female Total % of Female Grand Total Aerospace Engineering 8 50% 8 50% 16 Applied Chemistry 7 47% 8 53% 15 Biomedical Engineering 6 24% 19 76% 25 Chemical Engineering 27 54% 23 46% 50 Civil and Infrastructural Engineering 11 58% 8 42% 19 Computational Data Science 17 89% 2 11% 19 Computer Science 16 57% 12 43% 28 Cyber Security 3 43% 4 57% 7 Electrical and Computer Engineering 39 66% 20 34% 59 Engineering Systems and Management 30 40% 45 60% 75 Health, Safety and Environmental Engineering 6 32% 13 68% 19 International and Civil Security 11 46% 13 54% 24 Materials Science and Engineering 6 27% 16 73% 22 Mechanical Engineering 53 72% 21 28% 74 Medical Physics 2 40% 3 60% 5 Nuclear Engineering 7 58% 5 42% 12 Petroleum Engineering 9 75% 3 25% 12 Petroleum Geosciences 8 80% 2 20% 10 Sustainable Critical infrastructure 3 19% 13 81% 16 Undeclared* 11 85% 2 15% 13 Water and Environmental Engineering 5 36% 9 64% 14 Total 285 53% 249 47% 534
Fall 2022/23 Enrollment Master’s Students - Program and Gender (%)
infrastructure Undeclared*
Water and Environmental Engineering

KU FACTBOOK 2022/23 39 50% 47% 24% 54% 58% 89% 57% 43% 66% 40% 32% 46% 27% 72% 40% 58% 75% 80% 19% 85% 36% 50% 53% 76% 46% 42% 11% 43% 57% 34% 60% 68% 54% 73% 28% 60% 42% 25% 20% 81% 15% 64% % OF MALE % OF FEMALE
Aerospace Engineering Applied Chemistry Biomedical Engineering Chemical Engineering Civil and Infrastructural Engineering Computational Data Science Computer Science Cyber Security Electrical and Computer Engineering
and
Engineering Systems
Management
Health, Safety and Environmental Engineering International and Civil Security Materials Science and Engineering Mechanical Engineering Medical Physics Nuclear Engineering Petroleum Engineering Petroleum Geosciences Sustainable Critical
KU FACTBOOK 2022/23 40 Doctor of Philosophy Programs Male Total % of Male Female Total % of Female Grand Total Chemistry 5 25% 15 75% 20 Earth Sciences 11 61% 7 39% 18 Interdisciplinary Engineering 0 0% 2 100% 2 Mathematics 11 79% 3 21% 14 Petroleum Geosciences 2 50% 2 50% 4 PhD in Engineering 234 60% 154 40% 388 Physics 10 56% 8 44% 18 Undeclared* 1 50% 1 50% 2 Total 274 59% 192 41% 466 Fall 2022/23 Enrollment Doctor of Philosophy Students - Program and Gender (%) Chemistry Earth Sciences Interdisciplinary Engineering Mathematics Petroleum Geosciences PhD in Engineering Physics Undeclared* % OF MALE % OF FEMALE 25% 75% 61% 39% 79% 21% 50% 50% 60% 40% 56% 44% 50% 50% 0% 100%
- Phasing out program
* Exchange incoming students
Fall 2022/23 Postgraduate Student Enrollment by Program and Nationality
KU FACTBOOK 2022/23 42
Master's Programs National Total % of National International Total % of International Grand Total Aerospace Engineering 5 31% 11 69% 16 Applied Chemistry 2 13% 13 87% 15 Biomedical Engineering 15 60% 10 40% 25 Chemical Engineering 24 48% 26 52% 50 Civil and Infrastructural Engineering 1 5% 18 95% 19 Computational Data Science 19 100% 0 0% 19 Computer Science 13 46% 15 54% 28 Cyber Security 7 100% 0 0% 7 Electrical and Computer Engineering 20 34% 39 66% 59 Engineering Systems and Management 60 80% 15 20% 75 Health, Safety and Environmental Engineering 19 100% 0 0% 19 International and Civil Security 24 100% 0 0% 24 Materials Science and Engineering 15 68% 7 32% 22 Mechanical Engineering 14 19% 60 81% 74 Medical Physics 1 20% 4 80% 5 Nuclear Engineering 12 100% 0 0% 12 Petroleum Engineering 1 8% 11 92% 12 Petroleum Geosciences 4 40% 6 60% 10 Sustainable Critical infrastructure 8 50% 8 50% 16 Undeclared* 0 0% 13 100% 13 Water and Environmental Engineering 6 43% 8 57% 14 Total 270 51% 264 49% 534
Fall 2022/23 Enrollment Master’s Students - Program and Nationality (%)
Chemistry Biomedical Engineering
Engineering Civil and Infrastructural Engineering
Computational Data Science Computer Science Cyber Security
Electrical and Computer Engineering
Engineering Systems and Management
Health, Safety and Environmental Engineering
International and Civil Security
Materials Science and Engineering
Mechanical Engineering
Medical Physics
Nuclear Engineering
Petroleum Engineering
Petroleum Geosciences
Sustainable Critical infrastructure Undeclared*
Water and Environmental Engineering
KU FACTBOOK 2022/23 43 31% 13% 60% 48% 5% 100% 46% 100% 34% 80% 100% 100% 68% 19% 20% 100% 8% 40% 50% 0% 43% 69% 87% 40% 52% 95% 0% 54% 0% 66% 20% 0% 0% 32% 81% 80% 0% 92% 60% 50% 100% 57% % OF NATIONAL % OF INTERNATIONAL
Applied
Aerospace Engineering
Chemical
KU FACTBOOK 2022/23 44 Doctor of Philosophy Programs National Total % of National International Total % of International Grand Total Chemistry 0 0% 20 100% 20 Earth Sciences 0 0% 18 100% 18 Interdisciplinary Engineering 2 100% 0 0% 2 Mathematics 0 0% 14 100% 14 Petroleum Geosciences 0 0% 4 100% 4 PhD in Engineering 65 17% 323 83% 388 Physics 2 11% 16 89% 18 Undeclared* 0 0% 2 100% 2 Total 69 15% 397 85% 466 Fall 2022/23 Enrollment Doctor of Philosophy Students - Program and Nationality (%) % OF NATIONAL % OF INTERNATIONAL Chemistry Earth Sciences Interdisciplinary Engineering Mathematics Petroleum Geosciences PhD in Engineering Physics Undeclared* 0% 100% 100% 0% 0% 100% 0% 100% 0% 100% 0% 100% 17% 83% 11% 89%
- Phasing out program
* Exchange incoming students
Fall 2022/23 Postgraduate Student Enrollment by Program and CGPA Distribution*
KU FACTBOOK 2022/23 46
Master's Programs CGPA <2 Total % of CGPA <2 CGPA 2-3 Total % of CGPA 2-3 CGPA 3-4 Total % of CGPA 3-4 Grand Total Aerospace Engineering 0 0% 2 22% 7 78% 9 Applied Chemistry 0 0% 2 15% 11 85% 13 Biomedical Engineering 0 0% 2 11% 16 89% 18 Chemical Engineering 0 0% 2 6% 30 94% 32 Civil and Infrastructural Engineering 0 0% 0 0% 14 100% 14 Computational Data Science 0 0% 0 0% 14 100% 14 Computer Science 0 0% 2 9% 21 91% 23 Cyber Security 0 0% 0 0% 4 100% 4 Electrical and Computer Engineering 0 0% 3 7% 38 93% 41 Engineering Systems and Management 0 0% 0 0% 56 100% 56 Health, Safety and Environmental Engineering 0 0% 0 0% 13 100% 13 International and Civil Security 0 0% 1 6% 17 94% 18 Materials Science and Engineering 0 0% 0 0% 17 100% 17 Mechanical Engineering 0 0% 1 2% 42 98% 43 Nuclear Engineering 0 0% 0 0% 9 100% 9 Petroleum Engineering 0 0% 0 0% 10 100% 10 Petroleum Geosciences 0 0% 0 0% 8 100% 8 Sustainable Critical infrastructure 0 0% 0 0% 9 100% 9 Water and Environmental Engineering 0 0% 1 13% 7 88% 8 Total 0 0% 16 4% 343 96% 359
Fall 2022/23 Enrollment Master’s Students - Program and CGPA Distribution (%)
Health, Safety and Environmental Engineering International and Civil Security
Materials Science and Engineering
Mechanical Engineering
Nuclear Engineering


Petroleum Engineering
Petroleum Geosciences
Sustainable Critical infrastructure
Water and Environmental Engineering
KU FACTBOOK 2022/23 47 0% 0% 0% 0% 0% 0% 0% 0% 0% 0% 0% 0% 0% 0% 0% 0% 0% 0% 0% 22% 15% 11% 6% 0% 0% 9% 0% 7% 0% 0% 6% 0% 2% 0% 0% 0% 0% 13% 78% 85% 89% 94% 100% 100% 91% 100% 93% 100% 100% 94% 100% 98% 100% 100% 100% 100% 88% % OF CGPA <2 % OF CGPA 2-3 % OF CGPA 3-4
Aerospace Engineering Applied Chemistry Biomedical Engineering Chemical Engineering Civil and Infrastructural Engineering Computational Data Science Computer Science Cyber Security Electrical and Computer Engineering Engineering
Systems and Management
Fall
*New students are excluded as CGPA is as of the beginning of Fall 2022/23s
KU FACTBOOK 2022/23 48 Doctor of Philosophy Programs CGPA <2 Total % of CGPA <2 CGPA 2-3 Total % of CGPA 2-3 CGPA 3-4 Total % of CGPA 3-4 Grand Total Chemistry 0 0% 1 7% 14 93% 15 Earth Sciences 0 0% 1 7% 13 93% 14 Interdisciplinary Engineering 0 0% 0 0% 2 100% 2 Mathematics 0 0% 0 0% 13 100% 13 Petroleum Geosciences 0 0% 0 0% 4 100% 4 PhD in Engineering 1 0.32% 2 1% 306 99% 309 Physics 0 0% 0 0% 9 100% 9 Total 1 0% 4 1% 361 99% 366
CGPA
0% 0% 0% 0% 0% 0.32% 0% 7% 7% 0% 0% 0% 1% 0% 93% 93% 100% 100% 100% 99% 100% Chemistry Earth Sciences Interdisciplinary Engineering Mathematics Petroleum Geosciences PhD in Engineering Physics % OF CGPA <2 % OF CGPA 2-3 % OF CGPA 3-4
2022/23 Enrollment Doctor of Philosophy Students - Program and
Distribution (%)
- Phasing out program
2021/22 GRADUATES
KU FACTBOOK 2022/23 49
699 Graduates in Academic Year 2021/22 Fall 2021, Spring 2022 and Summer 2022 Level Number of Graduates Percentage Bachelor's 499 71% Master's 184 26% Doctor of Philosophy 16 2% Total 699 100% 2021/22 Graduates by Level 2021/22 GraduatesLevel (%) 71% 26% 2%
GRADUATES 699
2021/22 Graduates by Level and Gender
KU FACTBOOK 2022/23 50 Level Male Total % of Male Female Total % of Female Grand Total Bachelor's 182 36% 317 64% 499 Master's 90 49% 94 51% 184 Doctor of Philosophy 5 31% 11 69% 16 Total 277 40% 422 60% 699
2021/22 Graduates - Level and Gender (%) % OF MALE % OF FEMALE 36% 64% 49% 51% 31% 69% Bachelor’s Master’s Doctor of Philosophy
2021/22 Graduates by Level and Nationality
KU FACTBOOK 2022/23 51 Level National Total % of National International Total % of International Grand Total Bachelor's 446 89% 53 11% 499 Master's 68 37% 116 63% 184 Doctor of Philosophy 8 50% 8 50% 16 Total 522 75% 177 25% 699
2021/22 Graduates - Level and Nationality (%) % OF NATIONAL % OF INTERNATIONAL 89% 11% 37% 63% 50% 50% Bachelor’s Master’s Doctor of Philosophy
2021/22 Graduates by Program
KU FACTBOOK 2022/23 52
Bachelor's Graduates Programs Number of Graduates Percentage Aerospace Engineering 53 11% Applied Mathematics and Statistics 12 2% Biomedical Engineering 40 8% Chemical Engineering 104 21% Chemistry 5 1% Civil Engineering 35 7% Computer Engineering 45 9% Electrical and Electronic Engineering 8 2% Electrical Engineering 59 12% Industrial and Systems Engineering 42 8% Mechanical Engineering 67 13% Petroleum Engineering 18 4% Petroleum Geosciences 9 2% Physics 2 0.4% Total 499 100% - Phasing out program
2021/22 Graduates Bachelor’s Programs (%)
KU FACTBOOK 2022/23 53
Aerospace Engineering Applied Mathematics and Statistics Biomedical Engineering Chemical Engineering Chemistry Civil Engineering Computer Engineering Electrical and Electronic Engineering Electrical Engineering Industrial and Systems Engineering Mechanical Engineering Petroleum Engineering Petroleum Geosciences Physics 11% 2% 8% 21% 1% 7% 9% 2% 12% 8% 13% 4% 2% 0.4%
KU FACTBOOK 2022/23 54 Master's Graduates Programs Number of Graduates Percentage Applied Chemistry 5 3% Biomedical Engineering 9 5% Chemical Engineering 9 5% Civil and Infrastructural Engineering 3 2% Computer Science 5 3% Cyber Security 2 1% Electrical and Computer Engineering 28 15% Engineering Systems and Management 28 15% Health, Safety and Environmental Engineering 6 3% International and Civil Security 11 6% Materials Science and Engineering 6 3% Mechanical Engineering 43 23% Nuclear Engineering 4 2% Petroleum Engineering 7 4% Petroleum Geosciences 5 3% Sustainable Critical Infrastructure 3 2% Water and Environmental Engineering 10 5% Total 184 100%
2021/22 Graduates Master’s Programs (%)

KU FACTBOOK 2022/23 55
Applied Chemistry
Engineering
Engineering
Infrastructural Engineering
Cyber
Systems and Management
Safety and Environmental Engineering International and Civil Security Materials Science and Engineering Mechanical Engineering Nuclear Engineering Petroleum Engineering Petroleum Geosciences Sustainable Critical Infrastructure Water and Environmental Engineering 3% 5% 5% 2% 3% 1% 15% 15% 3% 6% 3% 23% 2% 4% 3% 2% 5%
Biomedical
Chemical
Civil and
Computer Science
Security Electrical and Computer Engineering Engineering
Health,
KU FACTBOOK 2022/23 56 Doctor of Philosophy Graduates Programs Number of Graduates Percentage Interdisciplinary Engineering 1 6% PhD in Engineering 15 94% Total 16 100% 2021/22 Graduates Doctor of Philosophy Programs (%) 6% 94% - Phasing out program
2021/22 Graduates by Program and CGPA Distribution
KU FACTBOOK 2022/23 58
Bachelor's Graduates Programs CGPA 2.002.99 Total % of CGPA 2.00-2.99 CGPA 3.00-4.00 Total % of CGPA 3.00-4.00 Grand Total Aerospace Engineering 31 58% 22 42% 53 Applied Mathematics and Statistics 4 33% 8 67% 12 Biomedical Engineering 13 33% 27 68% 40 Chemical Engineering 56 54% 48 46% 104 Chemistry 0 0% 5 100% 5 Civil Engineering 18 51% 17 49% 35 Computer Engineering 17 38% 28 62% 45 Electrical and Electronic Engineering 7 88% 1 13% 8 Electrical Engineering 26 44% 33 56% 59 Industrial and Systems Engineering 24 57% 18 43% 42 Mechanical Engineering 30 45% 37 55% 67 Petroleum Engineering 9 50% 9 50% 18 Petroleum Geosciences 4 44% 5 56% 9 Physics 0 0% 2 100% 2 Total 239 48% 260 52% 499 - Phasing out program
2021/22 Graduates
For Postgraduate degrees, the student should achieve a minimum overall CGPA of 3.0 in order to graduate.
KU FACTBOOK 2022/23 59
Aerospace Engineering Applied Mathematics and Statistics Biomedical Engineering Chemical Engineering Chemistry Civil Engineering Computer Engineering Electrical and Electronic Engineering Electrical Engineering Industrial and Systems Engineering Mechanical Engineering Petroleum Engineering Petroleum Geosciences Physics 58% 33% 33% 54% 0% 51% 38% 88% 44% 57% 45% 50% 44% 0% 42% 67% 68% 46% 100% 49% 62% 13% 56% 43% 55% 50% 56% 100%
Bacheclor’s Programs - Program and CGPA Distribution (%)
% OF CGPA 2.00-2.99 % OF CGPA 3.00-4.00
FALL 2022/23 FACULTY
KU FACTBOOK 2022/23 60
College Number of Faculty College of Arts and Sciences 166 College of Engineering 205 College of Medicine & Health Sciences 29 Total 400 Fall 2022/23 Faculty by College Fall 2022/23 FacultyCollege (Number) 166 205 29
Fall 2022/23 Faculty by Academic Department
Fall 2022/23 Faculty
KU FACTBOOK 2022/23 61
College of Arts & Sciences - Academic Department (%) 3% 13% 8% 13% 16% 23% 12% 12%
College of Arts and Sciences Academic Departments Number of Faculty Percentage Biology 5 3% Chemistry 22 13% Earth Sciences 13 8% English 22 13% Humanities and Social Sciences 26 16% Mathematics 38 23% Physics 20 12% Preparatory Program 20 12% Total 166 100%
KU FACTBOOK 2022/23 62 College of Engineering Academic Departments Number of Faculty Percentage Aerospace Engineering 15 7% Biomedical Engineering 12 6% Chemical Engineering 29 14% Civil Infrastructure and Environmental Engineering 15 7% Electrical Engineering and Computer Science 64 31% Industrial and Systems Engineering 14 7% Mechanical Engineering 42 20% Nuclear Engineering 6 3% Petroleum Engineering 8 4% Total 205 100% Fall 2022/23 Faculty College of Engineering - Academic Department (%) 7% 6% 14% 7% 31% 7% 20% 3% 4% Aerospace Engineering Biomedical Engineering Chemical Engineering Civil Infrastructure and Environmental Engineering Electrical Engineering and Computer Science Industrial and Systems Engineering Mechanical Engineering Nuclear Engineering Petroleum Engineering
*One faculty member is affiliated to the college management team not the academic departments.
KU FACTBOOK 2022/23 63 College of Medicine and Health Sciences Academic Departments* Number of Faculty Percentage Anatomy and Cellular Biology 3 11% Anesthesiology 1 4% Epidemiology and Population Health 3 11% Family Medicine 1 4% Medicine 2 7% Molecular Biology and Genetics 6 21% Neurology 1 4% Pathology and Infectious Disease 1 4% Pediatrics 1 4% Pharmacology 5 18% Physiology and Immunology 4 14% Total 28 100% Fall 2022/23 Faculty College of Medicine and Health Sciences - Academic Department (%)
11% 4% 11% 4% 7% 21% 4% 4% 4% 18% 14% Anatomy and Cellular Biology Anesthesiology Epidemiology and Population Health Family Medicine Medicine Molecular Biology and Genetics Neurology Pathology and Infectious Disease Pediatrics Pharmacology Physiology and Immunology
Fall 2022/23 Faculty by College and Faculty Rank
Fall 2022/23 College of Arts & Sciences Faculty Rank (%)
KU FACTBOOK 2022/23 64 College of Arts and Sciences - Faculty Rank Number of Faculty Percentage Lecturer 17 10% Senior Lecturer 32 19% Assistant Professor 51 31% Associate Professor 42 25% Professor 24 14% Total 166 100%
10% 19% 31% 25% 14%
KU FACTBOOK 2022/23 65 College of Engineering - Faculty Rank Number of Faculty Percentage Lecturer 1 0.5% Senior Lecturer 4 2% Assistant Professor 44 21% Associate Professor 83 40% Professor 73 36% Total 205 100% Fall 2022/23 College of Engineering Faculty Rank (%) 0.5% 2% 21% 40% 36%
KU FACTBOOK 2022/23 66 College of Medicine and Health Sciences - Faculty Rank Number of Faculty Percentage Lecturer 1 3% Senior Lecturer 0 0% Assistant Professor 10 34% Associate Professor 6 21% Professor 12 41% Total 29 100% Fall 2022/23 College of Medicine and Health Sciences Faculty Rank (%) 3% 0% 34% 21% 41%
Fall 2022/23 Faculty by Academic Department and Faculty Rank
KU FACTBOOK 2022/23 68 College of Arts and Sciences Academic Departments Lecturer Total % of Lecturer Senior Lecturer Total % of Senior Lecturer Assistant Professor Total % of Assistant Professor Associate Professor Total % of Associate Professor Professor Total % of Professor Grand Total Biology 0 0% 1 20% 2 40% 2 40% 0 0% 5 Chemistry 2 9% 0 0% 10 45% 6 27% 4 18% 22 Earth Sciences 0 0% 0 0% 5 38% 4 31% 4 31% 13 English 3 14% 6 27% 7 32% 6 27% 0 0% 22 Humanities and Social Sciences 3 12% 2 8% 10 38% 5 19% 6 23% 26 Mathematics 5 13% 7 18% 8 21% 10 26% 8 21% 38 Physics 0 0% 0 0% 9 45% 9 45% 2 10% 20 Preparatory Program 4 20% 16 80% 0 0% 0 0% 0 0% 20 Total 17 10% 32 19% 51 31% 42 25% 24 14% 166
Fall 2022/23 College of Arts & Sciences


Faculty Rank - Academic Department (%)

KU FACTBOOK 2022/23 69
BIOLOGY CHEMISTRY EARTH SCIENCES ENGLISH HUMANITIES AND SOCIAL SCIENCES MATHEMATICS PHYSICS PREPARATORY PROGRAM 0% 9% 0% 14% 12% 13% 0% 20% 20% 0% 0% 27% 8% 18% 0% 80% 40% 45% 38% 32% 38% 21% 45% 0% 40% 27% 31% 27% 19% 26% 45% 0% 0% 18% 31% 0% 23% 21% 10% 0% % OF LECTURER % OF SENIOR LECTURER % OF ASSISTANT PROFESSOR % OF ASSOCIATE PROFESSOR % OF PROFESSOR
KU FACTBOOK 2022/23 70 College of Engineering Academic Departments Lecturer Total % of Lecturer Senior Lecturer Total % of Senior Lecturer Assistant Professor Total % of Assistant Professor Associate Professor Total % of Associate Professor Professor Total % of Professor Grand Total Aerospace Engineering 0 0% 1 7% 4 27% 6 40% 4 27% 15 Biomedical Engineering 0 0% 0 0% 4 33% 3 25% 5 42% 12 Chemical Engineering 0 0% 1 3% 8 28% 10 34% 10 34% 29 Civil Infrastructure and Environmental Engineering 1 7% 0 0% 6 40% 3 20% 5 33% 15 Electrical Engineering and Computer Science 0 0% 1 2% 12 19% 26 41% 25 39% 64 Industrial and Systems Engineering 0 0% 1 7% 2 14% 5 36% 6 43% 14 Mechanical Engineering 0 0% 0 0% 4 10% 22 52% 16 38% 42 Nuclear Engineering 0 0% 0 0% 2 33% 2 33% 2 33% 6 Petroleum Engineering 0 0% 0 0% 2 25% 6 75% 0 0% 8 Total 1 0.5% 4 2% 44 21% 83 40% 73 36% 205
Fall 2022/23 College of Engineering
Faculty Rank - Academic Department (%)
KU FACTBOOK 2022/23 71
AEROSPACE ENGINEERING BIOMEDICAL ENGINEERING CHEMICAL ENGINEERING CIVIL INFRASTRUCTURE AND ENVIRONMENTAL ENGINEERING ELECTRICAL ENGINEERING AND COMPUTER SCIENCE INDUSTRIAL AND SYSTEMS ENGINEERING MECHANICAL ENGINEERING NUCLEAR ENGINEERING PETROLEUM ENGINEERING 0% 0% 0% 7% 0% 0% 0% 0% 0% 7% 0% 3% 0% 2% 7% 0% 0% 0% 27% 33% 28% 40% 19% 14% 10% 33% 25% 40% 25% 34% 20% 41% 36% 52% 33% 75% 27% 42% 34% 33% 39% 43% 38% 33% 0% % OF LECTURER % OF SENIOR LECTURER % OF ASSISTANT PROFESSOR % OF ASSOCIATE PROFESSOR % OF PROFESSOR
KU FACTBOOK 2022/23 72 College of Medicine and Health Sciences Academic Departments* Lecturer Total % of Lecturer Senior Lecturer Total % of Senior Lecturer Assistant Professor Total % of Assistant Professor Associate Professor Total % of Associate Professor Professor Total % of Professor Grand Total Anatomy and Cellular Biology 0 0% 0 0% 2 67% 0 0% 1 33% 3 Anesthesiology 0 0% 0 0% 0 0% 0 0% 1 100% 1 Epidemiology and Population Health 0 0% 0 0% 1 33% 2 67% 0 0% 3 Family Medicine 0 0% 0 0% 1 100% 0 0% 0 0% 1 Medicine 0 0% 0 0% 0 0% 1 50% 1 50% 2 Molecular Biology and Genetics 0 0% 0 0% 2 33% 1 17% 3 50% 6 Neurology 0 0% 0 0% 0 0% 0 0% 1 100% 1 Pathology and Infectious Disease 0 0% 0 0% 0 0% 0 0% 1 100% 1 Pediatrics 0 0% 0 0% 1 100% 0 0% 0 0% 1 Pharmacology 1 20% 0 0% 1 20% 1 20% 2 40% 5 Physiology and Immunology 0 0% 0 0% 2 50% 1 25% 1 25% 4 Total 1 4% 0 0% 10 36% 6 21% 11 39% 28
Fall 2022/23 College of Medicine and Health Sciences Faculty Rank - Academic Department (%)
ANATOMY AND CELL BIOLOGY
ANESTHESIOLOGY

EPIDEMIOLOGY AND POPULATION HEALTH

FAMILY MEDICINE

MEDICINE
MOLECULAR BIOLOGY AND GENETICS

NEUROLOGY

PATHOLOGY AND INFECTIOUS DISEASE
PEDIATRICS
PHARMACOLOGY

PHYSIOLOGY AND IMMUNOLOGY
*One faculty member is affiliated to the college management team not the academic departments

KU FACTBOOK 2022/23 73
% OF LECTURER % OF SENIOR LECTURER % OF ASSISTANT PROFESSOR % OF ASSOCIATE PROFESSOR % OF PROFESSOR
0% 0% 0% 0% 0% 0% 0% 0% 0% 20% 0% 0% 0% 0% 0% 0% 0% 0% 0% 0% 0% 0% 67% 0% 33% 100% 0% 33% 0% 0% 100% 20% 50% 0% 0% 67% 0% 50% 17% 0% 0% 0% 20% 25% 33% 100% 0% 0% 50% 50% 100% 100% 0% 40% 25%
Fall 2022/23 Faculty by College and Age Group Distribution
Fall 2022/23 Faculty
KU FACTBOOK 2022/23 74
Age Group Distribution - College (%) % of Age Group 30-39 Years Old % of Age Group 40-49 Years Old % of Age Group 50-59 Years Old % of Age Group 60-69 Years Old % of Age Group 70-79 Years Old 10% 19% 14% 43% 37% 34% 27% 25% 24% 19% 20% 24% 1% 0% 3% College Age Group 30-39 Years Old Total % of Age Group 30-39 Years Old Age Group 40-49 Years Old Total % of Age Group 40-49 Years Old Age Group 50-59 Years Old Total % of Age Group 50-59 Years Old Age Group 60-69 Years Old Total % of Age Group 60-69 Years Old Age Group 70-79 Years Old Total % of Age Group 70-79 Years Old Grand Total College of Arts and Sciences 17 10% 71 43% 45 27% 31 19% 2 1% 166 College of Engineering 38 19% 75 37% 51 25% 41 20% 0 0% 205 College of Medicine and Health Sciences 4 14% 10 34% 7 24% 7 24% 1 3% 29 Total 59 15% 156 39% 103 26% 79 20% 3 1% 400
Fall 2022/23 Faculty by Academic Department and Age Group Distribution
Fall 2022/23 College of Arts & Sciences Faculty
KU FACTBOOK 2022/23 75 College of Arts and Sciences Academic Departments Age Group 30-39 Years Old Total % of Age Group 30-39 Years Old Age Group 40-49 Years Old Total % of Age Group 40-49 Years Old Age Group 50-59 Years Old Total % of Age Group 50-59 Years Old Age Group 60-69 Years Old Total % of Age Group 60-69 Years Old Age Group 70-79 Years Old Total % of Age Group 70-79 Years Old Grand Total Biology 1 20% 4 80% 0 0% 0 0% 0 0% 5 Chemistry 6 27% 12 55% 2 9% 2 9% 0 0% 22 Earth Sciences 2 15% 6 46% 1 8% 3 23% 1 8% 13 English 1 5% 8 36% 7 32% 5 23% 1 5% 22 Humanities and Social Sciences 0 0% 11 42% 10 38% 5 19% 0 0% 26 Mathematics 4 11% 14 37% 9 24% 11 29% 0 0% 38 Physics 2 10% 7 35% 8 40% 3 15% 0 0% 20 Preparatory Program 1 5% 9 45% 8 40% 2 10% 0 0% 20 Total 17 10% 71 43% 45 27% 31 19% 2 1% 166
% of Age Group 30-39 Years Old % of Age Group 40-49 Years Old % of Age Group 50-59 Years Old % of Age Group 60-69 Years Old % of Age Group 70-79 Years Old 20% 27% 15% 5% 0% 11% 10% 5% 80% 55% 46% 36% 42% 37% 35% 45% 0% 9% 8% 32% 38% 24% 40% 40% 0% 9% 23% 23% 19% 29% 15% 10% 0% 0% 8% 5% 0% 0% 0% 0%
Age Group Distribution - Academic Department (%)
KU FACTBOOK 2022/23 76 College of Engineering Academic Departments Age Group 30-39 Years Old Total % of Age Group 30-39 Years Old Age Group 40-49 Years Old Total % of Age Group 40-49 Years Old Age Group 50-59 Years Old Total % of Age Group 50-59 Years Old Age Group 60-69 Years Old Total % of Age Group 60-69 Years Old Age Group 70-79 Years Old Total % of Age Group 70-79 Years Old Grand Total Aerospace Engineering 3 20% 5 33% 4 27% 3 20% 0 0% 15 Biomedical Engineering 4 33% 1 8% 6 50% 1 8% 0 0% 12 Chemical Engineering 9 31% 12 41% 5 17% 3 10% 0 0% 29 Civil Infrastructure and Environmental Engineering 2 13% 7 47% 3 20% 3 20% 0 0% 15 Electrical Engineering and Computer Science 10 16% 22 34% 17 27% 15 23% 0 0% 64 Industrial and Systems Engineering 1 7% 7 50% 1 7% 5 36% 0 0% 14 Mechanical Engineering 5 12% 17 40% 13 31% 7 17% 0 0% 42 Nuclear Engineering 2 33% 1 17% 2 33% 1 17% 0 0% 6 Petroleum Engineering 2 25% 3 38% 0 0% 3 38% 0 0% 8 Total 38 19% 75 37% 51 25% 41 20% 0 0% 205
Fall 2022/23 College of Engineering Faculty Age Group Distribution - Academic Department (%)
KU FACTBOOK 2022/23 77
of
Old
of
Old 20% 33% 31% 13% 16% 7% 12% 33% 25% 33% 8% 41% 47% 34% 50% 40% 17% 38% 27% 50% 17% 20% 27% 7% 31% 33% 0% 20% 8% 10% 20% 23% 36% 17% 17% 38% 0% 0% 0% 0% 0% 0% 0% 0% 0%
% of Age Group 30-39 Years Old % of Age Group 40-49 Years Old % of Age Group 50-59 Years Old %
Age Group 60-69 Years
%
Age Group 70-79 Years
KU FACTBOOK 2022/23 78 College of Medicine and Health Sciences Academic Departments* Age Group 30-39 Years Old Total % of Age Group 30-39 Years Old Age Group 40-49 Years Old Total % of Age Group 40-49 Years Old Age Group 50-59 Years Old Total % of Age Group 50-59 Years Old Age Group 60-69 Years Old Total % of Age Group 60-69 Years Old Age Group 70-79 Years Old Total % of Age Group 70-79 Years Old Grand Total Anatomy and Cellular Biology 0 0% 2 67% 0 0% 1 33% 0 0% 3 Anesthesiology 0 0% 0 0% 0 0% 1 100% 0 0% 1 Epidemiology and Population Health 0 0% 1 33% 1 33% 1 33% 0 0% 3 Family Medicine 1 100% 0 0% 0 0% 0 0% 0 0% 1 Medicine 0 0% 1 50% 1 50% 0 0% 0 0% 2 Molecular Biology and Genetics 0 0% 2 33% 4 67% 0 0% 0 0% 6 Neurology 0 0% 0 0% 0 0% 1 100% 0 0% 1 Pathology and Infectious Disease 0 0% 0 0% 1 100% 0 0% 0 0% 1 Pediatrics 1 100% 0 0% 0 0% 0 0% 0 0% 1 Pharmacology 2 40% 1 20% 0 0% 2 40% 0 0% 5 Physiology and Immunology 0 0% 3 75% 0 0% 1 25% 0 0% 4 Total 4 14% 10 36% 7 25% 7 25% 0 0% 28
Fall 2022/23 College of Medicine and Health Sciences Faculty Age Group Distribution - Academic Department (%)
% of Age Group 30-39 Years Old
% of Age Group 40-49 Years Old
% of Age Group 50-59 Years Old
% of Age Group 60-69 Years Old
% of Age Group 70-79 Years Old
*One faculty member is affiliated to the college management team not the academic departments.
KU FACTBOOK 2022/23 79
0% 0% 0% 100% 0% 0% 0% 0% 100% 40% 0% 67% 0% 33% 0% 50% 33% 0% 0% 0% 20% 75% 0% 0% 33% 0% 50% 67% 0% 100% 0% 0% 0% 33% 100% 33% 0% 0% 0% 100% 0% 0% 40% 25% 0% 0% 0% 0% 0% 0% 0% 0% 0% 0% 0%
Fall 2022/23 Faculty by College and Gender
KU FACTBOOK 2022/23 80
College Male Total % of Male Female Total % of Female Grand Total College of Arts and Sciences 127 77% 39 23% 166 College of Engineering 187 91% 18 9% 205 College of Medicine and Health Sciences 20 69% 9 31% 29 Total 334 84% 66 17% 400 Fall 2022/23 Faculty Gender Distribution - College (%) % OF MALE % OF FEMALE 77% 23% 91% 9% 69% 31% COLLEGE OF ARTS AND SCIENCES COLLEGE OF ENGINEERING COLLEGE OF MEDICINE AND HEALTH SCIENCES
Fall 2022/23 Faculty by Academic Department and Gender
KU FACTBOOK 2022/23 81 College of Arts and Sciences Departments Male Total % of Male Female Total % of Female Grand Total Biology 4 80% 1 20% 5 Chemistry 13 59% 9 41% 22 Earth Sciences 11 85% 2 15% 13 English 14 64% 8 36% 22 Humanities and Social Sciences 20 77% 6 23% 26 Mathematics 33 87% 5 13% 38 Physics 19 95% 1 5% 20 Preparatory Program 13 65% 7 35% 20 Total 127 77% 39 23% 166
of Arts & Sciences Faculty Gender Distribution - Academic Department (%)
Fall 2022/23 College
BIOLOGY CHEMISTRY EARTH SCIENCES ENGLISH HUMANITIES AND SOCIAL SCIENCES MATHEMATICS PHYSICS PREPARATORY PROGRAM 80% 59% 85% 64% 77% 87% 95% 65% 20% 41% 15% 36% 23% 13% 5% 35% % OF MALE % OF FEMALE
KU FACTBOOK 2022/23 82 College of Engineering Academic Departments Male Total % of Male Female Total % of Female Grand Total Aerospace Engineering 14 93% 1 7% 15 Biomedical Engineering 8 67% 4 33% 12 Chemical Engineering 25 86% 4 14% 29 Civil Infrastructure and Environmental Engineering 11 73% 4 27% 15 Electrical Engineering and Computer Science 62 97% 2 3% 64 Industrial and Systems Engineering 14 100% 0 0% 14 Mechanical Engineering 39 93% 3 7% 42 Nuclear Engineering 6 100% 0 0% 6 Petroleum Engineering 8 100% 0 0% 8 Total 187 91% 18 9% 205 AEROSPACE ENGINEERING BIOMEDICAL ENGINEERING CHEMICAL ENGINEERING CIVIL INFRASTRUCTURE AND ENVIRONMENTAL ENGINEERING ELECTRICAL ENGINEERING AND COMPUTER SCIENCE INDUSTRIAL AND SYSTEMS ENGINEERING MECHANICAL ENGINEERING NUCLEAR ENGINEERING PETROLEUM ENGINEERING 7% 33% 14% 27% 3% 0% 7% 0% 0% 93% 67% 86% 73% 97% 100% 93% 100% 100% Fall 2022/23 College of Engineering Faculty Gender Distribution - Academic Department (%) % OF MALE % OF FEMALE
A ND
*One faculty member is affiliated to the college management team not the academic departments.
KU FACTBOOK 2022/23 83
of Medicine and Health Sciences Academic Departments* Male Total % of Male Female Total % of Female Grand Total Anatomy and Cellular Biology 2 67% 1 33% 3 Anesthesiology 1 100% 0 0% 1 Epidemiology and Population Health 3 100% 0 0% 3 Family Medicine 0 0% 1 100% 1 Medicine 1 50% 1 50% 2 Molecular Biology and Genetics 3 50% 3 50% 6 Neurology 1 100% 0 0% 1 Pathology and Infectious Disease 1 100% 0 0% 1 Pediatrics 0 0% 1 100% 1 Pharmacology 3 60% 2 40% 5 Physiology and Immunology 4 100% 0 0% 4 Total 19 68% 9 32% 28
College of Medicine and Health Sciences Faculty Gender Distribution - Academic Department (%) ANATOMY
CELLULAR BIOLOGY ANESTHESIOLOGY EPIDEMIOLOGY AND POPULATION HEALT H FAMILY MEDICINE MEDICINE MOLECULAR BIOLOGY AND GENETICS NEUROLOGY PATHOLOGY AND INFECTIOUS DISEASE PEDIATRICS PHARMACOLOGY PHYSIOLO GY AND IMMUNOLOGY 67% 100% 100% 0% 50% 50% 100% 100% 0% 60% 100% 33% 0% 0% 100% 50% 50% 0% 0% 100% 40% 0%
College
Fall 2022/23
% OF MALE % OF FEMALE
Fall 2022/23 National Faculty by College
KU FACTBOOK 2022/23 84 College National Total % of National International Total % of International Grand Total College of Arts and Sciences 6 4% 160 96% 166 College of Engineering 39 19% 166 81% 205 College of Medicine and Health Sciences 1 3% 28 97% 29 Total 46 12% 354 89% 400 Fall 2022/23 National FacultyCollege (%) % OF NATIONAL % OF INTERNATIONAL
4% 96% 19% 81% COLLEGE OF ARTS AND SCIENCES COLLEGE OF ENGINEERING COLLEGE OF MEDICINE AND HEALTH SCIENCES 3% 97%
Fall 2022/23 National Faculty by Academic Department
KU FACTBOOK 2022/23 85 College of Arts and Sciences Academic Departments National Total % of National International Total % of International Grand Total Biology 0 0% 5 100% 5 Chemistry 0 0% 22 100% 22 Earth Sciences 2 15% 11 85% 13 English 1 5% 21 95% 22 Humanities and Social Sciences 2 8% 24 92% 26 Mathematics 1 3% 37 97% 38 Physics 0 0% 20 100% 20 Preparatory Program 0 0% 20 100% 20 Total 6 4% 160 96% 166
of Arts & Sciences National Faculty - Academic Department (%)
Fall 2022/23 College
BIOLOGY CHEMISTRY EARTH SCIENCES ENGLISH HUMANITIES AND SOCIAL SCIENCES MATHEMATICS PHYSICS PREPARATORY PROGRAM 0% 0% 15% 5% 8% 3% 0% 0% 100% 100% 85% 95% 92% 97% 100% 100% % OF NATIONAL % OF INTERNATIONAL
KU FACTBOOK 2022/23 86 College of Engineering Academic Departments National Total % of National International Total % of International Grand Total Aerospace Engineering 0 0% 15 100% 15 Biomedical Engineering 1 8% 11 92% 12 Chemical Engineering 11 38% 18 62% 29 Civil Infrastructure and Environmental Engineering 2 13% 13 87% 15 Electrical Engineering and Computer Science 15 23% 49 77% 64 Industrial and Systems Engineering 0 0% 14 100% 14 Mechanical Engineering 5 12% 37 88% 42 Nuclear Engineering 2 33% 4 67% 6 Petroleum Engineering 3 38% 5 63% 8 Total 39 19% 166 81% 205 AEROSPACE ENGINEERING BIOMEDICAL ENGINEERING CHEMICAL ENGINEERING CIVIL INFRASTRUCTURE AND ENVIRONMENTAL ENGINEERING ELECTRICAL ENGINEERING AND COMPUTER SCIENCE INDUSTRIAL AND SYSTEMS ENGINEERING MECHANICAL ENGINEERING NUCLEAR ENGINEERING PETROLEUM ENGINEERING 100% 92% 62% 87% 77% 100% 88% 67% 63% 0% 8% 38% 13% 23% 0% 12% 33% 38% Fall 2022/23 College of Engineering National Faculty - Academic Department (%) % OF NATIONAL % OF INTERNATIONAL
Fall 2022/23 College
and Health Sciences
*One faculty member is affiliated to the college management team not the academic departments.
KU FACTBOOK 2022/23 87 ANATOMY AND CELLULAR BIOLOGY ANESTHESIOLOGY EPIDEMIOLOGY AND POPULATION HEALTH FAMILY MEDICINE MEDICINE MOLECULAR BIOLOGY AND GENETICS NEUROLOGY PATHOLOGY AND INFECTIOUS DISEASE PEDIATRICS PHARMACOLOGY PHYSIOLOGY AND IMMUNOLOGY 0% 0% 0% 0% 0% 17% 0% 0% 0% 0% 0% 100% 100% 100% 100% 100% 83% 100% 100% 100% 100% 100% College of Medicine and Health Sciences Academic Departments* National Total % of National International Total % of International Grand Total Anatomy and Cellular Biology 0 0% 3 100% 3 Anesthesiology 0 0% 1 100% 1 Epidemiology and Population Health 0 0% 3 100% 3 Family Medicine 0 0% 1 100% 1 Medicine 0 0% 2 100% 2 Molecular Biology and Genetics 1 17% 5 83% 6 Neurology 0 0% 1 100% 1 Pathology and Infectious Disease 0 0% 1 100% 1 Pediatrics 0 0% 1 100% 1 Pharmacology 0 0% 5 100% 5 Physiology and Immunology 0 0% 4 100% 4 Total 1 4% 27 96% 28
National Faculty - Academic Department
of Medicine
(%)
% OF NATIONAL % OF INTERNATIONAL
2022/23 RESEARCHERS
2022/23
KU FACTBOOK 2022/23 88
University Research Centers 1 Advanced Digital and Additive Manufacturing Center (ADAM) 2 Advanced Materials Chemistry Center (AMCC) 3 Advanced Power and Energy Center (APEC) 4 Advanced Research and Innovation Center (ARIC) 5 Center for Biotechnology (BTC) 6 Center for Catalysis and Separation (CeCaS) 7 Center for Cyber-Physical Systems (C2PS) 8 Center for Membranes and Advanced Water Technology (CMAT) 9 Emirates ICT Innovation Center (EBTIC) 10 Emirates Nuclear Technology Center (ENTC) 11 Healthcare Engineering Innovation Center (HEIC) 12 Khalifa University Center for Autonomous Robotic Systems (KUCARS) 13 Khalifa University Space Technology and Innovation Center (KUSTIC) 14 KU-KAIST Joint Research Center (KU-KAIST JRC) 15 Research and Data Intelligence Support Center (RDISC) 16 Research and Innovation Center on CO2 and Hydrogen (RICH) 17 Research Center for Digital Supply Chain and Operations Management (DSOM) 18 Space and Planetary Science Center (SPSC) 19 Sustainable Bioenergy Research Consortium (SBRC) 20 System-on-Chip Lab (SoCL) 21 UAE-Korea Joint R&D Technical Center (KUTC) KU RESEARCH CENTERS
Khalifa
2022/23 Researchers in Research Centers
KU FACTBOOK 2022/23 89
KU RESEARCH CENTERS Number of Researchers Number of Faculty Advanced Digital and Additive Manufacturing Center (ADAM) 3 16 Advanced Materials Chemistry Center (AMCC) 0 11 Advanced Power and Energy Center (APEC) 1 13 Advanced Research and Innovation Center (ARIC) 5 6 Center for Biotechnology (BTC) 5 14 Center for Catalysis and Separation (CeCaS) 2 20 Center for Cyber-Physical Systems (C2PS) 5 21 Center for Membranes and Advanced Water Technology (CMAT) 5 14 Emirates ICT Innovation Center (EBTIC) 21 4 Emirates Nuclear Technology Center (ENTC) 2 10 Healthcare Engineering Innovation Center (HEIC) 3 12 Khalifa University Center for Autonomous Robotic Systems (KUCARS) 8 9 Khalifa University Space Technology and Innovation Center (KUSTIC) 3 7 KU-KAIST Joint Research Center (KU-KAIST JRC) 0 0 Research and Data Intelligence Support Center (RDISC) 2 3 Research and Innovation Center on CO2 and Hydrogen (RICH) 2 19 Research Center for Digital Supply Chain and Operations Management (DSOM) 6 10 Space and Planetary Science Center (SPSC) 4 5 Sustainable Bioenergy Research Consortium (SBRC) 0 2 System-on-Chip Lab (SoCL) 3 9 UAE-Korea Joint R&D Technical Center (KUTC) 0 0 Total 80 205
2019-2022 RESEARCH PRODUCTIVITY AND ANALYSIS
KU Scholarly Output
The number of publications of a selected entity.
Data source: Scopus - October 19 2022
KU FACTBOOK 2022/23 90
Khalifa
2019 2020 2021 2022 Scholarly Output 1,454 1,550 1,750 1,623 1,454 1,550 1,750 1,623
University Scholarly Output
KU Citation Count
Total citations received by publications of the selected entities.
Khalifa University Citation Count
KU FACTBOOK 2022/23 91
20,214 16,930 12,387 2,413
Data source: Scopus - October 19 2022 2019 2020 2021 2022 Citation Count 20,214 16,930 12,387 2,413
KU Field-Weighted Citation Impact
The ratio of citations received relative to the expected world average for the subject field, publication type and publication year.
KU FACTBOOK 2022/23 92
Khalifa University Field-Weighted Citation Impact 1.46 1.36 1.65 1.60 Data
Scopus - October 19 2022 2019 2020 2021 2022 Field-Weighted Citation Impact 1.46 1.36 1.65 1.60
source:
KU Outputs in Top Citation Percentiles
Percentage of publications of a selected entity that are highly cited, having reached a particular threshold of citations received.
Data source: Scopus - October 19 2022
KU FACTBOOK 2022/23 93
% OF OUTPUTS IN TOP 1% CITATION PERCENTILES % OF OUTPUTS IN TOP 5% CITATION PERCENTILES % OF OUTPUTS IN TOP 10% CITATION PERCENTILES 2.1% 1.5% 3.8% 3.0% 9.6% 12.6% 15.8% 17.9% 18.8% 22.4% 26.7% 26.9% 2019 2020 2021 2022 % of Outputs in Top 1% Citation Percentiles 2.1% 1.5% 3.8% 3.0% % of Outputs in Top 5% Citation Percentiles 9.6% 12.6% 15.8% 17.9% % of Outputs in Top 10% Citation Percentiles 18.8% 22.4% 26.7% 26.9%
KU Publications in Journal Quartiles
Percentage of publications that have been published in the selected journal quartiles.
KU FACTBOOK 2022/23 94
61.8% 67.9% 71.2% 74.6% Data source: Scopus - October 19 2022 2019 2020 2021 2022 % of Publications in Q1 (Top 25%) Journal Quartiles 61.8% 67.9% 71.2% 74.6% Khalifa University % of Publications in Q1 (Top 25%) Journal Quartiles
KU Publications in Top Journal Percentiles
Percentage of publications of a selected entity that have been published in the world’s top journals.
Data source: Scopus - October 19 2022
KU FACTBOOK 2022/23 95
% OF PUBLICATIONS IN TOP 1% JOURNAL PERCENTILES % OF PUBLICATIONS IN TOP 5% JOURNAL PERCENTILES % OF PUBLICATIONS IN TOP 10% JOURNAL PERCENTILES 3.4% 3.3% 4.2% 4.7% 18.1% 17.7% 20.9% 22.5% 32.2% 35.7% 40.8% 41.7% 2019 2020 2021 2022 % of Publications in Top 1% Journal Percentiles 3.4% 3.3% 4.2% 4.7% % of Publications in Top 5% Journal Percentiles 18.1% 17.7% 20.9% 22.5% % of Publications in Top 10% Journal Percentiles 32.2% 35.7% 40.8% 41.7%
KU Citations per Publication
The average number of citations received per publication.
Khalifa University Number of Citations per Publication
Data source: Scopus - October 19 2022
Publications
of Publications that have received at least one citation.
Khalifa University % of Cited Publications
Data source: Scopus - October 19 2022
KU FACTBOOK 2022/23 96
77.9% 44.5%
85.6% 84.3%
13.9 10.9 7.1 1.5 2019 2020 2021 2022 Number of Citations per Publication 13.9 10.9 7.1 1.5 2019 2020 2021 2022 % of Cited Publications 85.6% 84.3% 77.9% 44.5%
KU Cited
Percentage
KU Collaboration Impact
The extent of international institutional co-authorship.
% of publications that have at one international coauthor
Khalifa University % of publications that have at one international co-author
Data source: Scopus - October 19 2022
KU FACTBOOK 2022/23 97
70.6% 73.5% 75.7% 76.4% 2019 2020 2021 2022
70.6% 73.5% 75.7% 76.4%
KU FACTBOOK 2022/23 100 www.ku.ac.ae
