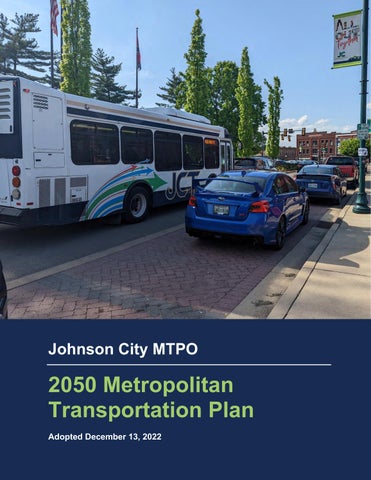
Johnson City MTPO 2050 Metropolitan Transportation Plan
Adopted December 13, 2022
Prepared by
This report was prepared in cooperation with the U. S. Department of Transportation, Federal Highway Administration, and the Tennessee Department of Transportation.
Table
Table
Table
Table
Table
Table
Table
Table
Table
Table
Table
Table
Table
Table
Table
Table
Table 6-5.
Table 6-6.
Table 6-7. Projected
Table 6-8.
Table 6-9.
Table
Table 6-11. Revenues and Expenditures for Roadway Capital (2023-2030)
NET Trans Northeast Tennessee Regional Public Transit System
NHFP National Highway Freight Program
NHPP National Highway Performance Program
NHS National Highway System
NOx Nitrogen Oxide
PDO Property Damage Only
PLOS Pedestrian Level of Service
PPP Public Participation Plan
SAFETEA-LU Safe, Accountable, Flexible, Efficient Transportation Equity Act: A Legacy for Users
SR State Route
STBG Surface Transportation Block Grant Program
STIP State Transportation Improvement Program
STP Surface Transportation Program
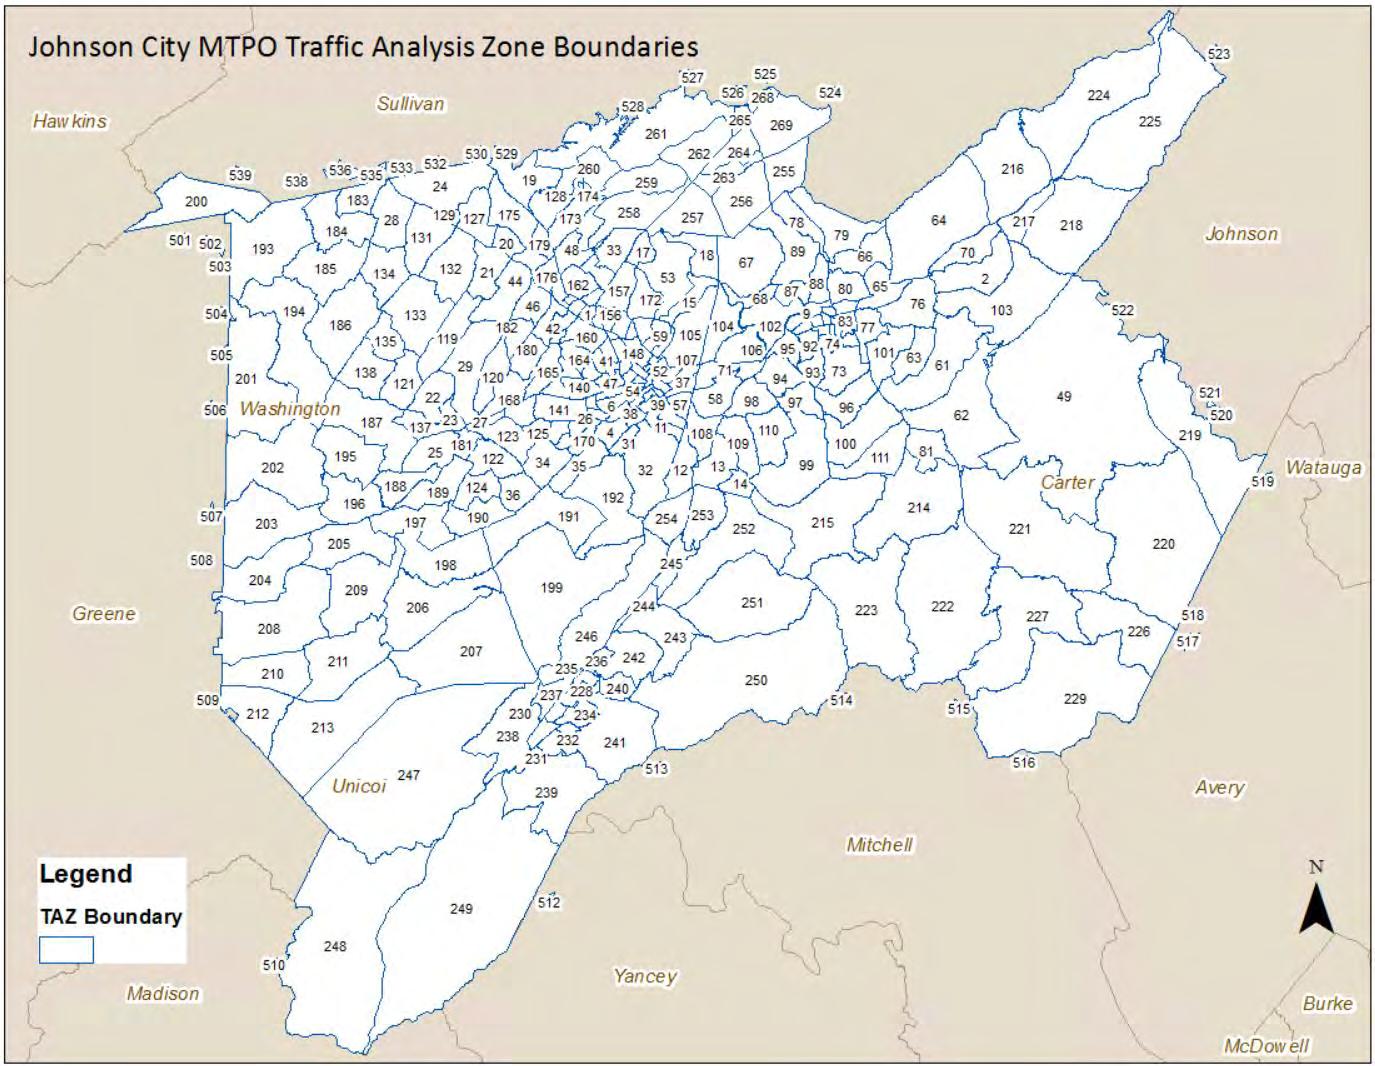
TAZ Traffic Analysis Zone
TCA Tennessee Code Annotated
TDM Travel Demand Management
TDOSHS Tennessee Department of Safety & Homeland Security
TDOT Tennessee Department of Transportation
TA Transportation Alternatives Program
TEA-21 Transportation Equity Act of the 21st Century of 1998
TERM Transit Economic Requirements Model Scale
TIP Transportation Improvement Program
TN Tennessee
TSMO Transportation System Management and Operations
UGB Urban Growth Boundary
ULB Useful Life Benchmark
US United States
US DOT United States Department of Transportation
USC United States Code
V/C Ratio Volume to Capacity Ratio
VHT Vehicle Hours Traveled
VMT Vehicle Miles Traveled
VOC Volatile Organic Compounds
INTRODUCTION
1.0 Introduction
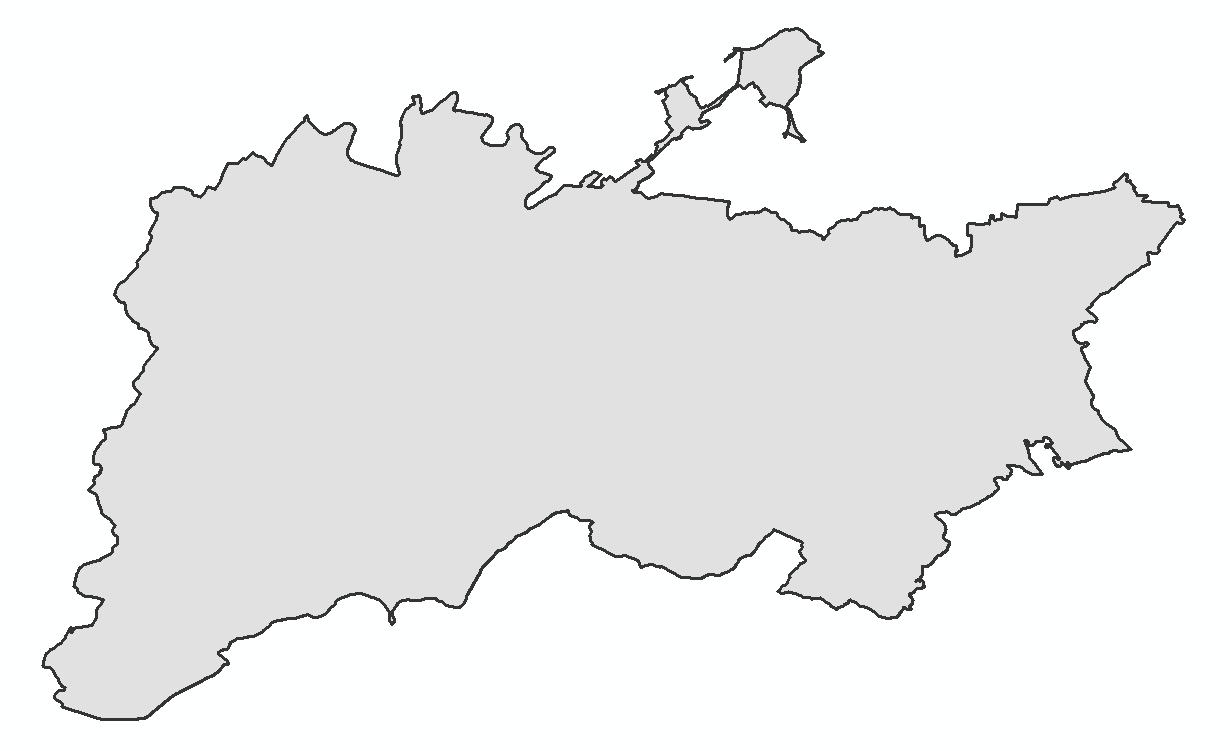
As a result of the 1980 U.S. Census, the Johnson City Metropolitan Transportation Planning Organization (MTPO) was established in 1982. The MTPO was created to comply with federal requirements that urbanized areas, such as Johnson City, provide a continuing, cooperative, and comprehensive approach to transportation planning for the region. At that time, the geographic limits of the urbanized area of Johnson City were much smaller, largely covering just the corporate limits of the City of Johnson City and a small portion of surrounding communities. Based on the 2010 U.S. Census, the Johnson City urbanized area includes a much larger geographic area including portions of Carter, Sullivan, Unicoi, and Washington counties and the municipalities of Bluff City, Elizabethton, Johnson City, Jonesborough, Watauga, and Unicoi.
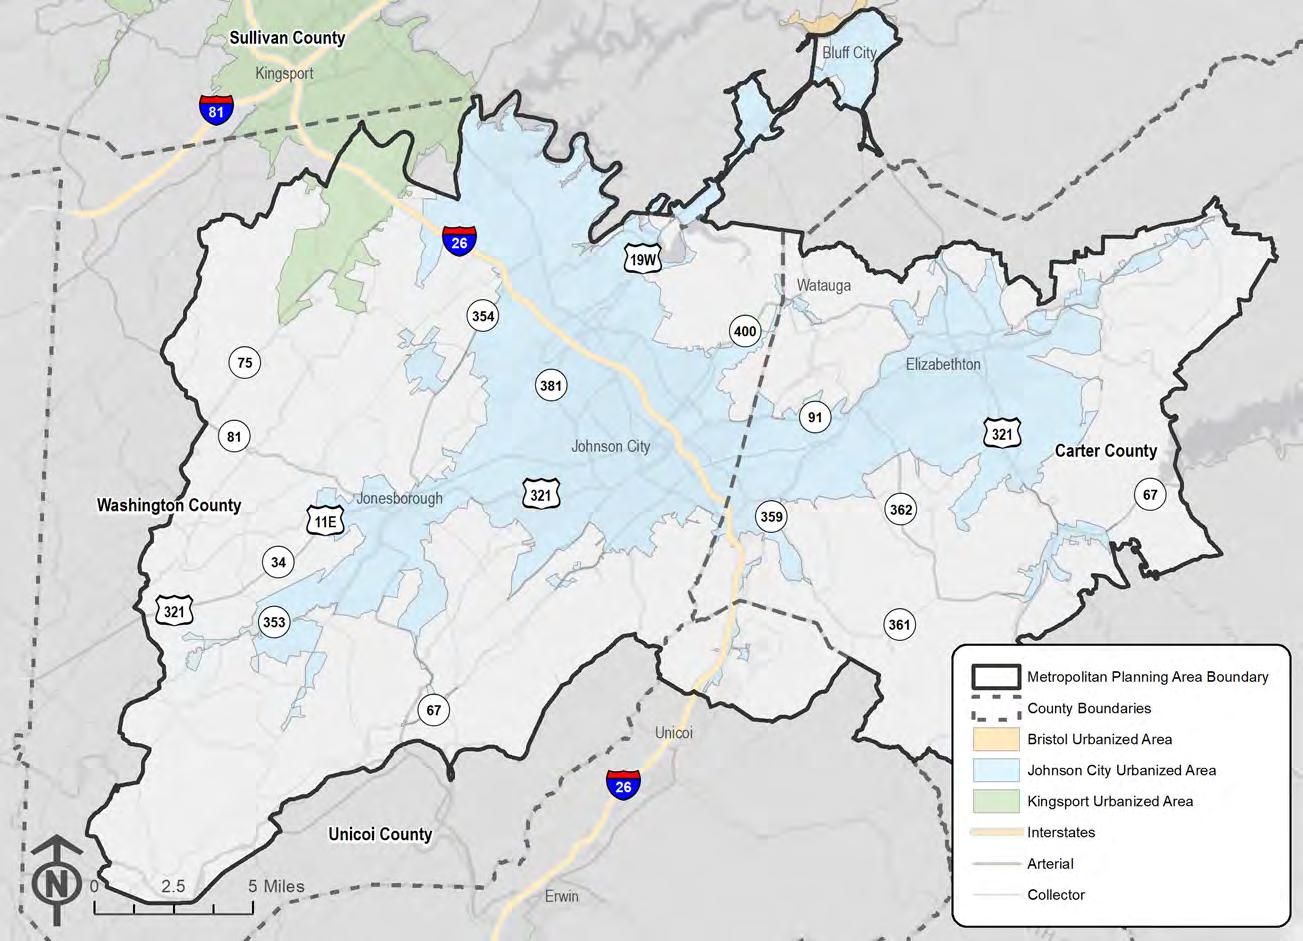
An MPO is a policy-making organization focused on transportation that is composed of local government representatives, Federal and State officials, public transit providers, and other transportation officials, as well as local engineers and planners. Urbanized areas as defined by the U.S. Census Bureau with populations greater than 50,000 people are required to have an MPO to ensure that federal transportation funding is apportioned appropriately and aligned with planning processes that meet federal and regional goals. The Johnson City MTPO plans for and approves the use of transportation funds within its planning area for highway, transit, bicycle, and pedestrian projects. The MTPO’s planning area includes the region’s urbanized area and other areas that may become urbanized in the next 20 years (Figure 1-1).
The MPO coordinates the distribution of transportation funding through a planning process that is continuous, comprehensive, and cooperative, and includes engagement with regional partners and the public. As one of its core planning products, the MTPO develops the Metropolitan Transportation Plan (MTP) every five years. The MTP is a federally-required planning document that outlines transportation investments for the region over the next 25 years. Johnson City’s 2050 MTP outlines the region’s vision for transportation in the future, outlines key transportation needs, and establishes goals, objectives, and performance measures to meet those needs. The MTP is organized into the following main sections:
• Goals, Objectives, and Performance Measures
• Public and Stakeholder Engagement
• Existing Conditions and Trends
• Multimodal Transportation System and Performance
• Financial Analysis and Programming
• Project Impacts
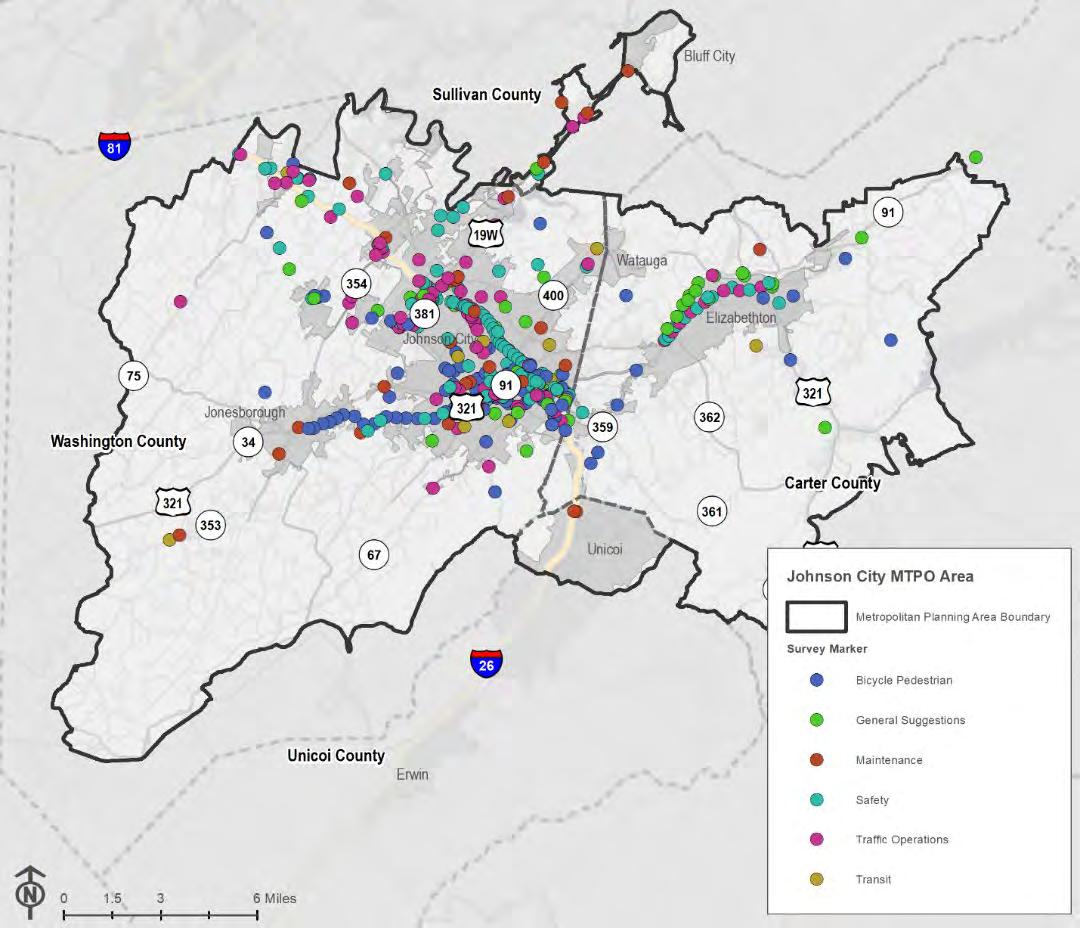
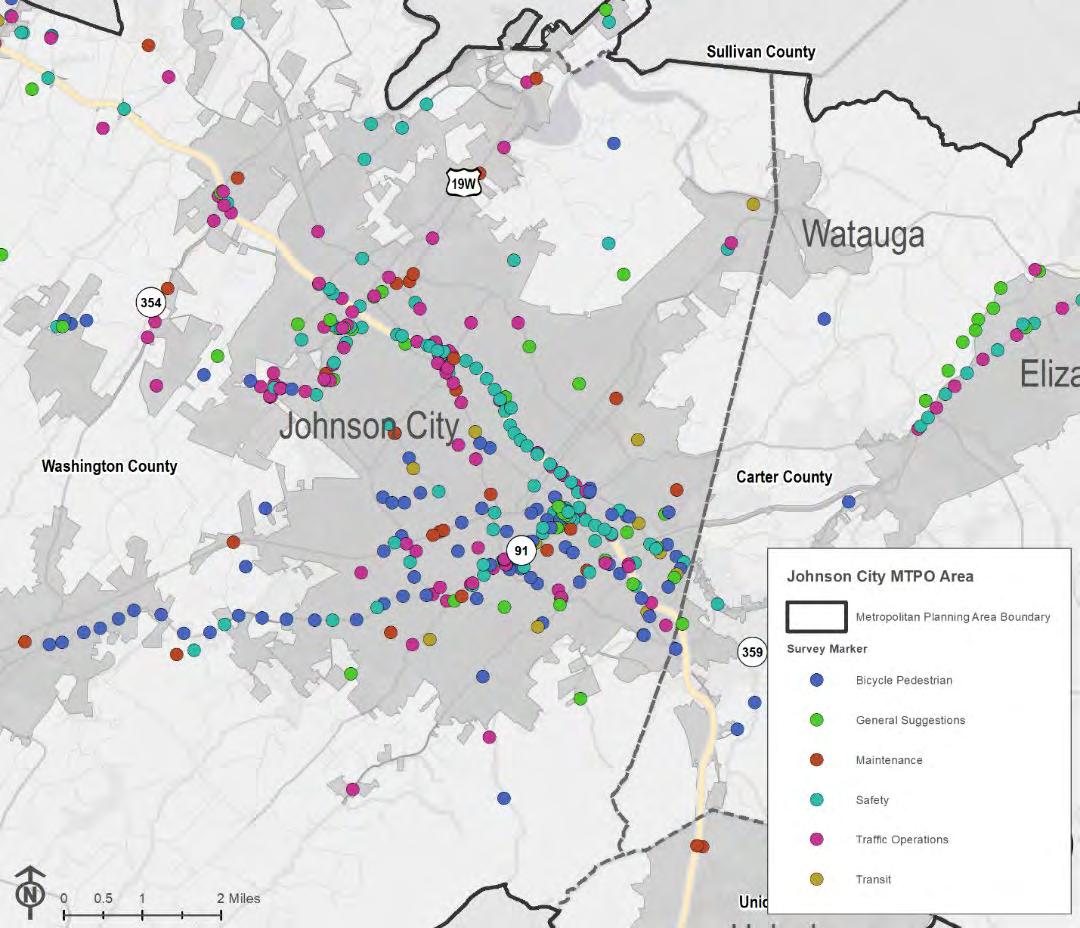
Figure 1-1. Johnson City MTPO Area
GOALS, OBJECTIVES, AND PERFORMANCE MEASURES
2.0 Goals, Objectives, and Performance Measures
A performance-based planning approach allows states and MPOs to track progress toward meeting transportation planning goals and national priorities for multimodal transportation.
2.1 Federal Policy Context
In 2021, the Infrastructure Investment and Jobs Act, otherwise known as the Bipartisan Infrastructure Law (BIL), was passed to fund Federal highway and transit programs for fiscal years 2022 through 2026. The BIL reaffirms the transportation planning goals and performance management requirements outlined in the previous two transportation funding packages, Fixing America’s Surface Transportation (FAST) Act and Moving Ahead for Progress in the 21st Century (MAP-21). The BIL makes no changes to the national planning goals outlined in 23 USC §150, which were first established in MAP-21 and address the following objectives:
• Safety – Achieve a significant reduction in traffic fatalities and serious injuries on all public roads;
• Infrastructure Condition – Maintain the highway infrastructure asset system in a state of good repair;
• Congestion Reduction – Achieve a significant reduction in congestion on the National Highway System (NHS);
• System Reliability – Improve the efficiency of the surface transportation system;
• Freight Movement and Economic Vitality – Improve the National Highway Freight Network, strengthening the ability of rural communities to access national and international trade markets, and supporting regional economic development;
• Environmental Sustainability – Enhance the performance of the transportation system while protecting and enhancing the natural environment; and
• Reduced Project Delivery Delays – Reduce project costs, promote jobs and the economy, and expedite the movement of people and goods by accelerating project completion through eliminating delays in the project development and delivery process, including reducing regulatory burdens and improving agencies' work practices.
The ten planning factors included in the FAST Act (23 CFR § 450.306) continue to be required for inclusion in the metropolitan transportation planning process under BIL. These planning factors are:
• Support the economic vitality of the metropolitan area, especially by enabling global competitiveness, productivity, and efficiency;
• Increase the safety of the transportation system for motorized and nonmotorized users;
• Increase the security of the transportation system for motorized and nonmotorized users;
• Increase the accessibility and mobility options available to people and for freight;
• Protect and enhance the environment, promote energy conservation, improve the quality of life, and promote consistency between transportation improvements and state and local planned growth and economic development patterns;
• Enhance the integration and connectivity of the transportation system, across and between modes, for people and freight;
• Promote efficient system management and operation;
• Emphasize the preservation of the existing transportation system;
• Improve the resiliency of the transportation system and reduce or mitigate stormwater impacts of surface transportation; and
• Enhance travel and tourism
These national planning factors and goals provide the foundation for which desired statewide and regional outcomes are established.
2.2 Statewide Goals and Objectives
In 2015, the Tennessee Department of Transportation (TDOT) completed the 25-Year LongRange Transportation Policy Plan (LRTP), which documents the state’s transportation policy and funding decisions and aligns with the national planning priorities established by the U.S. Department of Transportation (USDOT) and Federal Highway Administration (FHWA). In addition to a variety of policy recommendations, the LRTP outlines seven guiding principles to support transportation planning in the state, including:
• Preserve and manage the existing system;
• Support the state’s economy;
• Maximize safety and security;
• Provide for the efficient movement of people and freight;
• Build partnerships for sustainable and livable communities;
• Protect natural, cultural, and environmental resources; and
• Emphasize financial responsibility.
2.3 Metropolitan Transportation Planning Goals and Objectives
The 2050 MTP carries forward the goals and objectives that were included in the previous metropolitan transportation plan with minor revisions based on feedback and guidance from the Executive Board, stakeholders, and the public. These goals and objectives will help guide future transportation decisions in the region and establish a safe, connected, sustainable, and multimodal transportation system.
• Goal #1: Improve Safety and Security throughout the MTPO Area Transportation System
o Reduce rates of crashes with serious injuries and fatalities
o Reduce secondary traffic crashes
o Establish initiatives (projects and programs) to improve the safety and security of vulnerable roadway users (e.g., pedestrians, cyclists, transit riders, and the young and old)
o Encourage partnerships with other transportation and non-transportation agencies to enhance transportation safety and security
o Increase the transportation system’s resilience to climate change and extreme weather
• Goal #2: Mitigate Traffic Congestion along Major Routes in the MTPO Area
o Reduce travel delays between major areas of attractions in the MTPO study area
o Seek cost-effective management solutions and new technologies as a means of addressing congestion, reducing transportation delay, improving travel time reliability, and improving system operations
o Increase transit and other transportation demand management strategies
o Enhance the flow of raw materials and manufactured products
• Goal #3: Promote Sustainable Economic Growth and Livability by Enhancing the MTPO Area Transportation System
o Maintain what we have – take a “state of good repair” approach to our community’s transportation assets
o Invest in the integration and connectivity of the transportation system, across and between modes, for people and freight, to support sustainable economic development and improve quality of life
o Promote alternative forms of transportation (such as walking, biking, and transit)
o Support transportation investments which minimize adverse impacts of surface transportation to historical, social, cultural, and natural environments, including stormwater impacts, and reduce transportation impacts on air-quality
• Goal #4: Enhance Regional Access to and from the MTPO Area
o Maintain and improve access to regional areas outside of the MTPO study area
o Support transportation investments and policies that work to create jobs and improve access to people, tourism, places, and goods while embracing access management and corridor management strategies that preserve the long-term functionality of a roadway’s capacity and safety
o Strategically target transportation investments to areas supportive of and conducive to growth and redevelopment initiatives
Table 2-1 summarizes how the MTPO goals relate to the federal planning factors
Table 2-1. MTP Goals and Federal Planning Factors
Act Planning Factor
1. Support the economic vitality of the metropolitan area, especially by enabling global competitiveness, productivity, and efficiency. 4
2. Increase the safety of the transportation system for motorized and nonmotorized users. 1
3. Increase the security of the transportation system for motorized and nonmotorized users. 1
4. Increase the accessibility and mobility options available to people and for freight. 2, 3
5. Protect and enhance the environment, promote energy conservation, improve the quality of life, and promote consistency between transportation improvements and state and local planned growth and economic development patterns. 1, 3
6. Enhance the integration and connectivity of the transportation system, across and between modes, for people and freight. 3, 4
7. Promote efficient system management and operation. 2, 3, 4
8. Emphasize the preservation of the existing transportation system. 1, 3
9. Improve the resiliency of the transportation system and reduce or mitigate stormwater impacts of surface transportation. 1, 3
10. Enhance travel and tourism. 4
2.4 Performance Management
The Federal requirement for performance-based planning was first established in 2012 by MAP21 and was further clarified within the FAST Act. The BIL continues the requirement of using quantifiable measures to support project evaluation, selection, and performance evaluation by State Departments of Transportation and MPOs. Twenty-three performance measures have been established to address topics of national concern, including safety, bridge and pavement condition, roadway and freight reliability, emissions reduction for pollutants, and transit safety measures. These measures, listed below, are used to ensure planning efforts and eventual project implementation support the attainment of national goals for the transportation system.
• Safety
o Number of fatalities
o Rate of fatalities per 100 million vehicle miles traveled (VMT)
o Number of serious injuries
o Rate of serious injuries per 100 million VMT
o Number of non-motorized fatalities and non-motorized serious injuries
• Bridge and Pavement Conditions
o Percentage of pavement of the Interstate System in good condition
o Percentage of pavement of the Interstate System in poor condition
o Percentage of pavement of the non-Interstate NHS in good condition
o Percentage of pavement of the non-Interstate NHS in poor condition
o Percentage of NHS bridges classified as in good condition
o Percentage of NHS bridges classified as in poor condition
• Reliability
o Percentage of person-miles traveled on the Interstate that are reliable
o Percentage of person-miles traveled on the non-Interstate NHS that are reliable
o Truck Travel Time Reliability (TTTR) Index
• Emissions Reduction
o Total emission reductions for applicable criteria pollutants
• Transit Asset Management
o Percentage of Rolling Stock revenue vehicles (by type) that exceed the useful life benchmark (ULB)
o Percentage of non-revenue service vehicles (by type) that exceed the ULB
o Percentage of facilities (by group) that are rated less than 3.0 on the Transit Economic Requirements Model (TERM) Scale
• Transit Safety
o Total number of fatalities
o Fatality rate per total vehicle revenue miles (VRM) by mode
o Total number of injuries
o Injury rate per total VRM by mode
o Total number of safety events
o Safety event rate per total VRM by mode
o Total major mechanical failures
o Mean distance between major mechanical failures by mode
In 2021, TDOT updated its LRTP to include a system performance report that establishes targets for each of these federally-required performance measures. The Johnson City MTPO
has chosen to adopt the performance targets established by TDOT to align with both federal and state performance management requirements. In doing so, the MTPO has agreed to prioritize projects and programs through this MTP that help the State meet or exceed its targets in the areas of system safety, infrastructure conditions, and system performance described below
System safety performance measures (Table 2-2) evaluate the safety of the transportation system for all modes and users and set performance targets for fatal and serious injury crashes (both vehicles and non-motorized crashes), as well as a fatality and serious injury rate per 100 million VMT. Data for each metric is collected and summarized as a 5-year rolling average between 2017 and 2021. These safety targets were established by TDOT on August 31, 2022; Johnson City MTPO established its targets on December 13, 2022.
Table 2-2. System Safety Measures and Targets
Infrastructure condition performance measures (Table 2-3) assess the physical condition of roadways and bridges along the National Highway System (NHS). Targets are set for both 2year and 4-year periods, and they project changes to the facility’s condition based on the age of the infrastructure, population changes, and congestion levels. Pavement conditions are established using the International Roughness Index (IRI), which considers cracking levels, faults, and ruts when classifying pavements, and the distress data, which includes metrics that define the deterioration of pavements such as cracking, rutting, or other pavement conditions. These targets were established by TDOT on May 20, 2018 and were updated on October 1, 2020; Johnson City MTPO established its targets on November 14, 2018 and updated them on February 24, 2021.
Table 2-3. Infrastructure Conditions Measures and Targets
System performance measures (Table 2-4) assess reliability of interstates and non-interstate portions of the NHS as an indicator of the overall health of the transportation system for personal vehicles and freight movement. This category of performance measures also includes air quality performance measures to assess the impact of transportation-related emissions. Because air quality performance metrics are only required to be reported for metropolitan planning areas in non-attainment, they were not included in the table below. Targets were established by TDOT on May 20, 2018; Johnson City MTPO established its targets on November 14, 2018.
Table 2-4. System Performance Measures and Targets
of PersonMiles Traveled)
Reliable NonInterstate NHS Roads (% of PersonMiles Traveled)
Freight Reliability (Truck Travel
On June 21, 2022, the Johnson City MTPO Executive Board adopted Transit Asset Management (TAM) targets for fiscal year 2023 to clarify useful life benchmarks (ULB) (Table 2-5), in addition to transit agency safety performance targets for Johnson City Transit (Table 2-6) and NET Trans (Table 2-7).
Table 2-5. Johnson City MTPO Transit Asset Management Performance Targets
Performance Measures
Rolling Stock: The percentage of revenue vehicles (by type) that exceed the useful life benchmark (ULB)
Equipment: The percentage of nonrevenue service vehicles (by type) that exceed the ULB
Facilities: The percentage of facilities (by group) that are rated less than 3.0 on the Transit Economic Requirements Model (TERM) Scale
(Percent Past ULB – June 2022)
0%
15%
(Percent Past ULB – June 2023)
Table 2-6. Johnson City Transit Safety Performance Targets
Table 2-7. NET Trans Transit Safety Performance Targets
PUBLIC AND STAKEHOLDER ENGAGEMENT
3.0 Public and Stakeholder
Engagement
Public and stakeholder engagement was a critical component of the 2050 MTP update. Outreach was conducted throughout the planning process to the public, regional stakeholders, including technical representatives from local jurisdictions, and the MTPO’s Executive Board. Detailed summaries of public and stakeholder feedback are included in Appendix A
3.1 Engagement Approach
The outreach and engagement approach consisted of both virtual and in-person engagement opportunities, including virtual meetings, surveys, and in-person workshops. Due to the ongoing COVID-19 pandemic, virtual options were made available for all outreach opportunities to promote involvement while maintaining personal safety. When possible, in-person meetings were made available as well. Advertising efforts focused on sharing information before, during, and after outreach was conducted to promote upcoming events and varied opportunities for feedback. Targeted outreach included the development of a project webpage hosted by the Johnson City MTPO, press releases before each round of engagement, newspaper advertisements, boosted social media posts on Twitter and Facebook, use of the MetroQuest and Social Pinpoint engagement platforms, and email distribution lists that included over 1,800 business emails. Posters were also displayed at the Johnson City Transit Center.
3.2 Public Outreach
The first round of public engagement included virtual meetings and web-based surveys that were available from January to March 2022. Outreach at this stage focused on providing information on the purpose of the MTP update and gathering feedback on issues and opportunities related to the region’s transportation system. The first survey was available online and was completed by 313 respondents. Respondents provided information about past and future development preferences, transportation priorities, and locations of transportation-related issues and opportunities through an interactive map. Key findings included:
• Perception that congestion on the region’s roadways has worsened over time;
• Relative approval of the density of recent development;
• Desire for future development to be spread evenly throughout the region, while being focused near or next to existing development and transportation resources;
• Preference for prioritizing maintenance of existing roadways, reducing congestion and delay, and improving safety;
• Preference for project types that include bridge and pavement improvements, signal timing, and safety elements; and,
• Desire for improved sidewalk and trail connections to transit, as well as more investment in bicycle and pedestrian facilities in general.
The first two public meetings were held virtually on March 3, 2022, at 12:00 PM and 6:00 PM to explain the background and purpose of the MTP update and provide existing conditions information, including an overview of regional demographics, population and employment trends, roadway system conditions, environmental resources, safety statistics, active
transportation facilities, and transit system information. The presentation was recorded and posted on the project webpage.
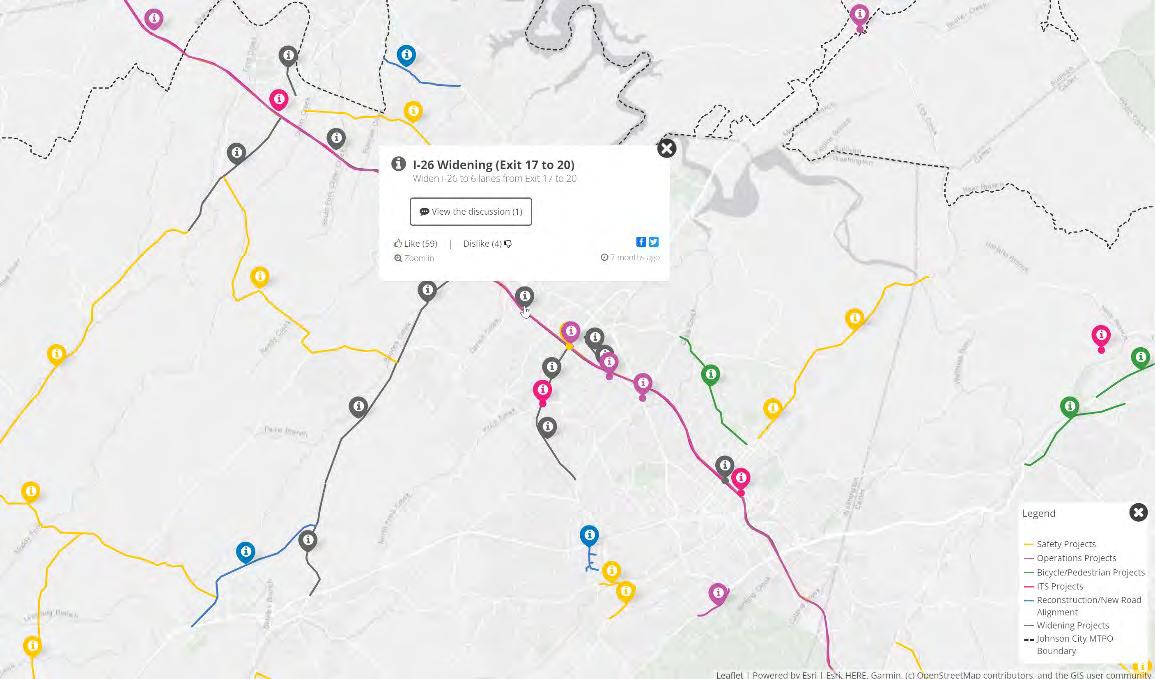
The second round of public engagement included two open-house style in-person meetings on May 24, 2022, at 11:30 AM and 4:30 PM to gather feedback on the draft project recommendations. An interactive map on the Social Pinpoint platform allowed participants to comment on the draft recommendations in a virtual format that was visited by over 1,400 users. Key feedback included:
• Widespread support for the ITS and safety projects, particularly adaptive signal control, ITS deployment along I-26, and projects addressing sight-distance issues and other geometric deficiencies;
• General support for the recommended widening of I-26 and Boones Creek Road;
• Strong opposition to the Okolona Road (SR 359) realignment due to property acquisition and environmental concerns; and,
• Strong support for the bicycle and pedestrian recommendations, particularly the Tweetsie Trail Extension and East Oakland Avenue pedestrian safety improvements.
Following the development of a draft MTP document, a third round of public outreach included an open-house style in-person meeting on November 30, 2022, at 4:00 PM to gather feedback on the draft of the MTP that was made available on the MTPO’s website, the Johnson City Press, and multiple social media platforms. The third round of engagement garnered eight comments, and key feedback included:
• Support for additional bicycle, pedestrian, and transit facilities, particularly to serve as safe routes to school and to provide robust transportation options;
• Support for expanded transit routes and service hours; and,
• Support for roadway improvements between Kingsport and Johnson City.
3.3 Stakeholder Engagement
Coordination with regional stakeholders was ongoing throughout the development of the MTP and included consultation with local and regional planning agencies, county representatives, transit operators, school district representatives, TDOT, and FHWA. These stakeholders were chosen to provide feedback on critical topics, including economic development, freight, and tourism, as well as bicycle and pedestrian needs, transit, health, and equity. Stakeholders provided feedback on goals and objectives, locally prioritized projects, locations most likely to see future growth and development, and validated revenue and funding projections. All stakeholder meeting summaries can be found in Appendix A.
Stakeholder engagement also included four presentations to the MTPO’s Executive Board, which provided status updates and allowed the Board to provide feedback at key phases of the planning process. The Board offered guidance on the MTP’s goals and objectives, approved both the population and employment projections and the financial assumptions, and guided the project development and prioritization process.
EXISTING CONDITIONS AND TRENDS
4.0
Existing Conditions and Trends
The following sections detail existing conditions within the Johnson City Metropolitan Planning Area (MPA), which covers portions of Carter, Sullivan, Unicoi, and Washington Counties, to provide an overview of transportation issues and opportunities in the region.
4.1 Land Use, Growth, and Development
The Johnson City MTPO’s land use and development patterns are influenced by local zoning ordinances and development regulations. Local decisions about how and where development occurs have wide-ranging effects on the region, from influencing where people live and work and how they travel, to impacts on the natural environment.
As the region continues to grow and change, land use decisions can be made to better coordinate new development with transportation planning efforts to best manage how the transportation system operates. For example, encouraging more compact, mixed-use development in existing communities can make bicycling, walking, and transit more viable alternatives to driving alone, while simultaneously reducing the impact of new development on the region’s natural resources
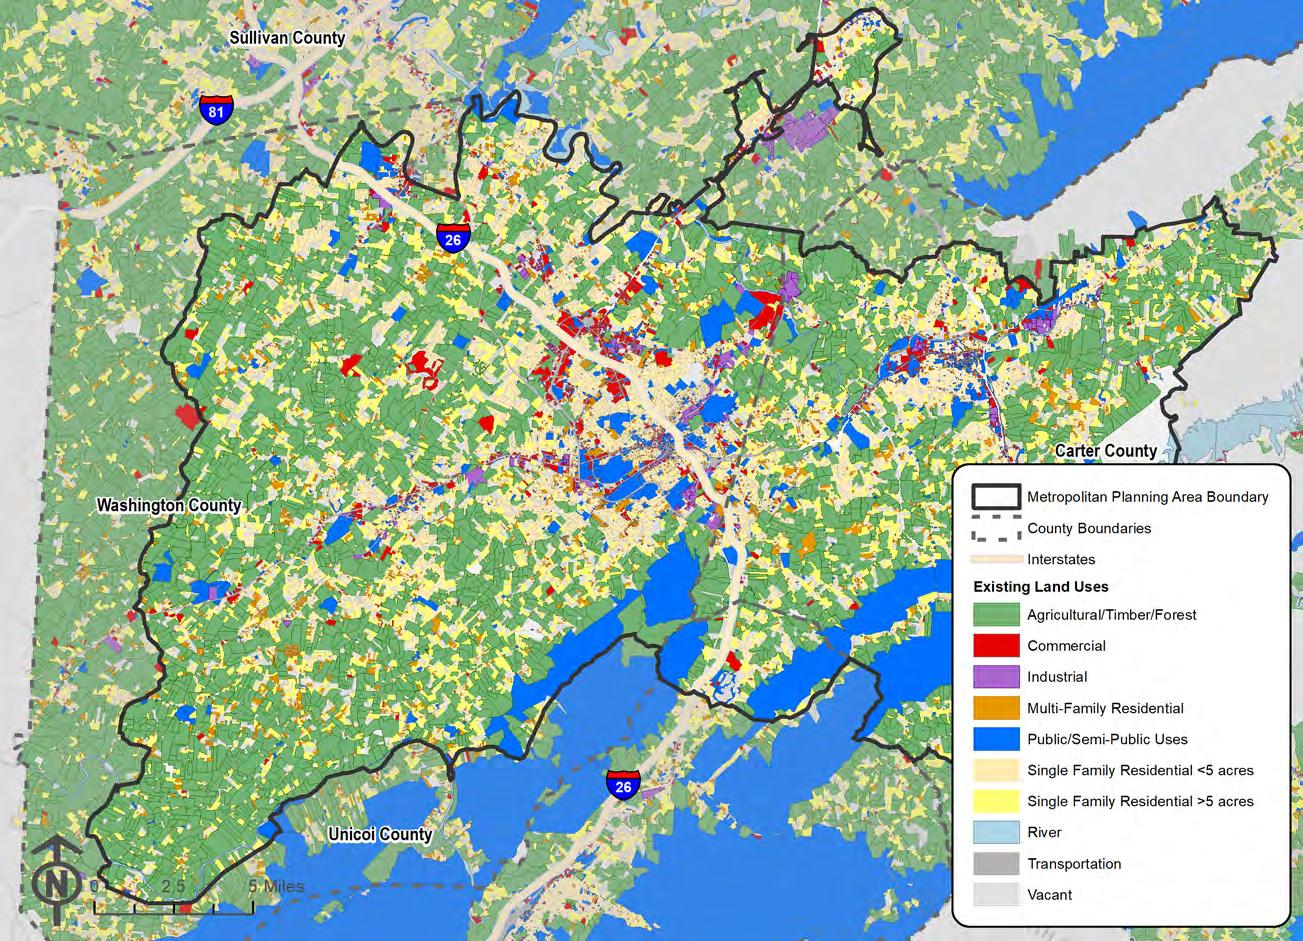
The Johnson City MTPO area covers over 350 square miles, with 45% of that area dedicated to agriculture, timber, and forest lands. Residential uses cover 28% of the region (only 3% of which is multi-family housing), commercial uses cover 3%, industrial uses cover 1%, and public/semipublic uses (which includes a small portion of the Administrative Boundary of the Cherokee National Forest, not actual land owned by the Cherokee National Forest) cover 9%. Five percent of the region’s acreage is used for transportation purposes, 1% is river, and 8% is vacant.
Figure 4-1 illustrates the existing land uses within the Johnson City MTPO area, and acreage totals are included in Table 4-1
Table 4-1. Acreage by Land Use Type, inside MPA
Source: Tennessee Comptroller of the Treasury
4-1. Existing Land Uses
Figure
4.2 Environmental Conditions
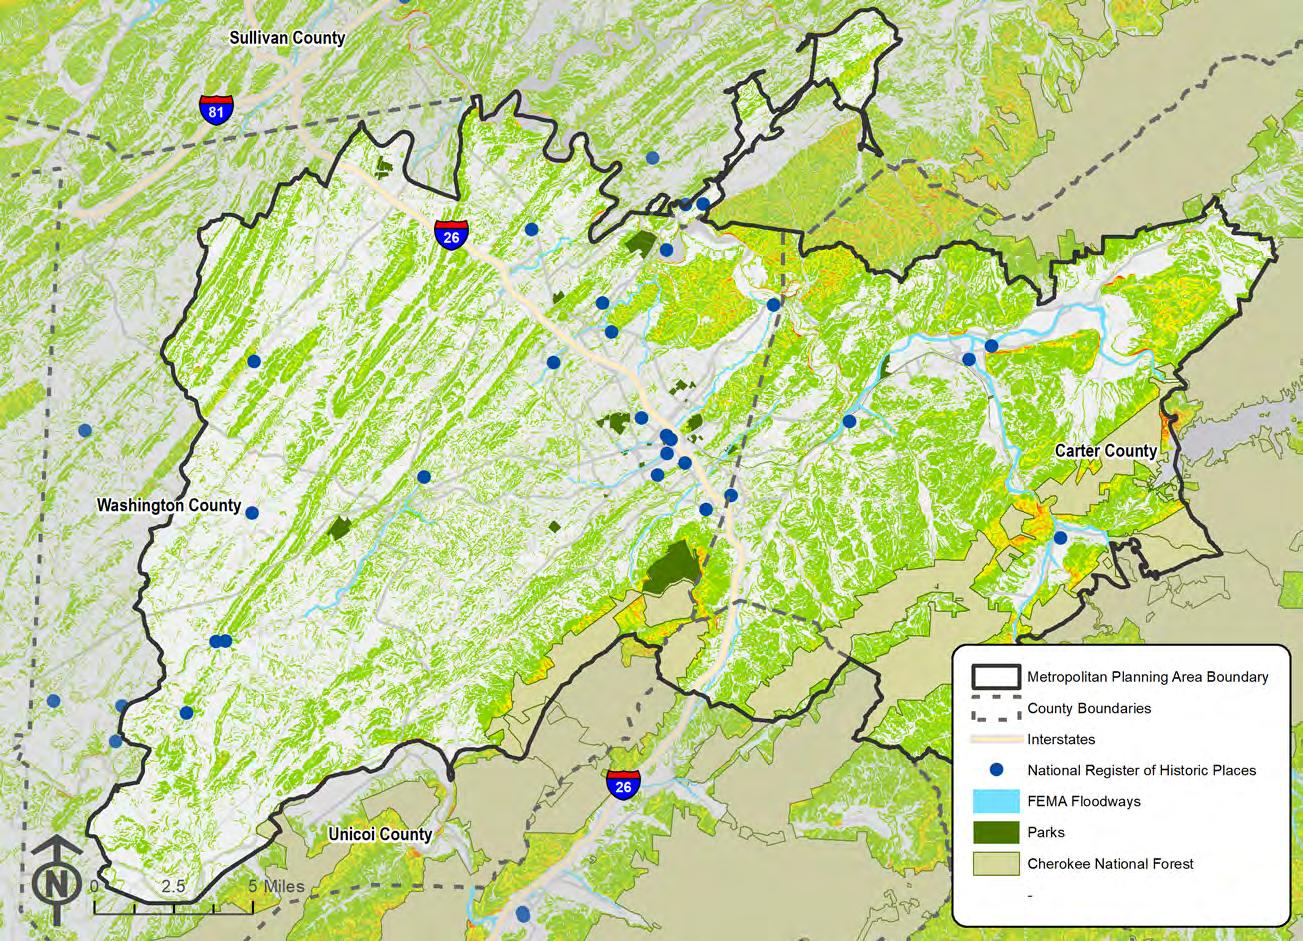
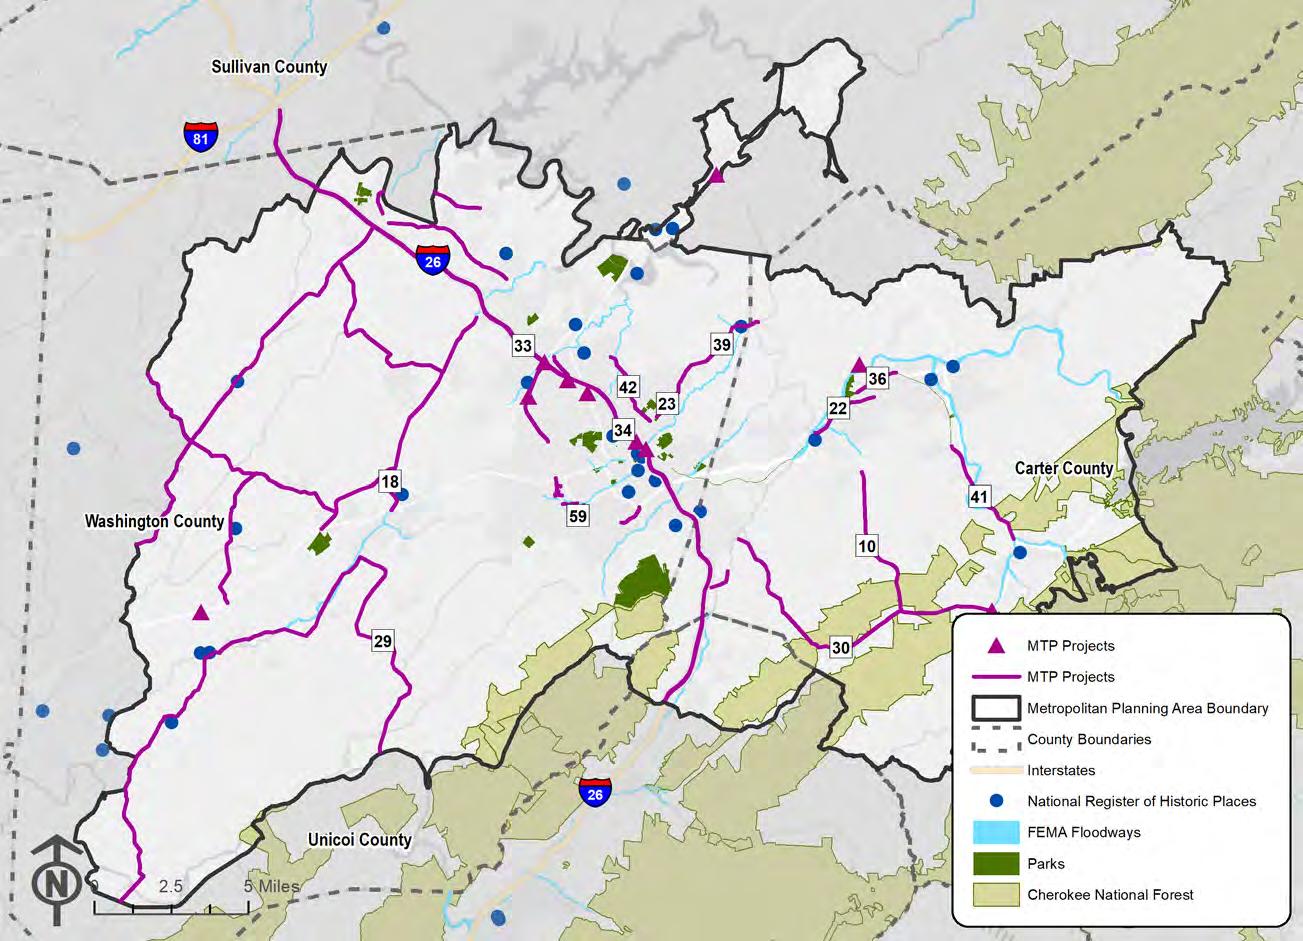
The Johnson City region is characterized by its rich natural resources, from its mountainous topography and fertile agricultural lands to the forested expanse of the Cherokee National Forest. Steep slopes of greater than 15% are a predominant environmental feature, which limits where development can occur. The region’s karst topography also complicates development because the underlying limestone bedrock in most of the region is prone to developing sinkholes, caves, and depressions Key environmental features are shown in Figure 4-2, including floodways, parks, sites listed on the National Register of Historic Places, and steep slopes.
4-2. Environmental Features
Figure
4.3 Existing and Future Population
The 4-county region surrounds the Johnson City MTPO area and includes all of Carter, Sullivan, Unicoi, and Washington Counties. Since 1970, the region has continued to see steady growth as shown in Figure 4-3 Population growth is expected to occur most rapidly in Washington County, which is projected to surpass Sullivan County as the most populous county in the region in 2040.
These county-level projections are sourced from the Woods & Poole data set, which was most recently purchased by TDOT in 2019. Although purchased in 2019, this national dataset sources historic decennial Census data and is used primarily for its future year projections. Detailed demographic data presented in this section is sourced from the 2019 edition of the U.S. Census Bureau’s American Community Survey (ACS) 5-Year Estimates as many of these variables are not yet available from the 2020 decennial Census. In general, 2020 U.S. Census data was analyzed for population analyses wherever possible and supplemented with 2019 ACS estimates where necessary
4-3. Historic Population Growth in the Region
Source: Woods & Poole, 2019
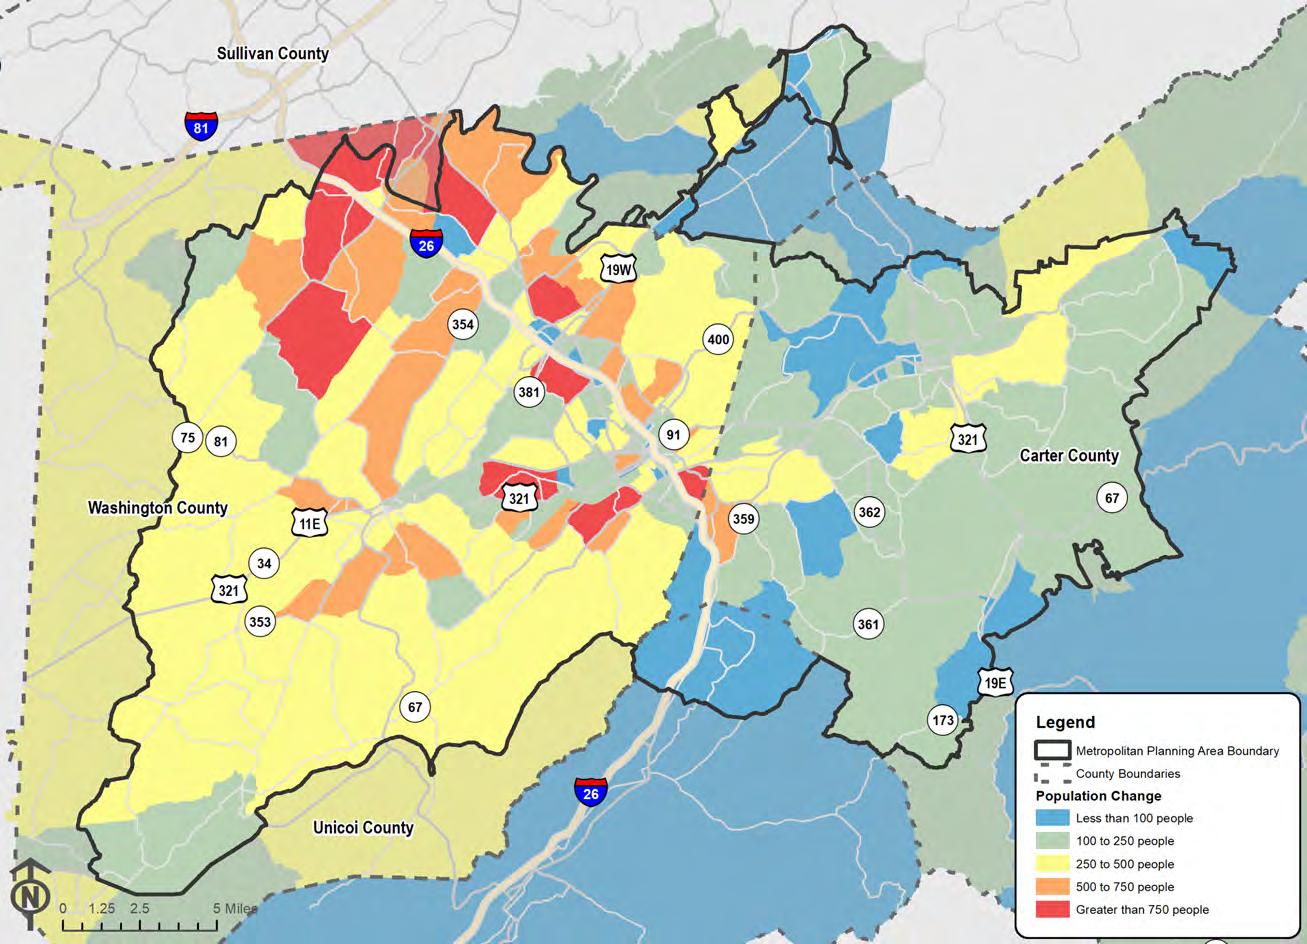
As part of the larger region, the Johnson City MTPO area has a population of 171,269, according to the U.S. Census Bureau’s 2020 Census, which is a 7.2% percent increase since the 2010 Census. The Johnson City MTPO area is expected to see an additional 60,000 people by 2050, an increase of 35.4% that will mostly occur in Washington County as detailed in Table 4-2 Within the rest of the MTPO area, population growth is expected to plateau in both Unicoi and Sullivan counties and will increase by approximately 9,000 people in Carter County
Figure
Table 4-2
Figure 4-5 illustrates the population change between 2020 and 2050 in the Johnson City region by Traffic Analysis Zone (TAZ), which is a geography delineated for traffic-related analyses and consists of multiple census blocks.
Key demographic features, including age, access to vehicles, and income affect the types of transportation services that should be prioritized within the Johnson City MTPO area. The expected 3.8% increase in populations over the age of 65 (Figure 4-4) and the existing 6.5% of households in the region with no car (Table 4-3), for example, will require additional investment in walking, bicycling, and transit modes to provide mobility options for people who are unable or unwilling to drive. Regionally, approximately 13% of the region’s population is impoverished, which further underscores the need for increased investment in transit and active transportation.
Figure 4-4. Current and Projected Age Distribution in the Region
85 Years and Over
80 to 84 Years
75 to 79 Years
70 to 74 Years
65 to 69 Years
60 to 64 Years
55 to 59 Years
50 to 54 Years
45 to 49 Years
40 to 44 Years
35 to 39 Years
30 to 34 Years
25 to 29 Years
20 to 24 Years
15 to 19 Years
10 to 14 Years
0 to 5 Years 5 to 9 Years
Source: Woods & Poole, 2019
Table 4-3. Poverty and Vehicle Access in the Region
Source: American Community Survey, 2019
4-5. Population Change by TAZ (2020-2050)
Figure
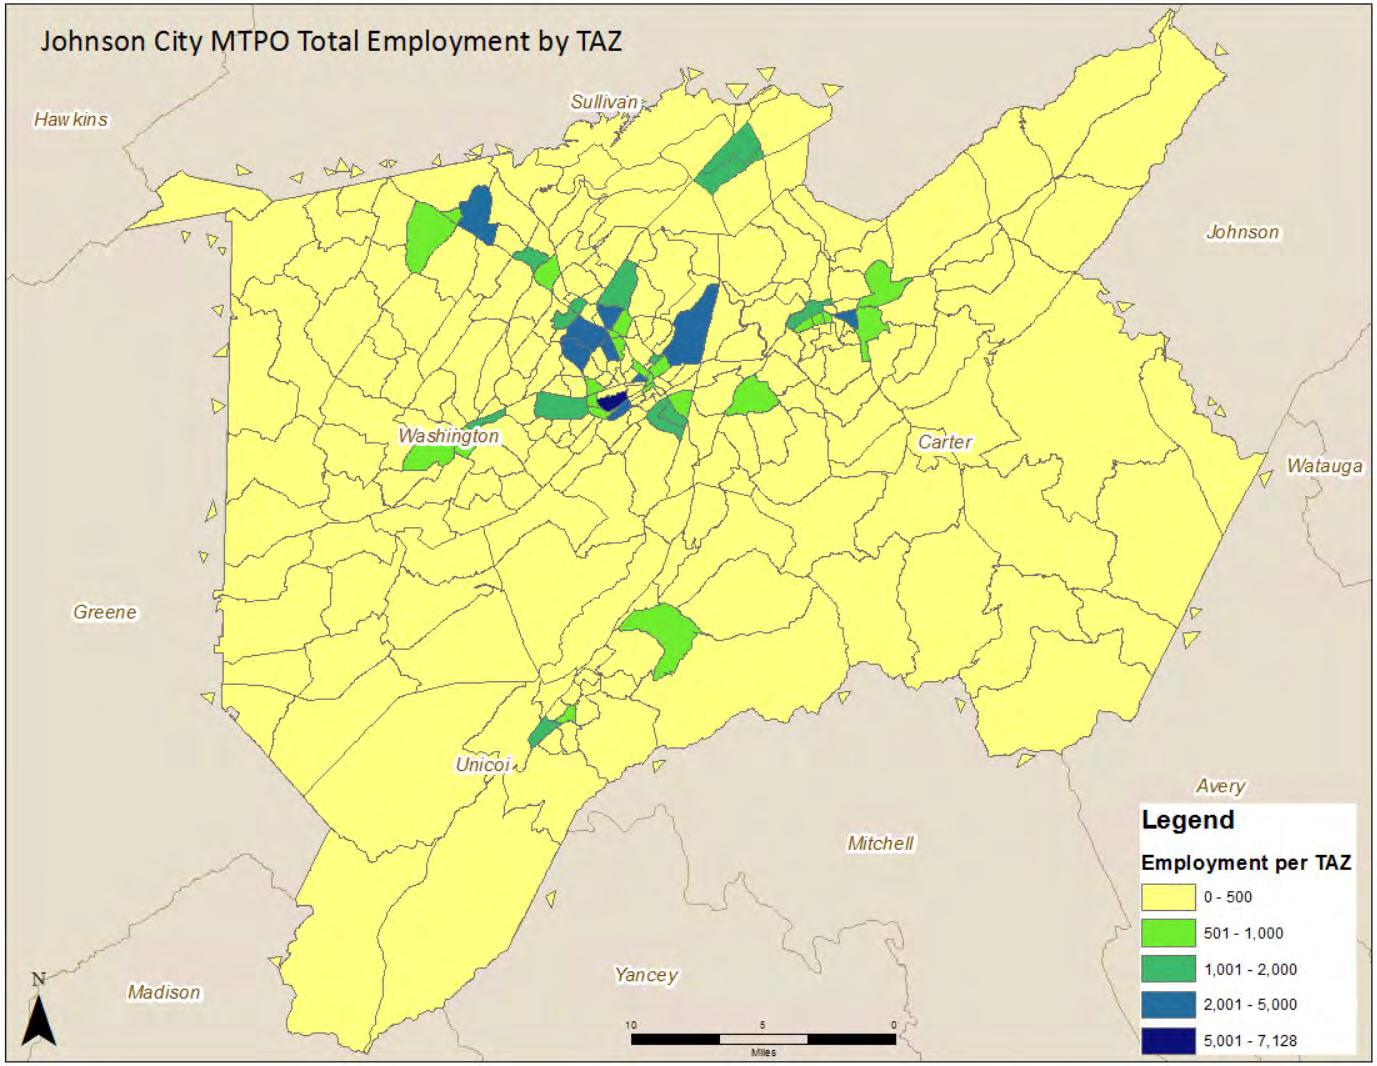
4.4 Existing and Future Employment
In 2020, there were approximately 201,980 jobs in the 4-county region. Of these jobs, 71,032 were located within the Johnson City MTPO area, which is expected to see an increase of 18,200 jobs by 2050. Table 4-4 illustrates this projected employment increase The 2020 estimates for employment were sourced from a TDOT purchase of the Infogroup dataset, which provided point-specific employment by category in the region as of February 2020. This snapshot of employment allowed for assessment of current jobs in the region prior to the COVID-19 pandemic.
Table 4-4 Projected Employment by County and MPA
Source: Woods & Poole, 2019, InfoUSA 2020
For the purposes of modeling travel, jobs in the Johnson City region are grouped into six categories:
• Agricultural – farming, forestry, fishing, mining, construction
• Government – Federal civilian, Federal military, state/local government
• Office – information, finance, insurance, real estate, leasing, professional and technical services, management, administration, waste services
• Retail – retail trade
• Service – educational, health care, social assistance, arts, entertainment, recreation, accommodation, food services, other services (except public administration)
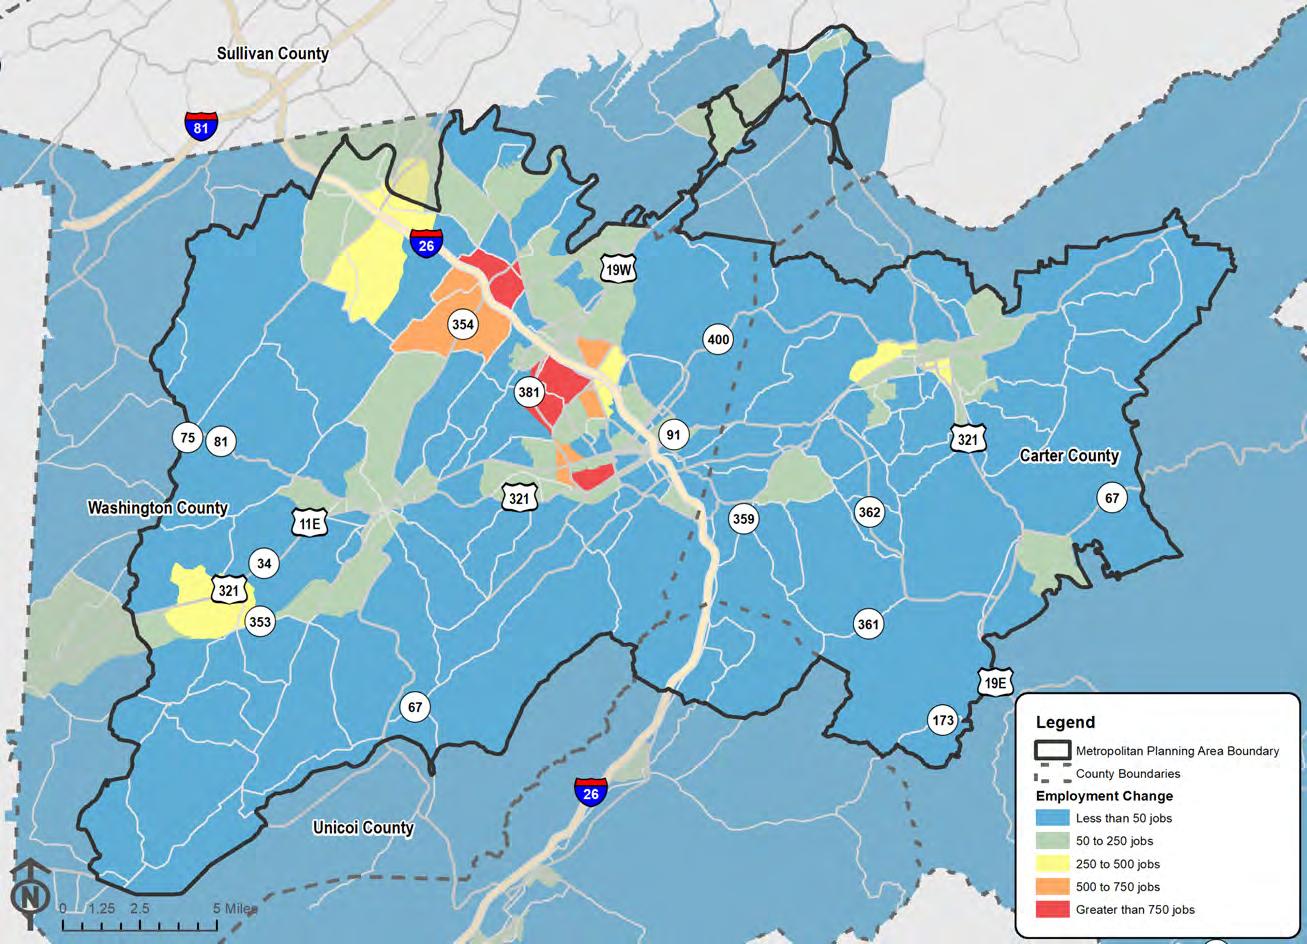
Figure 4-6 illustrates projected employment trends by sector in the 4-county region that contains the Johnson City MTPO area. This data is sourced from the Woods & Poole dataset, which projects employment changes at a county-level across the country. Consistent with national trends, job losses are expected for the agricultural and manufacturing sectors, while employment in the retail, office, government, and service sectors is expected to increase. Figure 4-7 highlights the total change in employment across all sectors by TAZ over the planning horizon.
Figure 4-6. Historic and Future Employment Trends by Sector in the Region
Source: Woods & Poole, 2019
4-7. Employment Change by TAZ (2020-2050)
Figure
The region’s commuting patterns reflect the interconnectedness of the Johnson City MTPO region. According to U.S. Census data, in 2019, of the approximately 72,000 workers employed in the MTPO area, more than 34,000 people commute into the MTPO area each day for work, and an additional 28,000 people commute outside of the MTPO area each day to access their jobs (Figure 4-8). More than 38,000 workers both live and work within the MTPO area
4-8. Commuting Patterns (2019)
Source: U.S. Census OnTheMap, 2019
While the majority of workers are employed in their county of residence, a significant number of workers travel to neighboring counties to access their jobs. Approximately 107,000 workers commute within the larger 4-county region each day. The county-to-county commuting patterns across the region are shown in Table 4-5. With a third of residents commuting across county lines for work, this data highlights the need for a regional approach to transportation.
Source: U.S. Census OnTheMap, 2019
Figure
Table 4-5. Commuting Trip Origins and Destinations (2019)
MULTIMODAL SYSTEM AND PERFORMANCE
5.0 Multimodal System and Performance
The multimodal transportation system in the Johnson City MTPO area includes highways and local streets, railroads, transit, sidewalks, bikeways, and trails, all of which are used to move people and goods where they need to go, both locally and regionally. A connected transportation system that is accessible to all helps support the region’s economic health and desirability as a place to live and do business.
5.1 Roadway Network
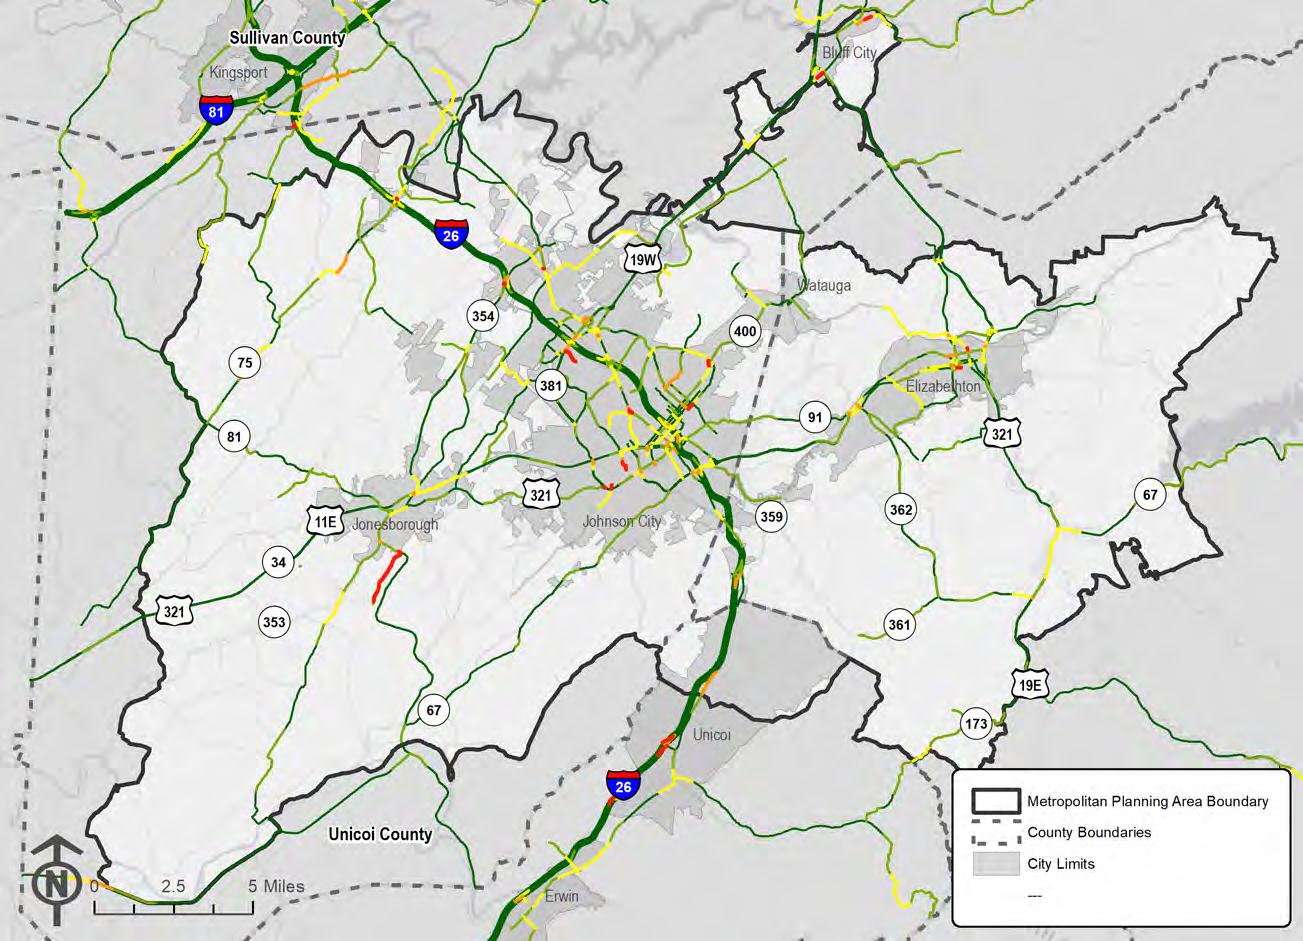
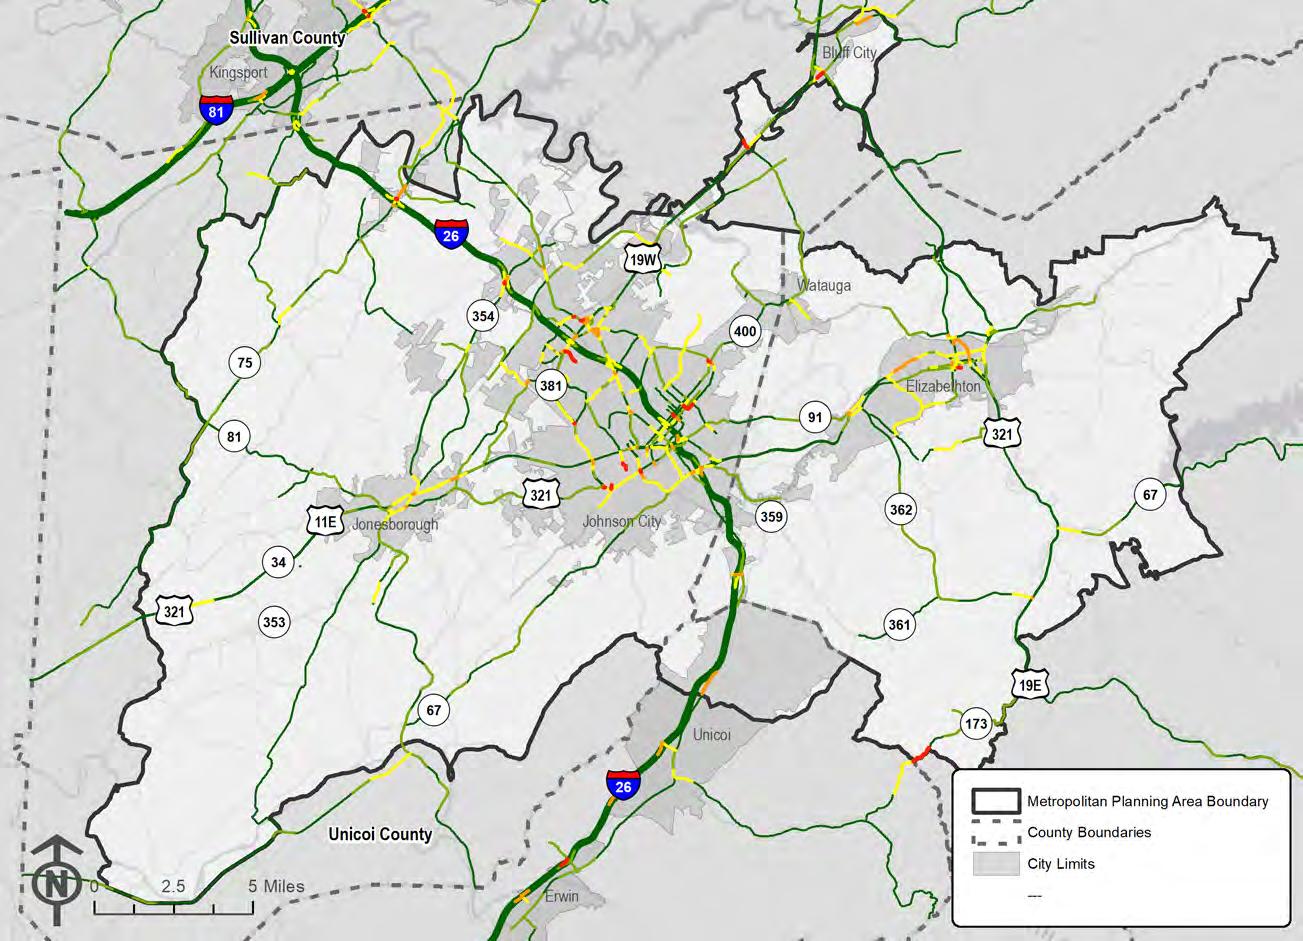
There are 1,610 miles of roadways within the Johnson City MTPO area, including 19 miles of interstate (I-26), 186 miles of arterial roads, 295 miles of collector roads, and 1,110 miles of local roads. Each roadway is classified by its function, which reflects the level of accessibility and mobility it provides. For example, interstates allow high speed travel and regional connectivity, with minimal local access points, while arterials and collectors distribute relatively high volumes of vehicles between destinations Local roads, in contrast, tend to have lower speeds and more access to individual properties and businesses. Table 5-1 organizes the mileage of each type of roadway within the MTPO area.
Table 5-1. Roadway Functional Classification
Source: TDOT
Traffic and Congestion
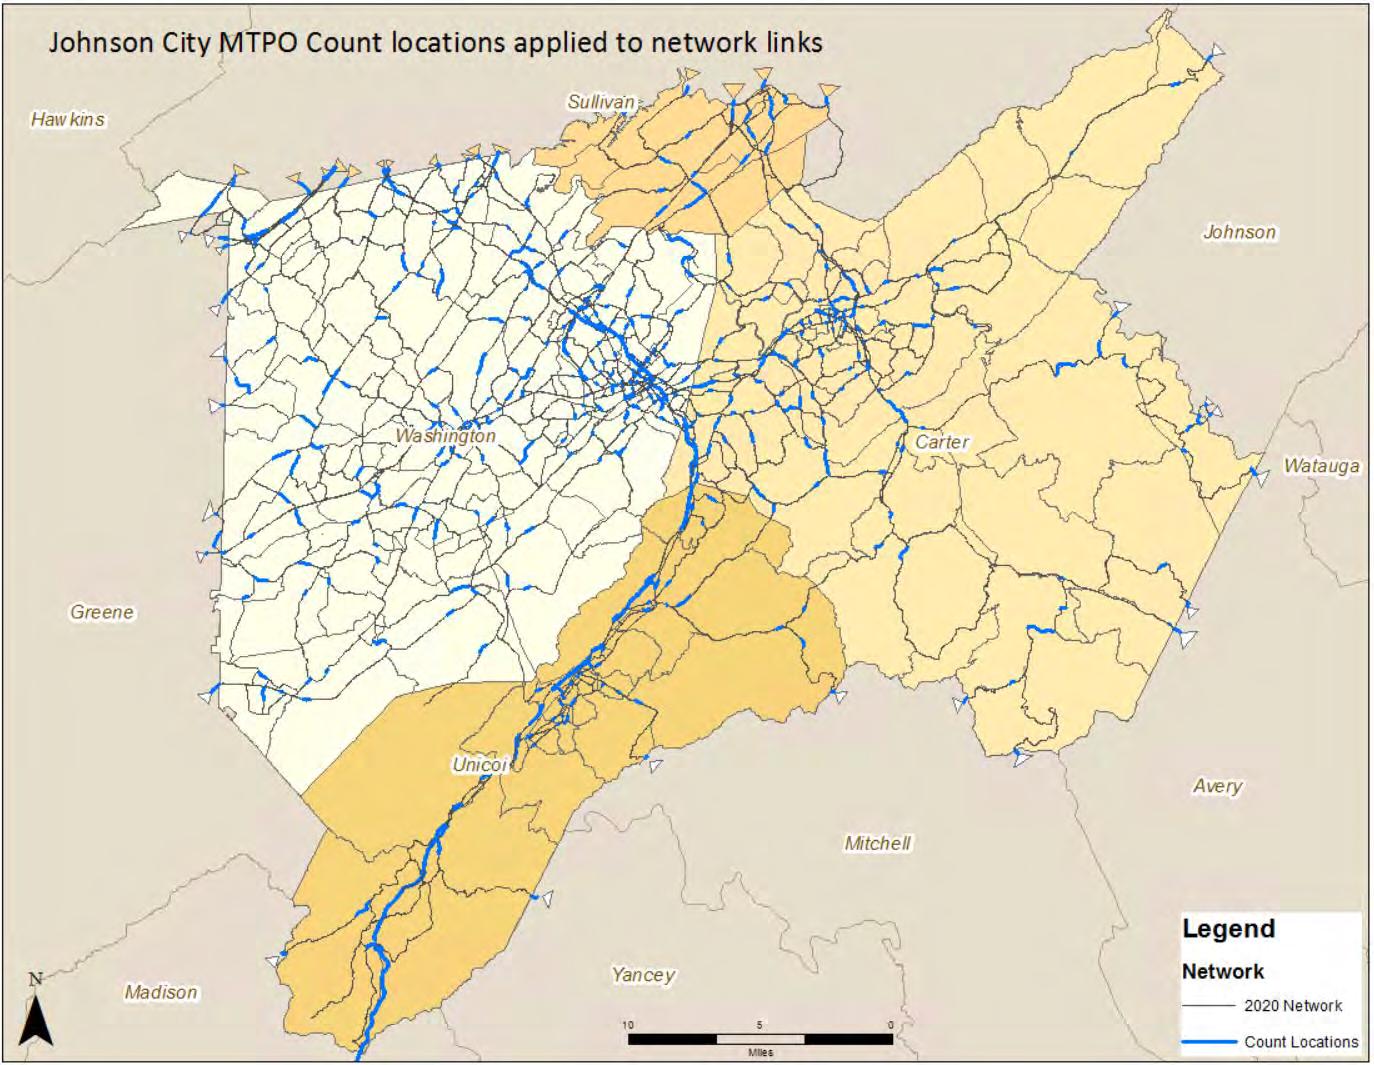
Traffic volume data are collected for major roadways by TDOT, including Annual Average Daily Traffic (AADT), roadway congestion, and safety metrics. This data is used to understand facility use, plan road maintenance, identify roadway segments with safety issues, and determine operational and capital improvements to address congestion.
Data on roadway congestion is purchased by TDOT and is developed using anonymized GPS data from smartphones, watches, and other GPS-enabled technologies in vehicles. This data was used to identify congested locations in the MTPO area during the AM and PM peak periods by analyzing vehicle speeds gathered over 15-minute increments throughout weekdays during January 2022. Figure 5-1 and Figure 5-2 display the severity of congestion during the AM peak (from 7 to 9 AM) and the PM peak (from 4 to 6 PM), respectively. These maps show percentages that compare how fast vehicles travel compared to the posted speed limit. Lower speed percentages highlight areas that are experiencing more congestion and delay compared to free flow speeds.
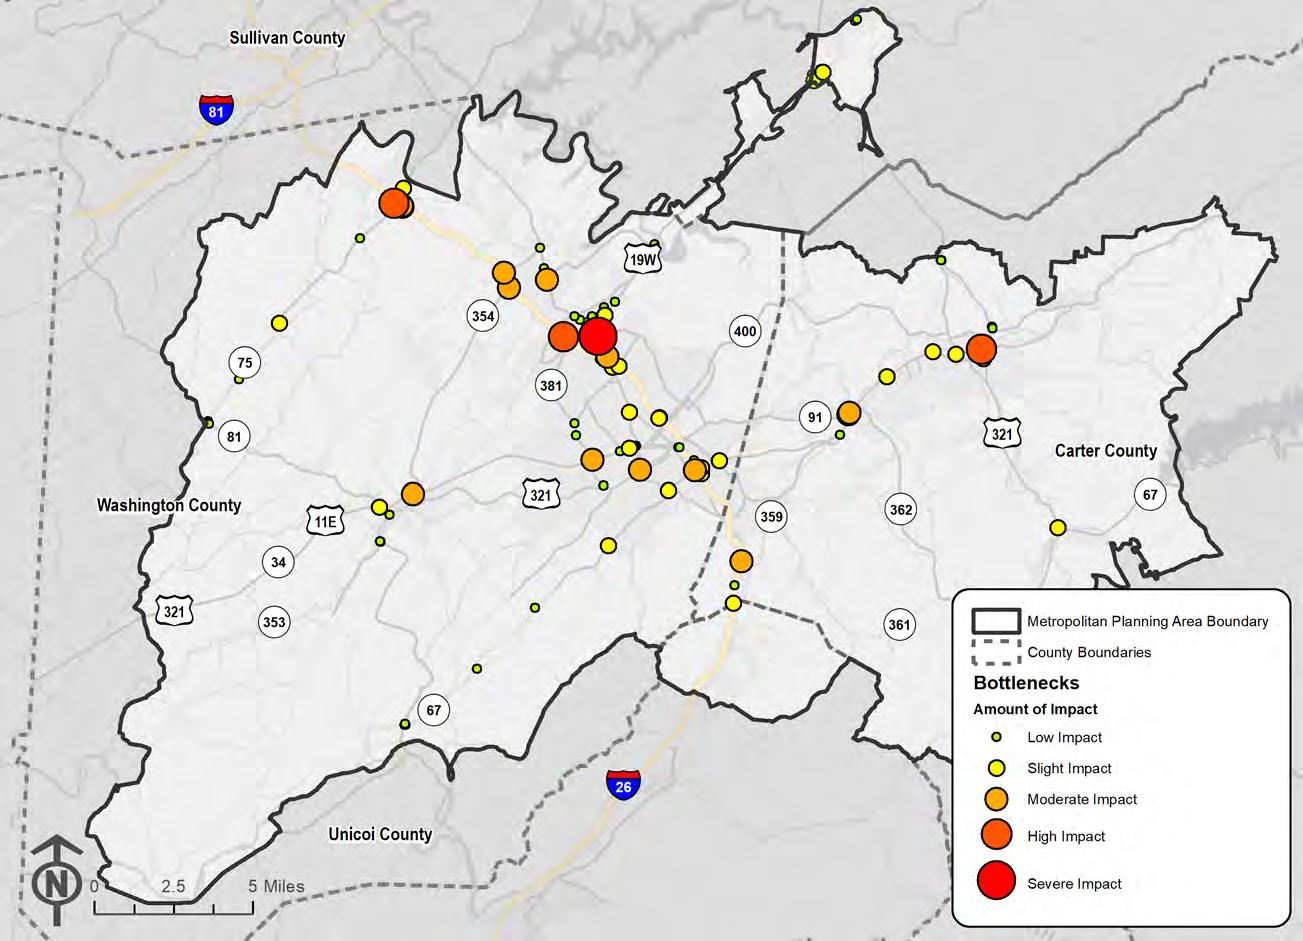
This data can also be used to identify specific locations where vehicles experience excessive delay based on vehicular speeds. Also known as bottlenecks, these locations may cause slower vehicle speeds due to a variety of factors such as geometric deficiencies, over-capacity facilities, construction, poor weather, traffic incidents, and others. In total, there were 135 bottlenecks that occurred within the Johnson City MTPO area during January 2022. Table 5-2 lists the top five worst bottlenecks based on the combined impact of their duration (i.e., the average amount of time per day that congestion is identified as originating in each location), length, and frequency, and Figure 5-3 shows their locations in the MTPO area.
Table 5-2. Top Bottleneck Impacts
2 Suncrest Drive (SR
5 I-26 East at State of Franklin (Exit 19)
Source: INRIX, 2022
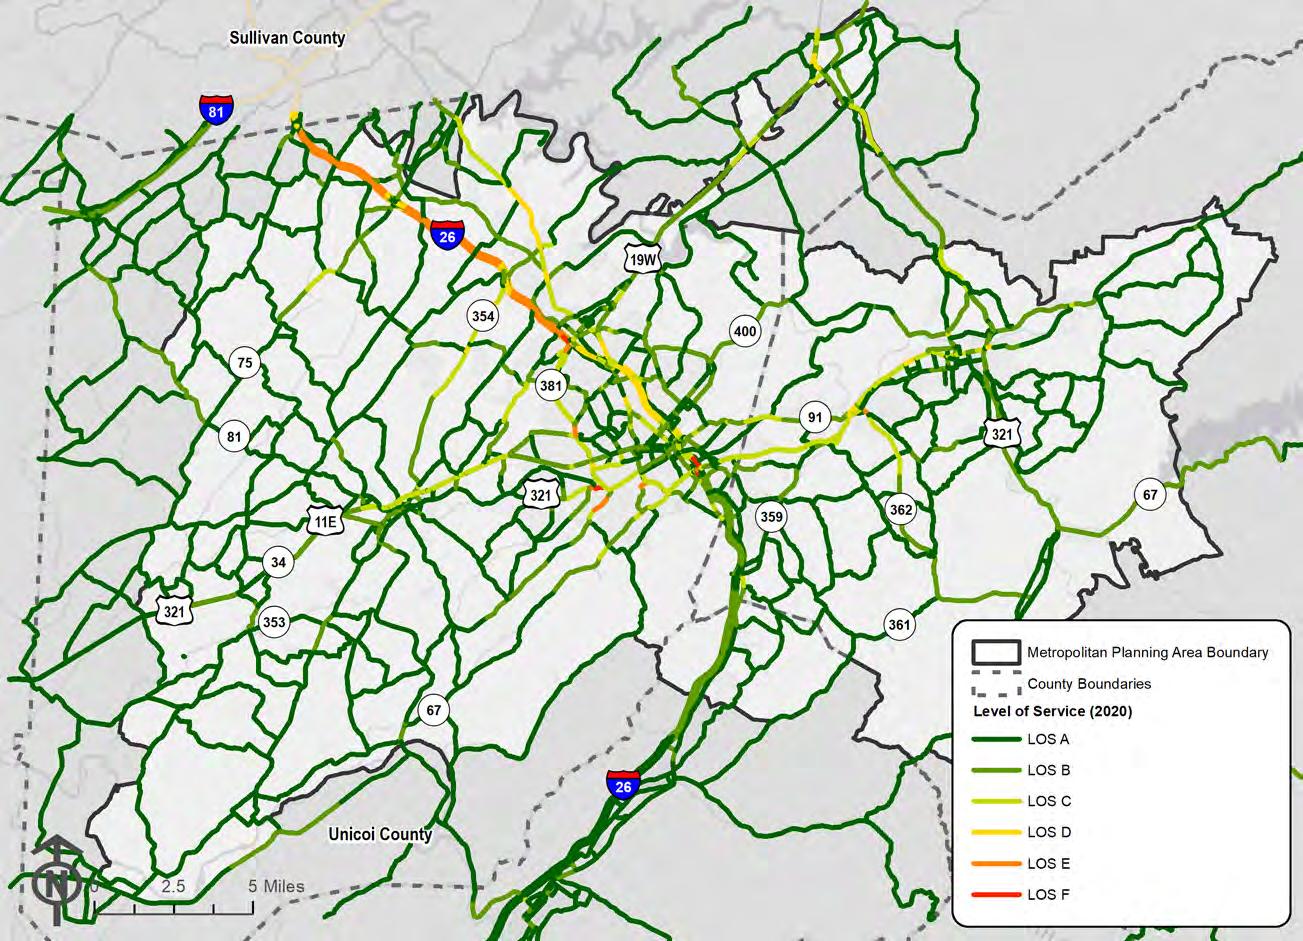
In addition to functional classification, roads are also assigned a “Level of Service”, or LOS. LOS is used to generally describe a road’s traffic conditions and how well it serves to move vehicles, by comparing traffic volumes and roadway capacity. While LOS ignores other modes of travel, such as walking and bicycling, it can be a useful indicator of existing and expected traffic conditions.
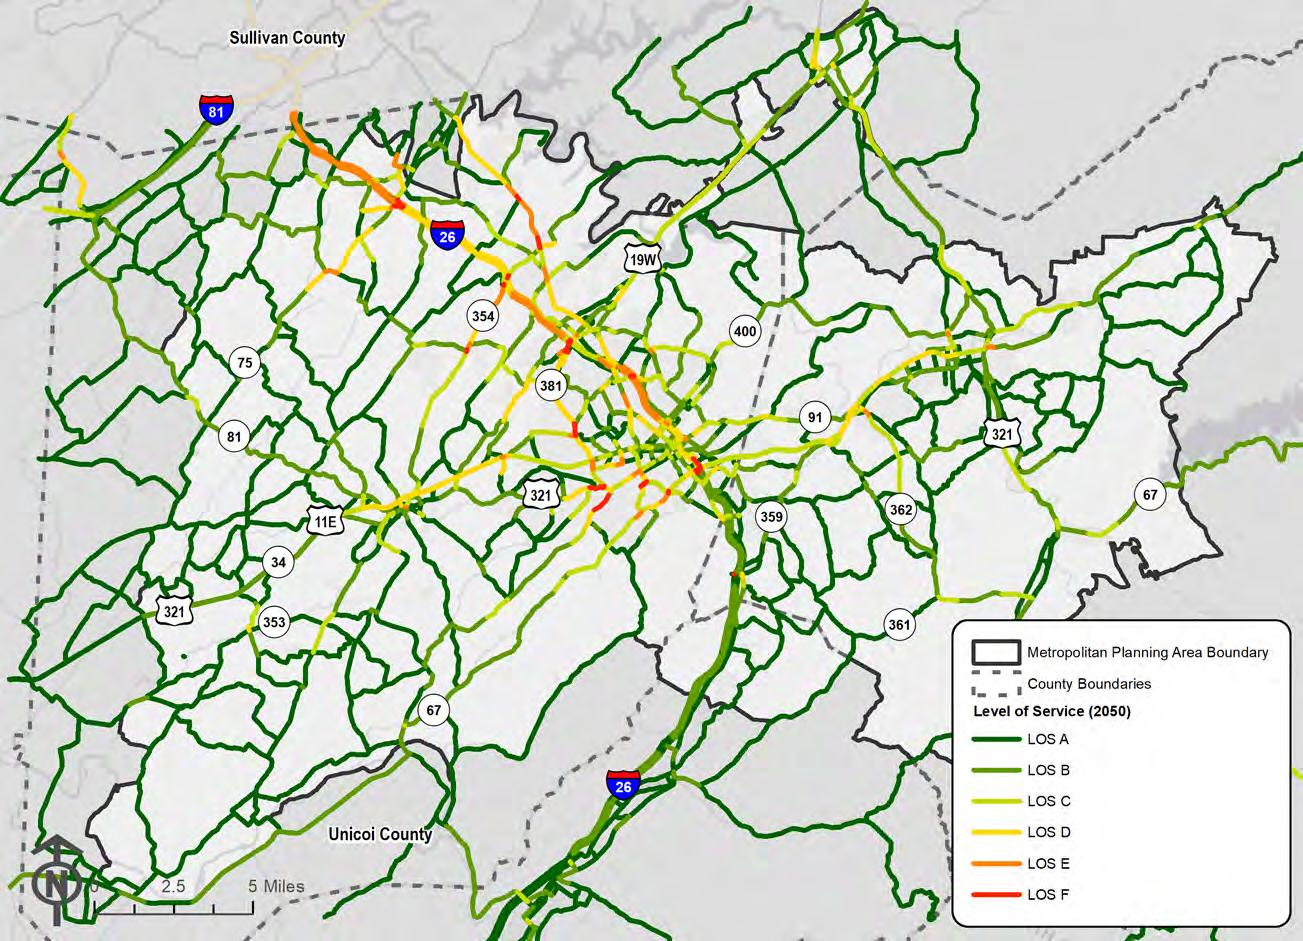
A road’s capacity is generally determined by its speed and number of lanes, and each road is assigned a letter grade between A and F, where LOS A denotes roads with free flow conditions and LOS F represents roads where demand far exceeds capacity. In more developed urbanized
areas, LOS E is generally considered an acceptable level of congestion. Figure 5-4 illustrates the LOS on the region’s roadways across an average day under existing conditions. In 2020, approximately 99% of roadway miles in the MTPO area operate at LOS E or better. Primary exceptions include portions of North State of Franklin Road and Oakland Avenue in Johnson City.
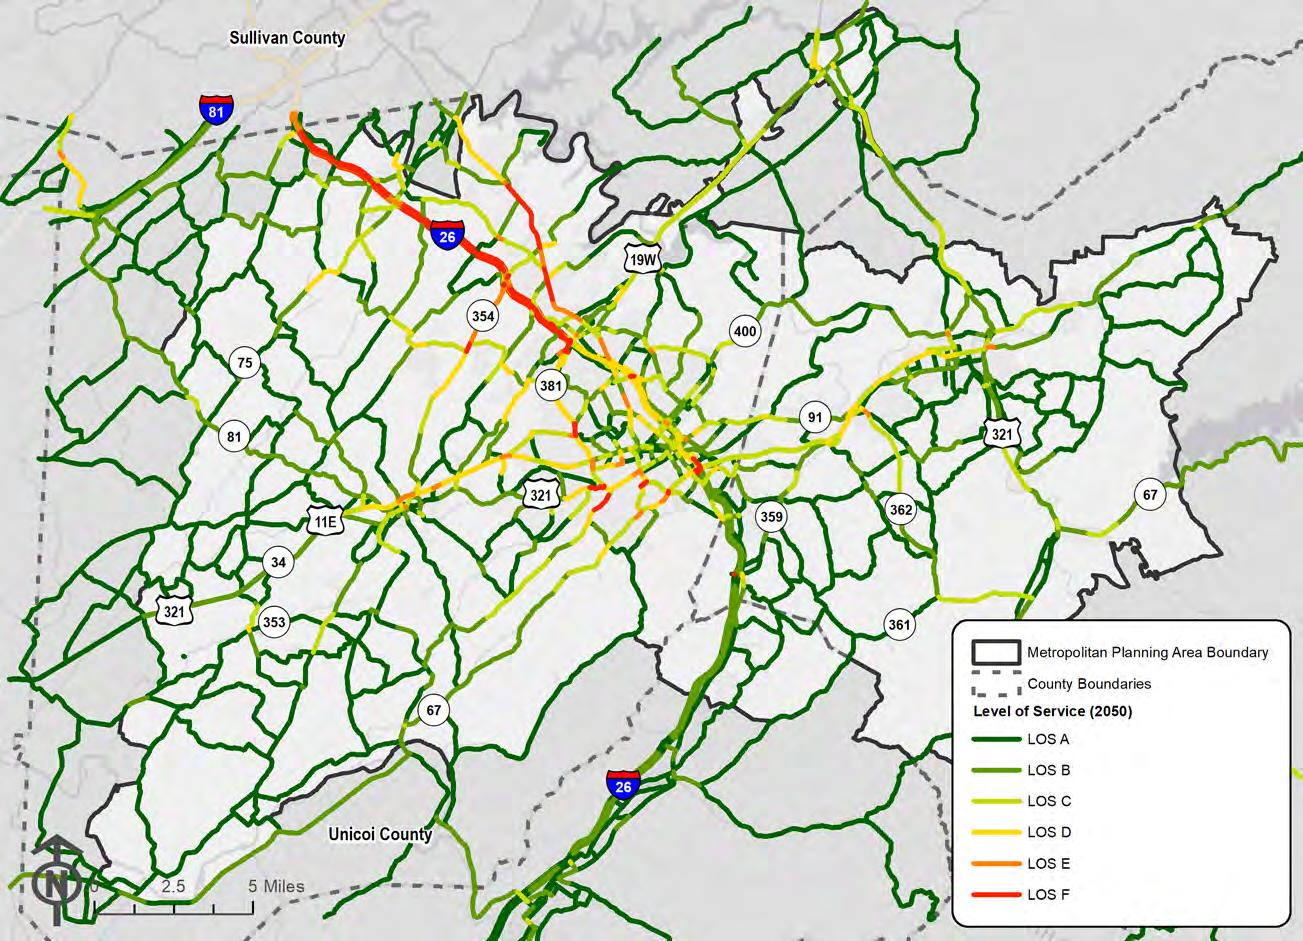
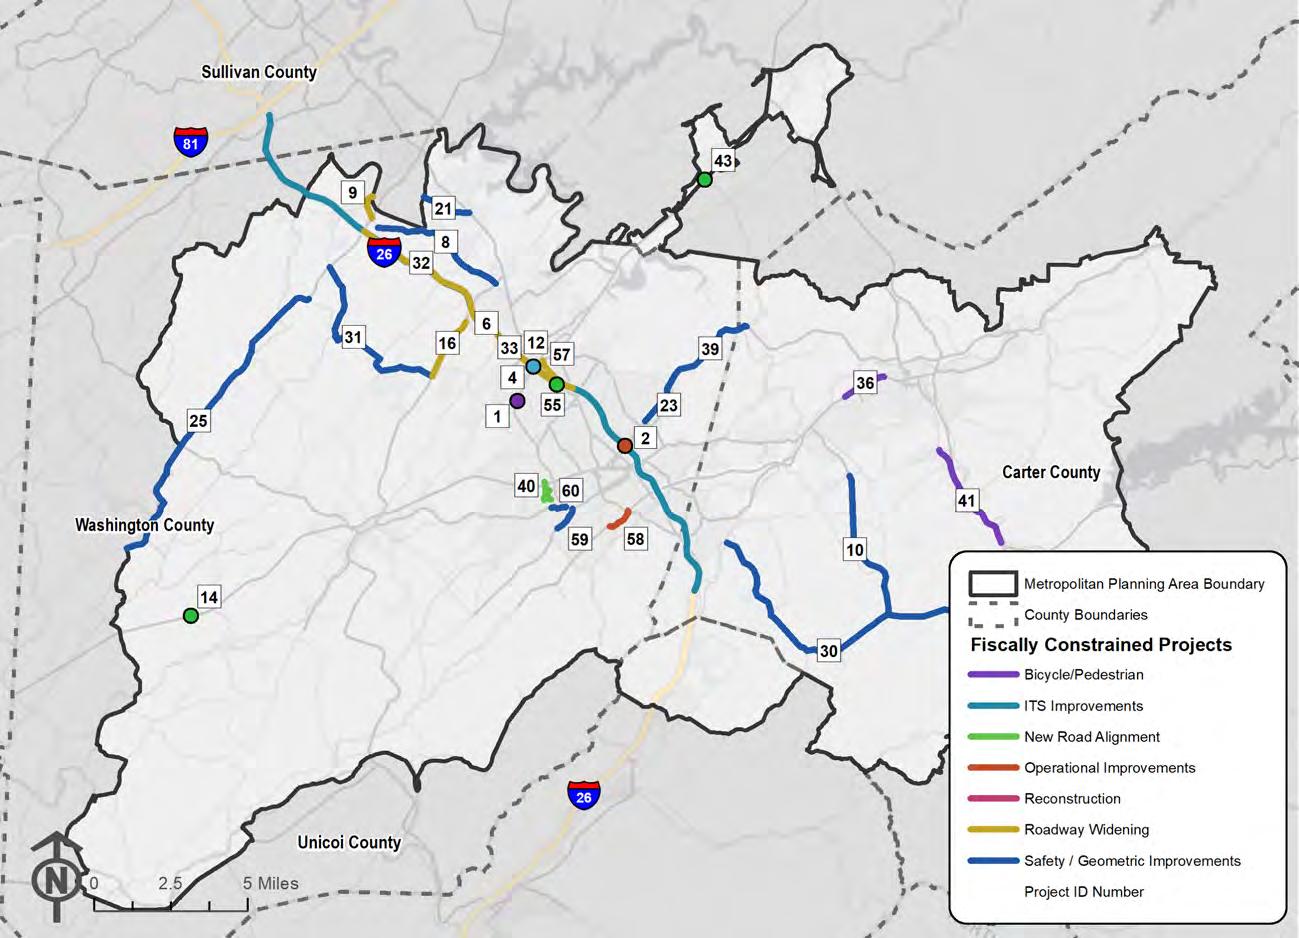
To assess future transportation needs, the regional travel demand model is used to project the changes in roadway LOS after accounting for growth in population and employment in the region. A common practice is to examine how well the future transportation system operates if no more improvements were made to the current roadway facilities beyond those projects that have committed funding. This scenario is termed an existing plus committed (E+C) model scenario and allows for the prioritization of improvements based on future growth in the region. For planning purposes, committed projects in the E+C model scenario include are those projects that are likely to be complete by 2050 based on current funding obligations in the MTPO’s Transportation Improvement Program (TIP). A complete list of these projects is included in Table 5-3. Without additional improvements beyond these projects, the LOS on many of the region’s roadways is expected to deteriorate slightly as shown in Figure 5-5 Specifically, the percentage of streets operating at LOS D or better is projected to fall from 99% to 97% by 2050
5-1. AM Peak Period Congestion (2022)
More Less Percentage of Segment Congested (AM Peak, 2022)
Figure
Percentage of Segment Congested (PM Peak, 2022)
Figure 5-2. PM Peak Period Congestion (2022)
Figure 5-3. Top Bottleneck Locations (2022)
5-4. Existing Daily Level of Service (2020)
Figure
Table 5-3. E+C Projects
Lead Agency Project/Route From/To
TDOT
TDOT
Boones Creek Road (SR 354) I-26 to Christian Church Road Widen Widen existing 2 lane roadway to 4 lanes Completed
Boones Creek Road (SR 354) and Bugaboo Springs Road Improvements
TDOT
TDOT
Bristol Highway (SR 34) at Industrial Park Road Traffic Signal Upgrade
Elk Avenue Bridge Repair
Johnson City Christian Church Road
Washington County Claude Simmons Road
Boones Creek Road (SR 354) at Bugaboo Springs Road
Intersection of Bristol Highway (SR 34) and Industrial Park Road
Spot safety improvements, signage, guardrail, striping, Safety Edge Under Development
Exit 24 on I-26 at University Parkway (SR 67) Interchange Improvement Ramp Modification Completed
Exit 17 on I-26 at Boones Creek Road (SR 354) Interchange Improvement Interchange modification Completed
Lead Agency Project/Route
Knob Creek Road at State of Franklin Road (SR 381)
Johnson City
TDOT
Intersection and Approaches
Improvements
Intersection Knob Creek Road at State of Franklin Road (SR 381), including intersections of Knob
Creek & Peoples
Street/Med-Tech
Pkwy, & Knob Creek & Fitness Way
Intersection
Improvement
Add turn lanes at Knob Creek & Med Tech, Knob Creek & Fitness Way, Knob Creek & Peoples with realignment on Peoples Street Under Development; estimated $750,000 for construction
TDOT
Knob Creek Road
Extension - Section 1
Elizabethton
Knob Creek Road
Extension - Section 2 (IA)
West of Mizpah Hills Drive to Marketplace Boulevard
Reconstruction
Construct a new 5 lane (overpass crossing CSX RR)
Under Development; currently in right- ofway with additional $35M left for construction, which TDOT will fund and manage
Linear Path and Tweetsie Trail
Connector
North of Mizpah Hills Drive to Boones Creek Road (SR 354)
Reconstruction New alignment, sidewalks and multiuse trail 2/3 lane
Hattie Avenue, from Cedar Avenue to South Riverside Drive Bicycle/ Pedestrian
Two 5-foot paths
Under Development; currently in preliminary engineering with additional $41.4M left for right-of-way and construction
connecting Linear Path at South Riverside Drive to the Tweetsie Trail at Cedar Avenue. Under Development; estimated $360,000 cost
Lead Agency Project/Route From/To
Jonesborough
New Traffic Signal at East Jackson Boulevard (SR 34) and Tiger Way
TDOT Okolona Road (SR 359)
Intersection of East Jackson Boulevard (SR 34) at Tiger Way - Jonesborough Traffic Signal New traffic signal In preliminary engineering phase
Johnson City
Old Gray Station Road - Section 2
Milligan Highway (SR 359) to South Roan Street
Safety / Geometric Spot Improvement
Bobby Hicks Highway (SR 75) to just north of Buckingham Road Widen
Safety/geometric improvements (including paved shoulders, improvements at select locations/intersections as determined through the project development process Not Started
Upgrade Traffic Signal at Bobby Hicks Highway (SR 75), widen to 3 lanes with turning lanes to intersection with Glen Mize Way; from Glen Mize Way to Boones Creek Road (SR 354)improved 2 lanes with turn lanes Under Development
Elizabethton Overmountain Drive Extension
Elizabethton
Overmountain Drive near the intersection of Militia Court New Construction
Overmountain Drive Roundabout in Elizabethton Overmountain Drive Entrance to Walmart Intersection Improvement
Extend Overmountain Drive to the hospital access road Under Development; estimated $670,000 cost
Install a roundabout to replace 3-way stop on Overmountain Drive Under Development
Lead Agency Project/Route From/To
Elizabethton
TDOT
Riverfront Linear Walking PathPhases IV & V
Phase V trail begins at the termination point of the existing trail along Race Street and ends at the termination point of the existing trail along West Riverside Drive. Phase IV trail begins at the termination point of the existing trail behind Lowe's adjacent to Overmountain Drive and ends at Sycamore Shoals State Park.
Signalization
Improvements for Elizabethton at Two Intersections
TDOT SR 91 Extension
Bicycle/ Pedestrian Linear walking path
Under Development; currently in preliminary engineering with additional $630,000 left for construction
Elk Ave (SR 67) and Milligan Highway and Mill Street Intersection Improvement Upgrade and install traffic signals Completed
Veterans Memorial Parkway (SR 37/US 19E) to West Elk Avenue (US 321)
Reconstruction
Add center turn lane along the 4-lane undivided portion of West Elk Avenue from Holly Lane to North Roan Street and reconfigure intersection of North Roan
Project is under construction, to be completed on or before June, 2023
Lead Agency Project/Route
Johnson City
Elizabethton
TDOT
State of Franklin Road (SR 381)
Traffic Management Center - Elizabethton
Traffic Signal for North Roan Street (SR 36) at Mountainview Road
TDOT
Traffic Signal for State of Franklin Road (SR 381) and Harris Drive
Johnson City Traffic Signal in Gray
Intersection with Indian Ridge Road and Skyline Drive
TDOT
TDOT
Traffic Signal
Upgrade at Broad Street and Veterans Memorial Parkway
Veterans Memorial Parkway (SR 37 /US 19E) and Gap Creek Road (SR 361)
Roadway Widening Widen roadway and add turn lanes Under Development; estimated $1,000,000 for construction
$1,150,000
Figure 5-5. Projected Daily Level of Service (2050 E+C)
Roadway Safety
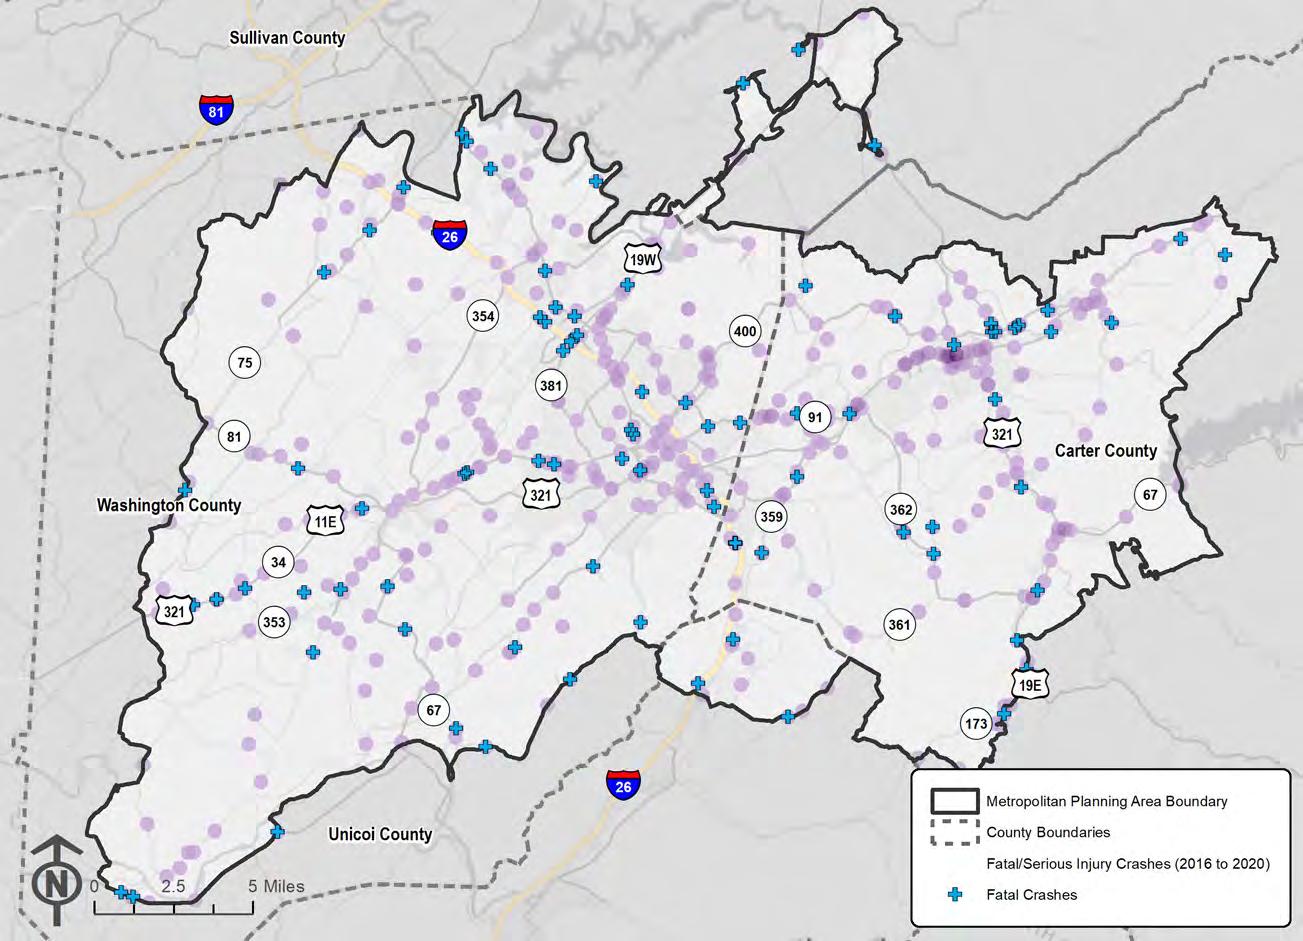
Between 2016 and 2020, there were 27,006 crashes in the Johnson City MTPO area. As shown in Figure 5-6, these crashes are largely concentrated in the more densely populated areas within the region with more than 74% of crashes having occurred within city jurisdiction boundaries in this period Approximately 53% of crashes occurred within the Johnson City limits In addition, concentrations of crashes can be observed in Elizabethton and at various interchanges along the I-26 corridor.
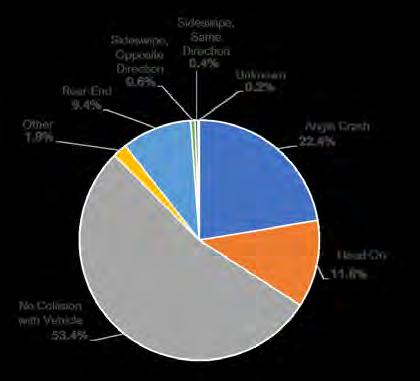
Of the 27,006 crashes, 429 resulted in a serious injury and 90 resulted in a fatality. Fatal and serious injury crashes were concentrated along SR 91/US 321 in Elizabethton, along West State of Franklin Road in Johnson City, and at US 19E and US 321 in Hampton (Figure 5-7). Of the fatal and serious injury crashes, more than half (53.4%) were crashes that did not involve a collision with another vehicle These crashes can be caused by a variety of factors, from human errors such as speeding and distracted driving, to roadway design deficiencies, such as shoulder widths and horizontal and vertical curvature.
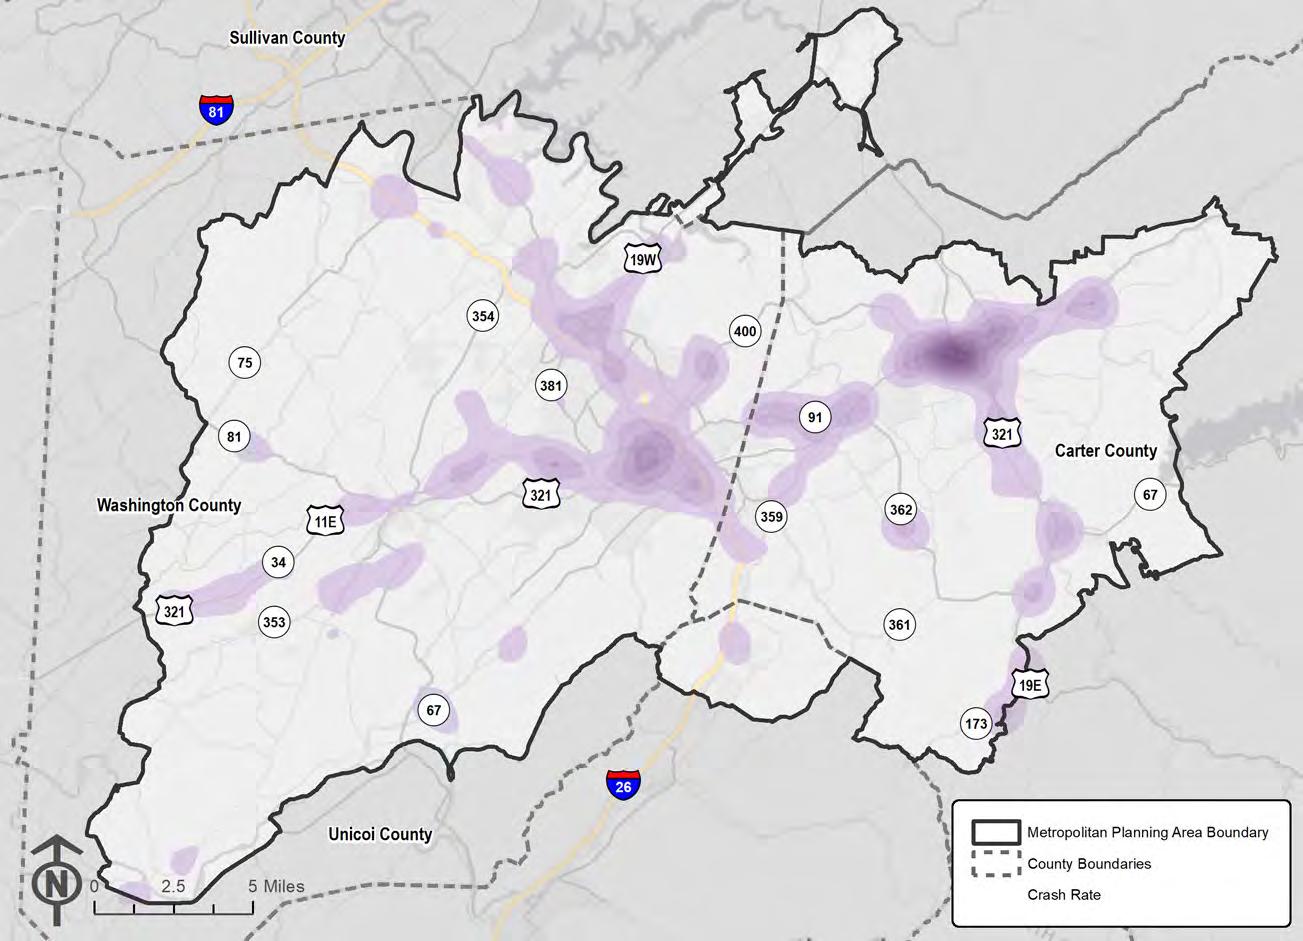
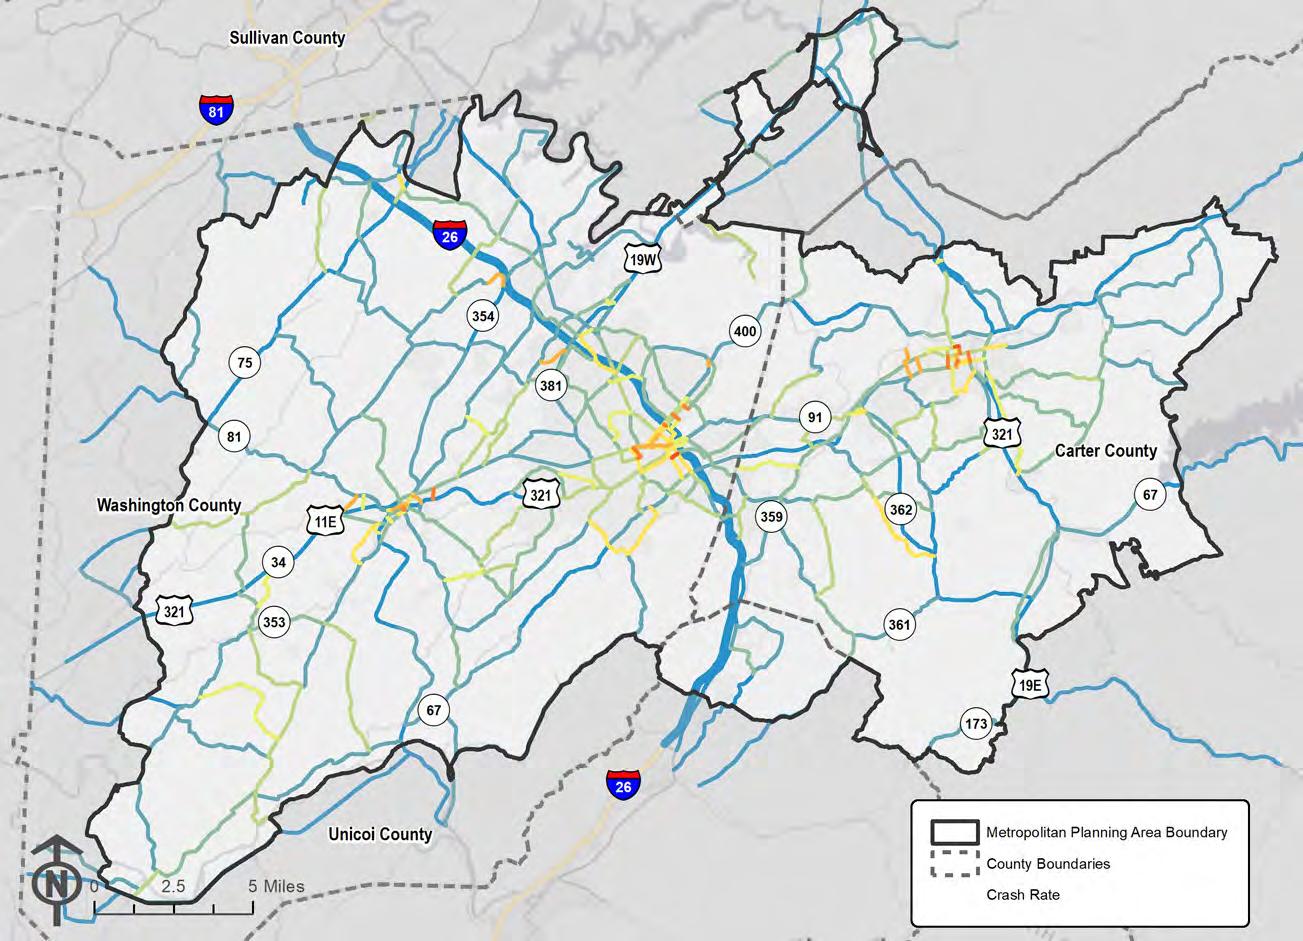
Figure 5-8 illustrates the crash rates for roadway segments within the Johnson City MTPO area. These rates normalize the number of crashes that occur by each roadway segment’s traffic volumes and segment length. Crash rates are highest in the downtown cores of the region’s cities, in particular along Forrest Drive in Jonesborough, West Maple Street in Johnson City, and East Mill Street in Elizabethton
There were a number of safety issues identified through the public and stakeholder engagement process as well as previous planning efforts including, but not limited to, geometric and design issues along parts of I-26, SR 91, Old State Route 34 (SR 353), Leesburg Road, and safety issues caused by congestion at the I-26 interchanges.
5-6. All Vehicular Crashes (2016-2020)
Figure
5-7. Fatal and Serious Injury Crashes (2016-2020)
Figure
5-8. Crash Rates by Roadway
Segment (2016-2020)
Figure
Safety priority areas are outlined in Tennessee’s Strategic Highway Safety Plan (SHSP), which was last updated in 2020 by TDOT as a partnership between the Tennessee Department of Safety and Homeland Security (TDOSHS), FHWA, and the Federal Motor Carrier Safety Administration (FMCSA). The SHSP identifies statewide crash trends and suggests strategies to address safety issues that are related to federal safety performance measures. There are 16 contributing factors outlined in the SHSP as key influences of fatal crashes, including speeding, impaired driving, distraction, and other overlapping and interrelated behaviors. These factors are listed in Table 5-4 for the fatal crashes within Carter, Sullivan, Unicoi and Washington Counties between 2016 and 2020.
The SHSP outlines six emphasis areas to reduce the number of crashes that result in serious injuries or fatalities, including: data collection and analysis, driver behavior, infrastructure improvements, vulnerable roadway users, operational improvements, and motor carrier safety. These emphasis areas are used to establish mitigation strategies, such as educational and advocacy initiatives targeting aggressive and impaired driving, conducting road safety audits to prioritize road segments with disproportionate levels of roadway departure related crashes, and TDOT-led spot safety studies to address a variety of safety issues. Please note that a single crash can have multiple contributing factors, so the totals for each column will not be the same as the total number of fatal crashes
Table 5-4. Contributing Factors of Fatal Crashes, 2016-2020
Source: Fatality Analysis Reporting System (FARS)
Since the last MTP update, the Johnson City MTPO has focused on finishing major projects in the region through partnerships with the Tennessee Department of Transportation and its member jurisdictions, including:
• Completing a new diverging diamond interchange at State Route 354/Boones Creek Road and Exit 17 on I-26, which included multiuse paths for people walking and bicycling in the area;
• State Route 91 Improvements in Elizabethton, which began construction in 2022; and,
• The Knob Creek Section 1 project (TDOT PIN 102620.00; currently in the ROW phase), which will connect to a newly created State Route. This project also includes multiuse paths, which will expand the existing bicycle and pedestrian network in the MTPO region.
With the completion of these projects and future projects moving into the construction phase, the MTPO will continue to focus on safety for all users of the transportation system. As a start to this process, the Federal Highway Administration selected Washington County as a pilot project technical safety assistance that resulted in the creation of a report titled, Federal Highway Administration Local Road Technical Assistance Corridor Safety Analyses and Recommendations. The draft report was completed in October 2022, and the MTPO will assist Washington County to pursue funding opportunities, particularly the new grant opportunities in the BIL, to implement the recommendations in this report. The MTPO is currently reviewing the draft document and plans on using it as a guide for other jurisdictions in the MTPO area
Since the development of the previous MTP, TDOT has provided all MPOs in Tennessee with access to the “AASHTOWare Safety” web-based software program. This new tool allows MTPO staff access to analyze crash data in an effective manner. The software will the MTPO to:
• Query crash data for any roadway or intersection across the state;
• Export raw crash data for more in-depth analyses;
• Generate custom reports, charts, and spreadsheets;
• Explore crash data in a spatial, map-based interface;
• Filter crashes based on crash location, as well as various crash, and roadway attributes; and,
• Explore crash data dashboards for particular areas of interest, including specific emphasis areas (e.g., pedestrian and bicycle crashes, hit-and-run crashes, etc.).
To further support safety improvements in the region, Johnson City MTPO staff will continue to identify select roads for TDOT’s safety audit program. The MTPO will use this information to pursue “Safe Streets for All” grant opportunities through the BIL. Additionally, as outlined in Section 5.3 of the MTP, all jurisdictions in the MTPO consider complete streets in the design of any new and improved roadways.
5.2 Public Transportation
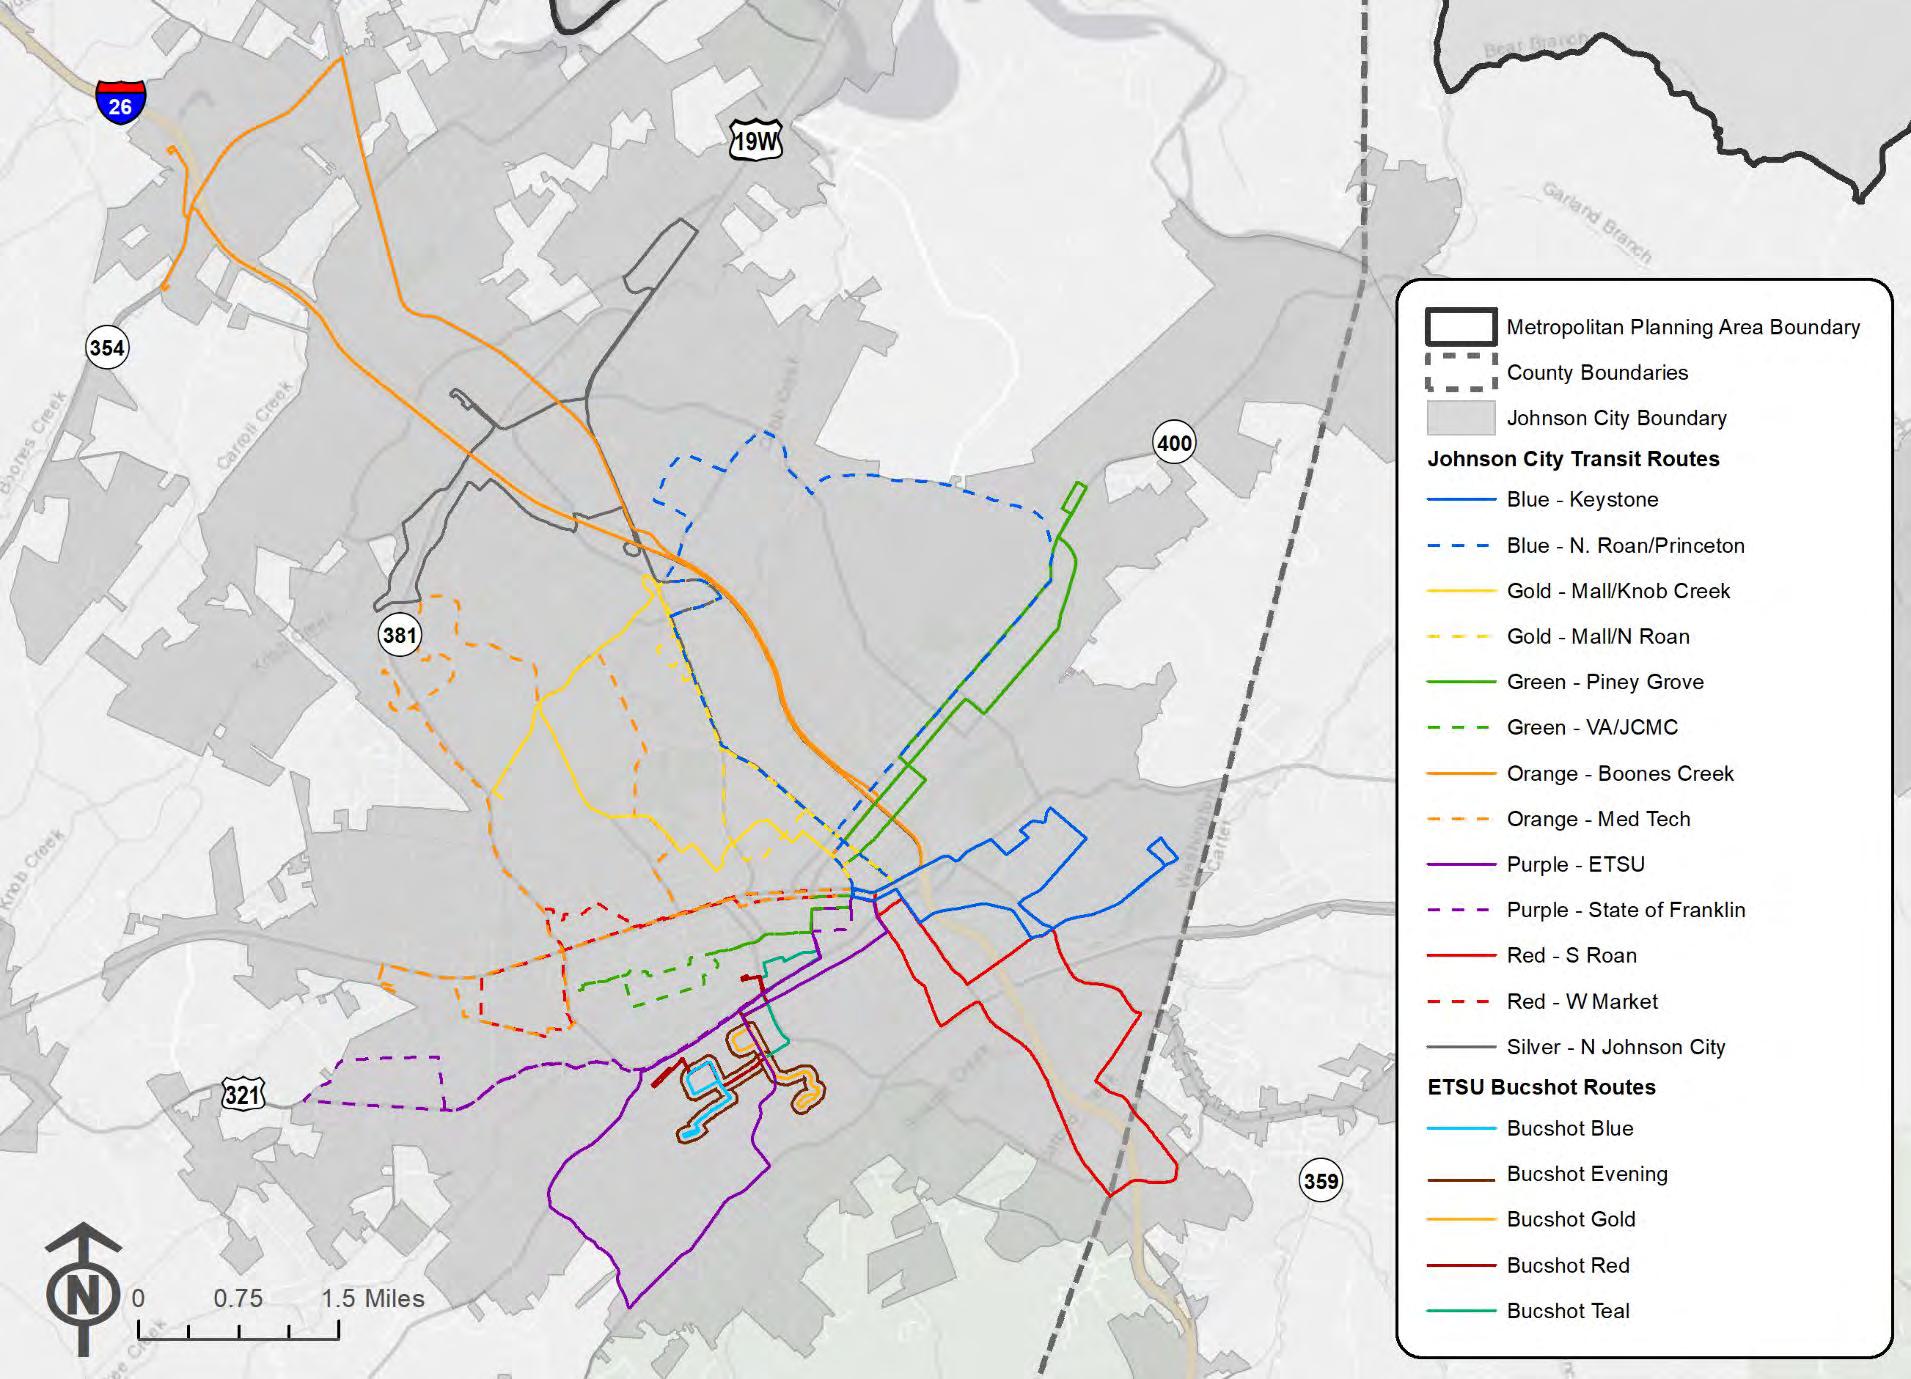
Two transit providers operate within the Johnson City MTPO area Johnson City Transit (JCT) provides fixed route and demand response services within the Johnson City corporate limits. JCT also provides fixed route shuttle service on the East Tennessee State University Campus (called Bucshot), paratransit, and a Job Access program. JCT’s buses cover 15 fixed routes with headways that range from 60 to 90 minutes (Figure 5-10). JCT operates Monday through Friday from 6:15 AM to 6:15 PM and on Saturday from 8:15 AM to 5:15 PM. Northeast Tennessee Regional Public Transit System (NET Trans) provides on-demand transit services to Carter, Greene, Hancock, Hawkins, Johnson, Sullivan, Unicoi, and Washington Counties NET Trans operates Monday through Friday from 6:00 AM to 6:00 PM and offers limited weekend service for eligible riders. Between 2016 and 2019, JCT and NET Trans recorded an average of 649,147 annual unlinked trips. The COVID-19 pandemic dramatically affected annual ridership numbers and caused a 24% decline in ridership in 2020. Figure 5-9 illustrates transit ridership trends between 2016-2020.
Source: Federal Transit Administration NTD Agency Profiles
The Johnson City Urbanized Area Coordinated Public Transit-Human Services Transportation Plan was updated and adopted in 2022. This plan outlines the state of the transit system in the region and provides recommendations to address the unmet transportation needs of individuals with disabilities, older adults, and people with low incomes. Recommendations included in the plan are varied and include prioritized strategies such as developing a mobility management program for JCT and NET Trans, more robust fleet planning, driver recruitment, pursuing additional funding to expand critical transit services and programs, implementing electronic fare payment systems, and more. Due to funding levels, the MTPO anticipates the same levels of service to be maintained for the next five years. The MTPO will, along with JCT and NETTRANS, look for funding for new opportunities in the Johnson City MTPO area. The MTPO also understands the funding for any new opportunities must be above and beyond the current levels of funding to allow for service expansion.
Figure 5-9. Transit Ridership Trends
Figure 5-10. Johnson City Transit Routes
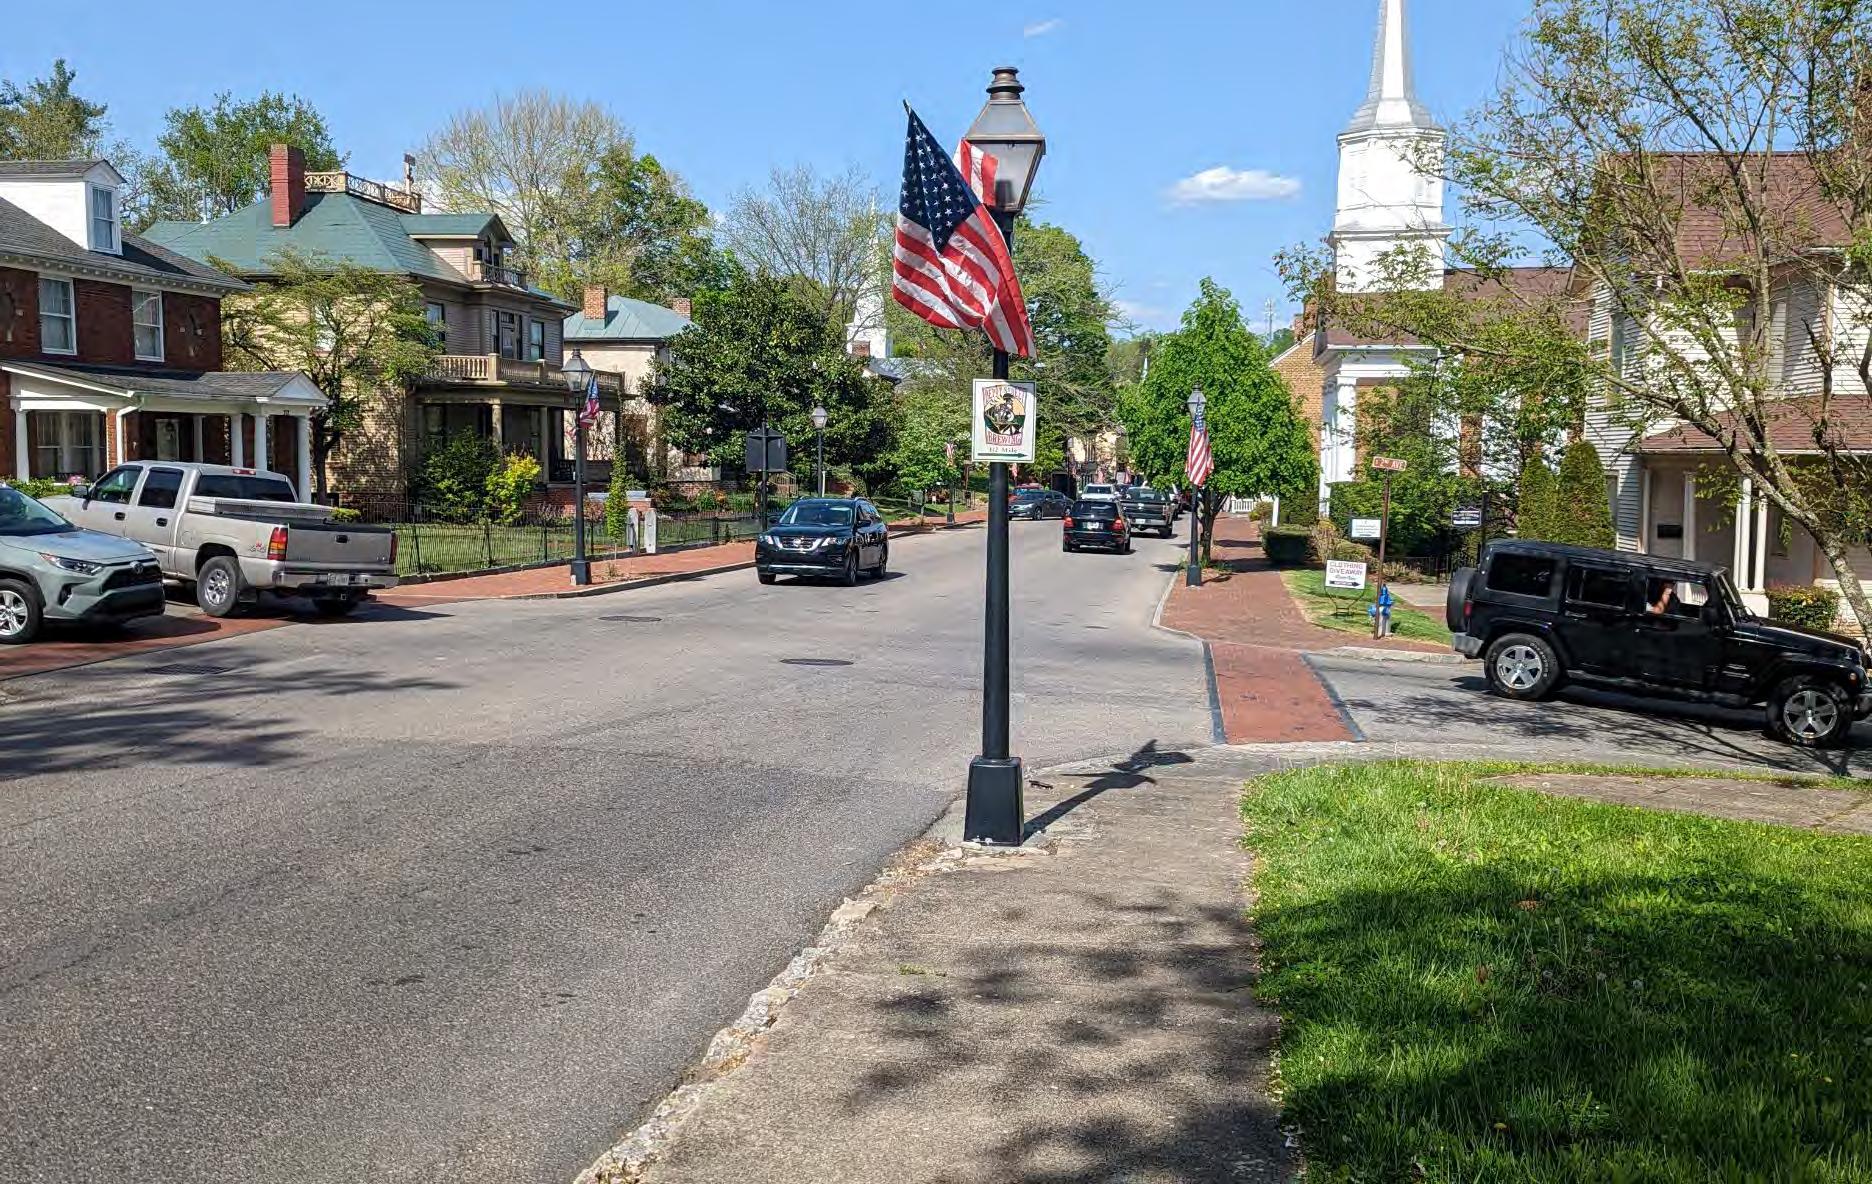
5.3 Walkways and Bikeways
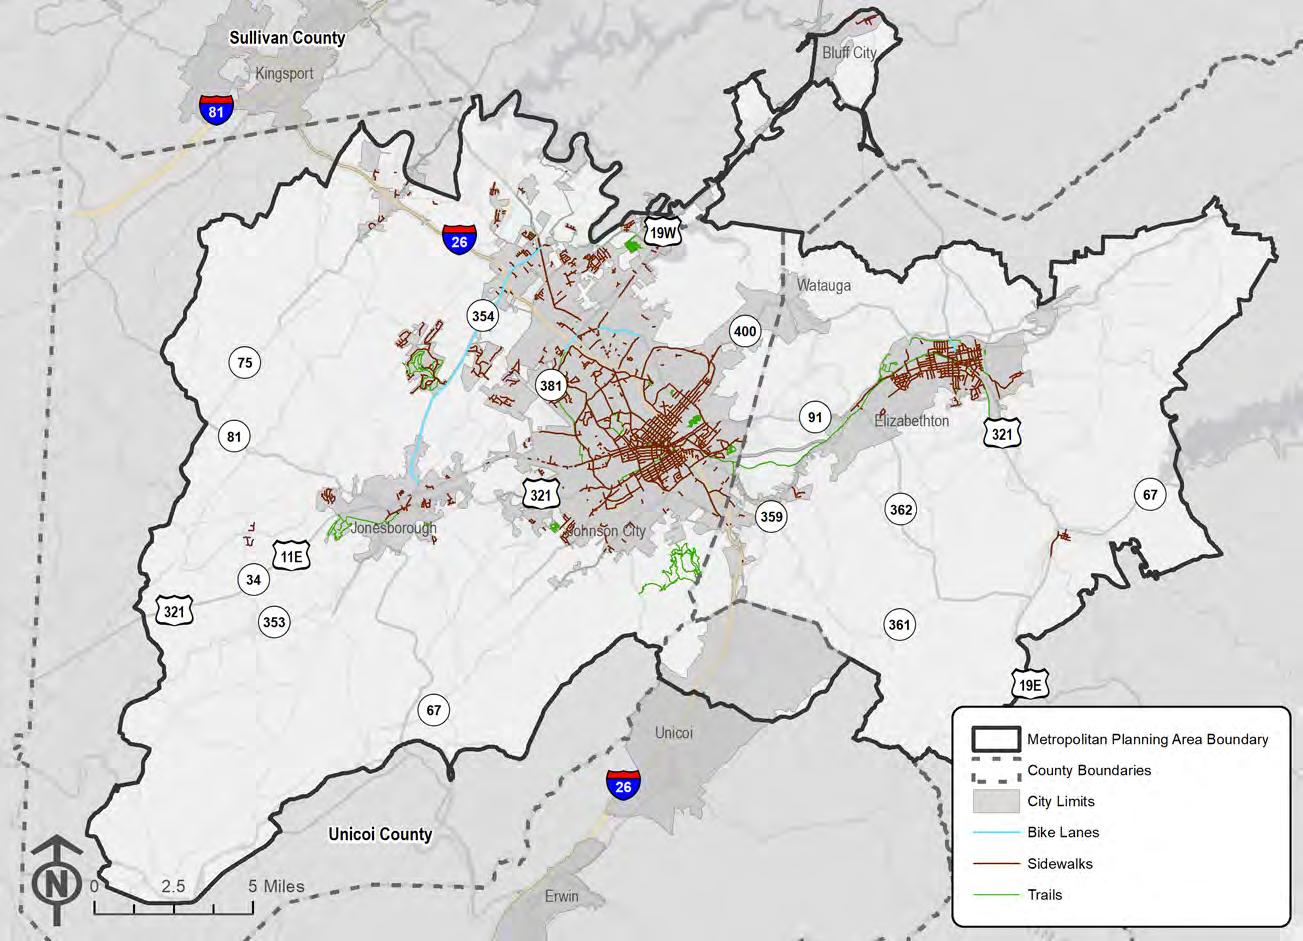
Facilities for people walking and bicycling within the Johnson City MTPO area are limited primarily to downtown Johnson City, downtown Elizabethton, and Jonesborough. Walkways and bikeways located in other parts of the region are largely disconnected from one another, and the existing facilities do not form a true network to support active transportation. The Tweetsie Trail, a gravel trail connecting Johnson City and Elizabethton, is an exception, providing a low-stress resource for recreation, and the Lost State of Franklin Trail connects Persimmon Ridge Park with downtown Jonesborough. Figure 5-11 illustrates the extent of the current system, which contains 9 miles of bikeways, 319 centerline miles of sidewalks, and 67 miles of trails.
Facility Accessibility
The Americans with Disabilities Act (ADA) requires public agencies with 50 or more employees to develop and implement an ADA transition plan that details the actions required to become fully compliant with the ADA. These plans often include inventories of active transportation facilities, including sidewalk, trails, buses, traffic signals, and their level of accessibility for people with disabilities. Table 5-5 summarizes the status of ADA transition plans for local governments in the Johnson City region and whether or not these plans include an assessment of pedestrian facility accessibility.
Table 5-5. ADA Transition Plans
Local Jurisdiction
Awaiting Final Draft
While the MTPO has considered funding a regional bicycle and pedestrian plan, the member jurisdictions to date have opted to do their individual plans and their own projects. In some cases, the jurisdictions have opted not to use federal funds to have these projects completed. The MTPO will continue to have this option available for its members and work with them to coordinate their local projects to improve regional connectivity. For example, while Carter County is pursuing non-federal funding directly with the Governor of Tennessee to extend the Tweetsie Trail, the MTPO has included this project in the MTP, and the project would be eligible for Transportation Alternative Program funding at the federal level if desired in the future
5-11. Existing Non-Motorized Network
Figure
Bicycle and Pedestrian Safety
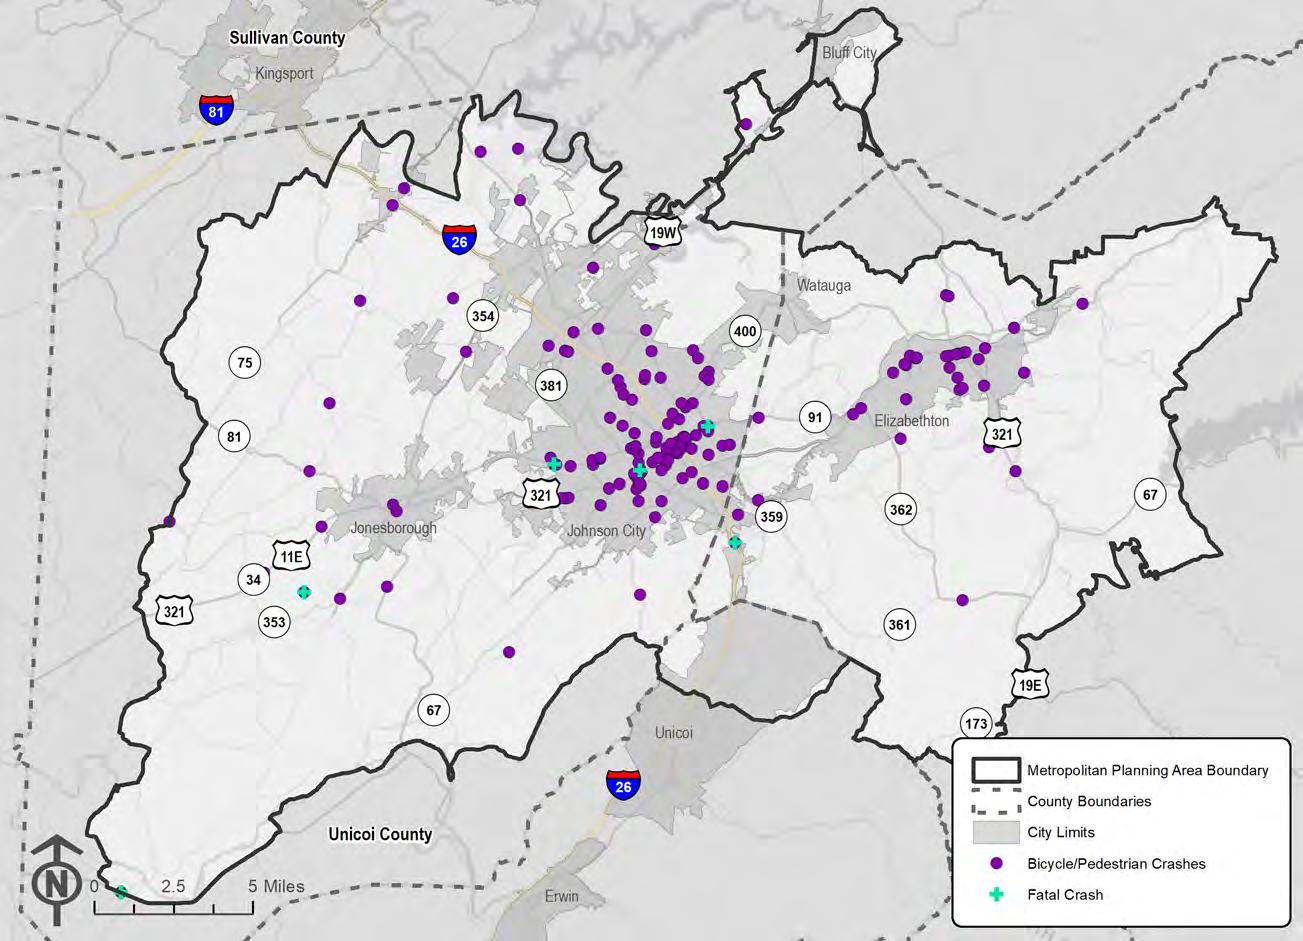
People walking and bicycling are at greater risk of injury and death if they are involved in a collision with a vehicle, compared to people traveling by motor vehicle. Understanding where crashes have occurred in the Johnson City MTPO area allows limited resources to be applied to locations of greatest concern. Of the 27,006 vehicular crashes that occurred in the Johnson City MTPO area between 2016 and 2020, 102 involved a pedestrian and 69 involved a bicyclist. Of the 153 non-motorized crashes that have occurred since 2016, 21 resulted in a serious injury and six resulted in a fatality. Figure 5-12 and Figure 5-13 illustrate regional trends in nonmotorized crashes and severity of those crashes within the MTPO area.
Figure 5-12. Bicycle and Pedestrian Crash Trends
Source: TDOT
Figure 5-13. Fatal and Serious Injury Bicycle and Pedestrian Crash Trends
Source: TDOT ETRIMS
Figure 5-14 depicts the locations of bicycle and pedestrian crashes in the MTPO area, including the locations of serious injury and fatal crashes involving bicyclists and pedestrians.
Crashes Pedestrian Crashes
Figure 5-14. Bicycle and Pedestrian Crashes (2016-2020)
Complete Streets
To further support the safety and mobility of transportation users in the region, the Johnson City MTPO encourages its member jurisdictions to consider Complete Streets design supporting safe streets for all users. Several resources are available to aid with this endeavor, including the following (but not limited to):
• TDOT’s Multimodal Access Policy, which establishes support for Complete Streets design for transportation facility;
• National Association of City Transportation Officials’ Urban Street Design, which serves as a guide for the development of complete, safe streets;
• Institute of Transportation Engineers’ various resources and guides to accommodate active transportation, including safe pedestrian and bicycle facilities at interchanges; and
• Designing Walkable Urban Throughfares: A Context Sensitive Approach.
Current and past efforts by Johnson City MTPO member jurisdictions include working with the TDOT Strategic Transportation Investments Division to include safe pedestrian and bicycle access during initial field reviews of proposed projects, namely the Knob Creek Extension –Section 2 project and the West Market Street Bridge Rehabilitation project.
Listed below are examples of recent projects by local jurisdictions that have incorporated Complete Streets design:
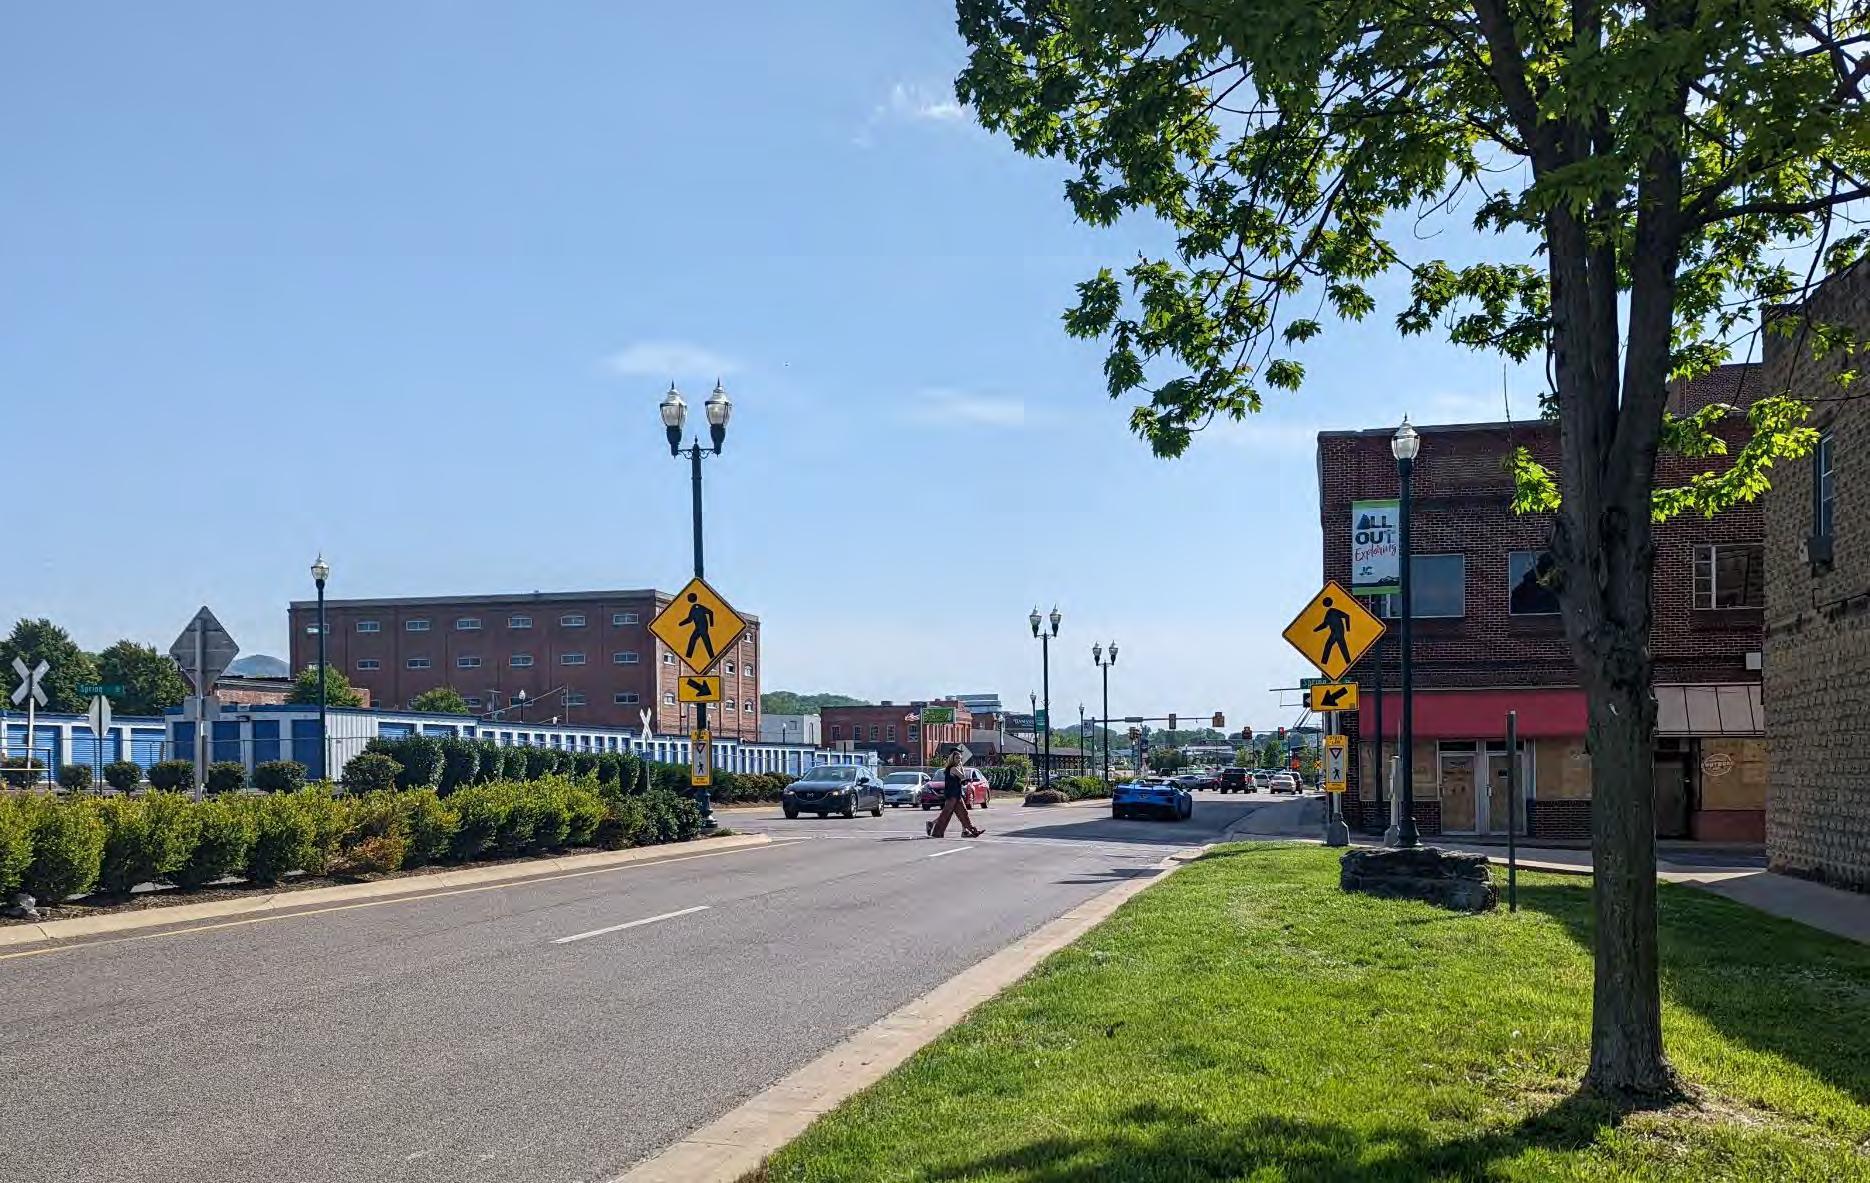
• Johnson City has completed two Complete Street projects, including the reduction of travel lanes to allow for the addition of a multimodal path along Legion Street from East Main Street to Alabama Street to provide access to the trailhead of the Tweetsie Trail. Within downtown Johnson City, Buffalo Street was redesigned by reducing travel lanes, channelizing the road by adding raised medians, and providing for safe on-street parking. This new design allowed for safer pedestrian movement and safe channelized turning movements for vehicles.
• The City of Johnson City is currently redeveloping the West Walnut Street corridor with local bond funding. This street provides a connection between downtown Johnson City and East Tennessee State University. The new, pedestrian-friendly roadway will include sidewalks on both sides, on-street parking and a bike lane. The design of the roadway will include traffic calming measures such as raised intersections and slight curves.
• The City of Johnson City also plans to improve crosswalks throughout downtown Johnson City to further increase pedestrian safety by adding lighting at crosswalks and upgrading curb ramps.
• Along the Tweetsie Trail, the City of Elizabethton upgraded critical intersections with signalized pedestrian/bicycle crossings where the trail crossed major roadways.
• Carter County is pursuing state funding to extend the Tweetsie Trail from its current end point on Hatcher Lane, which will provide access to walk or bike from the community of Hampton (and Hampton High School) to downtown Elizabethton. The extension will require a bridge to be built over the Doe River.
• The Town of Jonesborough is purchasing right-of-way for the addition of sidewalks on East Main Street to connect their downtown area with the new Senior Center and new
Lincoln Park. A large community donation has made the construction of these sidewalks possible.
• Bluff City has recently received a TDOT Multimodal Access grant that includes construction of a sidewalk that will provide a pedestrian link between Bluff City Park and City Hall along Bluff City Highway and the installation of four crosswalks located at key points along the route that will facilitate safe cross-street pedestrian movements.
The Johnson City MTPO encourages the use of Complete Streets through education, assisting in the coordination with state and local partners on project development, and serving as a resource for its member jurisdictions. Furthermore, the Johnson City MTPO realizes that each member jurisdiction has unique needs when it comes to project development that include Complete Streets. By serving as a resource to its members, the Johnson City MTPO encourages local jurisdictions to decide what is best for their community.
5.4
Freight Transportation System
Freight transportation is an essential element of the Johnson City region’s economy and includes highway, rail, and air modes. TRANSEARCH data from 2019 was analyzed to understand the movement of freight in the region, including tonnage and commodity values of imports and exports from Carter, Sullivan, Unicoi, and Washington Counties.
Highway
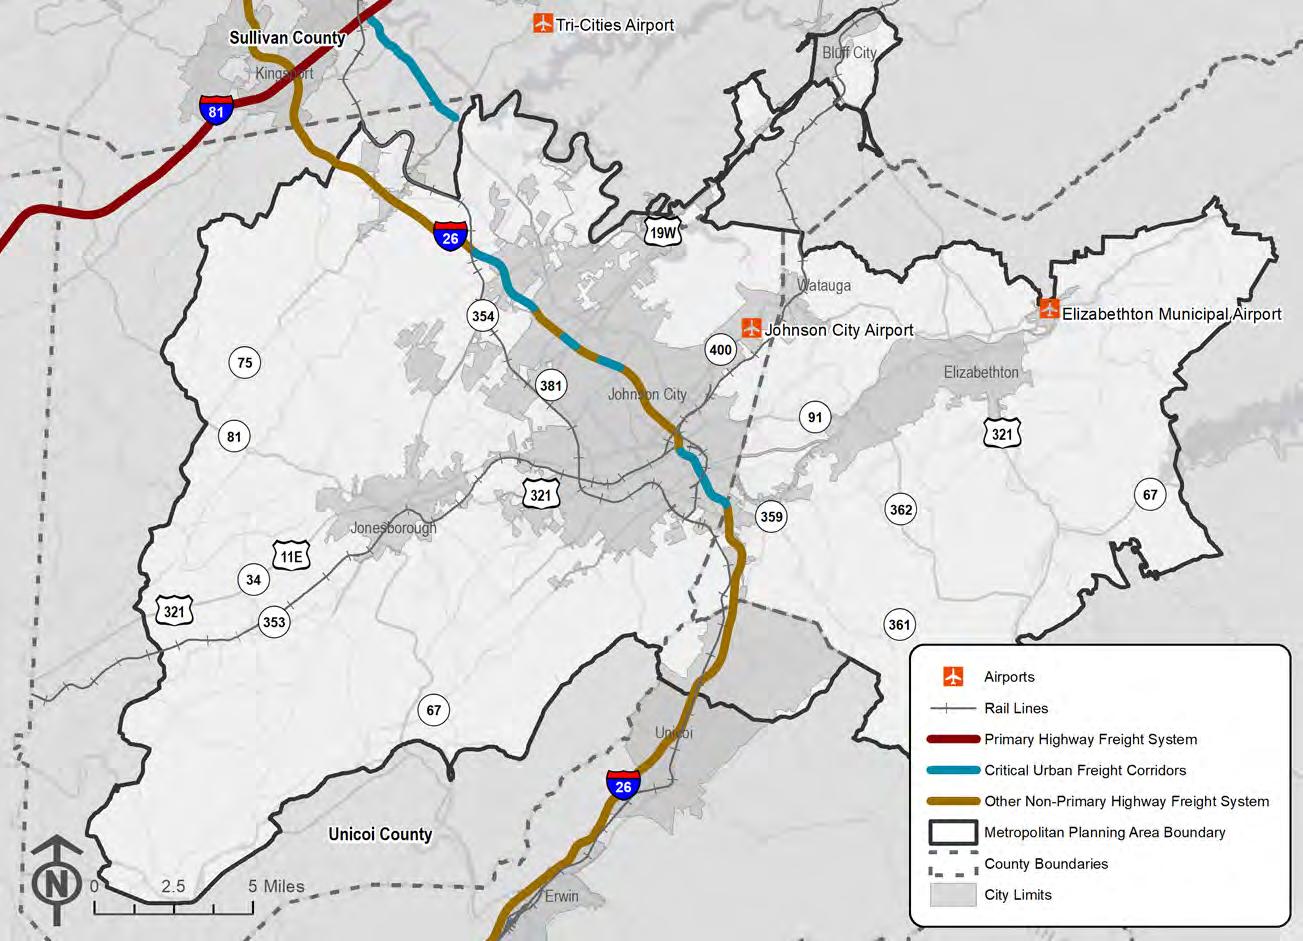
Within the MTPO area, there are over 1,600 miles of roads, including 19 miles of I-26. All 19 miles of I-26 are designated as part of the National Highway Freight Network (NHFN), which is classified by FHWA. The NHFN has four categories of roadways, including the Primary Highway Freight System (PHFS), Other Non-PHFS Interstates, Critical Urban Freight Corridors (CUFCs), and Critical Rural Freight Corridors (CRFCs). These classifications are used to direct federal resources toward maintenance and performance needs of the national freight transportation system. Figure 5-15 illustrates the federally designated freight facilities within the region
Railway
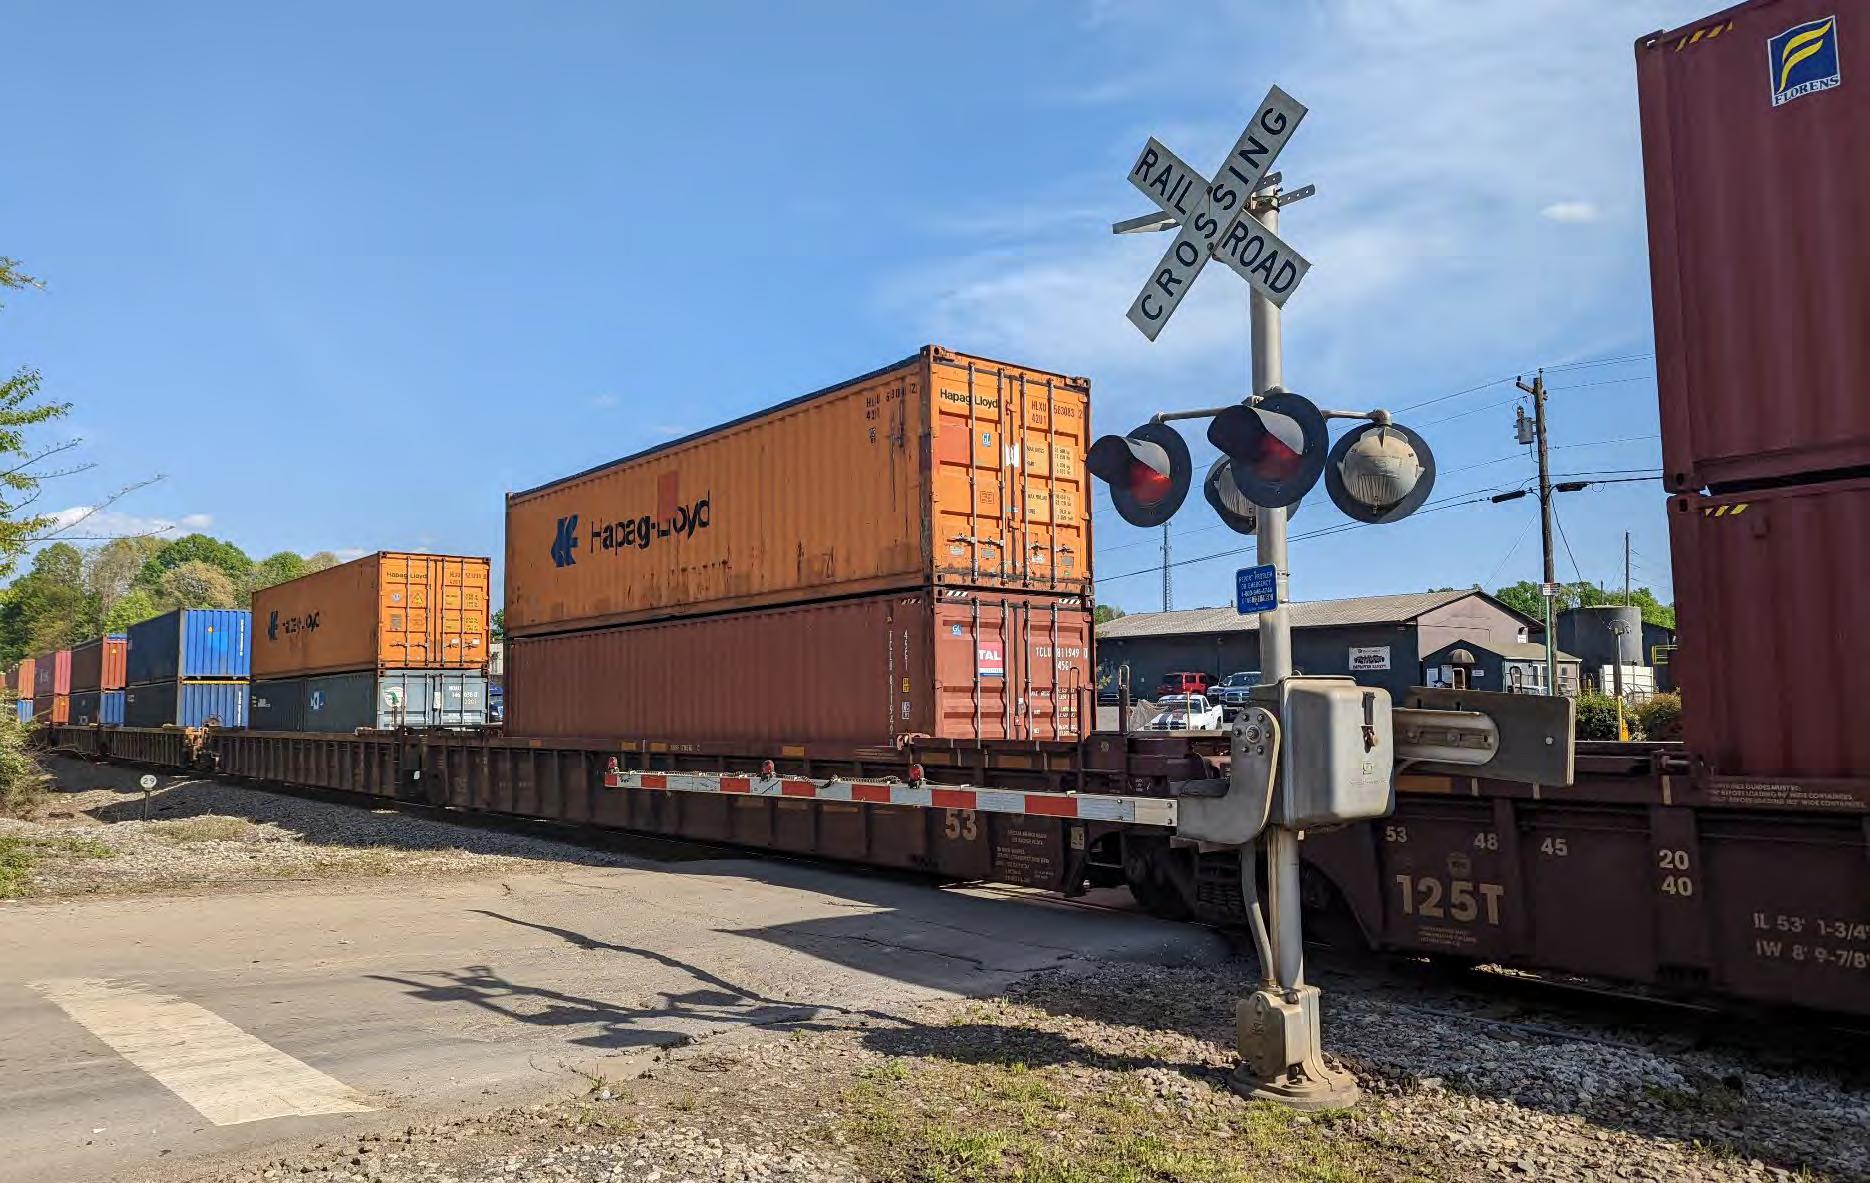
There are approximately 65 miles of active railroads within the MTPO area, owned and operated by two companies, CSX and Norfolk Southern. These Class I rail lines serve the Johnson City region and run from the northwest to southeast of Washington County (CSX) and from eastern Washington County north to Bristol, Virginia (Norfolk Southern). The Norfolk Southern lines in East Tennessee are part of a 2,500-mile route between the Northeastern region of the United States and the Southeast, known as the Crescent Corridor. There is also one short-line railroad, the East Tennessee Railway (ETRY), located in Johnson City. East Tennessee Railway provides local switching service for Norfolk Southern and CSX railroads. The railroad services local industry, including Omni Source metal recycling and Johnson City Chemical Corporation. This is a small but vital component of the freight system as it provides “first mile and last mile” services to industries in Johnson City. The existing rail system in the region is shown in Figure 5-15
Aviation
Three airports serve the Johnson City MTPO region. The Johnson City Airport and the Elizabethton Municipal Airport are located within the Johnson City MTPO area and are general aviation facilities for small private planes and flight training. The Tri-Cities Airport is located outside of the Johnson City MTPO area but is one of six commercial service airports serving Tennessee and the only airport offering commercial and cargo flights in the region The TriCities Airport is jointly owned by the cities of Kingsport, Johnson City, Bristol (both in Tennessee and Virginia), and Sullivan and Washington Counties. Approximately 64,166 pounds of freight were flown from the Tri-Cities Airport in 2021, down from 2,719,595 pounds in 2019. Freight airlines serving the Tri-Cities Airport between 2019 and 2021 include PSA Airlines Inc., Piedmont Airlines, Envoy Air, Delta Airlines, and Ameristar Air Cargo.
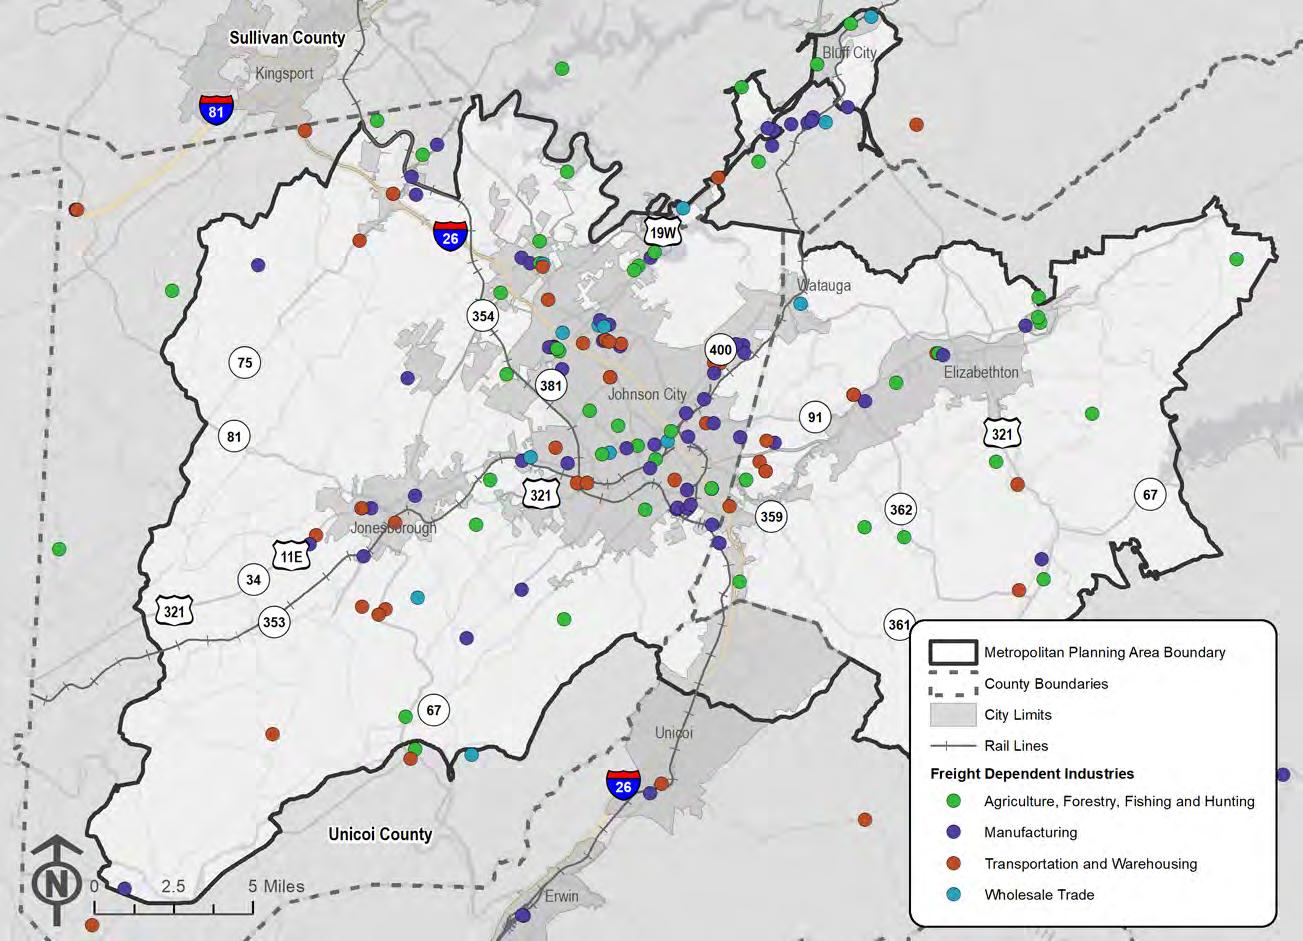
Commodity Flows
The freight transportation systems are critical to the region’s economy as many freight dependent businesses (Figure 5-16) utilize these networks to move goods into and out of the region. These movements were analyzed using the TRANSEARCH freight data purchased by TDOT, which provides insights into county-level imports and exports throughout the region for 2016 and projected to 2045. This data shows that approximately 18.3 million tons of freight valued at $13.9 billion flowed through the region in 2016. Table 5-6 illustrates that commercial truck freight accounts for the largest percentage of tonnage and value moving throughout the region, and results in over 14 million tons of goods being transported by trucks on the region’s roadways each year.
Table 5-6. Commercial Freight Tonnage and Value by Mode (2016) Mode
The region’s top three imports and exports are shown in Table 5-7 by value and tonnage. Stone and riprap represent the largest export by tonnage, while plastic materials or synthetic fibers are the largest export by value. In terms of imports, stone and riprap are the heaviest imported commodity by weight and warehousing and distribution center supplies are the largest import by value. The largest exports by tonnage are traveling to areas around Charlotte and Greensboro, North Carolina, as well as Roanoke, Virginia. The largest freight imports to the region by weight originate from Knoxville, Nashville, Lexington, Kentucky, and Charlotte, North Carolina.
Table 5-7. Top Regional Imports and Exports by Tonnage and Value (2016)
Source: TRANSEARCH, 2016
By 2045, freight imports and exports are expected to increase in tonnage by 51%, resulting in an increase of more than $1 billion in commodity values being transported throughout the region. The majority of this increase is expected to be accommodated by truck freight transport. Projected county-level freight increases are shown in Table 5-8; the future dollar values reflect real values that have been adjusted for inflation.
Figure 5-15. Freight Facilities in the Johnson City Region
5-16. Freight Dependent Businesses
Figure
5.5 Technology and Transportation
Both technology and transportation are changing rapidly, with major impacts to how people work, travel and purchase goods. In many cases, technological improvements have the potential to make transportation systems safer and more efficient
Intelligent Transportation Systems
Intelligent transportation systems (ITS) include technologies that incorporate advanced communication and information systems into transportation systems to improve mobility, safety, and efficiency. A wide variety of ITS technologies are available, including bus priority signals for transit, variable speed signs, traveler messaging systems, wireless traffic monitoring, loop detector systems, and many other technologies. The Johnson City MTPO Regional ITS Architecture and Deployment Plan was first developed in 2006 and most recently updated in 2022. The plan outlines regional ITS goals, project timelines, and resource sharing opportunities to encourage the development of interconnected ITS systems that will benefit the entire region. The development and regular update of the ITS plan is a pre-requisite for receiving federal funding to support ITS projects in the Johnson City MTPO region. The 2022 update included a variety of recommendations, such as:
• Improved coordination between TDOT and Johnson City to allow TDOT to utilize CCTV camera feeds for active traffic management and incident response;
• Permanent deployment of TDOT Rural Assist Trucks along I-26 to provide assistance to motorists during incidents;
• Expand fiber optic cable, CCTV installation, and road weather information systems throughout Johnson City and Elizabethton for traffic analysis, incident management, and weather monitoring;
• Development of a traffic management center in the City of Elizabethton; and
• Transit-specific recommendations for fare payment systems, transfer centers, and improved coordination between transit providers.
Transportation System Management and Operations
Transportation system management and operations (TSMO) strategies prioritize addressing congestion by improving the performance of the existing transportation system before choosing to increase roadway capacity through capital improvement projects. TSMO approaches prioritize the use of limited resources and include strategies like improved traffic incident management, improved bicycle and pedestrian crossings, congestion pricing, ramp management, road weather management, access management, technology-based strategies, and other activities The City of Johnson City has established a Traffic Operations Center to actively monitor traffic with PTZ cameras, with central office software called Tactics. Johnson City also has access management policies and procedures for their jurisdiction that address their needs. Johnson City has explored adaptive traffic signal control and is planning for their installation in the future.
Micromobility
Micromobility devices are typically small, lightweight vehicles including bicycles, electric bicycles, scooters, electric skateboards, and other devices that are shared and reserved
through app-based systems. These devices are typically used for relatively short, mostly urban trips, and can be docked, requiring users to deposit them in a particular location, or dockless, where they are left at their destination for others to use within a defined service area. Within the MTPO area, bicycle-sharing businesses are allowed, though there are no providers currently operating in the region. Scooter sharing services are not currently permitted, but this policy may change in the future.
Connected and Autonomous Vehicles
Connected and Autonomous Vehicle (CAV) technologies are an advancing development in the vehicle market and may eventually result in completely autonomous options for transportation. Connected vehicles can communicate about their speed and location to other CAVs and will allow for active traffic management. Partial automation is available in many newer vehicles today, including assisted braking, lane departure warnings, steering functions, and dynamic cruise control. While widespread CAV technologies are not yet available, as they continue to be developed, the transportation system may eventually benefit from increased safety and reduced congestion. At this time, Johnson City is researching connected and autonomous vehicles but currently has no plans for implementation.
Electric Vehicles
As options for electric vehicles (EVs) become increasingly available and affordable, many drivers are opting to purchase vehicles that are completely or partially electric, which has spurred the need for expanded electric vehicle charging facilities along the interstate system. Within the Johnson City region, Interstate 26 is designated as “corridor pending”, meaning fast charging stations are not yet available at least every 50 miles. Currently, the only interstate segments designated as “corridor ready” in Tennessee are portions of I-24 northwest of Nashville, I-65 within Nashville, I-40 east of Knoxville, and I-81 between Knoxville and the Virginia border.
5.6 Transportation System Security and Resiliency
Transportation system security requires planning to prevent, manage, and respond to risks that may affect the transportation system, from natural disasters to man-made threats. Improving the region’s resiliency to a variety of hazards will ensure that mobility is maintained, even during times of crisis, and requires continued coordination with state and local emergency management and law enforcement agencies, engineering experts, and emergency personnel This coordination includes support and participation in updating county hazard mitigation plans, TDOT incident response plans, and other planning efforts by local transit agencies, the Department of Homeland Security, the Tennessee Office of Homeland Security, and the Tennessee Emergency Management Agency.
The resiliency of the transportation system is predicated on preparing for and responding to climate change and extreme weather events, from flooding to tornadoes, to ensure that critical transportation infrastructure can withstand future events. In 2015, TDOT completed an analysis of statewide infrastructure assets to determine their vulnerability to extreme weather events. This effort included recommendations to implement climate adaptation strategies to protect
transportation facilities, such as strengthening bridge structures that are vulnerable to flooding and increasing design standards to improve infrastructure resiliency. At a regional level, the Johnson City MTPO should consider transportation infrastructure resiliency at all stages of project development, from planning through operations and maintenance.
FINANCIAL ANALYSIS AND PROGRAMMING
6.0 Financial Analysis and Programming
The Johnson City MTPO’s ability to maintain and improve the region’s transportation system is dependent upon available financial resources. This section outlines the funding sources available to the MTPO, summarizes the region’s historic revenue trends for transportationrelated improvements, and forecasts anticipated revenue over the 2050 MTP planning horizon. These revenues are then balanced against the costs of proposed capital projects identified through stakeholder engagement and technical analyses and ongoing costs of operating and maintaining the transportation system. This process ensures the recommended MTP improvements are fiscally constrained, a federal metropolitan planning requirement.
6.1 Funding Sources
To adequately maintain, operate, and enhance the transportation system in the Johnson City MTPO area, the MTPO and its members rely upon several sources including federal, state, and local funding. These sources provide varying amounts of funding, with all playing a critical role in supporting the region’s transportation system.
As with most MPOs and individual jurisdictions, federal sources provide the most funding for highways the Johnson City MTPO area. These funds are generated through the nation’s Highway Trust Fund (HTF), which is supported by motor vehicle fuel taxes. Revenues have been unable to keep pace with transportation system needs, requiring general revenue transfers allocated by Congress to bolster the HTF over the past two decades.
The Bipartisan Infrastructure Law (BIL), approved by Congress in November 2021, reauthorizes the federal surface transportation program covering fiscal years 2022-2026. All highway and transit programs included under its predecessor, the FAST Act, are continued, in addition to several new highway programs aimed at improving the transportation system’s resiliency, as well as expanding electric vehicle (EV) charging infrastructure, among others. Total funding for the nation’s highway programs exceeds $350 billion, $110 billion more than allocated in the FAST Act for roads, bridges, and other major projects, and an increase of $39 billion for transit funding.
Highway Programs
Key programs carried forward by the BIL and relevant for the highway component of the Johnson City 2050 MTP include the following. Notable changes and additions are mentioned.
Highway Safety Improvement Program (HSIP)
The HSIP seeks to reduce the number of traffic fatalities and serious injuries on all public roads primarily through infrastructure improvements. Flexibility is allowed for funding specific noninfrastructure activities and behavioral safety projects, such as education and enforcement activities. States are now required to complete vulnerable road user (VRU) safety assessments utilizing a Safe Systems approach. If the state’s VRU traffic fatalities are equal to or greater than 15% of the total state fatalities in a single year, TDOT is required to dedicate 15% of its HSIP
allocation to safety projects that address VRUs. The HSIP is managed by TDOT, with project selection also led by the agency.
National Highway Freight Program (NHFP)
The NHFP seeks to improve the efficient movement of freight on the National Highway Freight Network (NHFN) through projects that reduce congestion and improve system reliability, safety, security, and productivity. Under the BIL, project eligibility has been expanded to include modernization of marine corridors that are connected to the NHFP and/or likely to reduce onroad emissions. Furthermore, the legislation extends the amount of mileage that can be designated as “critical freight” corridors. In the Johnson City MTPO area, portions of I-26 near critical interchanges are currently designated as critical urban freight corridors, making those locations eligible for NHFP investments.
National Highway Performance Program (NHPP)
The NHPP supports the condition and performance of the National Highway System (NHS), the construction of new NHS roadways, and the assurance that investments using Federal aid directly support progression towards the state’s performance targets established in the NHS asset management plan. An additional purpose has been identified in the BIL, which focuses on improving the NHS’s resiliency against extreme weather events and natural disasters to mitigate the costs of damages. Furthermore, asset management plans are now required to consider extreme weather and resiliency in life cycle costs and risk management analyses. TDOT manages this program with project selection done in partnership with the MTPO.
Surface Transportation Block Grant Program (STBG) and Transportation Alternatives Program (TAP)
Project eligibility under the FAST Act for the STBG Program is carried forward with the BIL, including the preservation and improvement (reconstruction or construction) of any federal-aideligible highway, bridge or tunnel on any public road, pedestrian or bicycle infrastructure, and transit facility. New project eligibility is afforded to EV charging infrastructure, measures that increase system resiliency, the deployment of current and emerging intelligent transportation technologies (ITS), and even wildlife crossing structures. The BIL also provides for more granular suballocation of STBG funding, with a new population category for 50,000 to 200,000, and provides for state consultation with metropolitan planning organizations.
Of note, the amount of funding set aside for the Transportation Alternatives Program (TAP) from the STBG program was increased above levels previously allocated under the FAST Act to total $7.2 billion nationally. Safe Routes to School projects were reaffirmed as eligible, while VRU safety assessment activities were added. TDOT receives an annual allocation of TAP funds for competitive discretionary grants in small urban areas, while the MTPO occasionally receives funding from successful grant awards from TDOT.
In addition to continuing and expanding existing programs, the BIL creates new formula and discretionary programs, as well as pilot programs. Table 6-1 includes a brief description of a few of these new programs.
Table 6-1. New Programs under the BIL
New Federal Program Type Description
Bridge Formula Program
Bridge Investment Program
Carbon Reduction Program
National Electric Vehicle Infrastructure
Promoting Resilient Operations for Transformative, Efficient, and CostSaving Transportation (PROTECT) Grant Program
Safe Streets and Roads for All
Formula
Discretionary
Program to replace, rehabilitate, preserve, protect, and construct highway bridges.
Formula
Formula + Discretionary
Program to provide grants on a competitive basis to improve bridge condition and the safety, efficiency, and reliability of the movement of people and freight over bridges.
Program to reduce vehicular carbon emissions through eligible activities, such as establishing and operating a traffic management facility, bicycle and pedestrian infrastructure, public transportation, and ITS projects. Of the State’s allocation, 65% is suballocated based on population to support eligible projects in local communities.
Provides funding to States to develop an interconnected network of electric vehicle (EV) charging infrastructure that can facilitate data collection and is accessible and reliable.
Formula + Discretionary
Discretionary
Program focuses on supporting transportation resiliency through a wide range of project types, including planning activities, such as developing planning documents or resilience scenario planning.
Program supports local initiatives (“Vision Zero”) to prevent transportation-related fatality and serious injury crashes, including implementing projects identified in local safety action plans.
Reconnecting Communities Pilot Program Discretionary
Pilot program to restore community connectivity through the removal, retrofit, mitigation, or replacement of eligible transportation facilities.
Like federal funding sources, Tennessee primarily funds surface transportation projects using revenues generated from motor vehicle taxes and other related fees. In 2017, the state’s legislature passed the Improving Manufacturing, Public Roads and Opportunities for a Vibrant Economy Act (IMPROVE Act), which provided the first increase in fuel taxes since 1989. Additionally, the bill created additional local funding options for public transit. Projects included in the IMPROVE Act in the Johnson City MTPO area are listed in Appendix C for reference.
TDOT administers discretionary funding programs, which are competitively available to the local jurisdictions These funds, if awarded, are not required to be shown in the TIP, unless they are regionally significant or compliment a federally funded project. These include the following:
• High Priority Bridge Replacement Program (HPBRP) – improvements or reconstruction of off-system bridges in need of repair
• Interchange Lighting Program – improvement or installation of lighting at interstate interchanges or interstate-type facilities
• Local Interstate Connector Program (LICP) – improvements associated with establishing and constructing important connector routes to interstate facilities
• State Industrial Access Road (SIA) – improvements focused on increasing access to new or expanding industries
• Multimodal Access Grant (MMAG) – improvements to pedestrian and bicycle networks along state routes.
In addition to these opportunities, the state also provides funds for improving and rehabilitating roadways through its State Aid Program. Examples of eligible activities for this program include paving, acquisition and maintenance of right-of-way, elimination of railroad crossings, street lighting, and purchasing of equipment necessary for construction.
Federal and state revenue sources most often require a local match, which is sourced from jurisdiction general funds. Furthermore, system operations, maintenance, and improvements are primarily funded by the general funds of counties, towns, and cities. Mechanisms for generating such revenue include taxes (i.e., property, sales, and wheel), development districts, and fees, such as motor vehicle, utility, and impact fees. Larger street and highway capital projects may also be supported through the sale of bonds.
Transit Programs
Transit funding is similar to highways in that sources include a variety of federal, state, and local funding streams. Like highways, federal grant programs serve as the largest funding source for transit investments. The BIL reauthorizes the Federal Transportation Administration (FTA) grant programs most often used by the MTPO area including Sections 5307, 5310, and 5339 funds, which are used to support transit operations and capital purchases
5307 Urbanized Area
The 5307 – Urbanized Area Formula Grant program provides support to transit programs in incorporated urbanized areas with a population of more than 50,000 residents. Funds may be used by private non-profit organizations and public bodies for operating, capital, and related
planning purposes, including activities such as preventative maintenance for vehicle fleets and the construction of maintenance and passenger facilities. Since the MTPO area has a population less than 200,000, funds can also be used for operating assistance though TDOT does not provide matching funds for operating activities. Both Johnson City Transit (JCT) and Northeast Tennessee Regional Public Transit (NET Trans) receive allocations of 5307 funds for providing urban service within the Johnson City Urbanized Area (UZA). Furthermore, under contract with the City and East Tennessee State University, JCT has operated the campus shuttle service, known as BucShot, since 2003. The service, also open to the public, is provided during ETSU’s fall and spring semesters, serving the campus as well as nearby housing areas.
FTA allocates 5307 funds to TDOT as the designated recipient for urban areas under 200,000 in population based on factors such as population and population density. For small urban areas such as Johnson City, the 5307 funds are suballocated by TDOT based on additional factors. The federal share of funds is most often capped at 50% for operating and 80% for capital, although the share may increase to 85% should the funds be used for bringing equipment into compliance with ADA requirements.
5310 Enhanced Mobility of Seniors and Individuals with Disabilities
FTA also administers the 5310 – Enhanced Mobility of Seniors and Individuals with Disabilities program, which focuses on improving mobility for seniors and individuals living with disabilities by removing barriers for transportation service and expanding mobility options. Examples of traditional eligible activities include the purchasing of buses and vans, the addition of wheelchair lifts and securement devices, and projects relating to scheduling systems. Nontraditional eligible project examples include building accessible infrastructure to bus stops, improving wayfinding technology, and the purchasing of vehicles to support new vanpooling or ridesharing programs.
Allocations from the federal level are based upon each state’s share of seniors and populations living with a disability. These apportionments are then made available to small urban areas such as Johnson City through TDOT’s competitive grant process. For capital costs, the federal match is to not exceed 80%. Although FTA allows 5310 funds to be used for operating, TDOT currently restricts the use of these funds for capital assistance for its grant awards.
5339 Bus and Bus Facilities
The 5339 – Bus and Bus Facilities program provides funds for states and designated recipients and subrecipients who operate fixed route systems to replace, rehabilitate, and acquire buses as well as fleet equipment. Furthermore, funds may be used to upgrade and/or construct transitrelated facilities, including modernizing facilities and fleets with new technologies and innovations for purposes of reducing emissions. For the Johnson City MTPO area, the 5339 program is administered by TDOT through competitive grants. For most projects, an 80% costshare is provided by the federal government for eligible capital costs. Similar to the 5307 program, the cost-share may exceed 80% for projects relating to ADA compliance.
The State of Tennessee, when incorporated and approved in the annual budget, provides transit funding through TDOT. The IMPROVE Act of 2017 provided additional state funding dedicated
to transit through additional revenue generated by the increase in motor fuel taxes and fees. These additional funds can be utilized to improve regional transit systems for purposes of mitigating congestion on state highways (through the Transit Capital Grant program) as well as provide further assistance to rural transit providers to improve demand response efficiency. For the Transit Capital Investment Grant program, the required local match is 25%. It is also worth noting that the IMPROVE Act provides enabling legislation for large cities and counties to approve dedicated transit funding through a referendum.
Additional transit-related funding programs are administered by TDOT, including the Urban Operating Program (UROP), Critical Trips Program (CRIT), and the IMPROVE Act Transit Capital Investment Grant program. UROP provides capital and operating assistance to support fixed route and complementary paratransit service in urban core areas. Eligible activities for agencies in urban core areas include capital costs (e.g., rolling stock, preventative maintenance, and equipment) and operating costs (e.g., fuel, salaries, wages, fringe benefits, travel, and training). For the first $500,000 in expenses, the state matches 80% of the costs with a required 20% local match. After the first $500,000, the match requirements become 50% state and 50% local. Of note is that UROP funds are only available to urban areas following the expenditure of all 5307 funds.
CRIT provides operating assistance (e.g., fuel, salaries, wages, and fringe benefits) to demand response providers in urban areas that are not serviced by the urban core’s primary transit system (“urban fringe areas”). Like UROP, these funds are approved by the state Legislature and allocated based on population. Match requirements are 50% state and 50% local.
Finally, the IMPROVE Act Transit Capital Investment Grant program provides funding for eligible activities that focus on supporting increased ridership, congestion mitigation, and economic development. Examples range from park and ride lots, purchasing of transit vehicles, and transportation planning activities. Bus stop and right of way improvements, bus rapid transit projects, and fueling and charging stations are also eligible projects. As with the prior two programs, annual funding is dependent upon the approval by the State. Match requirements for this competitive program are 75% state and 25% local.
Like the highway programs, applicable local jurisdictions contribute funding to meet local match requirements for the aforementioned state and federal programs. Primary sources of revenue for these matches include property and sales taxes.
Additional transit funding includes farebox revenues though these are typically used to provide the local match for federal and state funds. JCT fares range from $1.00 per ride for adults to $25.00 for an unlimited monthly pass, while the BucShot shuttle service is free for campus visitors, ETSU students, staff, and faculty, as well as the general public. Funding for this service is provided by ETSU.
NET Trans fares start at $2.00 with increasing fares based on distance and time of day. Rides outside of the service area are charged on a per-mile basis ($1.50) once outside of the area.
NET Trans also contracts with TennCare to service critical medical trips, providing a relatively consistent level of ridership each year. Finally, discretionary grants, although relatively unreliable, are an additional potential source of revenue.
6.2 Historic and Projected Revenues Highway Revenues
To develop the highway element of the 2050 MTP, allocations in the MTPO’s TIPs as well as Tennessee apportionments from the FAST Act and the BIL were reviewed. Historic funding levels from 2016-2020 for various federal, state, and local funding sources, shown in Table 6-2, were used to establish an average annual allocation for each program and ultimately project anticipated revenues.
Using the above information, and in cooperation with TDOT and FHWA, an annual average growth rate was developed to project future revenues sources over the 2050 MTP planning horizon. An annual growth rate of 2% matches that of the FAST Act and BIL apportionments to the state, excluding the year 2021 given the jump in revenues from one bill to another, which skews the growth rate higher. Funds that can be reasonably expected for each plan horizon are detailed in Table 6-3, which amounts to approximately $711 million over the life of the plan.
Table 6-2. Historic Highway Capital Revenues (FY 2016-2020)
Table 6-3. Projected Highway Capital Revenues (FY 2023-2050)
To develop anticipated operations and maintenance expenditures (O&M) for highways in the MTPO area, operating budgets for each member jurisdiction were reviewed. Historic and current funding levels were determined for activities such as repaving and restriping, street lighting, traffic signal maintenance, and maintenance relating to the active transportation networks. Annual average spending was determined for each jurisdiction based upon FY 2016 through 2020 data and mileage maintained by each agency within the Johnson City MTPO area (Table 6-4).
Based on local budget information for the region’s jurisdictions, maintenance funding in the MTPO area has been increasing an average of 2% each year between 2016 and 2020. Similar to capital revenue projections, the annual average over that same historic period was grown by 2% each year over the planning horizon. Table 6-5 shows reasonably expected O&M revenues for each MTPO jurisdiction with the growth factors applied, totaling approximately $1.6 billion over the plan’s horizon.
To develop the financially constrained transit portion of the 2050 MTP’s financial plan, historic funding levels from the previously described federal, state, and local sources were analyzed to reasonably estimate future funding levels over the planning horizon for both capital and operating transit needs (Table 6-6). In addition to historic data included in the MTPO’s TIPs, consultation with JCT and NET Trans provided additional detail to publicly available data.
To develop the average annual growth rate for expected transit revenues, the historic FAST Act apportionments to Tennessee as well as the anticipated state funding apportionments from the BIL were utilized. FY 2021 was removed from consideration given a relatively significant jump in funding levels from the Coronavirus Aid, Relief, and Economic Security (CARES) Act. The growth rate of anticipated revenues prior to removal was 7.4%, which is an unrealistic expectation over the plan’s 27-year horizon. Therefore, a more realistic annual average growth rate of 2% was used to project future transit revenues (Table 6-7).
Transportation needs in the Johnson City MTPO area were determined based on the assessment of multimodal deficiencies, a review of previous planning efforts in the region, and engagement with the public, stakeholders, and the MTPO’s member jurisdictions. These inputs yielded a list of candidate projects (which are shown in the fiscally constrained project list in Table 6-9 and the illustrative project list in Table 6-12) that included safety improvements, ITS infrastructure, operational improvements, roadway widenings, new roadway alignments, roadway reconstructions, and bicycle and pedestrian infrastructure These projects were scored using the methodology outlined in Appendix D In total, there were 62 projects totaling over $500 million in current year dollars (2022). Project costs were developed using TDOT’s Project Cost Estimation Tool in conjunction with previous planning cost estimates and engineering evaluations. The distribution of project costs by type is depicted in Figure 6-1
ITS Improvements
Roadway Widening
Safety / Geometric Improvements
Operational Improvements
New Road Alignment
Reconstruction
Bicycle/Pedestrian
Figure 6-1. Candidate Project Types
6.4 Project and Program Selection Process
The cost of the needed transportation improvements far exceeds the anticipated revenues forecasted over the planning horizon. As such, a prioritization process was employed to help determine which projects should be funded with the available revenues. Each transportation recommendation was evaluated using a prioritization framework centered on the region’s goals. More specifically, Table 6-8 highlights the alignment of the regional goals with the various metrics utilized for scoring projects. The distribution of points was based on input from the MTPO and the public on priorities for the region. More detailed information on the project scoring mechanism can be found in Appendix D.
The resulting score for each project reflects its consistency with the MTPO’s stated goals. The higher the score, the more consistent the project is with the region's desires for transportation investments. The results of this scoring process were balanced against the MTPO's projected financial revenues and funding eligibility of projects, which resulted in the recommended projects of this MTP. Please note that larger projects were assigned logical termini based on the constructability and fiscal analysis of each project. Final termini will be determined during the project scoping process, and TDOT may choose to fund larger projects holistically to improve efficiency and cost savings.
6.5 Project Expenditures
Transportation improvements within the recommended plan must be fiscally constrained, meaning that the projected expenditures cannot exceed the anticipated revenues the MTPO reasonably expects to receive over the planning horizon. This section demonstrates this requirement for fiscal accountability by balancing capital investments in roadway and transit infrastructure in with anticipated costs of operating and maintaining these systems over the next 27 years. Please note that some local jurisdictions will need to request that TDOT manage their projects, due to their complexity. If TDOT elects to manage a project, it is subject to their implementation schedule.
Highway Expenditures
Based on the anticipated revenues for highway capital expenditures (detailed in Section 6.2), the project scoring process (detailed in Section 6.4), and feedback collected on candidate projects during the second round of engagement (detailed in Section 3.2), Table 6-9 lists the fiscally constrained capital improvements to the roadway system with the following information:
• ID – This column includes a unique identifier for each project.
• Lead Agency – This column lists the implementing agency, typically a municipal or county government unless the facility is part of the State highway system, in which case the agency is typically TDOT.
• Project/Route Name – This column lists the name of the facility on which the project is located.
• From/To – This column lists the approximate beginning and ending termini of the project, which typically include major roadway facilities or intersections.
• Type of Improvement – This column classifies each project into one of the following seven types: bicycle/pedestrian, ITS, new road alignment, operational improvements, reconstruction, safety, and widening.
• Description – This column includes a more detailed description of the proposed project.
• Horizon Year – This column lists the anticipated timeframe for completion. Two distinct horizons are evaluated in this MTP – 2030 and 2050 – where projects classified in the 2030 horizon are anticipated to be completed between 2023-2030 and projects classified in the 2050 horizon are anticipated to be completed between 2031-2050.
• YOE Cost – This column lists the projected total cost of the project including all federal, state, and local funds in a year of expenditure (YOE) amount as federally required. The YOE costs are calculated by inflating the 2022 cost estimate by 5.0% annually for 20232028 and by 3.4% annually for 2029-2050. These inflation assumptions were developed in coordination with TDOT and FHWA and are based on data collected for FHWA’s National Highway Construction Cost Index (NHCCI) between 2016 and 2020.
• Funding Program – This column designates the anticipated revenues to be used for project implementation based on project type and eligibility restrictions of the various funding programs.
These capital improvements are also shown in Figure 6-2.
TDOT I-26 Exit 19State of Franklin (SR 381) Interchange Signage (Project S6)
Exit 19State of Franklin Road (SR 381) Interchange
SR 362 Safety Improvements Dry Creek Road (SR 361) to Big Springs Road Safety / Geometric Improvements
Washington County Washington County Industrial Park Traffic Signal
Intersection of Andrew Johnson Highway (SR 34/US 11E) at Precision Boulevard/ Stockyard Road
Safety/geometric improvements (including paved shoulders, improvements at select locations) as determined through project development
30 TDOT SR 361 Improvements Okolona Road (SR 359) to Veterans Memorial Parkway (SR 37/US 19E) Safety / Geometric Improvements Safety/geometric improvements (including paved shoulders, improvements at select locations) as determined through project development
Johnson City Novus Drive Extension
West Market Street (SR 34/US 11E) to McKinley Road New Road Alignment
Sullivan County Allison Road and Piney Flats Road Intersection Improvements Bristol Highway (SR 34/US 11E/US 19W) and Allison Road/Piney Flats Road
55 Johnson City Browns Mill Road and Peoples Street Roundabout Browns Mill Road and Peoples Street Intersection
Construct new 2 lane road with median and additional turn lanes at intersections.
Install roundabout at the intersection of Browns Mill Road and Peoples Street
57 Johnson City
Browns Mill Road
Improvements
Browns Mill Road, from West Oakland Avenue to Peoples Street Roadway Widening Widen road, add turn lanes, add sidewalks
58 Johnson City Cherokee Road (SR 67) Sinking Creek Road to University Parkway (US 321/SR 381)
Operational Improvements
Operational improvements (including spot widenings, intersection improvements, turn lanes) at select locations as determined through project development
60 Johnson City West Walnut Street Safety Improvements Antioch Road to West State of Franklin Road (US 321/SR 381)
Safety / Geometric Improvements
Safety/geometric improvements (including paved shoulders, improvements at select locations) as determined through project development
Projects to be Completed 2031-2050
2 TDOT
I-26 Exits 22 & 23 Interchange Improvements (Project C1) East Unaka/Watau ga Avenue (SR 400) to West Market/Main Street (SR 91) Roadway Widening Widen Eastbound OffRamp to Provide Option Lane
8 Johnson City/ Washington County Old Gray Station Road Section 3 Buckingham Road to Boones Creek Road (SR 354) Safety / Geometric Improvements
Safety/geometric improvements (including paved shoulders, improvements at select locations) as determined
TDOT
I-26 Exit 19North State of Franklin Road (SR 381) Improvements On and Off Ramps from I26 at Exit 19North State of Franklin Road (SR 381) Interchange
21 Washington County Free Hill Road
Operational Improvements
Reconfiguration, operational improvements, add turning lanes, on all approaches, etc.
Kingsport Highway (SR 36) to Cedar Creek Road Safety / Geometric Improvements
Reconstruct 2 lane roadway addressing geometric issues
Safety/geometric improvements (including paved shoulders, improvements at select locations) as determined through project development
Due to environmental issues and public opposition, this project is no longer recommended.
25 TDOT SR 75 Improvements Boonesborough Road to Andrew Johnson Highway (US 11E) Safety / Geometric Improvements Safety/geometric improvements (including paved shoulders, improvements at select locations) as determined through project development
31 Washington County Shadden Road / Highland Church Road Suncrest Drive (SR 75) to Boones Creek Road (SR 354) Safety / Geometric Improvements Safety/geometric improvements (including paved shoulders, improvements at select locations) as determined through
33 TDOT I-26 Exit 17 to 20
36 TDOT Elk Avenue / Broad Street (SR 67) Williams Avenue to Holly Lane Bicycle / Pedestrian
39 TDOT Watauga Road (SR 400) East Fairview Avenue to Piney Flats Road
Safety / Geometric Improvements
Safety/geometric improvements (including paved shoulders, improvements at select locations) as determined through project development
41 Carter County Tweetsie Trail Extension End of Tweetsie Trail at Hatcher Lane with State Line Road to Hampton TN
Bicycle / Pedestrian
Trail extension, bridge rehabilitation over the Doe River and access through old railroad tunnel
59 Johnson City Greenwood Drive Safety Improvements Seminole Drive to West State of Franklin Road (US 321/SR 381)
Safety / Geometric Improvements
Safety/geometric improvements (including paved shoulders, improvements at select locations) as determined through project development
In addition to the specific project needs identified, the MTPO has also determined that a programmatic approach is needed to address bridge repair and maintenance, improvements to the bicycle and pedestrian infrastructure, and safety and operational improvements. Allocating funding to these three programs allows the MTPO to readily address these types of needs as they arise. These programs and amounts are shown in Table 6-10 and should be allocated through the MTPO’s TIP development based on funding eligibility.
Table 6-10. 2050 Fiscally Constrained Programs
Based on the total cost of capital projects and programs for the roadway system, Table 6-11 highlights the anticipated revenues and expenditures in each plan horizon, demonstrating fiscal constraint of the MTP.
With the implementation of the fiscally constrained roadway projects, operation of the region’s roadways is largely expected to remain the same. As shown in Figure 6-3, percentage of streets operating at LOS D or better is projected to fall slightly from 99% to 98% by 2050. However, over-capacity facilities and congestion will still exist even with these investments, which is why provision of other transportation options, including ITS, walking and biking facilities and transit services, will be key to maintaining quality of life for residents.
Table 6-13 provides a list of the capital roadway projects that were identified as a need during the MTP planning process but that are not included in the fiscally constrained portion of this plan. These projects, which are often referred to as illustrative, are not currently affordable given
their relatively high costs and the anticipated revenues available to the region. Should additional revenues become available in the future, these improvements that can be amended into the fiscally constrained portion of the MTP.
Table 6-11. Revenues and Expenditures for Roadway Capital (2023-2030)
**The 2031-2050 revenues column is the sum of carryover funds from the 2030 horizon and the new projected revenues for each
Figure 6-3. Projected Daily Level of Service (2050)
Table 6-12. Illustrative Projects ID
17 TDOT Boones Creek Road (SR 354) Section 2
Highland Church Road to Bugaboo Springs Road Roadway Widening Widen existing 2 lane roadway to 4 lanes
18 TDOT Boones Creek Road (SR 354) Section 3 Bugaboo Springs Road to West Jackson Boulevard (SR 34/US 11E)
19 Jonesborough Jonesborough Parkway Boones Creek Road (SR 354) to West Jackson Boulevard (SR 34/US 11E) at intersection with Persimmon Ridge Road
20 TDOT North State of Franklin Road (SR 381) Section 1
Roadway Widening Widen existing 2 lane roadway to 4 lanes
New Road Alignment Construct 3 lane roadway
I-26 Exit 19 to Knob Creek Road Roadway Widening Widen existing 4 lane roadway to 6 lanes
34 TDOT I-26 Exit 20 to 24 Roadway Widening Widen Existing 4 lane interstate to 6 lanes
35 TDOT North State of Franklin Road (SR 381) Section 2
Knob Creek Road to Sunset Drive Roadway Widening Widen Existing 4 lane interstate to 6/7 lanes
61 Johnson City Triangle Intersection Improvements North Roan Street (US 11E/SR 34) / Broyles Drive / Browns Mill Road and Princeton Road / Sunset Drive Intersection Operational Improvements Intersection Improvement
62 TDOT Suncrest Drive (SR 75) Widening I-26 to Boonesboro Road Roadway Widening Widen existing 3 lane roadway to 5 lanes
Please note, Project IDs 3, 5, 7, 22, 26, 27, 28, 29, and 42 are not listed individually in the MTP but are considered eligible for Safety and Operation and Bicycle and Pedestrian Improvements groupings and consistent with the plan, if additional funding for these groupings is identified.
In addition to capital expenditures, the MTP must also account for the significant cost of operating and maintaining the transportation system. These costs include routine and regular expenditures required to keep highways, streets, and rights-of-way in usable conditions such as repaving and restriping, mowing and landscaping, street lighting, traffic signal maintenance, and maintenance relating to the active transportation networks. The MTPO, in consultation with TDOT, was able to determine future operations and maintenance (O&M) funding levels for streets and highways for the MTPO area based on historic funding trends. A 2% annual growth rate was determined to be appropriate for O&M funding based on past funding growth trends within the MTPO area.
O&M expenses are assumed to grow at a similar rate accounting for incremental increases in operating and maintenance costs and the additional mileage to be added to the roadway system through expansion over the planning horizon. To determine the impact of these incremental increases, mileage additions resulting from the fiscally constrained capital roadway improvements were included in future year costs. Average costs per mile were applied to mileage increases on facilities maintained by TDOT, Washington County, and Johnson City stemming from the implementation of projects 9, 16, 32, 33, 40, and 57 beginning with the horizon year in which they are expected to be complete. With these increases and the expected inflation of O&M costs more generally, Table 6-13 illustrates the expected revenues and expenditures of state and local dollars for these actives over the planning horizon.
Table 6-13. Revenues and Expenditures for Roadway O&M (2023-2050)
For agencies that are expanding the roadway system, the projected costs of maintaining the system will outpace the assumed 2% growth in available revenues; however, many of the local and federal funding programs have significant carryover balances as shown in Table 6-11 While typically reserved for capital projects, these funds may need to be utilized for maintenance activities in order to meet fiscal constraint requirements.
Transit Expenditures
To fund transit service in the Johnson City MTPO area, the MTP must account for both the capital needs of providers as well as the cost of operating both fixed route and demand response service. Capital needs for transit agencies largely consist of vehicle replacements, which occur on a recurring basis to keep vehicles in a state of good repair. Using the JCT and NET Trans Transit Asset Management (TAM) Plans, Table 6-14 and Table 6-15 forecast the number of transit vehicles that will need to be replaced over each planning horizon and the YOE costs. To develop YOE costs for vehicles, a 5% annual inflation factor was used for the first five years of the plan horizon with a 3.4% annual inflation factor used each year after, similar to the assumptions utilized in the highway fiscal constraint analysis. In total, there are approximately 170 transit vehicles that will need to be replaced by 2050 totaling over $39 million. Table 6-16 and Table 6-17 summarize the projected revenues and expenditures for transit capital needs, illustrating fiscal constraint. As shown, there are approximately $2.5 million in excess revenues. These excess funds can potentially cover unanticipated capital costs and/or the capital costs associated with equipment replacement and/or facilities improvement.
Table 6-14. Projected Transit Capital Needs (2023-2030)
Table 6-15. Projected Transit Capital Needs (2031-2050)
Table 6-16. Revenues and Expenditures for Transit Capital (2023-2030)
5307 Urbanized Area
5310 Enhanced Mobility
5339 Bus and Bus Facilities
$9,664,935 $8,047,144 $1,617,790
Table 6-17. Revenues and Expenditures for Transit Capital (2030-2050)
5307 Urbanized Area
5310 Enhanced Mobility
5339 Bus and Bus Facilities
$33,674,727 $31,205,706 $2,469,021
**In the 2050 horizon period, the total revenues column is the sum of carryover funds from the 2030 horizon and the new projected revenues for each program, which total $32,056,936
In addition to vehicle replacements, transit agencies receive federal funding to operate fixed route and demand response service. Operating revenues are largely sourced from FTA’s 5307 Urbanized Area Formula funding, which equates to approximately $3.5 million per year. As noted in Section 6.2 and shown in Table 6-18 and Table 6-19, after accounting for small increases in revenues the Johnson City MTPO area can expect approximately $134 million from this program to operate the region’s transit services from 2023-2050. Based on historic operating expenditures reported in the National Transit Database (NTD) annual reports, this amount it unlikely to be sufficient for maintaining current service levels in the MTPO area. Therefore, reduction of current service and/or pursuit of additional funding for operating expenses may need to occur.
Table 6-18. Revenues and Expenditures for Transit Operating (2023-2030)
Table 6-19. Revenues and Expenditures for Transit Operating (2030-2050)
PROJECT IMPACTS
7.0 Project Impacts
Projects included for funding in the 2050 MTP have the potential to impact the region’s residents, economy, and transportation system in multiple ways. This chapter provides a summary of the system performance impacts of these projects, as well as potential impacts to natural and cultural resources, minority and low-income populations, and individuals with Limited English Proficiency (LEP). As these projects move through the development process, negative impacts should be comprehensively avoided where possible, minimized where impacts are unavoidable, and mitigated to compensate for affected resources.
7.1 System Performance
As outlined in Section 2.4, TDOT has established performance targets to meet each of the federally required performance measure categories, including safety, bridge and pavement conditions, reliability, emissions reduction, and transit. The Johnson City MTPO is committed to funding transportation projects that align with both federal and state performance management requirements to meet or exceed state targets in these areas Table 7-1 provides examples of projects that are funded in the Johnson City MTPO area through this plan and that will aid the State in achieving its targets in the three performance management categories.
Table 7-1. Project Funding by Federal Performance Management Category Performance Management Category
I-26 Widening; I26 ITS Deployment; Adaptive Signal Control
Transportation and health are inextricably linked, and the impacts of transportation projects can have a direct impact on quality of life for the Johnson City region’s residents, particularly traditionally underserved populations, which include minority, low-income, and Limited English
Proficiency (LEP) populations. As a recipient of federal funds, the Johnson City MTPO is statutorily required to assess the impacts of transportation projects on underserved populations and engage with these communities during the planning process. These federal requirements are outlined in Table 7-2.
Title VI Environmental Justice Limited English Proficiency
Authorizing Directive
Required Population
Applicable Programs/Agencies
Civil Rights Act of 1964 (42 USC § 2000d et seq.) E.O. 12898 (1994)
Race, color, and national origin
Guidance
Minority persons and low-income persons
E.O. 13166 (2000)
Individuals with a limited ability to read, write, speak, or understand English
Programs receiving federal assistance Federal agencies and recipients of federal financial assistance Federally funded programs and activities
23 CFR Part 200 and 450
FTA Title VI Circular 4702. 1B (2012)
FTA EJ Circular 4703.1 (2012)
U.S. DOJ Guidance to Federal Financial Assistance Recipients Regarding Title VI Prohibition Against National Origin Discrimination Affecting Limited English Proficient Persons (2000)
The potential impact of the projects included in this MTP were analyzed using 2020 Census data available at the block group level from the U.S. Census Bureau. Within each block group, the average percent of minority, low-income, and LEP populations was used to determine potential impacts for each project. Minority populations are defined as residents who identify as African American, Asian American, American Indian and Alaska Native, Native Hawaiian or other Pacific Islander. The average percent minority population by Census block group is approximately 7% in the Johnson City MTPO area. Low-income populations are defined by the Census at the household level. Within Census block groups in the Johnson City MTPO area, approximately 19% of households are classified as low-income on average. Similarly, approximately 2% of households are classified as having limited English proficiency. Figure 7-1, Figure 7-2, and Figure 7-3 highlight the overlap of MTP fiscally constrained projects and high concentrations (i.e., above the regional average) of minority, low-income, and LEP populations. MTP projects that are located in areas with the potential to impact traditionally underserved populations are also listed in Table 7-3
Figure 7-1. MTP Projects Near Minority Populations
7-2. MTP Projects Near Low-Income Populations
Figure
Figure 7-3. MTP Projects Near LEP Populations
Safety/geometric improvements along East Unaka Avenue (SR 400) from Broadway Street to East Fairview Avenue, including paved shoulders and other improvements at select locations as determined through the project development process
improvements along SR 361 from Okolona Road (SR 359) to State Line Road at Veterans Memorial Parkway (SR 37/US 19E)
Safety/geometric improvements along Shadden Road/Highland Church Road from Suncrest Drive (SR 75) to Boones Creek Road (SR 354)
Widen North State of Franklin Road (SR 381) to 6 lanes from Knob Creek Road to Sunset Drive
improvements along Watauga Road (SR 400) from East Fairview Avenue to Piney Flats Road
new 3 lane road with median and turn lanes from West Market Street (SR 34/US 11E) to McKinley Road
Improvements at Bristol Highway (SR 34/US 11E/US 19W) and Allison Road/Piney Flats Road
roundabout at the intersection of Browns Mill Road and Peoples Street
Widen road, add turn lanes, add sidewalks along Browns Mill Road, from West Oakland Avenue to Peoples Street
improvements along Cherokee Road (SR 67) from Sinking Creek Road to University Parkway (US 321/SR 381)
59
60
61
Safety/geometric improvements along South Greenwood Drive from Seminole Drive to West State of Franklin Road (US 321/SR 381)
Safety/geometric improvements along West Walnut Street from Antioch Road to West State of Franklin Road (US 321/SR 381)
Operational improvements at the North Roan Street (US 11E/SR 34) / Broyles Drive / Browns Mill Road and Princeton Road / Sunset Drive Intersection
7.3 Historic, Cultural, and Natural Resources
Transportation projects can negatively impact key natural and cultural resources, including historic buildings and sites, cemeteries, rivers, streams, forested areas, floodplains, wetlands, and other habitat conservation areas. Topographical features, such as steep slopes, ridges, and mountains, are critical elements of the Johnson City region’s character, and are also natural resources that should be protected. Key natural and historical features in the Johnson City region include the Cherokee National Forest, many creeks and streams (Boones Creek, Brush Creek, Knob Creek, Sinking Creek, etc.), historic mill sites, and the Doe and Watauga Rivers.
The 2050 MTP projects listed in Table 7-4 and shown in Figure 7-4 are located in close proximity to some of these key natural and cultural resources. While these projects are still in the early planning stages, their scopes should be adjusted throughout the project development process to minimize and avoid impacts to natural and cultural features. Where impacts are unavoidable, mitigation activities should be conducted to compensate for the loss of critical environmental resources.
Table 7-4. MTP Projects with Potential Impacts to Cultural and Natural Resources
10
18
23
Safety/geometric improvements along SR 362 from Dry Creek Road (SR 361) to Big Springs Road Cherokee National Forest
Widen Boones Creek Road (SR 354) to 4 lanes from Bugaboo Springs Road to West Jackson Boulevard (SR 34/US 11E)
Safety/geometric improvements along East Unaka Avenue (SR 400) from Broadway Street to East Fairview Avenue
30
Safety/geometric improvements along SR 361 from Okolona Road (SR 359) to State Line Road at Veterans Memorial Parkway (SR 37/US 19E)
33 Widen I-26 to 6 lanes from Exit 17 to 20
34
39
Widen I-26 to 6 lanes from Exit 20 to 24
Safety/geometric improvements along Watauga Road (SR 400) from East Fairview Avenue to Piney Flats Road
41 Extend Tweetsie Trail from Hatcher Lane terminus to Hampton, TN
59
Safety/geometric improvements along South Greenwood Drive
100-Year Floodway
Carnegie Park, Lions Park
100-Year Floodway, Cherokee National Forest
100-Year Floodway
100-Year Floodway
100-Year Floodway, Dungan’s St. John Mill and Stone House
100-Year Floodway, Cherokee National Forest
ETSU Betty Basler Softball Campus
The cultural and natural resources analysis considered potential project impacts to a variety of features, including floodways, parkland and national forests, and historic buildings and sites. As projects move forward from planning to development, additional impacts should be considered,
such as the need for property and right-of-way acquisition, wetland impacts, and impacts to other critical environmental areas. Public support and opposition to projects should also be considered. For example, the Okolona Road (SR 359) Realignment (Project ID 24) received significant opposition during the second round of public engagement and was removed from consideration in this Plan update
Figure 7-4. MTP Projects Near Cultural and Natural Resources
7.4 Environmental Mitigation Strategies
As the projects included in this MTP move through the project development process from planning, to engineering and design, and finally to construction, impacts to both natural and cultural resources should be avoided wherever possible. Where conflicts are unavoidable, they should be minimized to the fullest extent possible and mitigated to ensure that lost resources are compensated for elsewhere. Table 7-5 outlines a variety of environmental mitigation strategies that should be employed to reduce the negative impacts of transportation projects in the Johnson City region.
Table 7-5.
Mitigation Strategies
Resource
Air Quality
Agriculture and Farmlands
Cultural and Historical Resources
Habitat and Wildlife Areas
Open Space, Parks, and Recreation
Water Resources
Mitigation Strategy
Apply an environmentally safe soil stabilizer on dirt roads
Sweep roadways
Encourage the use of electric vehicles and alternative fuels
Avoid agricultural lands when possible when siting projects
Monitor agricultural lands for future environmental damage after projects are developed
Consult early with the state historic preservation officer and other interested persons and parties to determine what resources may exist in a specific area
Engage in community discussions to understand valuable resources
Employ relocation, marking, and other measures as appropriate
Avoid impacts by relocating projects or most impactful portions of projects to a less sensitive area
Minimize impacts by modifying projects to reduce impacts
Repair and restore affected areas to pre-disturbance conditions or mitigate adverse impacts by restoring and improving conditions as part of a mitigation bank
Replace affected lands with areas of equivalent usefulness and location, and of at least comparable value
Restore and landscape disturbed areas
Replace and improve facilities affected by projects, including sidewalks, paths, benches, lights, trees, and other facilities
Promote redevelopment over new development to preserve existing permeable lands
Require low-impact development and strongly encourage zeroimpact development
Avoid impacts to wetlands or other aquatic resources; minimize impacts and compensate where unavoidable
Compensate for lost functions of affected aquatic resources and set measurable and enforceable ecological performance standards to ensure successful compensation
The MTPO will continue to coordinate with the following state and federal agencies to minimize environmental and cultural impacts related to the implementation of projects included in the 2050 MTP:
• Tennessee Department of Environment and Conservation (TDEC)
• Tennessee State Historic Preservation Office (SHPO)
• Tennessee Wildlife Resource Agency (TWRA) Federal Agencies
• U.S. Environmental Protection Agency (EPA)
• U.S. Army Corps of Engineers
• U.S. Fish and Wildlife Service
• U.S. Forest Service
• U.S. Department of Agriculture
• National Park Service (NPS)
• Tennessee Valley Authority (TVA)
7.5 Climate Change, Adaptation, and Resiliency
In addition to the impacts of projects on existing resources, the MTPO must anticipate and plan for environmental changes that will have an impact on existing and future capital assets. As the climate continues to change, extreme weather and climate-related disasters will become increasingly common and require advanced planning to ensure the resiliency of the region’s transportation system. Planning for a resilient transportation system will help guarantee that our investments in transportation infrastructure continue to serve the diverse needs of the region into the future. To further increase the resiliency of the transportation system to climate change and extreme weather, the Johnson City MTPO will continue to support climate adaptation and mitigation activities, including:
• Analyzing the potential impact of extreme weather and other climate-related stressors on the transportation system and mitigating risks as they are identified;
• Supporting low-emissions transportation options, including transit, non-motorized transportation (walking and bicycling), and electric vehicle technologies;
• Prioritizing maintenance of the existing transportation system as well as transportation system management and operations strategies over capital system expansion; and,
• Supporting conservation development strategies, including infill development, transit oriented development, and mixed use development to reduce the impacts of sprawl and discourage car-oriented development patterns.
APPENDICES
Appendix A. Public and Stakeholder Engagement
First Round of Public Outreach: Survey #1 – Summary of Responses:
The first MTP Update survey was available online from January to March 2022 and was completed by 313 respondents. Respondents provided information about past and future development preferences, transportation priorities, and locations of transportation-related issues and opportunities. Key results include:
• Congestion on the region’s roadways: 89% of respondents believe that roads have become more congested, while 16% perceive that congestion has remained the same.
• Past development: More than half (53%) of respondents believe that development has occurred at just the right density over the past 10 years, while 25% believe it has been too sprawling, and 22% believe it has been too compact.
• Future development: Respondents have relatively evenly distributed opinions about where future development should occur – 30% believe it should be evenly spread throughout the region, while 24% think it should be focused near or next to existing development. 19% of respondents believe future development should be focused along road corridors.
• Overall system priorities: Maintenance of existing roadways was the top priority (185 votes), followed by reduced congestion and delay (156 votes), and improved safety (154 votes).
• Preferred roadway improvements: Respondents most preferred bridge and pavement improvements (171 votes), while improved timing of traffic lights (154 votes) and improved safety (146 votes) were a close second and third.
• Preferred transit improvements: the highest ranked transit improvement was the development of more sidewalks and trails connecting to transit stops (108 votes). Improved security was a close second (93 votes). The third highest ranked transit improvement was expanded service hours (70 votes).
• Preferred bicycle and pedestrian improvements: An emphasis on safe routes to school (151 votes) was the top priority, followed by more off road facilities (126 votes) and more sidewalks (123 votes).
The priority ranking questions included the option to provide additional clarification through expanded comments, which included the following feedback:
Item
Add/lengthen turn lanes
Number of Comments
Summary Comments
3 Suggestions for roundabouts instead of turn lanes, complaints about ineffective turn lanes
Additional transit facilities 3 Support for expanded transit service and additional investment in safety
Beautification of transportation facilities 2 Support for beautification and street lighting
Support for mixed use, walkable developments, less parking, passenger trains, connected sidewalks, and additional bicycle infrastructure
Support for additional bicycle infrastructure to reduce barriers to bicycling
Support for additional density along existing roads, more alternatives to I-26, desire to focus on maintenance of existing roads before investing in new roads, and crosstown connectivity for Johnson City
Support for higher density, walkable developments for better ROI
Complaints about safety issues for pedestrians, desire for stricter requirements for bicycle/pedestrian safety education to motorists before issuing driver’s licenses
Support for more walkable communities, public health improvements, desire for more police presence in school zones, longer crossing times for pedestrians
Improved transit as an equity issue, expanded service hours improving safety and better connecting ETSU to downtown Johnson City
Desire for roundabouts, addressing signal timing near the McDonalds by ETSU, removing 1-lane tunnels
Support for roundabouts, loop detectors, increased turning times, improved traffic timing in general
Support for roundabouts, law enforcement on I-26, more barriers between sidewalks and bikeways, school zones, sidewalks near grocery stores
for police and encouraging more transit ridership through security improvements
Recommendation to address safety issues at the I-81 and I-26 interchange
for roundabouts, preserving air quality for tourism and public health
crosswalk issues in downtown, sidewalk maintenance, additional cleaning of bike lanes
More off-road facilities
More on-road facilities
Support for additional off-road bike/ped facilities, support for expanding the Tweetsie trail and additional greenway facilities
Support for expanded on-road bicycle facilities with physical barriers from cars where possible More sidewalks
Strong support for more sidewalks More sidewalks and trails
Strong support for more sidewalks and trails More transportation choices
Support for expanded bicycle infrastructure, a bus from Johnson City to Kingsport, and additional sidewalks New or wider
Preference for investing in existing infrastructure before expanding the system, no new roads without pedestrian infrastructure
Requests for bicycle and pedestrian facilities, additional housing, increased density, native plantings, widening I-26, walkable communities, bus services, stronger planning and zoning policies, passenger rail service, focus on maintenance, parking enforcement, county road improvements Pedestrian improvements and intersections
Support for pedestrian visibility projects at crosswalks
Support for publicly accessible traffic cameras, providing alternative transportation options, investments now to address future issues
Support for widening to provide pedestrian facilities, no comments support widening for vehicle lanes
The interactive map received 456 comment markers in the following categories:
• Traffic operations – 26% (118 comments)
• Safety – 27% (125 comments)
• Bicycle/Pedestrian – 21% (97 comments)
• General Suggestions – 13% (61 comments)
• Maintenance – 8% (38 comments)
• Transit – 4% (17 comments)
Stakeholder Meeting #1 – Economic Development, Freight, and Tourism 03/21/2022
Attendees: Amy Kosanovic (TDOT), Dr. Jon Lane Smith (ETSU), Glenn Berry, Mary Butler, Kayla Ferguson, Hannah Plummer
Discussion:
• The MTP plan will acknowledge the rapidly changing technologies associated with electric vehicles but will likely not include major recommendations for EV infrastructure. That work will be completed at the state level and will incorporate findings from previous studies, such as the I-40/I-81 Alternative Fuels Corridor Study.
• The ETSU campus is generally constrained to its 317 acres, though it plans to increase the student population to 18,000 in the coming years. Student housing will likely densify on-campus where possible, and the private sector will provide the excess capacity that’s required. No major plans for off-campus development that would affect transportation on a wide scale.
• The on-campus shuttle service is well used, though there is still some congestion on the road networks that serve student housing (e.g., Seminole Drive and Greenwood Drive)
• Students would likely take advantage of additional facilities to walk and bike, and additional JCT service would also be utilized by students.
• TDOT has submitted a request to FHWA to increase the mileage of interstate in Tennessee that is designated as part of the Primary Highway Freight Network, but the effects in the Johnson City region are unknown at this point.
• TDOT will soon be updating its Statewide Freight Plan and will be incorporating the findings from previous studies including corridor plans and freight studies.
• TDOT recommends reviewing the I-26 Corridor Study to include project recommendations along I-26 that may affect freight, including safety projects, TSMO projects, truck climbing lanes, overnight parking locations, etc.
• There were previous discussions about developing an inland port in the region, but conversations stalled during the pandemic.
• The Tri-Cities Airport has recently re-graded 120 acres near the existing runways to position itself for expansion in the future. Improvements to SR 75 heading south toward the MPA may help accommodate future residential and economic development near the I-26 interchange.
• SR 67 heading west from Johnson City may also see additional growth and development over the next 25 years.
• Lone Oak is frequently cited as a safety issue for cyclists and pedestrians as it has no shoulders and challenging turns/visibility due to horizontal and vertical curvature.
Stakeholder Meeting #2 – Bike/Ped, Transit, Health and Equity 3/28/2022
Attendees:
• Ashley Davies (Tennessee Department of Health)
• Chris Hodgin (Washington County Health Department)
• Jerry Boyd (Washington County Schools)
• Steven Barnett (Johnson City Schools)
• Chase Milner (First Tennessee RPO)
• Glenn Berry (Johnson City MTPO)
• Kayla Ferguson, Hannah Plummer (KCI)
Discussion:
• The Boones Creek Road bike lane and the Tweetsie Trail are used for both recreation and commuting. The Tweetsie Trail provides good access between Johnson City and Elizabethton, and there is support for additional facilities beyond the Trail to support commuting trips.
• There are a lot of bicyclists on Knob Creek Road, but vehicle speeds are high, making it uncomfortable for cyclists so the use of sidewalks and side streets is common.
• Some schools are surrounded by well-connected sidewalks in Johnson City, but once you get into the unincorporated areas, there's a significant decrease in access to schools. Lack of safe roadway crossings on major facilities and lack of sidewalks are barriers that prevent students from walking to school.
• For the county school system, sidewalks are more limited. Schools are often located on a major highway, so there are no adequate bike/ped facilities. Due to low residential density and lack of facilities, most students ride the bus, and there are very few that walk to school. Buses in the county often have to go door to door to pick up students because there are few areas for them to safely wait for the bus outside of neighborhoods.
• There are few protected bicycle facilities, and in general, more protected facilities would likely see more use if they were available. Additional bike lanes are needed to provide access to downtown Johnson City and commercial areas north of downtown.
• Additional bikeway and trail access to north and east Johnson City would be great. Access is currently pretty comfortable near ETSU and the hospital.
• General attitudes toward bicyclists have improved over the last 20 years.
• There are opportunities to encourage more economic and tourism framing around the existing and future trails systems in the region.
• The Carter County Mayor and the Carter County Parks and Recreation Board is working to secure funding for expanding the Tweetsie Trail to connect Valley Forge and Hampton, which would include a railroad bridge and tunnel and would be a big draw for recreational tourism.
• There was an attempt to get the Tweetsie Trail signed on the interstate, but TDOT did not approve the request.
• There is an additional project to connect the Tweetsie Trail and the linear path in Elizabethton near the covered bridge.
• Johnson City is installing new sidewalks near the Walmart off Highway 11E.
• The Washington County Highway Department doesn’t install or maintain sidewalks, which makes it difficult to expand pedestrian facilities outside of incorporated areas.
• There is a desire to extend the Tweetsie Trail or construct other safe and comfortable bike connections to Jonesborough as an economic and recreational draw. Public comments support the idea of utilizing W. Walnut Street instead of Highway 11E.
• TDOT plans to update the statewide bike network. Current bike route signage by the state was installed in the 1980s and may not reflect a recommended network for most cyclists. In many cases, roads that are currently marked as bike routes are no longer safe for cycling, particularly in urban areas that have seen significant growth. For example, Allison Road near Piney Flats is more developed now than when it was signed as a bike route, so it's no longer safe for biking.
• Projects like the complete streets grant in Sneedville provide inspiration for the region. There’s a need for complete streets improvements near the Sevier Tower in Johnson City where there’s low-income housing and plans for additional housing near the Food City.
• Carroll Creek Road near the Sullivan County line would be a great opportunity to have multimodal access to parks and the creek in that area. Public Works is aware of this desire. Public comments supported the general desire to improve bike/ped access to parks across the region.
• The Johnson City MTPO may develop a separate bicycle/pedestrian plan for the region in the future. It would help feed the next MTP update and quantify bike/pedestrian needs in the region.
• The RPO is interested in the Tweetsie Trail extension and is willing to partner with the MTPO.
• North/South Roan Street has the need for dedicated multimodal facilities – especially near Food City – to serve as a key multimodal connection north-south through Johnson City.
o They are seeing a lot of growth around the new school in the Boones Creek area, multifamily housing in Gray, single family in the outskirts of the city limits.
o Not a lot of new commercial development in the unincorporated areas, but more businesses locating in the industrial parks.
o Near Jonesborough, there’s additional development along Boones Creek Road and on US 11E/Jackson Blvd.
o In general, if there’s vacant land that doesn’t have environmental issues, someone's looking at it for development potential.
o There are two EBM-Pabst plants - and one is being renovated to become a manufacturing facility that will employ 200 people within the next 3 years. There is a project to address geometric changes and potentially a future project to install a new traffic signal for the entrance to the Washington County Industrial Park.
o There may be a need to improve the entrance to the new Jonesborough school.
o The old Boones Creek Elementary school will be a satellite campus for TCAT.
o There are no preservation overlays in Washington County.
o A casino is proposed for development in Bristol that will potentially generate additional commercial employment in the MTPO area.
o There is a push for expansion of the Aerospace Park near the Tri-Cities Airport but no tenant currently.
o Available utilities serves as a constraint for development across the County and in Jonesborough. However, many areas near the Johnson City city limits have utilities in place.
• Growth in Johnson City:
o Development is highly dependent on geology – karst bedrock limits where development is physically possible.
o Expanding out towards Jonesborough, land southwest of the city limits is filling in. There’s lots of development in the areas northeast of town near the Boones Creek area, which typically involves annexation.
o The urban services area layer is available on the GIS portal.
o Johnson City growth will continue to happen around Boones Creek Road based on land availability and proximity to I-26. There are ongoing discussions about when and where to widen Boones Creek Road and Knob Creek Road based on this anticipated growth, especially in the Regional Retail Tourism Development District around Exit 17 on I-26.
• Growth in Gray:
o Utilities are the primary limiting factor for growth in this area. There was a sewer study recently conducted that highlighted the lift stations as a maintenance challenge. Sewer and lift stations are a priority issue. Replacement is expensive so other alternatives are being weighed right now.
o Historically, the annexations in Gray were pivotal in changing the state legislation around annexation
o Pushing hard on infill development in Gray. Near Sullivan County and Piney Flats, a lot of growth happening in that area, but there will be some limitations because of inability to do water/sewer expansion.
• Growth in Carter County:
o A new outdoor center is being discussed for the Watauga area, modeled after the Nantahala Outdoor Center (NOC) seen mostly in North Carolina. The Carter County Commission is on board as this could be a way to capitalize on natural resources to grow the economy surrounding outdoor recreation/tourism.
o Most potential development is concentrated in west Carter County on the west side of Elizabethton, nearest to Johnson City employment opportunities. Some is in the Urban Services Area (USA), but the city doesn’t extend sewer outside the USA currently.
o A portion of SR-91 near Holly Street is being widened, which should encourage additional development/redevelopment along this corridor.
o Horton Development Company is trying to enter the Elizabethton housing market by building houses on small lots.
o Elizabethton annexed out along Milligan Highway – there’s no sewer out there, which is not an issue currently but could become one at any point.
o Watauga is on Elizabethton's city water. Elizabethton has a planning contract with Watauga, but there’s not a lot going on in that area though there are few commercial lots that could develop in the future.
o Elizabethton has been trying to attract a chain hotel though there's no near term plans at the moment.
o Carter County has approved 900 acres of development in the mountainous, unincorporated parts of the county. These are mostly large lot residential developments. The Watauga Development Corporation is behind a lot of this development.
o There’s development occurring on Mary Patton Highway; approximately 35 lots near Gap Creek Road.
o The intersection of Gap Creek Road and US 19E will be getting a signal.
o In general, National Forest land is protecting the area around Watauga from development.
o All the drainage is being replaced along Dennis Cove Road in east Carter County. This road is primarily used for residents to access Laurel Falls/Dennis Cove recreation areas and Appalachian Trail.
• Growth in Unicoi County:
o Johnson City owns the former golf course in Unicoi and would like to see it sold or redeveloped. There have been conversations about redeveloping that area, most likely for residential, but topography makes this complicated. As such, there’s currently no development plan for the golf course.
• Legislation affecting development:
o The Regional Retail Tourism Development District Act was passed by the Tennessee General Assembly in May 2019 and is only applicable to Johnson
City, specifically 950 acres within a 1.5 mile radius around Exit 17 (SR 354) on I26. It was requested by Johnson City, small group of developers and business owners and is a massive tax rebate incentive program. If the site is developed for entertainment and retail and it meets the criteria outlined in the legislation, 75% of the sales and use taxes go to the city of Johnson City for incentives or infrastructure.
o Development in the area may necessitate a new connection between Boones Creek Road and State of Franklin Road. A potential connection point could be tying Browns Mill Road to Christian Church Road but would require an interstate overpass.
Second Round of Public Outreach: Survey #2 – Summary of Responses:
The second MTP Update survey was available online from May to June 2022 and was visited by 1,400 users. Respondents were able to use an online map using Social Pinpoint to view locations and information on individual candidate projects, upvote or downvote projects, and provide comments There were 1,581 upvotes and 206 downvotes provided. The top five projects that received the most upvotes are:
1. Adaptive Signal Control (73 upvotes);
2. I-26 at Exit 19-North State of Franklin Road (SR 381) Interchange Improvements (65 upvotes);
3. Tweetsie Trail Extension (64 upvotes);
4. East Oakland Avenue Pedestrian Safety Improvements (62 upvotes); and
5. I-26 Widening (Exit 17 to 20) (59 upvotes).
In addition to the votes on candidate projects, 47 comments were also submitted. In summary, key feedback include:
• Widespread support for the ITS and safety projects, particularly adaptive signal control, ITS deployment along I-26, and projects addressing sight-distance issues and other geometric deficiencies;
• General support for the recommended widening of I-26 and Boones Creek Road;
• Strong opposition to the Okolona Road (SR 359) realignment due to property acquisition and environmental concerns; and,
• Strong support for the bicycle and pedestrian recommendations, particularly the Tweetsie Trail Extension and East Oakland Avenue pedestrian safety improvements.
On the next page is a summary of the votes and comments received on the candidate projects shown on the Social Pinpoint map.
be
sooner and all the way to I-81
Support for more sidewalks in the city and to Jonesborough
Third Round of Public Outreach: Draft 2050 MTP – Summary of Responses:
The third and final round of public outreach was to seek public comment on the full draft of the 2050 MTP. The draft of the 2050 MTP was available online for download from the Johnson City MTPO website and was also available in print at the MTPO offices. The notice of the public meeting on November 30, 2022 and the 30-calendar day public comment period from November 9 to December 9, 2022 was published in the Johnson City Press and also posted on the MTPO’s website and social media. Emails were also sent out to the MTPO’s distribution list. Postcards with a QR code linking to the MTPO’s website were also placed at the Langston Centre, the city’s multicultural facility.
During this public comment period, 8 comments were received. These comments are listed on the next page.
Date Name Comment
11/10/2022 Grete Scott
11/10/2022 Jess Smythe
Daily, I see young middle schoolers walking to school 12 inches away from cars driving 50 MPH on Knob Creek between Regency Dr. and Guaranda Dr. Please please please add a bike/pedestrian lane here. There's a sidewalk, but with no grass to separate it from a tight four-lane road, we will soon have walker injuries or even casualties. I'm even more worried about this now that 6th graders go to Liberty Bell, adding younger walkers on this road.
Definitely need bike lanes. So unsafe and slow for them to be on the road. Thank you!
I would like to see an emphasis on non-car transportation options, particularly in the downtown and surrounding neighborhoods.
11/10/2022 Caleb Perhne
Particularly, I would like to see proper bicycle lanes with barriers to segregate riders from car traffic. Look at the Dutch model. Right now it is much too dangerous to bicycle to downtown or nearby grocery stores without getting hit or angering drivers. Bike lanes either don’t exist or are painted stripes on speedy highways that would incur death or injury if tested. I imagine a world where most tasks can be done by bicycling around town and saving a lot of gas money.
A long range addition to this- passenger rail. It would be amazing to walk from home or hop on a city bus (that doesn’t take all afternoon to arrive like our current nearly-useless transit) and arrive at a train station downtown with affordable tickets to Atlanta or DC or New York.
11/14/2022 Keith Kelley, US Forest Service
11/16/2022 Christy Smith
We have no comment on this plan. Thank you.
We desperately need transportation in Unicoi County. Many citizens are limited to shopping, doctors appointments in Johnson City, recovery group support, etc. Transportation has always been a need in the county. I would love to see JC MTPO help rural communities. I fully support this plan and commend JC MTPO for progressively planning this great idea for the future of our region
11/17/2022 Danette Waugh, Tennessee
Wildlife
Please make the change (name and address) below: Jason Maxedon, Executive Director, Wildlife Resources Agency, 5107 Edmondson Pike, Nashville, TN37211-5129
11/27/2022 Erin Cassity
Johnson City resident here: I'm happy to see some focus on improving public transit as well as bicycle/pedestrian infrastructure, but I would like to see more. I'm enthusiastically in favor of the W. Walnut St. improvements and other similar projects. I would like to see more projects like this as well as changing zoning to develop complete neighborhoods (reducing car-dependent sub-divisions) as well as complete streets.
I’m also generally against plans to widen I-26. Interstate widening is an expensive band-aid solution. I would much rather more investment be poured into making public transit more reliable, accessible, frequent, and desirable even for those with potential access to a car. This way, traffic is alleviated by reducing demand, which I've found to be the only lasting solution. I personally would much rather take public transit across Johnson City for my commute than drive, but the route near my workplace doesn't run frequently/late enough for me to make it back home. I would love to be able to live here in Johnson City without feeling the need to own a car, especially as the area becomes more urbanized.
On a much smaller scale, I would love to see some pedestrian/bicycle infrastructure improvement on Southwest Ave. between Cherokee Rd. and the ETSU campus
1. Please finish 4 laning last 3.5 miles of SR 36 in Sullivan County. This will finish project 4-laningfrom Kingsport, TN, to Johnson City, TN.
11/30/2022 Terry Cox
2. Please build more sidewalks on Southwest Ave to ETSU from Cherokee Rd.
3. Need signal light at Cherokee Rd (SR 67) and Southwest Ave. Need quickly
Targeted Outreach Efforts:
The following table outlines the various outreach methods employed during the MTP Update.
Format
Johnson City Press
Advertisement
Johnson City MTPO webpage
Johnson City MTPO Twitter and Facebook
City of Johnson City webpage
City of Johnson City Twitter and Facebook
Johnson City Transit Twitter
Johnson City MTPO Email
Distribution Lists
Infogroup Business
Community Email List
Posters at Johnson City
Transit Facility
Event
Public meetings (virtual and in-person events); surveys
Public meetings; surveys; MTP Update general information
Public meetings; surveys; MTP Update general information
Public meetings; surveys
Public meetings; surveys
Public meetings; surveys
Public meetings; surveys; MTP Update general information
Public meetings; surveys
Public meetings; surveys
The following agencies, organizations, and individuals that represent advocates for environmental protection, land use management, natural resource and historic preservation were consulted as part of the MTP update.
Organization
Contact
East Tennessee State University Director of Campus Planning
Elizabethton Housing Authority Director
Federal Lands – Eastern Division Division Director
Greyhound Bus Lines Logistical Officer
Johnson City Housing Authority Director
Milligan University President
National Park Service Southeast Region Regional Director
Sycamore Shoals State Park Park Manager
Tennessee Department of Economic & Community Development Deputy Commissioner
Tennessee Department of Environment & Conservation Regional Director for External Affairs
Tennessee State Historical Commission Executive Director
Tennessee Valley Authority Manager NEPA Compliance
Tennessee Wildlife Resource Agency Executive Director
U.S. Army Corps of Engineers District Commander and District Engineer
U.S. EPA Region 4 Regional NEPA Coordinator
U.S. Fish and Wildlife Service Field Supervisor
uRidez LLC Taxi Manager
USDA Forest Service
Forest Supervisor
Veterans Affairs Administration Engineer
Veterans Transportation Services
Veterans Transportation Services
W W Cab Co. Manager
The following Executive Board meetings were held during the development of the Johnson City Metropolitan Transportation Plan Update.
• Executive Board Meeting #1, January 29, 2022 – This presentation included a review of the MTP’s goals and objectives, as well as population and employment control totals and growth assumptions to be applied in the development of the travel demand model. These were approved by the Executive Board for use in the 2050 MTP.
• Executive Board Meeting #2, April 28, 2022– This presentation included an overview of the financial assumptions including revenue assumptions and inflation rates for concurrence by the Board. These rates were used to calculate future revenue estimates and year of expenditure costs for the MTP.
• Executive Board Meeting #3, June 21, 2022 – This presentation included a review of the draft project list for inclusion in the MTP document, as well as the financial constraint analysis and results for concurrence.
• Executive Board Meeting #4, December 13, 2022 – This presentation included a brief overview of the executive summary of the MTP as well as the public comments received as part of the third round of outreach, resulting in the plan’s formal adoption by the Board.
Appendix
1.0 MODEL UPDATE AND VALIDATION REPORT
1.1 INTRODUCTION
As part of the Johnson City 2050 Transportation plan, RSG updated the Johnson City model to have a validated base year of 2020 and a horizon year of 2050. This document describes the updates the consultant made to the Johnson City MTPO travel demand model (“the model”) for application to the organization’s Metropolitan Transportation Plan (MTP) update. Prior to updating and applying the model for the MTP Update, an overview of the current model was conducted to further define the actions to be taken as part of the update. This memo is a required deliverable as described below.
1.2 MODEL OVERVIEW
The Johnson City MTPO currently serves the jurisdictions of Bluff City, Elizabethton, Johnson City, Jonesborough, part of the town of Unicoi, and parts of Carter, Sullivan, and Washington Counties in Tennessee. The Model study area consists of Carter County, Unicoi County, Washington County, and parts of Sullivan County. The previous model had a validated base year of 2015 and a future year of 2045. The interim model year was 2025. The model follows the basic “four step” travel demand forecasting process of trip generation, trip distribution, mode split, and traffic assignment.
This document describes the updates to the Johnson City travel demand model. It does not replace the model documents developed for the previous model developed in 2017. Detailed information on the steps for setting up and running the model should follow the previous model documents.
1. QuickStartGuide_3_23_2018
2. JohnsonCity_TDM_Users_Manual_v1_8_4_2017
The model updates are described below.
1.3 MODEL INTERFACE
The model is designed to utilize TransCAD’s native scripting language, Geographic Information System’s Development Kit (GISDK), which provides an intuitive, yet flexible interface The model features an interface that can run different steps of the model individually or as a set with a Run All function. The model allows flexibility in managing files, scenarios, and mapping. The model has been updated to run in TransCAD 8 Build 22410 64 bit.
1.4 BOUNDARY AND TAZ REVIEW
A traffic analysis zone (TAZ) is a geographic area that is used to divide the planning region into small, relatively homogenous areas. TAZs are used to represent travel activity within the zone because it’s difficult to model individual households and employment. Therefore, housing and employment are aggregated to the TAZ and used through the modeling process to develop the origins and destinations of
trip travel within the model. The Johnson City Model TAZ boundaries were reviewed for splits or modifications, but no changes were made to the 2015 geographies and the TAZ zonal numbers are consistent with the previous model (Table 1). In addition, State ID, County, and District IDs were reviewed in the 2015 TAZ database and no changes were made. Model code and relevant TAZ attributes were updated with the base year of 2020.
TABLE 1 TAZ NUMBERING SYSTEM
TAZ boundaries are consistent with the federal urban designation for the Johnson City Urbanized Area (Figure 1).
FIGURE 1 JOHNSON CITY MTPO TRAFFIC ANALYSIS ZONES
1.5 BASE YEAR DEMOGRAPHIC AND EMPLOYMENT DATA
Base year population was updated using the 2020 Census ACS 5-year estimates and 2019 ACS 5-Year estimates were used to compare the differences between 2019 and 2020. 2020 employment data was purchased from Infogroup, which was then transferred to the model database to update the demographic and employment data to 2020 totals. Due to the travel impacts of the COVID-19 pandemic, consideration was given to the selection of the base year, namely whether 2019 or 2020 data should be utilized for population and employment totals. Availability of the decennial Census data and pre-pandemic employment data (collected in February of 2020) made available by TDOT through InfoGroup made 2020 the preferable base year On another note, 2019 population and employment data would be estimates based on the American Community Survey and not actual census counts. As such, KCI completed a highlevel comparison of population and employment in the MTPO model area between 2019 and 2020 to evaluate the potential impacts of base year selection on the model’s socioeconomics. Table 2 highlights the results of this comparison of total population and total employment, which is broken down in the model by the NAICS industry codes shown in Table 3 As shown, the difference between 2019 and 2020 population and employment is approximately 2.4% and 5.2%, respectively This review confirms the use of 2020 as preferable for the model base year.
TABLE 2: POPULATION AND EMPLOYMENT COMPARISON
Source: Population, 2020 Census and ACS 5-year estimates, Employment, Infogroup *These numbers are pre-Covid pandemic estimates
Base year school enrollment data were updated to the new base 2020. The data was sourced from the National Center for Education Statistics, 2020-2021. The data was spatially joined to the model’s TAZ layer; and enrollment for K-12 and college were aggregated and updated to 2020 totals. (Table 4)
TABLE 4: SCHOOL ENROLLMENT
Source: National Center for Education Statistics, 2020-2021 (U.S. Department of Education, Common Core of Data (CCD)).
The household cross-classifications were updated using the current Census Transportation Planning Package1 (CTPP) totals. The current CTPP datasets use a special tabulation of the 2012-2016 5-year estimates of the US Census American Community Survey (ACS). Data is available down to the Census tract level. The following cross-classification values were updated:
o Household size (number of persons) by vehicle ownership (number of vehicles owned per household)
o Household size by number of children (age < 18) in household
o Number of workers in household by vehicle ownership
Table 5, Table 6, and Table 7 show the different distributions of the three cross-classification tables for the Johnson City MTPO region
TABLE 5: HOUSEHOLD SIZE BY VEHICLE OWNERSHIP CROSS-CLASSIFICATION
TABLE 6: HOUSEHOLD SIZE BY NUMBER OF CHILDREN CROSS-CLASSIFICATION
TABLE 7: NUMBER OF WORKERS BY VEHICLE OWNERSHIP CROSS-CLASSIFICATION
Using the MPTO approved 2020 household control totals, the cross-classification distributions from the above tables were applied to each TAZ to obtain the total number of households in each crossclassification bin. It should be noted that there are several Census tracts within Tennessee that do not have data available, likely due to privacy controls with the ACS (e.g., a tract with very few households, where individuals could be easily identifiable). If there were TAZs with tracts that did not have data available, the average distributions for the available data were used.
The total number of households for the base year 2020 in the model study area is 102,394, with a total population of 218,487, (Figure 2). This is an increase of 2.6% from the 2015 households of 99,671 with a total population of 214,535. Total employment for base year 2020 decreased from 2015, with a total of 81,343 jobs within the study area compared to 91,016 respectively, (Figure 3).
FIGURE 2: TOTAL HOUSEHOLDS BY TAZ
FIGURE 3: TOTAL EMPLOYMENT PER TAZ
1.6 ROAD NETWORKS
The previous model update was completed in 2017. A review and update to the roadway network consisted of checks with the Johnson City 2020-2023 Transportation Improvement Program (TIP). The network underwent a review of model linework and was edited where necessary. The network attributes were reviewed, and attribute information was updated with Year naming in the field name (Table 8). Roadway additions include a completed roadway project, a connector road at the VA Medical Center (Gold Star Blvd.) connecting to SR-34 (West Market St). One alley that existed in the network was removed since it is a lower facility type which would not attract a significant amount of traffic volume. The link specific turn penalty table was checked and a total of 18 additional turn penalties were added to the table. These consisted of illegal interchange turns and U-turns, mostly along US-19E and US-19W.
TABLE 8 ROADWAY NETWORK ATTRIBUTES
of the screen lines (To be consistent with the IDs
2015)
counts by three vehicle class [Auto/SU/CU] by four time-of-day periods [AM/MD/PM/OP] and total
33 [AB/BA]_Parking
38 [AB/BA]_Preload
39 AB/BA]_Cong_Speed _[AM/MD/PM/OP]
40 [AB/BA]_Cong_TT _[AM/MD/PM/OP]
41 [AB/BA]_MSA_Speed _[AM/MD/PM/OP]
42 [AB/BA]_MSA_TT _[AM/MD/PM/OP]
43 [AB/BA]_MSA_Flow _[AM/MD/PM/OP]
44 [AB/BA/BothDir]_Capa _[AM/MD/PM/OP/Daily]
direction
Output Congested speed (mph) by travel direction and time-ofday
Output Congested travel time (minutes) by travel direction and time-of-day
Output MSA speed for feedback loop (mph) by travel direction and time-of-day
Output
travel time for feedback loop (minutes) by travel direction and time-of-day
Output MSA flow for feedback loop by travel direction and time of-day
45 [AB/BA/BothDir]_VOC _[AM/MD/PM/OP/Daily] Real Output Volume to capacity ratio by travel direction and time-of day
46 [AB/BA/BothDir]_LOS _[AM/MD/PM/OP/Daily]
Real Output Level of service by travel direction and timeof-day
Output Worst LOS among all time-of-day period and travel direction
Output Traffic volume by travel direction, vehicle class, and time of-day
and time-of-day
Traffic counts are used in the modeling process to validate the model’s accuracy The current model integrates base year counts from the Tennessee Department of Transportation’s (TDOT) transportation data management system, TN TIMES2 traffic count database, as part of the roadway network input file. All counts within the roadway network were reviewed and updated where possible As part of the meeting with staff from KCI, RSG, and the Johnson City MTPO on December 15, 2021, a decision was made to use 2019 traffic counts as part of the validation process. A review of TDOT’s traffic data from 2019, 2020, and 2021 for the four counties in the region indicated a dip in traffic volumes in 2020, which correlates with travel and social distancing restrictions imposed during the COVID-19 pandemic. Table 9 summarizes this comparison, which highlights that for all facility types, using 2020 Annual Average Daily Traffic (AADT) values for validation would likely not represent ‘normal’ travel conditions; therefore, 2019
2 Transportation Data Management System (ms2soft.com)
data was used for the base year model development. The Johnson City MTPO also consulted with Johnson City Traffic Division about the decision to use 2019 traffic count data and they concurred. Count data for the year 2019 was obtained from the TN TIMES and AADT counts were applied to the count field within the model’s roadway network for a total of 469 counts within the roadway network
TABLE 9: COMPARISON OF AADT VALUES BY FACILITY TYPE
The model contains input fields for vehicle classification counts by time of day, which includes Auto, Single Unit Truck, and Combination Truck A limited number of 2019 vehicle classification count locations are available through the TN TIMES count database. About 14% are observed TDOT counts, while the rest are estimated from the previous counts For consistency with the previous model’s count locations, in locations where vehicle classification count data was not available, the distribution of counts by vehicle classification and time-of-day period for 2015 was applied to the updated 2019 counts.
In addition, there were seven 2015 counts belonging to external stations where the TN TIMES database did not have matching counts for 2019. In these instances, an average growth rate of 4%, which is the average growth from 2015 to 2019 in observed data, was applied to the 2015 counts for an estimated 2019 count
The count data was joined to the model network via a spatial join and the network was extensively checked for incorrect joins or count locations throughout the network, e.g., an intersection in downtown Johnson City where three model links are tagged to one count station, or one direction of a divided facility being tagged with a traffic count but not on the opposing direction. In addition, counts that exist on one-way links in the model, represented by the network attribute “DIR” being 1 or –1, were halved since the 2019 counts from TDOT exist as 2-way totals, regardless of facility type. Figure 4 shows count locations in the model network.
FIGURE 4: COUNT LOCATIONS
1.8 REVIEW PREVIOUS EXTERNAL STATION LOCATIONS
All 39 external stations were reviewed, and stations were updated with 2019 data from TDOT or North Carolina DOT. Where 2019 count data was unavailable, a growth rate of 4% was applied. This applies to the following eight external stations: 503, 506, 507, 518, 520, 524, 528, and 531 where 2019 counts were unavailable. These stations are shown in red in Figure 5. Counts within the state were either updated with the nearest count location internal to the model, or, if deemed more appropriate, a TDOT count station external to the model region. For external stations that exist in North Carolina, 2019 AADT3 from NCDOT were used
3 Traffic Survey GIS Data Products & Documents (ncdot.gov)
FIGURE 5: EXTERNAL STATIONS
1.9 TRIP PURPOSES AND TRIP RATES
Due to the absence of a local household travel survey in the Johnson City MTPO area, the 2017 model used production rates from the National Household Travel Survey (NHTS) 2009 add-on data from TDOT and VDOT and the attraction rates were borrowed from the Chattanooga Regional Planning Agency (RPA) model. For the 2020 model, trip productions rates were updated following a similar method from the previous model update using the 2017 NHTS.
With the absence of add-on data for the 2017 NHTS4 , rates were solely calculated based on the base data from the 2017 NHTS. This data was then filtered by Metropolitan Statistical Areas (MSAs) that are less than 1 million residents located in Tennessee and Virginia to match as closely as possible to the previous 2009 NHTS add-on data locations Table 10 shows the trip production rates calculated based on the 2017 NHTS. Table 11 shows the rates adjusted during the calibration process. In addition, only trips occurring on Tuesday, Wednesday and Thursday were included in calculations. Household trips from the survey were then categorized by the Johnson City model trip purposes and cross-classifications and household-level trips rates were calculated by the number of trips by each model category and stratification divided by the total number of households in the selected MSAs. Following the previous model update's methodology, trip attraction rates were estimated using ordinary least squares (OLS) without an intercept. With the absence of a travel survey, the updated 2020 scenario trip attractions were used as a response variable for the regression models. Table 12 and Table 13 show the outputs of the trip rate and trip purpose benchmarks.
TABLE 10: 2017 NHTS PRODUCTION RATES
WK0_VH0 0
WK0_VH1 0
WK0_VH2 0
WK0_VH3 0
WK1_VH0 0.90838
WK1_VH1 0.92562
WK1_VH2 0.99514
WK1_VH3 0.99447
WK2_VH0 1.85252
WK2_VH1 1.69493
WK2_VH2 1.81411
WK2_VH3 1.91660
WK3_VH0 2.95833
WK3_VH1 2.90435
WK3_VH2 2.73906
4 National Household Travel Survey (ornl.gov)
HH1_CH0 0.01558
HH1_CH1
HH1_CH2
HH2_CH0 0.03143
HH2_CH1 0.82073
HH2_CH2
HH3_CH0 0.18774
HH3_CH1 0.62411
HH3_CH2 1.61776
HH4_CH0
HH4_CH1
HH2_VH0
HH4_VH3
TABLE 11: ADJUSTED 2020 PRODUCTION RATES
WK0_VH0 0
WK0_VH1 0
WK0_VH2 0
WK0_VH3 0
WK1_VH0 0.89
WK1_VH1 1.17
WK1_VH2 1.5
WK1_VH3 1.59
WK2_VH0 1.92
WK2_VH1 1.76
WK2_VH2 2.18
WK2_VH3 2.22
WK3_VH0 2.95
WK3_VH1 2.95
WK3_VH2 3.18
WK3_VH3 3.35
HH1_CH0
HH1_CH1
HH1_CH2
HH2_CH0
HH2_CH2
HH3_CH0
HH4_CH0
HH4_CH2
HH1_VH0
HH1_VH1
HH3_VH1
HH4_VH2
HH4_VH3
TABLE 12 AGGREGATE TRIP RATE BENCHMARKS
*Out of range from TDOT Benchmarks
TABLE 13 TRIP PURPOSE BENCHMARKS
1.10 VALIDATION
Model validation involves comparing model outputs to observed behavior The model was calibrated and validated following recommended FHWA and TDOT guidelines. The TDOT guidelines include FHWA desirable percent deviations, as well as reference to Michigan for comparison purposes. The Federal Highway Administration (FHWA) has guidelines for validating results which includes NCHRP 765: Travel Demand Forecasting: Parameters and Techniques5 . Model validation compares measures against the suggested FHWA targets to assess model validity for tasks such as supporting regional plan updates.
There are multiple validation checks used with each of the major steps of the model. The full model validation includes measures on VMT, percent root mean square (RMSE), R-Squared, daily volume within FHWA targets, and volumes validated with counts at screenlines. The model’s highway assignment report features validation criteria from FHWA [i.e., VMT, RMSE, R Square] and therefore no changes were made to the assignment reporting criteria within the travel demand model’s assignment reporting output to excel The screenlines were kept consistent with the previous model, and only slightly modified if a roadway link no longer had a count available. The screenline locations are shown in Figure 6
Following the update to the 2020 land use and 2019 traffic counts the model was calibrated to align with current TDOT and FHWA guidelines for RMSE and percentage error across volume groups and roadway facility types. Table 14 through Table 19 provide percent error, error by facility type, root mean squared, error by (RMSE), and validation metrics comparing the 2015 to the 2020 model update. Overall, the 2020 updated model’s validation is consistent with or slightly differs from the 2015 validation report. Several metrics are slightly out of range of the TDOT guidelines and in these cases, the metrics are identified.
TABLE 14: 2015 PERCENT ERROR BY VOLUME GROUP
TABLE 15: 2020 PERCENT ERROR BY VOLUME GROUP
6 Benchmarks for 10,000-30,000 Volume Group
7 Benchmarks for 30,000-50,000 Volume Group
8 Benchmarks for 50,000-65,000 Volume Group
TABLE 16: 2015 ERROR BY FACILITY TYPE
TABLE 17: 2020 ERROR BY FACILITY TYPE
*Out of range for small region, TDOT Benchmark
9 Large regions are defined as Metropolitan Statistical Areas of population greater than 500,000 or have at least 200,000 population and are part of a metropolitan area with a population of more than 500,000.
TABLE 18: 2015 SCREENLINE PERCENT ERRORS
TABLE 19: 2020 SCREENLINE PERCENT ERRORS
*Out of range for acceptable
preferable
In addition to the percent error and RMSE tables, the 2015 trip length frequency distribution (TLFD) was reviewed and compared to the updated 2020 model TLFD. Figures 7 and 8 show the respective TLFDs for the previous and current base year models. Tables 20 through 23 provide validation on the average trip lengths, percent intrazonal trips, vehicle miles traveled by roadway classification, and RSME by volume group. Figure 9 shows the coefficient of determination which estimates the correlation between the traffic counts and the model traffic volume.
Table 20
Congested Travel Time (minutes)
FIGURE 7: 2015 INTERNAL TLFD
HBW HBSC HBSP HBSR HBO NHB
Congested Travel Time (minutes)
FIGURE 8: 2020 INTERNAL TLFD
HBW HBSC HBSP HBSR HBO NHB
Tables 20 through 23 provide validation on the average trip lengths, percent intrazonal trips, vehicle miles traveled by roadway classification, and RSME by volume group. Figure 9 shows the coefficient of determination which estimates the correlation between the traffic counts and the model traffic volume.
TABLE 20: AVERAGE TRIP LENGTH BY PURPOSE
TABLE 21 PERCENT INTRAZONAL TRIPS
TABLE 22 ROADWAY CLASSIFICATION VMT
TABLE 23 RMSE BY VOLUME GROUP
*Out of range for acceptable or preferable
FIGURE 9 COEFFICIENT OF DETERMINATION
1.11 CONCLUSION
The model has been updated with network and socioeconomic data and then validated to meet the criteria from FHWA and the TDOT guidelines. The travel demand model sufficiently models travel behavior as observed with count data from the TDOT TN TIMES traffic count database.
Appendix C. IMPROVE Act Projects
The following table of projects was extracted from the State of Tennessee’s Improving Manufacturing, Public Roads and Opportunities for a Vibrant Economy (IMPROVE) Act – Public Chapter Number 181 (2017) House Bill Number 534. This list contains projects located in Carter, Sullivan, Unicoi, and Washington counties in Tennessee. Highlighted projects are located within the Johnson City MTPO Metropolitan Planning Area.
849 Route 0C835 Henry Road bridge over Muddy Creek
850 I-81
ITS expansion between I-26 (Exit 57) interchange and Virginia state line
851
126 (Memorial Boulevard) from East Center Street in Kingsport to east of Cooks Valley Road 852
126 (Memorial Boulevard) from east of Cooks Valley Road to I-81 in Kingsport
859 SR 34
Sullivan Gardens Parkway from south of Horse Creek to north of Derby Drive (spot improvements)
From US 11E (SR 34) near Bristol Motor Speedway to US 11W (SR 1) near Pinnacle Parkway
Sullivan Gardens Parkway from north of Davis Road to north of Fire Hall Road (spot improvement) 912 Route 06040
Knob Creek Road from SR 354 (Boones Creek Road) to Mizpah Hills Drive
Sullivan Gardens Parkway from Morgan Lane in Washington County to south of Baileyton Road in Sullivan County (spot improvement)
914 SR 36 Fort Henry Drive from SR 75 to I-81
Appendix D. Project Scoring Mechanism
10
Safety & Security (30 points)
10
Number of vehicular crashes along segment in 5-year period
Number of bike/pedestrian crashes along segment in 5-year period
10
Existing crash rate along segment in 5year period
10
Traffic Congestion Mitigation (20 points)
10
Existing (2020) volume-to-capacity ratio along segment
Existing (2022) travel time reliability along segment
This criterion prioritizes projects located on facilities with known safety issues for all motorists.
This criterion prioritizes projects located on facilities with known safety issues specifically for cyclists and pedestrians.
This criterion prioritizes projects located on facilities with known safety issues for all users.
This criterion prioritizes projects located on routes with existing capacity issues.
This criterion prioritizes projects located on routes with existing reliability issues.
Numeric Ranking - Points were subdivided based on data quartiles.
Numeric Ranking - Points were subdivided based on data quartiles.
Numeric Ranking - Points were subdivided based on data quartiles.
Numeric Ranking - Points were subdivided based on data quartiles.
Numeric Ranking - Points were subdivided based on data quartiles. Sustainable Growth and Livability (40 points)
10
Potential impacts of project based on type (maintenance, operational, widening, bike/pedestrian, etc.)
This criterion prioritizes projects that minimize future maintenance needs. The smaller the footprint of the project, the more points it receives.