
for Fiscal Year 2024 Annual Budget
BOARD OF COMMISSIONERS
Dr. Todd Fowler, Mayor
Aaron T. Murphy, Vice-Mayor
Jenny Brock
John Hunter
Joe Wise
ADMINISTRATION
Cathy D. Ball, City Manager
Randy Trivette, Assistant City Manager
Steve Willis, Assistant City Manager
Joy Baker, Interim Assistant City Manager
Dustin B. Thompson, Budget Director
Samantha Rivera, Budget Analyst
SPECIAL ACKNOWLEDGEMENT
Ann Marie French, Grants Coordinator
Nick Harrison, Digital Multimedia Specialist
J.T. McSpadden, Digital Communications Manager
Sarah Nobles, Public Information Specialist
1
2 TABLE OF CONTENTS Board of Commissioners Message from City Manager City Organizational Chart Strategic Plan City Overview Volunteer Boards and Committees Budget Overview Policies and Procedures Budget Calendar Fund Schedules Capital Debt Service Quasi-Governmental Organizations Departmental Overviews Budget Ordinance Personnel Summary Glossary ..................................................................................... 3 ............................................................................... 4 .................................................................................... 7 .................................................................................................... 10 . .................................................................................................... 14 .................................................................. 19 .............................................................................................. 23 . ................................................................................... 30 ................................................................................................ 38 ................................................................................................. 39 ................................................................................................................73 ...................................................................................................... 81 ................................................................. 91 .................................................................................. 95 ........................................................................................... 175 ........................................................................................ 199 ........................................................................................................... 223
BOARD OF COMMISSIONERS


The City of Johnson City operates as a home rule municipality and is governed by the City ManagerCommission form of government. The Board of Commissioners is the governing body of the City of Johnson City. Commissioners are elected at large for four-year staggered terms. Commissioners select the mayor from among their group following each election. The mayor serves as the ceremonial head of the City, presides over City Commission meetings, and represents the City of Johnson City at a variety of community and public functions. The Board of Commissioners hires a professional city manager to manage and direct day-to-day operations of city


government. City commissioners participate in a variety of boards, commission and committees. Their involvement provides an important link between citizens, businesses, non-profits and municipal government. The City Commission ensures the provision of community services the people of Johnson City need and want. In carrying out its duties, the City Commission must address citizens’ concerns while planning for the community’s long-term growth and development. To this end, it is the responsibility of the City Commission to oversee costs and be as efficient as possible while managing the City’s infrastructure projects and investments.

3
Mayor Todd Fowler
Vice Mayor Aaron T. Murphy
Commissioner Joe Wise Commissioner Jenny Brock
Commissioner John Hunter
City Manager’s Message to Commission
DATE: May 2, 2023
TO: Mayor and Board of Commissioners
FROM: Cathy D. Ball, city manager
SUBJECT: Fiscal Year 2024 Budget
Annually, I present and recommend to you the fiscal year budget in accordance with the Johnson City Charter and applicable governing bodies. The Fiscal Year 2024 budget for the City of Johnson City considers our commitment to financial sustainability and growth while maintaining core services, economic flexibility and a balanced approach. This budget reflects the voice of our citizenry as well as commission’s strategic vision while estimating expenditures and revenue. Moreover, this financial plan recognizes that economic uncertainty coupled with a rise in inflation has an impact on the overall budget. We know that operations will cost more in FY 2024, with significant increases expected in fuel, parts, and construction materials.
The Fiscal Year 2024 budget was built based on a projected estimate of nearly 5 percent growth in local option sales tax collected. Total general fund revenues are expected to come in $5.08 million more than projected for FY 2023, and we anticipate nearly $7.65 million additional next year. The City’s FY 2023 fund balance is projected at $51.26 million, with $23.62 million unassigned.
This budget includes a recommended 25 cent property tax increase to fund the essential services that keep our community thriving. The City’s last property tax adjustment was in FY 2016 and when factoring in future needs and inflation, we believe it is time to again do so. The proposed breakdown of how these additional funds would be allocated is:
1. Schools – 15 cents
2. Infrastructure – 7 cents
3. Partner Agencies (Quasi-governmental) – 3 cents
We recognize that it is our responsibility to provide residents with financial transparency and that we are accountable to them in preparing a sensible budget that ensures the services they rely upon are adequately funded. We know these budget priorities align with our community and respect the Commission’s strategic vision to build on Economic Vitality, Quality of Place, FutureReady Infrastructure, and Excellence in Government.
The $114.45 million general fund budget is prioritized based on the following:
4
City Manager’s Message to Commission
Core Services
A new Towne Acres Elementary School tops the list of capital needs in our community. The 50-year-old, pod-style campus is already over capacity with about 450 students. A new building would be more secure and able to serve 700 students in a highly desirable area of our community. At an estimated cost of $40 million, we recommend that 15 cents of the proposed tax increase be allocated to Schools.
Residents and service providers depend on safe and accessible infrastructure that is maintained and upgraded on schedule. We recommend $5.42 million for these efforts, which include street resurfacing, lane widening and sidewalks.
Another $1.46 million is budgeted for cash-funded projects including Municipal Building third floor design, post steel buildings for Fire Stations 8 and 9, Juvenile Court security glass, Freedom Hall emergency lighting, Carver Recreation Center bleachers, Metro-Kiwanis tennis court resurfacing, design plans for Christian Church Road and Knob Creek Overpass, and downtown cameras.
Other capital projects are covered through ARPA (Washington County water line extension) and other federal funding (Sinking Creek lift station upgrade) as well as bond proceeds (advance meter infrastructure, Boones Creek interceptor replacement I-26 to B Station, C Station wastewater lift station replacement, Knob Creek aeration rehabilitation, regional sewer capacity improvements, Knob Creek Road and CSX utility improvements, and Walnut Street corridor utility improvements).
We are committed to resource stewardship as well as providing employees with the tools and equipment needed for them to perform at the very best of their abilities. We have measures in place for employees to tell us when the equipment they use ages beyond its functionality. Cashfunded capital equipment requests total $4.15 million, most of which is for replacing equipment that has reached its lifespan. These capital funding requests are needed to support the services and projects that enhance livability for citizens.
Community Safety
Our commitment to you includes a safe community. Funding in this budget includes: assistance for our most vulnerable populations; accountability measures for citizens and emergency first responders; and tools to protect visitors and businesses in our downtown community. Investments in additional police training at $100,000, body worn cameras and police radios at $474,976, downtown cameras at $265,000, and $120,000 funded to the Johnson City Development Authority for John Sevier security will make Johnson City a safer place to live, visit and do business.
5
City Manager’s Message to Commission
Employee Recruitment/Retention
A first and significant step in employee retention and recruitment was our Compensation and Classification Study. After an exhaustive, internal evaluation, the team of eight employees who conducted this study recommends a general fund increase of $1.34 million in salaries and benefits and an increase of $514,235 in other funds for a total impact of $1.85 million.
To reaffirm the commitment to employee retention, we recommend a 3 percent pay plan adjustment as well as a merit increase that will range from 2-3 percent. We estimate these adjustments to cost $2.54 million city-wide.
Since 2010, the City has experienced a decline in employee recruitment, most notably in hiring police officers and firefighters. Employees have told us that this can be attributed to a change in retirement plans. By reenrolling in the Tennessee Consolidated Retirement System (TCRS), we look to reverse this decline. The TCRS hybrid plan is an increase of $436,935 in the general fund and $281,010 in other funds for a total impact of $717,945.
Partner Agency Investments

Community partnerships are an important function of our city, as these agencies provide essential services that are not offered directly by municipal government. We rely on these partners to help us serve our citizenry and improve livability. We recommend an additional $400,000 to fund salary increases for our Emergency Medical Services. Also, we endorse $250,000 for 911 Emergency Communications. Finally, we support a new partnership with the Child Advocacy Center with a recommended $50,000.
I thank you for your dedication to our organization, staff and city as a whole. I also want to thank the talented employees who worked diligently in crafting this budget. Their attention to detail and willingness to collaborate demonstrates a commitment to GO. ALL. OUT. to enrich quality of life in Johnson City.
With appreciation,
Cathy D. Ball City Manager
6
ORGANIZATIONAL CHART


7 Administration Economic Development Fire Legal Public Affairs/ Communications &
Police Budget Environmentalist Purchasing Risk Management Special Projects Fleet Management
Human Resources
Facilities Finance Information
Planning/
Marketing
Freedom Hall
Parks & Recreation (all divisions) Transit
Technology MTPO
Development Services Public Works Water and Sewer Services
Cathy D. Ball City Manager
Randy Trivette Assistant City Manager
Steve Willis Assistant City Manager
Joy Baker Int. Assistant City Manager
Director of Risk Management
LEADERSHIP TEAM


8
Aaron Ensor Director of Court Services
Brian Ross Facilities Director
Dustin Thompson Director of Budget and Performance Management
Eldonna Janutalo Transit Director
April Norris Director of Parks & Recreation
Keisha Shoun Director of Public Affairs
Sunny Sandos City Attorney
Stephanie Laos Finance Director
Melanie Rice Director of Human Resources
Mark Stone Civic Center General Manager
Tim Henley Director of Fleet Management
Tom Witherspoon Director of Water/Wastewater
Will Righter Director of Planning & Development Services
David Bell Fire Chief
Glenn Berry MPO Manager
David Eidson Director of Information Technology
Debbie Dillon Director of Purchasing
Alicia Summers Economic Development Director
Andy Best Int. Director of Public Works
Billy Church Police Chief
to enrich the quality of life in Johnson City.


9
STRATEGIC PLANNING
Vision
The City of Johnson City’s 2020-2025 Strategic Plan is goal-oriented and includes the City’s vision, mission, values, strategic goals and directions, as well as anticipated outcomes and results. This plan forms the foundation for all other long-range planning for the City, including the Budget and Capital Investment Plan other targeted plans for more specific goals. The Strategic Plan includes the following components: Johnson City is a highly desirable community where people and businesses thrive.
Mission
We Go. All. Out. to enrich the quality of life in Johnson City.
Organizational Values
Organizational values form the foundation for the City’s decision-making framework and relationships with our stakeholders – employees, residents, and clients. The City of Johnson City strives to be an organization recognized for its excellence in city governance and employee, resident, and client relations.
Our values:
Leadership – We are visionary, strategic, and bold in our decision making.
Stewardship – We are trustees of the resources provided to the City.
Integrity – We are consistent in word and deed, and we are a Commission of character.
Respect – We are accessible and are responsive to the needs of our community.
10
Strategic Goals
The City of Johnson City has identified four strategic goals to support its vision:

Strategic Planning
Strategic Planning Review Process
ECONOMIC VITALITY QUALITY OF PLACE
The Johnson City Board of Commissioners embarked on its strategic planning process in 2020. Commissioners along with city staff consulted numerous surveys, plans and other reports in addition to drawing on input from citizens, businesses and community partners to formulate the initial plan. In 2023, with new city management in place, the Board participated in a professionally led planning retreat that resulted in updated priorities to better reflect the current status of our community. The resulting plan is a combination of the initial research and existing issues facing Johnson City.
FUTURE READY INFRASTRUCTURE EXCELLENCE IN CITY GOVERNANCE
Monitoring Success and Performance
A strong governance model that is based on the principles of openness, fairness and accountability and that ensures informed decision-making throughout the organization and draws on the energies of citizen participation.
11
Strategic Planning
ECONOMIC VITALITY
What we hope to achieve:
• Create an environment that empowers businesses and individuals to pursue their fullest potential
• Recruit and retain businesses and workforce talent
• Cultivate a local entrepreneurial ecosystem and prepare a workforce for 21st Century jobs
• Encourage economic development, with an emphasis on underserved areas
• Ensure a resilient economy
How we plan to achieve it:
• Continue intentional and strategic planning of West Walnut Corridor redevelopment
• Strengthen focus on revitalizing and invigorating South Roan Street in Johnson City
• Secure highest and best use of Ashe Street Courthouse
• Identify developer for reuse of John Sevier hotel
• Identify opportunities where city government can improve support for local business and investment by reviewing local policies, procedures and ordinances
• Strategically promote the benefits of the region and business environment by working with regional partners including the Convention and Visitors Bureau, Chamber of Commerce, etc.
• Pursue all funding and investment resources made available by government and the private sector (opportunity zones, outside investment, etc.)
QUALITY OF PLACE
What we hope to achieve:
• Continue to support and grow “best in class” education systems for k-12, vocational, and higher education
• Protect our natural resources and enhancing outdoor amenities
• Prioritize a safe, vibrant, and family-friendly city;
• Advance a diverse mix of housing
• Make Johnson City the best place to live, work, and play
How we plan to achieve it:
• Develop citywide strategy to reduce drugs and crime
• In conjunction with public and private partners, develop collaborative strategy to address homelessness
• Create an affordable housing strategic plan to include financing options
• Increase downtown footprint and vibrancy, promoting the district as a destination
• Encourage mixed use development along with housing and retail options in traditionally underserved areas
• Engage citizens as we continue making our community safe for all
12
Strategic Planning
FUTURE READY INFRASTRUCTURE
What we hope to achieve:
• Provide safe, secure, sustainable, and technologically advanced water, sewer, waste disposal, and broadband systems
• Proactively complete transportation improvements in anticipation of continued growth
• Position the community to withstand natural disasters
• Maintain and update all City and school facilities and amenities
• Work with partners to ensure critical emergency services are provided to our community
EXCELLENCE IN CITY GOVERNANCE
What we hope to achieve:
• Create an environment that empowers employees to provide excellent and accessible services
• Recruit and develop well-qualified employees
• Stay at the forefront of innovative technology
• Balancing the provision of existing services and infrastructure with planning for future needs to maintain the City’s strong financial position
• Making informed decisions
How we plan to achieve it:
• Complete growth management plan
• Complete parking study
• Continue investment in the maintenance and upgrade of essential infrastructure including water, sewer, stormwater, sidewalks, streets, etc.
• Continue partnership with BrightRidge and other partners to invest in forward-thinking infrastructure
• Explore state and federal funding sources to help offset costs to local taxpayers
• Create citywide sustainability plan
How we plan to achieve it:
• Renovate Commission Chambers at Municipal and Safety Building
• Complete rebuild of senior leadership team
• Establish welcoming and well qualified city staff that resembles the demographic makeup of our community
• Maintain city’s strong financial position
• Encourage “out of the box” thinking and invest in employee training and education
13
CITY OVERVIEW
History
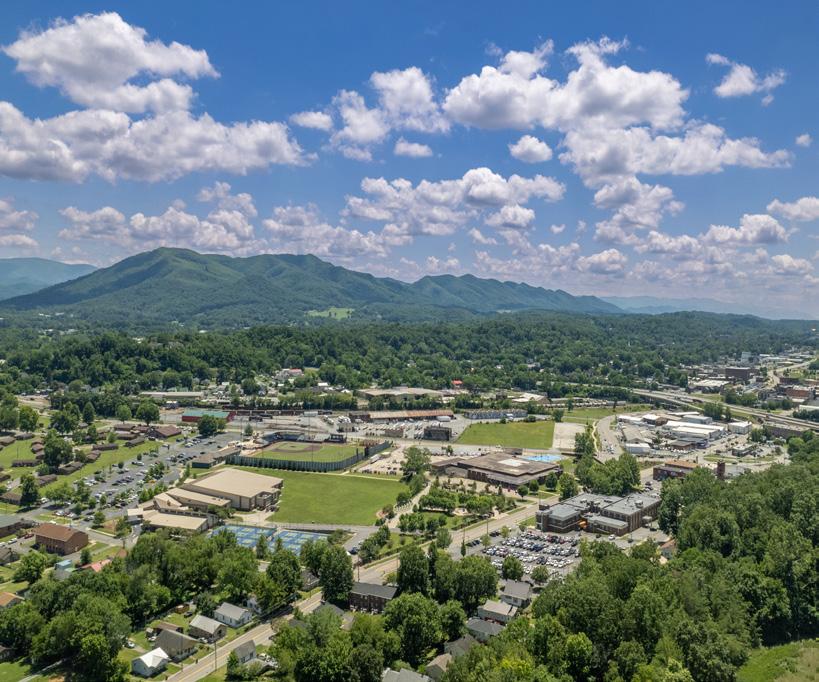
Johnson City, Tennessee is a small city in the northeastern region of the state, located mostly in Washington County, with parts in Carter and Sullivan counties. The city has a rich history dating back to the late 1700s when it was first settled by European immigrants. Known in those early days at Blue Plum or Johnson’s Depot, the farming community only had a population of around 500 people.
Henry Johnson anticipated the hustle and bustle a new mode of transportation – the railroad – would bring and set up shop directly in its path before a single rail car made its way through the area’s mountains. The town of Johnson City was officially incorporated in 1869 with Henry Johnson elected as its first mayor.

During the early 1900s, Johnson City became a hub for the railroad industry, with several major rail lines passing through the city. Henry Johnson was the first in a line of entrepreneurs who established a variety of businesses and industries that made the railroad central to everyday life in Johnson City.
Johnson City continued to grow and prosper, with the construction of the National Soldiers Home in 1903, a campus for America’s veterans, and the establishment of East Tennessee State Normal School in 1911, the predecessor to East Tennessee State University. Appalachian Hospital also opened during this time. These institutions helped to establish Johnson City as a center for education and healthcare in the region, and the city’s economy continued to thrive. As a
result, the population of Johnson City grew rapidly, reaching over 20,000 by the 1930s.
Throughout the latter half of the 20th century, Johnson City underwent significant changes, with the growth of the retail industry, the expansion of the healthcare sector, and the establishment of several new industries. Today, Johnson City is home to a diverse array of businesses, including manufacturing, healthcare, education, and technology companies.
One of Tennessee’s fastest-growing cities, the City of Johnson City has evolved into a vibrant regional center that strives to honor the physical and cultural characteristics that provide much of its small-town charm and character. The city is home to several historic landmarks and attractions, including the Tipton-Haynes State Historic Site, which was once the home of early settler John Tipton, and the Tweetsie Trail, a popular hiking and biking trail that follows the path of an old railroad.
Johnson City has a rich and diverse history that has helped to shape its identity as a vibrant and thriving community. As the city continues to grow and evolve, local leaders and policymakers are committed to continuing their investment in the city’s infrastructure and resources, ensuring that Johnson City remains a great place to live, work, and visit for years to come.
14
MEDI AN AGE
ETHNIC MAKE UP
HOUS EH OLD I NCOM E
Under $25, 00 0: 23. 9% $25, 000 - $49, 999: 1 9. 3% $50,000 - $74,99 9: 20. 5% $75, 000 - $99,999: 13. 5% $100 ,000 and above: 22 .8 %
Median
White 84 .6%
Black or African American
Hispanic or Latino (any race)
Asian Native American and Alaskan Native
Two or More Races
15
11% Gr owth over last 1 0 years
72,514 POPU LATION
*U.S . Ce nsus B urea u July 2022 Q ui ck fa ct s
35.6
24 8
$5 6,
*U.S . Ce nsus B urea u
7.1% 5. 5% 2. 6% 0. 2% 3. 8% City Overview
33,824 HOUSING UN ITS
Owner-Occupied: 66.1% Renter-O ccupied: 49.5%
33%
2023 marked Johnson City ’s fif th straight appearance on The Wall Street Journal/Realtor.com’s Emerging Housing Markets Index (5th position nation-wide as of winter 2023). The city has attrac ted families across the country with its af fordable quality housing.
RE NT PRICE BY %
32,053 UNEM PLOYME NT R ATE 3. 37%
16
Under $500: 14 .3 % $500 - $999: 53% $1 ,000 - $1 ,499: 23 .2 % $1 ,5 00 - $1 ,999 : 5% Over $2,00 0: 4.5 % *U.S . Ce nsus B urea u $
TOP 5 MO ST COM MO N OCCU PATION S ES TI MATE D WORK FORCE
WORK FORCE
*U.S . Ce nsus B urea u, A CS 5 -Yea r Esti ma te s Heal th C are an d So cial A ssistanc e Retail Trade 20.8 % 12 .4% 10.7 % 10.4% 9. 57% Educ ational Se rv ices Accommod ations & Food Se rv ice Manu fact urin g City Overview 67%
17 Glimcher Mall Johnson City Largest Property Tax Payers Taxable Assessed Value % of Total $22,627,200 1.1% 0.8% 0.7% 0.7% 0.6% 0.5% 0.5% 0.5% 0.4% 0.4% $17,070,340 $14,302,695 $14,032,634 $12,750,963 $11,301,440 $10,334,920 $9,811,320 $8,732,880 $8,200,000 Walmart/Sams Real Estate Mountain States Properties American Water Heater Co. Atmos Energy Corporation Knob Creek Apts. LLC Reserve Johnson City RAF Johnson City LLC (The Crossing) Bristol Highway Partners 1109 University/ETSU 815 LLC 6.1% $129,164,392 Top 10 Total City Overview City of Johnson City Per $100 of A.V. Annual Tax on $100,000 Residence Property Tax Rate One Cent Generates $495 $1.98 212,400 $537 $2.15 $450 $1.80 $450 $1.80 $2,123,998,767 Washington County City (Carter County) City (Sullivan County) Total Assessed Value Actual Taxable Value Assessed % to Actual Value $6,889,626,442 30.83%
City Overview
Sources: First Tennessee Development District, Business Journal, Tennessee Department of Labor & Workforce Development
18 East Tennessee State University Largest Employers (Washington County) Employees % of Total (County) 3,541 6.6% 5.6% 4.1% 3.2% 2.8% 2.2% 2.2% 2.0% 2.0% 1.8% 2,993 2,469 1,700 1,500 1,200 1,170 1,100 1,100 985 Ballad Health Corporation Veteran Health Administration CITI Commerce Solution Advanced Call Center Technologies Washington County Schools A.O. Smith Frontier Health Johnson City Schools City of Johnson City
BOARDS AND COMMITTEES
The City of Johnson City has established a variety of standing and advisory committees and boards intended to provide information, advice, and recommendations for consideration by the Johnson City Board of Commissioners on specific issues of civic concern. These boards and committees are typically made up of citizen representatives, Commission members, other elected officials and City staff. Appointments for the boards and committees take place semi-annually in January and July. Additional information, including agendas, meeting minutes and applications, can be found on the City’s website, https://johnsoncitytn.civicweb.net/Portal/MeetingTypeList.aspx.
ANIMAL CONTROL BOARD
5 members | 3-year terms | Meetings: 2nd Tuesday at 5:00 p.m.
Johnson City/Washington County Animal Shelter, 3411 N. Roan St.
Supervises and governs the policies and activities of the Washington County/Johnson City Animal Control Program and Center, which is responsible for the enforcement of regulations and codes pertaining to animals and prevention of cruelty to animals. City or County residency required.
BOARD OF BUILDING CODES
8 members | 3-year terms | Meetings: As needed on the 1st Tuesday at 4:00 p.m.
Municipal and Safety Building, 601 E. Main St.
Hears and decides appeals to code interpretation made by the chief building official and regulates Johnson City contractor certification. Positions include a professional registered engineer, electrical contractor, plumbing contractor, mechanical/gas contractor, residential building contractor, commercial building contractor, and registered architect. City residency required.
BOARD OF DWELLING STANDARDS AND REVIEW
5 members | 3-year terms | Meetings: Tuesday at 6:00 p.m. (except Nov. and Dec.)
Municipal and Safety Building, 601 E. Main St.
Determines action regarding substandard housing and/or commercial structures within the city limits. City residency required.
BOARD OF ZONING APPEALS
5 members | 3-year terms | Meetings: 1st Tuesday at 6:00 p.m.
Municipal and Safety Building, 601 E. Main St.
Hears and decides appeals to provisions of the zoning code, considers applications for special exceptions and decides questions of interpretation of the code. City residency required.
BRIGHTRIDGE BOARD OF DIRECTORS
10 members | 4-year terms | Meetings: 4th Tuesday at 4:15 p.m.
BrightRidge, 2600 Boones Creek Rd.
Serves as a liaison between BrightRidge’s customers and management. City residency required in order to apply for one of the five at-large positions representing Johnson City.
19
Boards and Committees
CIVIL SERVICE COMMISSION
6 members | 2-year terms | Meetings: As needed
Municipal and Safety Building, 601 E. Main St.
Addresses police and fire employees’ civil service matters and certifies entry level and promotional rosters. Consists of six standing positions, each held for a 2-year term. City residency required.
CONVENTION AND VISITORS BUREAU BOARD OF DIRECTORS
8 members | 3-year terms | Meetings: 3rd Wednesday at 12:00 p.m. Visit Johnson City, 302 Buffalo St.
The CVB showcases the uniqueness of and develops increased civic interest in Johnson City as an attraction to tourists, visitors and individuals; to solicit special events to take place in Johnson City; to promote the distinctive resources of Johnson City; and to increase the economic contribution of tourism in order to grow Johnson City and relieve the burdens of government. City residency or employment with City limits required.
EMERGENCY MEDICAL SERVICE BOARD OF DIRECTORS
10 members | 3-year terms | Meetings: 2nd Tuesday at 6:00 p.m. EMS, 296 Wesley St.
Manages Emergency Medical Services. Two members are appointed by the City Commission with one required to be a healthcare professional and the other a city resident.
GOLF ADVISORY BOARD
8 members | 3-year terms | Meetings: As needed
Memorial Park Community Center, 510 Bert St.
Recommends policies, procedures, rules, and regulations in operation of the golf course. City residency required.
HEALTH AND EDUCATIONAL FACILITIES BOARD
7 members | 2 to 6-year terms | Meetings: As needed
Municipal and Safety Building, 601 E. Main St.
Aids medical and educational facilities in obtaining tax-free loans as allowed by a combination of Federal and State of Tennessee Statutes. City residency required.
HISTORIC ZONING COMMISSION
7 members | 5-year terms | Meetings: 4th Tuesday at 5:30 p.m. (except Nov. and Dec.)
Municipal and Safety Building, 601 E. Main St.
Considers conservation zoning to ensure preservation of historical structures. City residency required.
20
Boards and Committees
HOUSING AND COMMUNITY DEVELOPMENT ADVISORY BOARD
12 members | 3-year terms | Meetings: 4th Thursday at 12:00 p.m. (Jan., April, July & Oct.)
Municipal and Safety Building, 601 E. Main St.
Advises and makes recommendations concerning housing, community, and economic development issues. City residency required.
INDUSTRIAL DEVELOPMENT BOARD
10 members | 6-year terms | Meetings: 3rd Wednesday at 10:00 a.m. (Jan., April, July & Oct.)
Municipal and Safety Building, 601 E. Main St.
A means of financing business/industrial facilities that create employment and economic growth. City residency required.
JOHNSON CITY DEVELOPMENT AUTHORITY
11 members | 3-year terms | Meetings: 4th Friday at 8:00 a.m. Memorial Park Community Center, 510 Bert St.
Promotes and assists with the development and redevelopment of Johnson City, with specific emphasis on the downtown district and support for the local business community. Consists of 11 standing positions, each held for a 3-year term. No residency requirement.
JOHNSON CITY HOUSING AUTHORITY
5 members | 5-year terms | Meetings: 4th Wednesday at 12:00 p.m. Johnson City Housing Authority, 901 Pardee St.
Establishes policy and procedures governing the operation of the housing authority. City residency required.
JOHNSON CITY PUBLIC LIBRARY BOARD
9 members | 3-year terms | Meetings: 3rd Tuesday at 4:30 p.m. Johnson City Public Library, 100 W. Millard St.
Governing body and controlling fiscal authority for the public library. City residency required.
JOHNSON CITY REGIONAL PLANNING COMMISSION
10 members | 3-year terms | Meetings: 2nd Tuesday of the month at 6:00 p.m.
Municipal and Safety Building, 601 E. Main St.
The Planning Commission reviews all rezoning, annexations, and right-of-way abandonments, makes recommendations for approval or denial to the Board of Commissioners, and makes recommendations on land use policy issues through the subdivision regulations, zoning ordinance, and the comprehensive plan. City residency required for nine positions. The remaining position requires residency inside the Regional Planning Jurisdiction but outside the City Limits of Johnson City.
21
Boards and Committees
PARKS AND RECREATION ADVISORY BOARD
10 members | 3-year terms | Meetings: 4th Tuesday at 4:00 p.m. (except June, July, Aug., Nov. & Dec.)
Parks & Recreation Administrative Office, 4137 Bristol Highway
Makes recommendations regarding recreation services and facilities. City residency required.
PUBLIC ART COMMITTEE
15 members | 3-year terms | Meetings: 2nd Wednesday at 5:00 p.m.
Municipal and Safety Building, 601 E. Main St.
Considers matters concerning public art, monuments, murals, or other creative efforts of individuals or groups. No residency requirement.
SENIOR SERVICES ADVISORY COUNCIL
15 members | 3-year terms | Meetings: 3rd Tuesday at 4:00 p.m. (except July, Aug. & Dec.)
Memorial Park Community Center, 510 Bert St.
Makes recommendations on matters affecting planning, support, and programming for the senior center. City residency required.
SENIOR CENTER FOUNDATION BOARD
18 members | 3-year terms | Meetings: 1st Thursday at 5:00 p.m.
Memorial Park Community Center, 510 Bert St.
Responsible for supporting and participating in special events, and assisting in fundraising efforts to benefit senior center operations, services, and/or capital improvements. Residency in Washington, Sullivan, Unicoi or Carter County required.
TRI-CITIES AIRPORT AUTHORITY BOARD
12 members | 3-year terms | Meetings: 4th Tuesday at 10:00 a.m. (Feb., April, June, Aug., Oct. & Dec.)
Tri-Cities Airport, 2525 TN-75, Blountville, TN
Manages and controls the business of the Tri-Cities Regional Airport. Three of the 12 members represent the City of Johnson City. No residency requirement.
WASHINGTON COUNTY BOARD OF EQUALIZATION
6 members | 2-year terms | Meetings: June
Washington County Courthouse, 100 E. Main St., Jonesborough, TN
Reviews the tax assessment rolls, hears complaints and appeals of taxpayers within their jurisdiction. City residency and Washington County residency required.
22
BUDGET OVERVIEW
Budget Message
The budget for Fiscal Year 2024 has been developed in accordance with City Ordinances, State and Federal laws, and the policies and procedures of the City. It has been prepared with the goal of maintaining a high level of service to our community, with as realistic as possible budget requests for expenditures, and with a reasonable level of conservative estimates on revenue.
The Fiscal Year 2024 budget is a balanced budget. Total expenditures for all funds are $334,785,942, which includes the City School budgets.
General Fund
Revenue
Total General Fund revenue is budgeted at $114,451,393, an increase of 12.5%, $12,733,344, on a budget-tobudget basis. When measured against projected revenues for the prior year, FY 2024 revenues are projected to increase by $7,649,724 or 7.2%.
For fiscal year 2024, real and personal property taxes are budgeted to increase by 16.1 percent or $5,892,740 on a budget-to-budget basis. This is due to better the 25 cent property tax increase in FY 24. Overall, property tax collections account for approximately 37% of General Fund revenue.
Local option sales tax, the second largest General Fund revenue source at 29%, is budgeted to increase $5,150,000, or 18.3% on a budget-to-budget basis. This is due to better than expected economic conditions post-pandemic. Collections for FY 2023 are projected at $31.8 million, which is $3,600,000 more than budget and $2,668,481 more than actual
collections from FY 2022. For FY 2024, local option sales tax revenue is budgeted to increase by 4.9% over projected FY 2023 estimates due to steady growth within the city.
Hotel/motel tax collections are budgeted at $3,100,000, an increase of $1,000,000 (47.6%) budget to budget. Projected collections for FY 23 are at $3,100,000 as well, which leave the projected to budget net neutral.
Cable TV Franchise Fee is budgeted to remain the same at $750,000.
23
Actual Budget Projected Budget Budget % FY 2022 FY 2023 FY 2023 FY 2024 24 vs. 23 Change REVENUES Real & Personal Property Taxes 36,673,563 36,700,000 37,268,500 42,592,740 5,892,740 16.1 Local Option Sales Tax 29,081,519 28,150,000 31,750,000 33,300,000 5,150,000 18.3 Other Local Taxes 17,887,802 16,276,000 17,501,000 17,082,000 806,000 5.0 Licenses and Permits 1,102,607 1,071,500 1,207,000 1,238,000 166,500 15.5 Intergovernmental Revenues 13,804,790 13,080,680 12,857,680 13,555,680 475,000 3.6 Charges for Services 3,927,114 4,109,169 4,231,769 4,502,923 393,754 9.6 Fines and Forfeitures 793,102 1,250,000 900,000 1,000,000 (250,000) (20.0) Other Revenues 2,220,643 1,080,700 1,085,720 1,180,050 99,350 9.2 Total Revenues 105,491,140 101,718,049 106,801,669 114,451,393 12,733,344 12.5
Budget Overview
Licenses and permits, which reflect building activity, are budgeted at $1,238,000, an increase of 15.5% or $166,500. This mirrors the steady growth the city has been experiencing.
Intergovernmental revenues, which account for approximately 12% of General Fund revenue, are
budgeted at $13,155,680, an increase of 3.6%, or $475,000, budget to budget. Revenue from the state for the Prison has ceased due to its closure. The City of Johnson City has also entered into an inter-local governmental agreement with Washington County, and will start to see a yearly revenue of $500,000 starting in January 2024.
FY 2024 General Fund Revenue
Property Tax
Local Option Sales Tax
Other Local Taxes Intergovernmental
Charges for Service are budgeted at $4,502,923, an increase of $393,754 or 9.6%. This is mostly due to an increase in administrative fees and computer services to the enterprise funds and projected increases in Pine Oaks Golf Course revenue.
Expenditures & Transfers
There is not a budgeted fund balance drawdown in FY 2024. This leaves a projected fund balance of $51,683,507 at the end of FY 2023, including the Economic Development Reserve. The 20% fund balance reserve target established by the City Commission is $19,051,384.
The General Fund budget totals $114,451,393, an increase of $8,962,254 (8.5%) over the fiscal year 2023 budget. The General Fund budget includes $84,628,218 for personnel and operating expenditures, and $29,823,175 for operating transfers to support other funds.
24
Other
37.2% 29.1% 14.9% 11.8% 6.9%
Actual Budget Budget Budget % FY 2022 FY 2023 FY 2024 24 vs. 23 Change Personnel 43,952,371 48,894,438 52,650,678 3,756,240 7.7 Operating 18,095,260 21,791,416 24,540,787 2,749,371 12.6 Other* 5,974,460 6,690,486 7,436,753 746,267 11.2 Total Operating Expenditures 68,022,091 77,376,340 84,628,218 7,251,878 9.4 * Library and Quasi-Govt'l General Fund Expenditures by Category
Total operating expenditures increased by 9.4% or $7,251,878. Personnel, which accounts for 62% of operating costs, is budgeted at $52,650,678, an increase of $3,756,240 or 7.7%. The FY 2024 budget includes a 3% pay plan adjustment, and a 2% merit
adjustment. It also includes the implementation of the compensation and classification study that went into effect late FY 2023, which was not included in the original FY 2023 budget. In addition, several new and upgraded positions are included.
FY 2024 General Fund
Departmental and other operating expenditures (excluding personnel costs) total $31,977,540, which is an increase of $3,495,638 or 10.9%. The majority of the increase is due to $0.07 of the property tax increase being assigned to roadway improvements, which amount to an additional $1,491,000.
Major transfers from the General Fund include $5,419,267 for capital equipment, facilities, and infrastructure; $11,220,224 for debt service; and $11,626,736 for Johnson City Schools. The City
transfer to assist with funding for the operation of the Johnson City Schools remained the same from FY 23. In the past ten years the City’s appropriation to the Schools has increased five times: FY 2014 – $375,000, FY 2015 - $500,000, FY 2016 - $963,061, FY 2019$500,000, and FY 2022 - $750,000.
Total Operating Transfers increased $1,710,376 or 6.1%. The increase is mostly attributable to increased transfers to the capital funds.
FY 2024 General Fund
25
Operating Other
Budget Overview Personnel
Expenditures by
62% 29% 9%
Debt Service Capital Funds Other
Category
Johnson City Schools
Transfers 39% 38% 18% 5%
Budget Overview
Funding for the Johnson City Public Library is budgeted at $2,210,275 in total, which is an increase of $61,324 or 2.9%. This covers increases in operating costs and revenue reductions. Total funding for the Imagination Library is $39,700. The Imagination Library also receives funding from Washington County. Quasi-Governmental funding is budgeted at
Staffing / Salaries and Benefits
$5,195,778, an increase of $654,243 or 14.4%. $0.03 of the property tax increase will go to 911 and EMS for salaries and recruitment, which is amounted to an additional $654,000. A detailed breakdown of quasigovernmental funding can be found on page 91 of this document.
A total of 997.1 full-time and part-time (FTE) positions are budgeted. The staffing changes for FY 2024, and mid-year adjustments for FY 2023 are as follows:
GENERAL FUND
• Administration: one new Economic Development Analyst
• Administration: one new Staff Attorney
• Communications & Marketing: one new Public Information Officer
• Communications & Marketing: one new Special Events Coordinator
• Development Services: upgrade one Code Enforcement Officer to Supervisor
• Facilities: one new Custodian
• Fire: three FY 23 over hired Firefighters to full-time positions
• Human Resources: one new Human Resources Generalist
• Human Resources: one new Assistant Director of Human Resources
• Parks & Recreation: two new Public Service Workers
• Parks & Recreation: one new Recreation Generalist
• Parks & Recreation: combine two part-time Custodian to one full-time
• Parks & Recreation: combine two temporary Public Service Worker to one full-time
• Police: one new Digital Forensic Officer
• Police: one new Homeless Outreach Coordinator
• Police: elimination of the Detention division: one Jail Superintendent, twelve full-time Correctional Officers, four part-time Correctional Officers, and one Lead Custodian
• Purchasing: upgrade one part-time Administrative Specialist I to full-time
• Public Works: one new Custodian
• Public Works: one new Landscape Technician
• Public Works: upgrade two MEO II to Crew Supervisor
• Risk Management: one new Assistant Director of Risk Management
• Risk Management: upgrade one Risk Management Specialist to Claims Manager
OTHER FUNDS
• Mass Transit: elimination of three vacant positions, one Maintenance Coordinator and two Clerical Specialist II
• Solid Waste – Municipal: upgrade one Crew Supervisor to General Supervisor
• Solid Waste – Regional: upgrade one Crew Supervisor to General Supervisor
• Water/Sewer: two new Custodian
• Water/Sewer: one new Lead Custodian
• Water/Sewer: one new Inventory Specialist
• Water/Sewer: two new Water/Wastewater Service Workers
26
Enterprise Funds
WATER / SEWER FUND
Total revenues are budgeted at $41,904,300, an increase of $1,699,100 or 4.2% from the prior fiscal year budget.
The Water and Sewer Fund expenses total $39,586,846, an increase of $2,046,177 or 5.5% compared to FY 2023 budget. The increase in expenditures is mostly attributed to pay plan adjustment and an increase in depreciation. Total staffing increased by six positions over the prior fiscal year, bringing the total to 188.4 full-time equivalent.
Expenses for capital equipment replacement total $1,067,000, a decrease of $209,000 from the FY 2023 budget.
Budgeted water capital projects total $9,400,000. These include $6,000,000 in improvements funded with debt, $1,200,000 in rate funded (cash) improvements, and $2,200,000 in American Recuse Plan Act (ARPA) funds. Major projects include the advance meter infrastructure ($6,000,000), the Washington County water line extension ($2,200,000), and the small diameter water line replacement ($1,200,000).
Budgeted sewer capital projects total $12,225,000. These include $10,100,000 in improvements funded with debt, $1,125,000 in rate funded (cash) improvements, and $1,000,000 in grant funds. Major projects include the regional sewer capacity improvements – phase III ($4,000,000), Knob Creek aeration rehabilitation ($2,800,000), and the Boones Creek interceptor replacement I-26 to B Station ($2,050,000).
Budgeted combined water and sewer capital projects total $4,181,000 and include $3,100,000 in improvements funded with debt and $1,081,000 in rate funded (cash) improvements. Major projects include Walnut Street corridor utility improvements ($1,600,000), Knob Creek Road &CSX utility improvements ($1,600,000), and local road projects/annexations ($500,000).
SOLID WASTE FUNDS
Solid Waste expenses total $17,854,205, which includes $14,070,517 for the Municipal Solid Waste Fund and $3,783,688 for the Regional Solid Waste Fund.
The Municipal fund is budgeted to increase by $1,577,426 or 12.6% due to operational and personnel increases.
The Regional fund is budgeted to increase by $562,788 or 17.5%, once again to due operational and personnel increases.
Capital equipment is budgeted at $897,900 for Municipal equipment, including two front-load trucks and one pickup truck.
Capital equipment is budgeted at $220,100 for Regional equipment. This is for a rear-load truck.
Revenues for Municipal Solid Waste are projected at $13,591,860, a net increase of $13,591,860 from the prior year. The majority of the increase is due to increased industrial revenue.
27
Budget
Overview
Budget Overview
In the regional system, revenues are projected at $4,095,200, an increase of $166,900 from the prior year. This is due to continued increase in regional residential customers.
MASS TRANSIT FUND
The Mass Transit Fund expenses total $5,575,689, which is an increase of $282,689 (5.3%) from the prior year. This is the fourteenth year of operation for the New Freedom program, which is funded by a Federal Transportation Agency grant. This program allowed the City to establish two new routes that serve the Med Tech corridor and Boones Creek, and it has expanded ADA accessibility for job opportunities and to medical facilities. Federal and state grants account for approximately 80% of the fund’s total revenue. The transfer from the General Fund to support transit operations is budgeted at $1,079,348. This is required to meet federal and state grant matching requirements. Mass Transit capital is budgeted at $204,000.
STORM WATER FUND
The Storm Water Fund expenses total $2,435,141, which is a decrease of $1,060 from the FY 2023 budget. The City Commission approved a rate adjustment of $1.00 in December 2019. This will allow the storm water fund to support the debt service for the West Walnut Street project, as well as provide the cash flow needed to repair and replace bridges in a timely manner.
Capital equipment is budgeted at $250,000 for a tandem axle dump truck. A total of $1,650,000 is budgeted for capital projects, all cash funded. The major project will be the West Oakland Avenue Bridge ($750,000).
The fund is projected to end FY 2024 with approximately $1,399,977 in cash and cash equivalents.
Capital Equipment/Projects & Debt Funds
The capital equipment fund is budgeted at $4,154,267, including a $3,564,267 transfer from the General Fund and $590,000 capital funds re-budget for school buses.
Capital facilities are budgeted at $10,505,440, including $8,500,000 in ARPA funding towards various fire station and training facility improvements.
Capital infrastructure projects are budgeted at $22,115,000, including $15,000,000 (debt funded) for the continuation of the West Walnut Street project. Other debt funded projects include Oakland/Mountainview Road improvements ($2,500,000) and the Grey Station/SR 75 intersection ($1,400,000).
School facility capital projects are budgeted at $2,000,000, which is for the first year of design and construction of a new Towne Acres Elementary School.
The Debt Service Fund is budgeted at $12,260,434, which represents an increase of $529,121 or 4.5% from the prior year. This increase is due to the addition of $40,000,000 in new debt for the Towne Acres Elementary School project. The Debt Service Fund includes the debt service for the City and School System. The City’s debt service is budgeted at $9,637,429. The School System’s debt service is budgeted at $2,623,005.
28
Budget Overview
Other Funds
FREEDOM HALL FUND
The Freedom Hall Fund expenses total $1,875,558, which is an increase of $22,305 or 1.2% from the prior year. The General Fund transfer to support Freedom Hall is budgeted at $417,100, which is $57,100 more than FY 2023.
POLICE DRUG, GRANTS, AND TECHNOLOGY FUNDS
The Police Drug, Grants, and Technology Funds are budgeted at $229,000, $159,500, and $188,074, respectively. The Drug Fund includes $129,000 for three unmarked sedans and a new data analytic system. The Grant Fund includes funds for two secretary positions at the Family Justice Center.
MTPO - TRANSPORTATION PLANNING FUND
The MTPO – Transportation Planning Fund is budgeted at $386,688. MTPO is responsible for regional transportation planning and coordination.
29
POLICIES AND PROCEDURES
General Information
GOVERNMENT
Johnson City adopted the council-manager form of government in 1939, and adopted home-rule in 1955. This form combines the benefits of elected legislative representation with a professionally managed government. Citizens elect, at large, five city commissioners who serve four-year terms. The Board of Commissioners hires a professional city manager to manage and direct the day-to-day operation of the City government, administer the budget, and employ all City employees with the exception of the Juvenile Court Judge, Juvenile Court Clerk, Municipal Court Judge, and City Attorney. The Juvenile Court Judge and Juvenile Court Clerk are elected by the municipal voters. The Municipal Court Judge and City Attorney are appointed by the City Commission.
The City Manager is the chief executive officer for the city. It is the responsibility of the City Manager to enforce the laws and ordinances of the city and attend all meetings of the governing body with the right to take part in the discussion. Having no vote, the City Manager can make a recommendation of measures to the governing body.
The City provides a wide range of services similar to other jurisdictions in the State, including public safety (both Police and Fire), municipal and regional solid waste services, municipal and regional water and sewer services, parks and recreation, a civic center, seniors’ center, one golf course, a mass transit system, public works, a school system, and economic development.
BUDGETARY AND FINANCIAL REPORTING
The City of Johnson City is implementing the recommended practices by the National Advisory Council on State and Local Budgeting (NACSLB). City staff has applied diligent effort into improving the process, decisions, and outcomes with each new budget year.
The budget process is not simply an exercise in balancing revenues and expenditures one year at a time, but is strategic in nature, encompassing a multi-year financial and operational plan that allocates resources on the basis of identified goals and objectives.
The budgetary, accounting, and reporting standards adopted by the City of Johnson City conform to generally accepted accounting principles applicable to government units. The accounts of the City are organized on the basis of funds and account groups, each of which is considered to be a separate entity. The operations of each fund are accounted for with a separate set of self-balancing accounts, recording cash and other financial resources, together with all related liabilities and residual equities or balances, and changes therein, which are segregated for the purposes of carrying on specific activities or obtaining certain objectives in accordance with special regulations, restrictions, or limitations.
The funds included in this budget are as follows:
30
Policies and Procedures
GOVERNMENTAL FUNDS
General Fund
The General fund is the general operating fund of the City. It is used to account for most of the basic government services, such as police, fire, parks and recreation, street maintenance, administration, and planning. General Fund revenues include property taxes, local option sales tax, business license fees, court fines and fees, and state and federal grants. The largest expense within the General Fund is personal services, which includes the cost of employee salaries and benefits.
Capital Projects and Capital Equipment Funds
The Capital Projects and Capital Equipment funds account for capital purchases and improvements, such as land acquisition, fleet equipment replacement, construction of facilities, etc. Most of the items recorded in either of these funds are financed through borrowings or transfers from the General Fund.
Debt Service Fund
Included in a Debt Service Fund are general long-term principal and interest payments on bonds issued, as well as revenue sources to meet the payment obligation on the debt.
Special Revenue Fund
A Special Revenue Fund generates specific revenue sources. Expenses are legally restricted to specified purposes and are directly related to the revenue source. Freedom Hall Civic Center, Transportation Planning, and the Community Development Block Grant Fund are Special Revenue Funds for the city.
PROPRIETARY FUNDS
Enterprise Fund
An Enterprise Fund is intended to be self-supporting in that expenditures are offset by revenues in the form of fees and charges to the external customers for goods and services. Enterprise Funds included in this budget are the Water and Sewer Fund, Solid Waste Funds (Municipal and Regional), Mass Transit Fund, and Stormwater Fund.
31
Policies and Procedures
BASIS FOR BUDGETING
The budgets for all Governmental Funds are prepared on a modified accrual basis. This means that the obligations of the City are budgeted as expenses, but revenues are recognized only when they are actually received.
The Enterprise Funds are budgeted on a full accrual basis. Expenditures are recognized when a commitment is made, and revenues are recognized when they are obligated to the City. Debt interest payments are budgeted as an expense for Enterprise Funds. Not included in the budget are debt principal payments, which are reflected as a reduction in the liability only when payment is made, and capital equipment and improvements, which are funded through the Capital Equipment and Projects Funds or as an operating transfer from the General Fund.
BUDGET AND BUDGETARY CONTROLS
The City’s financial plans are set forth in annual capital and operating budgets which reflect the projection of all receipts from and disbursements to all sources. The Board of Commissioners has the final responsibility for establishing program and fiscal policies, approving the annual operating budget and Capital Improvement Program, amending the annual budget, and setting the property tax rate and fees for services.
Budgetary control is maintained in the individual funds at the department level in order to ensure compliance with legal spending appropriations as approved in the annual operating budget. Activities of the general fund, special revenue funds, enterprise funds, and capital projects and equipment funds are included in the annual appropriated budget.
BASIS OF ACCOUNTING
The modified accrual basis of accounting is used for all governmental funds. The revenues are recognized when they become measurable and available. Those revenues susceptible to accrual are property taxes, special assessments, interest income, and charges for services. Property taxes are levied and due in this fiscal year and also collected within 60 days after year end. Amounts not collected within those 60 days are recorded as deferred revenue. Expenditures are recorded when the related fund liability has been incurred. All proprietary funds use the accrual basis of accounting, where revenues are recognized as soon as they are earned and expenses are realized as soon as a liability is incurred. Proprietary funds also display the assets and liabilities associated with the fund on the balance sheet. In governmental funds, fund balance is segregated into reserved, designated, and undesignated components. Enterprise funds reflect a change in total net assets corresponding to the outcome of revenues and expenditures.
Financial Management Policies
GENERAL FINANCIAL PHILOSOPHY
The financial policy of the City of Johnson City is to provide a sufficient financial base and the resources necessary to sustain a high level of municipal services for the citizens of Johnson City.
32
Policies and Procedures
It is the goal of the City to achieve a strong financial condition with the ability to:
• Withstand local and regional economic impacts;
• Adjust efficiently to the community’s changing service requirements;
• Effectively maintain and improve the City’s infrastructure;
• Prudently plan, coordinate, and implement responsible community development and growth;
• Provide a high level of police, fire, and other protective services to assure public health and safety; and,
• Provide other services necessary to ensure quality of life for the community.
The City of Johnson City’s financial policies shall address the following fiscal goals:
• Keep the City in a fiscally sound position in both the long and short term;
• Maintain sufficient financial liquidity to meet normal operating and contingent obligations;
• Expect that service users pay their fair share of program costs;
• Operate utilities in a responsive and fiscally sound manner;
• Maintain existing infrastructure and capital assets;
• Provide a framework for the prudent use of debt; and,
• Direct the City’s financial resources toward meeting the goals of the City’s strategic plan.
OPERATING BUDGET POLICIES
The annual budget is the central financial planning document that embodies all operating revenue and expenditure decisions. It establishes the level of services to be provided by each department within the confines of anticipated municipal services.
The City Manager shall incorporate the Board of Commissioner’s priorities in the formulation of the preliminary and final budget proposal.
Adequate maintenance and replacement of the City’s capital plant and equipment will be provided for in the annual budget.
The budget shall balance recurring operating expenses with recurring operating revenues.
The City shall adopt a balanced budget annually.
CAPITAL IMPROVEMENT POLICIES
The City will establish and implement a comprehensive five-year Capital Improvement Plan (CIP). This plan will be updated annually.
An annual Capital Improvement Budget will be developed and adopted by the Board of Commissioners as part of the annual budget. The City will make all capital improvements, in accordance with the CIP, for which there is available funding.
Unexpended capital project budgets shall be carried forward to future fiscal years to complete the intent of the original budget.
33
Policies and Procedures
Routine capital needs will be financed from current revenues as opposed to the issuance of long-term debt.
The City will maintain all assets at a level adequate to protect the City’s capital investment and to minimize future maintenance and replacement costs.
REVENUE POLICIES
The City will estimate annual revenues by a conservative, objective, and analytical process.
The City will consider market rates and charges levies by other public and private organizations for similar services in establishing tax rates, fees and charges.
The City will periodically review the cost of activities-supported user fees to determine the impact of inflation and other cost increases. Fees will be adjusted where appropriate to reflect these increases.
The City will set fees and user charges, for the utility funds, at a level that fully supports the total direct and indirect costs of operations, capital requirements, and ensures that adequate reserves are maintained.
The City will continue to identify and pursue grants and appropriations from Federal, State, and other agencies that are consistent with the City’s goals and strategic plan.
The City will follow an aggressive policy of collecting revenues.
INVESTMENT POLICIES
Investments of the City shall be undertaken in a manner that seeks to ensure the preservation of capital in the overall portfolio. The portfolio shall remain sufficiently liquid to enable the City to meet daily cash flow demands and conform to all state and local requirements governing the investment of public funds.
The City will continue the current cash management and investment practices, which are designed to emphasize safety of capital first, sufficient liquidity to meet obligations second, and the highest possible yield, third.
Investments will be made in accordance with the policies set by Tennessee Code Annotated 6-56-106. Authorized investments include, but are not limited to, the following:
• Bonds, notes or treasury bills of the United States Government;
• Bonds, debentures, notes or other evidences of indebtedness issued or guaranteed by United States agencies;
• Certificates of deposit and other evidences of deposit at state and federally chartered banks, savings and loan associations; and,
• The local government investment pool created by title 9, chapter 4, part 7.
The City shall attempt to match its investment with anticipated cash flow requirements. Unless matches to a specific cash flow requirement, the City will not directly invest in securities maturing more than two (2) years from the date of issue. Investments maturing more than two years from date of issue require approval
34
Policies and Procedures
by the state director of local finance.
The City’s financial information system will provide adequate information concerning cash position and investment performance.
DEBT MANAGEMENT POLICIES
The City of Johnson is subject to debt limitations imposed by the City Charter. The total bonded indebtedness of the City shall not exceed 10 percent of the assessed valuation, for the preceding year, of the taxable property of the City. In determining the debt applicable to the legal debt limit, the following types of debt are excluded:
• Bonds payable out of funds derived from special assessments for public improvements;
• Bones primarily secured from revenue of other sources with the secondary backing of general tax revenues; and,
• Tax anticipation bonds and notes.
The City shall issue debt only when necessary to meet a public need and when funding for such projects is not available from current revenues, reserves, or other sources.
Long-term borrowing will be used to finance capital improvements as approved in the City’s Capital Improvement Plan.
Capital projects financed through issuance of debt shall be financed for a period not to exceed the expected useful life of the project.
The City will not incur debt to finance current operations.
The total debt service on tax supported debt of the City shall not exceed 20 percent of total General Fund operating expenditures. It shall be the long-term goal of the City to reduce this percentage to the ideal level of 10 percent.
Lease-purchase obligations, capital outlay notes or other debt instruments may be used as a medium-term method of borrowing for the financing of vehicles, computers, other specialized types of equipment, or other capital improvements.
The City will maintain good communication with bond rating agencies in order to optimize its bond rating status.
UTILITY FUND POLICIES
Enterprise funds will be established for City-operated utility services.
Enterprise fund expenditures will be established at a level sufficient to properly maintain the Fund’s infrastructure and provide for necessary capital development.
35
Policies and Procedures
Each utility fund will maintain an adequate rate structure to cover the costs of all operations, including maintenance, depreciation, capital and debt service requirements, reserves, and any other costs deemed necessary. Ideally, reserves should approximate three (3) months of operating costs.
Utility rate studies will be conducted periodically to update assumptions and make necessary adjustments to reflect inflation, construction needs, maintain bond covenants, and avoid significant periodic rate increases.
Adequate reserve levels are a necessary component of the City’s overall financial management strategy and a key factor in external agencies’ measurement of the City’s financial strength. Reserve funds provide the City with the resources to manage cash flow and deal with unanticipated emergencies and changes in economic conditions. In addition, reserve funds enable the City to take advantage of matching funds and other beneficial (but limited) opportunities.
The City shall place emphasis on increasing unrestricted fund balance in the General Fund to an amount equal to approximately 20 percent of the General Fund operating budget expenditures. This represents approximately two and one half months of operating expenditures.
At the close of each budget year, any excess of revenues over expenditures that will increase the cumulative unrestricted fund balance above the established target amount will be recorded as a restricted reserve account available for appropriation by the Board of Commissioners, for one-time capital expenditures.
Reversion of Bond Proceeds: Bond proceeds remaining (unspent) after the purpose for which the bonds were issued has been completed shall be returned to the respective bond funds for future appropriation. The balance of available bond proceeds will be reported to the Board of Commissioners on a monthly basis. Further use of these monies shall be consistent with provisions contained within the appropriate bond resolutions and inconformity with federal and state regulations.
Budget Procedure
PURPOSE AND SCOPE OF THE BUDGET
The budget is the City’s financial plan, covering a twelve month period that balances projected revenues with anticipated expenditures, related to City services. Upon adoption by the Board of Commissioners, the City of Johnson City’s budget becomes a major policy document of this community for the ensuing fiscal year.
Essentially, the City of Johnson City’s budget strives to achieve the following objectives:
1. Establish a legal basis for the expenditure of city tax dollars;
2. Establish a means of public accountability and control of expenditures;
3. Provide a method for continuous review of city programs through established goals and departmental services;
4. Provide an operating plan of service for city departments;
5. Provide a basis for establishing policies, adopted by the Board of Commissioners, through
36
RESERVE FUND POLICIES
Policies and Procedures
recommendation by the City Manager;
6. Establish more effective communication between the citizens of Johnson City and City Officials.
ANNUAL BUDGET PROCESS OF THE CITY OF JOHNSON CITY
The City’s annual budget process typically begins in September with the preparation of the five-year Capital Improvement Plan (CIP). In January, a budget kick-off meeting is held with department and division directors to distribute budget instructions and to highlight concerns, challenges, and goals that face the City in the upcoming fiscal year. Following this informational meeting, department/division heads prepare their budget requests over the next thirty day period.
From there, the budget calendar is followed through the remainder of the budget process:
• Revenue estimates are prepared for the next fiscal year for all City funds.
• Departmental budgets are reviewed and analyzed and budget hearings are conducted with each department. Following these meetings, a tentative budget is prepared in consideration of the projected revenues and policy guidelines established by the City Manager.
• Budget work sessions are conducted with the Board of Commissioners, City Manager, and staff.
• At the conclusion of these work sessions, the Board of Commissioners’ input is incorporated into the proposed budget. An appropriation ordinance is prepared and is required by the City Charter to be published for public review no later than ten days prior to the first reading of the ordinance.
• By City Charter, the first reading of the budget ordinance and public hearing is required to occur at a regularly scheduled meeting of the Board of Commissioners, followed by two additional readings of the ordinance.
• The adopted budget takes effect July 1, the beginning of the new fiscal year.
BUDGET AMENDMENTS
Amendments which revise the total expenditure of any appropriated fund or department may occur at any time during the fiscal year after advertising and a public hearing before the Board of Commissioners. Three readings of the ordinance amending the budget are required.
37
September 24, 2022
CIP forms distrubted to Department/Division Heads
BUDGET CALENDAR
October 18, 2022
CIP forms due to Budget Office
Nov. 10 - Dec. 1, 2022
CIP work sessions with City Manager, Assistant City Manager, Budget Director, and Analyst
January 31, 2023
Small Department Budgets due to the Budget Office
January 19, 2023
CIP presented to City Commisssioners
January 17, 2023
Budget Kick-Off
Feb. 1 - Feb. 24, 2023
Budget hearings/reviews with the City Manager, Assistant City Mangers, Budget Director, and Analyst
February 7, 2023
Large Department Budgets due to the Budget Office
Feb. 27 - April 25, 2023
Budget analysis and finalize budget
May 2, 2023
Commission receive City Manger’s budget proposal
April 29, 2023
Publish initial advertisment in the Johnson City Press
April 13 - June 1, 2023
Budget work sessions with Commission
May 25, 2023
Budget Ordinance published in the Johnson City Press
June 1, 2023
First reading and public hearing of budget ordinance
June 8, 2023
Second reading of budget ordinance
July 1, 2023
FY 24 Budget is implemented
June 30, 2023
Budget sent to the State
June 15, 2023
Third reading of budget ordinance
38
FUND SCHEDULES
EXPENDITURE CHANGES BY FUND FISCAL YEAR 2024
39
Budget Projected Budget FUND FY 2023 FY 2023 FY 2024 Dollars Percent General Fund (Operating) 77,376,340 78,944,308 84,628,218 5,683,910 7.2 Debt Service Fund 11,731,313 11,731,313 12,260,434 529,121 4.5 Educational Facilities Trust Fund 4,619,297 4,619,297 4,711,950 92,653 2.0 General Purpose School Fund 86,197,617 87,241,551 97,729,610 10,488,059 12.0 School Food Services Fund 4,611,300 3,832,525 3,868,600 36,075 0.9 School Federal Projects Fund 21,704,240 12,338,702 10,415,796 (1,922,906) (15.6) School Special Projects Fund 695,602 1,501,952 3,145,612 1,643,660 109.4 Capital Equipment Fund 2,611,080 4,258,090 4,154,267 (103,823) (2.4) Capital Projects - Facilities/Infrastructure Fund 58,060,203 30,907,682 32,620,440 1,712,758 5.5 Capital Projects - Schools Fund 2,100,000 7,106,339 2,000,000 (5,106,339) (71.9) Community Development Fund 921,250 921,250 720,255 (200,995) (21.8) Drug Fund 224,400 224,400 229,000 4,600 2.0 Freedom Hall Fund 1,853,253 1,897,140 1,875,558 (21,582) (1.1) Mass Transit Fund 5,293,000 5,240,068 5,575,689 335,621 6.4 Police Grant Fund 157,406 169,062 159,500 (9,562) (5.7) Police Technology Fund 212,104 212,104 188,074 (24,030) (11.3) Solid Waste - Municipal Fund 12,632,698 12,507,764 14,218,324 1,710,560 13.7 Solid Waste - Regional Fund 3,473,535 3,473,535 4,060,235 586,700 16.9 Storm Water Fund 2,436,201 2,421,979 2,435,141 13,162 0.5 Transportation Planning Fund 334,434 334,434 386,688 52,254 15.6 Water and Sewer Fund 37,540,669 37,075,905 39,586,846 2,510,941 6.8 TOTAL - ALL FUNDS 334,785,942 306,959,400 324,970,237 18,010,837 5.9 Bdgt. FY 24 vs. Proj. FY 23
Change
40 CITY OF JOHNSON CITY BUDGET SUMMARY FY 2024 ANNUAL BUDGET Fund Beginning Fund Total Available Balance (or Net Position) Revenues Debt Proceeds Transfers In Receipts Funds General Fund 51,683,507 $ 114,451,393114,451,393 166,134,900 Debt Service Fund 454,29212,260,434 12,260,434 12,714,726 Educational Facilities Trust Fund 7,710,132 3,346,0001,900,000 5,246,000 12,956,132 General Purpose School Fund 17,786,713 81,902,31614,536,159 96,438,475 114,225,188 School Food Services Fund 3,936,365 3,868,6003,868,600 7,804,965 School Federal Projects Fund 1,075,350 10,389,79626,000 10,415,796 11,491,146 School Special Projects Fund 8,680 3,126,07319,539 3,145,612 3,154,292 Capital Equipment Fund 1,135,8693,564,267 3,564,267 4,700,136 Capital ProjectsFacilities/Infrastructure 32,610,955 2,800,0001,855,000 4,655,000 37,265,955 Capital ProjectsSchools Fund 396,39340,000,00040,000,000 40,396,393 Community Development Fund 393,718 720,255720,255 1,113,973 Drug Fund 991,699 115,000115,000 1,106,699 Freedom Hall Fund 851,777 1,458,500417,100 1,875,600 2,727,377 Mass Transit Fund 7,099,447 3,668,1891,459,348 5,127,537 12,226,984 Police Grant Fund159,500159,500 159,500 Police Technology Fund 241,082 260,000260,000 501,082 Solid WasteMunicipal Fund 14,401,339 13,591,860199,192 13,791,052 28,192,391 Solid WasteRegional Fund 5,927,360 4,095,2004,095,200 10,022,560 Storm Water Fund 15,651,793 3,289,0003,289,000 18,940,793 Transportation Planning Fund 116,455 326,22260,500 386,722 503,177 Water and Sewer Fund 165,774,575 41,904,300225,162 42,129,462 207,904,037 TotalAll Funds 328,247,500 $ 289,472,204 40,000,000 36,522,701 365,994,905 694,242,405
41 CITY OF JOHNSON CITY BUDGET SUMMARY FY 2024 ANNUAL BUDGET Fund General Fund Debt Service Fund Educational Facilities Trust Fund General Purpose School Fund School Food Services Fund School Federal Projects Fund School Special Projects Fund Capital Equipment Fund Capital ProjectsFacilities/Infrastructure Capital ProjectsSchools Fund Community Development Fund Drug Fund Freedom Hall Fund Mass Transit Fund Police Grant Fund Police Technology Fund Solid WasteMunicipal Fund Solid WasteRegional Fund Storm Water Fund Transportation Planning Fund Water and Sewer Fund TotalAll Funds Total Increase/ Est End Fund Balance Expenses Transfers Out Appropriations Decrease or Net Position 84,628,218 29,823,175 114,451,393 0 51,683,507 12,260,43412,260,434 0 454,292 4,711,9504,711,950 534,050 8,244,182 97,729,61097,729,610 (1,291,135) 16,495,578 3,868,6003,868,600 0 3,936,365 10,415,79610,415,796 0 1,075,350 3,145,6123,145,612 0 8,680 4,154,2674,154,267 (590,000) 545,869 32,620,44032,620,440 (27,965,440) 4,645,515 2,000,0002,000,000 38,000,000 38,396,393 720,255720,255 0 393,718 229,000229,000 (114,000) 877,699 1,875,5581,875,558 42 851,819 5,575,6895,575,689 (448,152) 6,651,295 159,500159,500 0188,074188,074 71,926 313,008 14,070,517 147,807 14,218,324 (427,272) 13,974,067 3,783,688 276,547 4,060,235 34,965 5,962,325 2,435,1412,435,141 853,859 16,505,652 386,688386,688 34 116,489 39,586,84639,586,846 2,542,616 168,317,191 324,545,883 30,247,529 354,793,412 11,201,493 339,448,993
GENERAL FUND SUMMARY
42 Actual Actual Budget Projected Budget Bdgt. 24 % FY 2021 FY 2022 FY 2023 FY 2023 FY 2024 vs. Proj. 23 Change REVENUES Local Taxes 77,916,109 83,642,884 81,126,000 86,519,500 92,974,740 6,455,240 7.5 Licenses and Permits 1,030,760 1,102,607 1,071,500 1,207,000 1,238,000 31,000 2.6 Intergovernmental Revenues 15,138,099 13,804,790 13,080,680 12,857,680 13,555,680 698,000 5.4 Charges for Service 3,443,349 3,927,114 4,109,169 4,231,769 4,502,923 271,154 6.4 Fines and Forfeitures 778,964 793,102 1,250,000 900,000 1,000,000 100,000 11.1 Other Revenues 1,100,960 2,220,643 1,080,700 1,085,720 1,180,050 94,330 7.5 TOTAL REVENUES 99,408,241 105,491,140 101,718,049 106,801,669 114,451,393 12,733,344 11.9 EXPENDITURES Development Services 1,542,746 1,649,703 1,960,040 1,920,839 2,053,225 132,386 6.9 Facilities Management 1,111,351 1,331,145 1,536,026 1,541,175 1,871,440 330,265 21.4 Finance 1,649,547 1,603,667 1,828,725 1,811,023 1,957,209 146,186 8.1 Fire Department 11,597,540 12,157,149 13,087,875 13,887,875 14,091,915 204,040 1.5 General Government 2,644,018 3,068,246 3,901,179 3,511,795 4,623,663 1,111,868 31.7 Information Technology 2,036,272 2,473,590 3,132,324 3,059,429 3,372,110 312,681 10.2 Judicial 1,014,881 1,113,199 1,215,543 1,127,689 1,162,074 34,385 3.0 Library 1,970,525 2,070,225 2,148,951 2,186,977 2,240,975 53,998 2.5 Other 4,681,553 5,505,385 5,591,498 8,166,638 6,275,055 (1,891,583) (23.2) Parks & Recreation 5,087,872 5,783,045 6,725,029 6,590,528 7,635,084 1,044,556 15.8 Pine Oaks Golf Course 979,628 912,639 1,022,072 1,001,631 1,088,041 86,410 8.6 Police 14,383,515 14,725,654 16,586,503 15,926,993 16,734,659 807,666 5.1 Public Works 14,255,831 12,220,649 14,638,576 14,345,804 17,081,699 2,735,895 19.1 Risk Management 519,587 407,505 489,846 484,477 520,896 36,419 7.5 Senior Citizens 596,054 731,682 921,588 905,756 1,005,058 99,302 11.0 Student Transportation 2,078,677 2,268,608 2,590,565 2,475,679 2,915,115 439,436 17.8 TOTAL OPERATING EXPENDITURES 66,149,597 68,022,091 77,376,340 78,944,308 84,628,218 5,683,910 7.2 OPERATING TRANFERS OUT Capital Equipment Fund 2,150,088 3,776,751 2,611,080 2,611,080 3,564,267 953,187 36.5 Capital Projects - Facilities Fund 38,790 3,341,815 1,797,000 2,812,000 890,000 (1,922,000) (68.3) Capital Projects - Infrastructure Fund 0 640,000 0 0 965,000 965,000 0.0 Capital Projects - Schools Fund 0 455,109 0 0 0 0 0.0 Community Development Fund 471,004 -141,335 0 0 0 0 0.0 Debt Service Fund 8,002,994 8,939,207 10,595,280 10,595,280 11,117,872 522,592 4.9 Debt Service Fund - Economic Development Reserve 160,359 153,245 106,703 106,703 102,352 (4,351) (4.1) Freedom Hall Fund 429,783 320,810 360,000 360,000 417,100 57,100 15.9 Johnson City Schools 10,590,736 11,340,736 11,340,736 11,340,736 11,340,736 0 0.0 Johnson City Schools - Mixed Drink Tax 286,000 286,000 286,000 286,000 286,000 0 0.0 Mass Transit Fund 700,249 748,528 961,000 961,000 1,079,348 118,348 12.3 Police Grant Fund 1,706 0 0 0 0 0 0.0 Transportation Planning Fund 109,232 115,794 55,000 55,000 60,500 5,500 10.0 TOTAL OPERATING TRANSFER OUT 22,940,941 29,976,660 28,112,799 29,127,799 29,823,175 695,376 2.4 TOTAL EXPENDITURES 89,090,538 97,998,751 105,489,139 108,072,107 114,451,393 6,379,286 5.9 NET CHANGE IN FUND BALANCE 10,317,703 7,492,389 (3,771,090) (1,270,438) 0 1,270,438 (100.0) FUND BALANCE (BEGINNING) 35,120,517 45,438,220 45,986,091 52,953,945 51,683,507 (1,270,438) (2.4) ADJUSTMENTS 23,336 FUND BALANCE (ENDING) 45,438,220 52,953,945 42,215,001 51,683,507 51,683,507 0 0.0
GENERAL FUND SUMMARY
43 Actual Actual Budget Projected Budget Bdgt. 24 % FY 2021 FY 2022 FY 2023 FY 2023 FY 2024 vs. Proj. 23 Change LOCAL TAXES Real & Personal Property Taxes 34,838,401 35,504,830 35,340,000 36,128,000 41,396,240 5,268,240 14.6 Economic Dev. Reserve (Med Tech Park ) 796,593 745,561 760,000 760,000 866,500 106,500 14.0 Delinquent Taxes - Prior Years 457,326 423,172 600,000 380,500 330,000 (50,500) (13.3) Interest & Penalty - Property Taxes 290,986 282,322 250,000 250,000 250,000 0 0.0 Payments In-Lieu - TN Valley Auth. 1,008,323 1,027,194 1,100,000 1,100,000 560,000 (540,000) (49.1) Payments In-Lieu - J.C. Power Board 4,375,070 4,277,864 4,462,000 4,462,000 4,462,000 0 0.0 Payments In-Lieu - J.C. Housing Auth. 0 56,668 50,000 50,000 50,000 0 0.0 Payments In-Lieu - Water/Sewer Fund 700,000 750,000 800,000 800,000 800,000 0 0.0 Payments In-Lieu - Iris Glen 1,201,505 1,225,721 1,054,000 1,054,000 1,200,000 146,000 13.9 Payments In-Lieu - Elizabethton Electric 2,094 2,363 3,500 3,500 3,500 0 0.0 Payments In-Lieu - Other Businesses 6,818 7,412 6,500 6,500 6,500 0 0.0 Local Sales Tax 25,563,699 29,081,519 28,150,000 31,750,000 33,300,000 1,550,000 4.9 Minimum Business Tax 2,388,101 2,727,479 2,200,000 2,200,000 2,250,000 50,000 2.3 Wholesale Beer Tax 2,099,663 2,115,709 2,050,000 2,050,000 2,050,000 0 0.0 Wholesale Liquor Inspection 982,037 954,490 875,000 1,100,000 1,000,000 (100,000) (9.1) Hotel/Motel Tax 1,905,962 2,936,121 2,100,000 3,100,000 3,100,000 0 0.0 Gas Franchise Tax 572,178 790,494 575,000 575,000 600,000 25,000 4.3 CATV Franchise 727,009 733,965 750,000 750,000 750,000 0 0.0 Other 344 0 0 0 0 0 0.0 TOTAL LOCAL TAXES 77,916,109 83,642,884 81,126,000 86,519,500 92,974,740 6,455,240 7.5 LICENSES AND PERMITS Building Permits 463,922 517,373 500,000 590,000 640,000 50,000 8.5 Electrical Permits 92,912 91,113 95,000 95,000 95,000 0 0.0 Plumbing Permits 35,894 35,986 35,000 35,000 35,000 0 0.0 Natural Gas Permits 10,939 16,428 12,000 14,000 15,000 1,000 7.1 Mechanical Permits 55,863 62,066 55,000 60,000 62,000 2,000 3.3 Plan Review Permits 51,359 54,884 52,000 75,000 66,000 (9,000) (12.0) Sign Permits 18,551 15,193 15,000 15,500 15,000 (500) (3.2) Zoning Permits and Fees 16,925 19,386 20,000 20,000 22,000 2,000 10.0 Excavation Permits 195,436 195,448 200,000 200,000 200,000 0 0.0 Beverage & Private Club Permits 86,407 83,994 85,000 100,000 85,000 (15,000) (15.0) Other Fees and Licenses 2,552 10,736 2,500 2,500 3,000 500 20.0 TOTAL LICENSES AND PERMITS 1,030,760 1,102,607 1,071,500 1,207,000 1,238,000 31,000 2.6 INTERGOVERNMENTAL State - Boarding Prisoners 961,579 738,045 950,000 100,000 0 (100,000) (100.0) State Sales Tax 6,592,686 8,033,649 7,600,000 8,000,000 8,200,000 200,000 2.5 State Income Tax 296,955 16,708 0 0 0 0 0.0 State Beer Tax 29,898 32,453 30,000 52,000 35,000 (17,000) (32.7) State Mixed Drink Tax 813,817 1,022,808 800,000 1,000,000 1,050,000 50,000 5.0 State Gas Tax & Street Aid 2,269,688 2,463,773 2,460,000 2,460,000 2,530,000 70,000 2.8 State Highway Maintenance 303,794 264,337 289,000 289,000 289,000 0 0.0 State Highway Maintenance - Mowing 45,900 38,250 45,900 45,900 45,900 0 0.0 State Litter Reimbursement 13,680 13,680 13,680 13,680 13,680 0 0.0 State Street and Transportation 114,928 129,832 125,000 130,000 125,000 (5,000) (3.8) State Excise Tax 333,111 320,275 200,000 200,000 200,000 0 0.0 State - Fire Department Supplement 100,800 101,600 102,000 102,000 102,000 0 0.0 State - Police Department Supplement 104,800 106,400 106,000 106,000 106,000 0 0.0 State - Senior Center Grant 80,549 74,845 83,600 83,600 83,600 0 0.0 State - Juvenile Court Grants 4,500 4,500 4,500 4,500 4,500 0 0.0 State - Telecommunication Tax 162,988 158,954 155,000 155,000 155,000 0 0.0 State - Local Support Grant 1,503,688 0 0 0 0 0 0.0 Other 1,404,738 284,681 116,000 116,000 616,000 500,000 431.0 TOTAL INTERGOVERNMENTAL 15,138,099 13,804,790 13,080,680 12,857,680 13,555,680 698,000 5.4 CHARGES FOR SERVICE Building Rental 293,126 301,952 295,000 295,000 295,000 0 0.0 Parks and Recreation Fees 220,576 513,820 558,400 546,000 577,200 31,200 5.7 Pine Oaks Golf Course Fees 720,806 835,932 700,000 835,000 835,000 0 0.0 Print Shop Charges 28,333 29,908 25,000 25,000 0 (25,000) (100.0) Computer Services 336,286 350,000 579,006 579,006 613,000 33,994 5.9 School Bus Charters 123,587 148,241 120,000 120,000 120,000 0 0.0 Miscellaneous 134,017 114,400 50,000 50,000 50,000 0 0.0 GENERAL FUND REVENUE SUMMARY Actual Actual Budget Projected Budget Bdgt. 24 % FY 2021 FY 2022 FY 2023 FY 2023 FY 2024 vs. Proj. 23 Change GENERAL FUND REVENUE SUMMARY Administrative Fees 1,586,618 1,632,861 1,781,763 1,781,763 2,012,723 230,960 13.0 TOTAL CHARGES FOR SERVICE 3,443,349 3,927,114 4,109,169 4,231,769 4,502,923 271,154 6.4 FINES AND FORFEITURES Fines, Forfeitures, & Court Costs 778,964 793,102 1,250,000 900,000 1,000,000 100,000 11.1 GENERAL FUND REVENUE SUMMARY
GENERAL FUND REVENUE SUMMARY
44 GENERAL FUND REVENUE SUMMARY Pine Oaks Golf Course Fees 720,806 835,932 700,000 835,000 835,000 0 0.0 Print Shop Charges 28,333 29,908 25,000 25,000 0 (25,000) (100.0) Computer Services 336,286 350,000 579,006 579,006 613,000 33,994 5.9 School Bus Charters 123,587 148,241 120,000 120,000 120,000 0 0.0 Miscellaneous 134,017 114,400 50,000 50,000 50,000 0 0.0 Administrative Fees 1,586,618 1,632,861 1,781,763 1,781,763 2,012,723 230,960 13.0 TOTAL CHARGES FOR SERVICE 3,443,349 3,927,114 4,109,169 4,231,769 4,502,923 271,154 6.4 FINES AND FORFEITURES Fines, Forfeitures, & Court Costs 778,964 793,102 1,250,000 900,000 1,000,000 100,000 11.1 TOTAL FINES AND FORFEITURES 778,964 793,102 1,250,000 900,000 1,000,000 100,000 11.1 OTHER REVENUE Interest 215,207 238,609 300,000 300,000 300,000 0 0.0 Refunds & Reimbursements 245,763 309,023 200,000 200,000 250,000 50,000 25.0 Sale of Equipment & Other Items 254,371 225,314 175,000 175,000 175,000 0 0.0 Sale of Methane Gas 70,924 250,999 25,000 25,000 32,000 7,000 28.0 Senior Citizens 19,272 113,326 130,700 135,720 153,050 17,330 12.8 Donations 38,244 34,358 50,000 50,000 50,000 0 0.0 Miscellaneous Revenue 257,179 1,049,014 200,000 200,000 220,000 20,000 10.0 TOTAL OTHER REVENUE 1,100,960 2,220,643 1,080,700 1,085,720 1,180,050 94,330 8.7 REVENUE SUBTOTAL 99,408,241 105,491,140 101,718,049 106,801,669 114,451,393 7,649,724 7.2 TOTAL MUNICIPAL REVENUE 99,408,241 105,491,140 101,718,049 106,801,669 114,451,393 7,649,724 7.2 FUND BALANCE APPROPRIATION 3,771,090 1,270,438 TOTAL REVENUES 99,408,241 105,491,140 105,489,139 108,072,107 114,451,393 6,379,286 5.9 Actual Actual Budget Projected Budget Bdgt. 24 % FY 2021 FY 2022 FY 2023 FY 2023 FY 2024 vs. Proj. 23 Change LOCAL TAXES Real & Personal Property Taxes 34,838,401 35,504,830 35,340,000 36,128,000 41,396,240 5,268,240 14.6 Economic Dev. Reserve (Med Tech Park ) 796,593 745,561 760,000 760,000 866,500 106,500 14.0 Delinquent Taxes - Prior Years 457,326 423,172 600,000 380,500 330,000 (50,500) (13.3) Interest & Penalty - Property Taxes 290,986 282,322 250,000 250,000 250,000 0 0.0 Payments In-Lieu - TN Valley Auth. 1,008,323 1,027,194 1,100,000 1,100,000 560,000 (540,000) (49.1) Payments In-Lieu - J.C. Power Board 4,375,070 4,277,864 4,462,000 4,462,000 4,462,000 0 0.0 Payments In-Lieu - J.C. Housing Auth. 0 56,668 50,000 50,000 50,000 0 0.0 Payments In-Lieu - Water/Sewer Fund 700,000 750,000 800,000 800,000 800,000 0 0.0 Payments In-Lieu - Iris Glen 1,201,505 1,225,721 1,054,000 1,054,000 1,200,000 146,000 13.9 Payments In-Lieu - Elizabethton Electric 2,094 2,363 3,500 3,500 3,500 0 0.0 Payments In-Lieu - Other Businesses 6,818 7,412 6,500 6,500 6,500 0 0.0 Local Sales Tax 25,563,699 29,081,519 28,150,000 31,750,000 33,300,000 1,550,000 4.9 Minimum Business Tax 2,388,101 2,727,479 2,200,000 2,200,000 2,250,000 50,000 2.3 Wholesale Beer Tax 2,099,663 2,115,709 2,050,000 2,050,000 2,050,000 0 0.0 Wholesale Liquor Inspection 982,037 954,490 875,000 1,100,000 1,000,000 (100,000) (9.1) Hotel/Motel Tax 1,905,962 2,936,121 2,100,000 3,100,000 3,100,000 0 0.0 Gas Franchise Tax 572,178 790,494 575,000 575,000 600,000 25,000 4.3 CATV Franchise 727,009 733,965 750,000 750,000 750,000 0 0.0 Other 344 0 0 0 0 0 0.0 TOTAL LOCAL TAXES 77,916,109 83,642,884 81,126,000 86,519,500 92,974,740 6,455,240 7.5 LICENSES AND PERMITS Building Permits 463,922 517,373 500,000 590,000 640,000 50,000 8.5 Electrical Permits 92,912 91,113 95,000 95,000 95,000 0 0.0 Plumbing Permits 35,894 35,986 35,000 35,000 35,000 0 0.0 Natural Gas Permits 10,939 16,428 12,000 14,000 15,000 1,000 7.1 Mechanical Permits 55,863 62,066 55,000 60,000 62,000 2,000 3.3 Plan Review Permits 51,359 54,884 52,000 75,000 66,000 (9,000) (12.0) Sign Permits 18,551 15,193 15,000 15,500 15,000 (500) (3.2) Zoning Permits and Fees 16,925 19,386 20,000 20,000 22,000 2,000 10.0 Excavation Permits 195,436 195,448 200,000 200,000 200,000 0 0.0 Beverage & Private Club Permits 86,407 83,994 85,000 100,000 85,000 (15,000) (15.0) Other Fees and Licenses 2,552 10,736 2,500 2,500 3,000 500 20.0 TOTAL LICENSES AND PERMITS 1,030,760 1,102,607 1,071,500 1,207,000 1,238,000 31,000 2.6 INTERGOVERNMENTAL State - Boarding Prisoners 961,579 738,045 950,000 100,000 0 (100,000) (100.0) State Sales Tax 6,592,686 8,033,649 7,600,000 8,000,000 8,200,000 200,000 2.5 State Income Tax 296,955 16,708 0 0 0 0 0.0 State Beer Tax 29,898 32,453 30,000 52,000 35,000 (17,000) (32.7) State Mixed Drink Tax 813,817 1,022,808 800,000 1,000,000 1,050,000 50,000 5.0 State Gas Tax & Street Aid 2,269,688 2,463,773 2,460,000 2,460,000 2,530,000 70,000 2.8 State Highway Maintenance 303,794 264,337 289,000 289,000 289,000 0 0.0 State Highway Maintenance - Mowing 45,900 38,250 45,900 45,900 45,900 0 0.0 State Litter Reimbursement 13,680 13,680 13,680 13,680 13,680 0 0.0 State Street and Transportation 114,928 129,832 125,000 130,000 125,000 (5,000) (3.8) State Excise Tax 333,111 320,275 200,000 200,000 200,000 0 0.0 State - Fire Department Supplement 100,800 101,600 102,000 102,000 102,000 0 0.0 State - Police Department Supplement 104,800 106,400 106,000 106,000 106,000 0 0.0 State - Senior Center Grant 80,549 74,845 83,600 83,600 83,600 0 0.0 State - Juvenile Court Grants 4,500 4,500 4,500 4,500 4,500 0 0.0 State - Telecommunication Tax 162,988 158,954 155,000 155,000 155,000 0 0.0 State - Local Support Grant 1,503,688 0 0 0 0 0 0.0 Other 1,404,738 284,681 116,000 116,000 616,000 500,000 431.0 TOTAL INTERGOVERNMENTAL 15,138,099 13,804,790 13,080,680 12,857,680 13,555,680 698,000 5.4 CHARGES FOR SERVICE Building Rental 293,126 301,952 295,000 295,000 295,000 0 0.0 Parks and Recreation Fees 220,576 513,820 558,400 546,000 577,200 31,200 5.7 Pine Oaks Golf Course Fees 720,806 835,932 700,000 835,000 835,000 0 0.0 Print Shop Charges 28,333 29,908 25,000 25,000 0 (25,000) (100.0) Computer Services 336,286 350,000 579,006 579,006 613,000 33,994 5.9 School Bus Charters 123,587 148,241 120,000 120,000 120,000 0 0.0 Miscellaneous 134,017 114,400 50,000 50,000 50,000 0 0.0
45 Actual Actual Budget Projected Budget Bdgt. 24 % FY 2021 FY 2022 FY 2023 FY 2023 FY 2024 vs. Proj. 23 Change REVENUES Interest 71,300 62,617 0 0 0 0 0.0 Other 158,589 135,719 0 0 0 0 0.0 TOTAL REVENUES 229,889 198,336 0 0 0 0 0.0 EXPENDITURES Debt Issuances for City Capital Projects: Series V-K-1 TN Loan 2009 1,072,037 0 0 0 0 0 0.0 Series V-K-1 Tn Loan 2009 - Med Tech 76,527 0 0 0 0 0 0.0 General Obligation Bond Issue Refunding 1998 939 0 0 0 0 0 0.0 Series D-9-A Loan Refunding 2007 4,170 0 0 0 0 0 0.0 TN Municipal Bond Fund Issue 2008 909,611 951,582 1,116,004 1,116,004 1,134,511 18,507 1.7 2012 General Obligation Bond Refunding 928,583 0 0 0 0 0 0.0 2012 General Obligation Bond Refunding - 0 Med Tech 81,728 0 0 0 0 0 0.0 2014 Capital Outlay Note (General Fund) 134,356 134,463 0 0 0 0 0.0 2014 Capital Outlay Note (Freedom Hall) 77,497 76,836 0 0 0 0 0.0 2014 TMBF Loan - City (Fieldhouse) 36,189 36,507 35,781 35,781 36,012 231 0.6 2014 TMBF Loan - City (Farmers Market) 28,590 28,488 28,544 28,544 28,408 (136) (0.5) 2014 TMBF Loan - TIF (Farmers Market) 134,782 134,302 134,565 134,565 133,922 (643) (0.5) 2016 Series (Freedom Hall/Road Projects) 841,750 837,400 837,900 837,900 839,650 1,750 0.2 2016A Refunding (2009 repl) 312,684 310,753 326,721 326,721 327,015 294 0.1 2016A School Maintenance Building 258,084 256,584 259,800 259,800 257,550 (2,250) (0.9) 2016A ETSU FPAC 516,654 518,645 514,750 514,750 515,500 750 0.1 2017 Hands On! 50,000 50,000 50,000 50,000 50,000 0 0.0 2019 G.O. Bond Issue 401,500 406,550 406,050 406,050 405,050 (1,000) (0.2) 2019B Refunding 1,416,252 1,392,742 1,214,008 1,214,008 1,361,323 147,315 12.1 2020 Refunding 189,064 2,345,382 1,452,776 1,452,776 911,647 (541,129) (37.2) 2020 Refunding - Med Tech 6,770 153,239 106,703 106,703 102,352 (4,351) (4.1) 2020 G.O. Bond Issue 44,906 512,068 504,160 504,160 500,710 (3,450) (0.7) 2020 G.O. Bond Issue (513) 0 0 10,256 10,256 10,179 (77) (0.8) 2022 G.O. Bond Issue 0 0 3,021,170 3,021,170 3,023,600 2,430 0.1 TOTAL CITY PROJECTS 7,522,673 8,145,541 10,019,188 10,019,188 9,637,429 (381,759) (3.8) Debt Issuances for School Capital Projects: 2009 Qualified School Construction 587,542 640,955 632,795 632,795 632,795 0 0.0 Series V-K-1 Loan 2009 406,839 0 0 0 0 0 0.0 TN Municipal Bond Fund Issue 2008 426,759 445,559 481,930 481,930 491,310 9,380 1.9 2014 TMBF Loan - Schools (Fieldhouse) 50,000 50,000 50,000 50,000 50,000 0 0.0 2016A School Energy Improvements 546,959 550,209 547,400 547,400 548,900 1,500 0.3 2023 G.O. Bond Issue 0 0 0 0 900,000 900,000 100.0 TOTAL SCHOOL PROJECTS 2,018,099 1,686,723 1,712,125 1,712,125 2,623,005 910,880 53.2 TOTAL DEBT SERVICE EXPEDITURES 9,540,772 9,832,264 11,731,313 11,731,313 12,260,434 529,121 4.5 Excess (Deficiency) of Revenues Over (Under) Expenditures (9,310,883) (9,633,928) (11,731,313) (11,731,313) (12,260,434) (529,121) 4.5 OTHER FINANCING SOURCES (USES) General Fund 8,002,994 8,939,207 10,595,280 10,595,280 11,117,872 522,592 4.9 General Purpose School Fund 973,718 995,768 1,029,330 1,029,330 1,040,210 10,880 1.1 Economic Development Fund 160,359 153,245 106,703 106,703 102,352 (4,351) (4.1) Premium on Bonds - Refunding 592,367 0 0 0 0 0 0.0 Issuance of Refunding Bonds 5,528,045 0 0 0 0 0 0.0 Payment to Refund Bonds Escrow Agent (6,029,735) 0 0 0 0 0 0.0 TOTAL OTHER FINANCIAL SOURCES 9,227,748 10,088,220 11,731,313 11,731,313 12,260,434 529,121 4.5 NET CHANGE IN FUND BALANCE (83,135) 454,292 0 0 0 0 0.0 FUND BALANCE (BEGINNING) 83,135 0 0 454,292 454,292 0 0.0 FUND BALANCE (ENDING) 0 454,292 0 454,292 454,292 0 0.0 DEBT SERVICE
DEBT SERVICE
FUND SUMMARY
FUND SUMMARY
EDUCATIONAL FACILITIES TRUST FUND SUMMARY
EDUCATIONAL FACILITIES TRUST FUND SUMMARY
46 Actual Actual Budget Projected Budget Bdgt. 24 % FY 2021 FY 2022 FY 2023 FY 2023 FY 2024 vs. Proj. 23 Change REVENUES Local Option Sales Tax 2,685,065 3,065,712 2,915,000 3,183,180 3,342,000 158,820 5.0 Interest 9,143 12,591 4,000 4,000 4,000 0 0.0 TOTAL REVENUES 2,694,208 3,078,303 2,919,000 3,187,180 3,346,000 158,820 5.0 EXPENDITURES Debt Service 2,004,803 3,887,043 4,616,297 4,616,297 4,702,950 86,653 1.9 Bank Service Charges 122,299 58,939 3,000 3,000 9,000 6,000 200.0 TOTAL EXPENDITURES 2,127,102 3,945,982 4,619,297 4,619,297 4,711,950 92,653 2.0 OTHER FINANCING SOURCES Operating Transfers In 1,678,281 1,973,735 1,700,000 1,900,000 1,900,000 0 0.0 Premium on Bonds-Refunding 81,008 0 0 0 0 0 0.0 Issuance of Refunding Bonds 768,671 0 0 0 0 0 0.0 Payment to Refunded Bonds Escrow Agent (845,964) 0 0 0 0 0 0.0 TOTAL OTHER FINANCIAL SOURCES 1,681,996 1,973,735 1,700,000 1,900,000 1,900,000 0 0.0 Excess (Deficiency) of Revenues and Other Sources Over (Under) Total Expenditures 2,249,102 1,106,056 (297) 467,883 534,050 66,167 14.1 FUND BALANCE (BEGINNING) 3,887,091 6,136,193 6,215,711 7,242,249 7,710,132 467,883 6.5 FUND BALNCE (ENDING) 6,136,193 7,242,249 6,215,414 7,710,132 8,244,182 534,050 6.9
JOHNSON CITY, TENNESSEE CITY SCHOOL SYSTEM
47 Actual Actual Budget Projected Budget Bdgt. 24 % FY 2021 FY 2022 FY 2023 FY 2023 FY 2024 vs. Proj. 23 Change REVENUES County Taxes/Licenses 30,386,495 33,729,504 31,538,492 35,439,875 35,324,737 (115,138) (0.3) Charges for Service 2,348,913 1,950,606 1,655,660 1,902,671 1,699,800 (202,871) (10.7) Other Local Revenue 447,690 275,660 26,000 120,290 26,000 (94,290) (78.4) State Education Funds 34,977,295 35,474,930 35,989,500 36,144,007 44,801,779 8,657,772 24.0 Direct Federal Funds 281,916 17,032 0 50,000 50,000 0 0.0 TOTAL REVENUES 68,442,309 71,447,732 69,209,652 73,656,843 81,902,316 8,245,473 11.2 EXPENDITURES Instruction: Regular Education Instruction 41,842,431 41,120,979 43,093,661 46,024,524 49,195,570 3,171,046 6.9 Alternative Instruction 1,045,243 1,085,382 1,165,975 1,098,585 1,205,792 107,207 9.8 Special Education Instruction 4,460,971 4,770,464 5,435,397 5,167,275 5,834,040 666,765 12.9 Vocational Educational Instruction 1,992,601 2,070,966 3,548,021 2,078,819 2,316,661 237,842 11.4 Total Instruction 49,341,246 49,047,789 53,243,054 54,369,203 58,552,063 4,182,860 7.7 Support Services: Attendance 44,109 45,851 46,000 82,062 331,668 249,606 304.2 Health Services 656,882 108,396 792,301 577,446 1,039,194 461,748 80.0 Student Support 1,846,495 1,840,725 2,218,589 2,136,550 3,460,906 1,324,356 62.0 Instruction Support 3,692,168 3,331,716 3,651,239 4,279,213 4,904,492 625,279 14.6 Alternative Support 54,644 55,869 63,095 53,421 57,519 4,098 7.7 Special Education Support 566,615 630,223 644,076 649,353 683,755 34,402 5.3 Vocational Education Support 163,121 340,776 368,541 369,275 365,905 (3,370) (0.9) Technology 1,747,494 1,823,419 2,284,111 2,308,874 2,282,729 (26,145) (1.1) Board of Education 1,030,815 1,033,735 1,137,037 1,223,350 1,274,054 50,704 4.1 Office of the Director of Schools 403,298 449,525 467,485 412,313 481,859 69,546 16.9 Office of the Principal 5,148,063 5,236,326 5,512,039 5,585,814 6,319,710 733,896 13.1 Fiscal Services 482,721 523,651 600,787 539,776 643,956 104,180 19.3 Human Resources 231,233 250,584 251,279 241,241 253,383 12,142 5.0 Operation of Plant 4,514,009 4,815,041 5,150,908 5,091,425 5,603,817 512,392 10.1 Maintenance of Plant 1,863,970 1,895,036 2,134,360 1,878,427 2,268,615 390,188 20.8 Transportation 2,075,062 2,371,852 2,674,810 2,519,136 3,294,546 775,410 30.8 Central Services 86,797 99,469 116,761 114,242 126,077 11,835 10.4 Total Support Services 24,607,496 24,852,195 28,113,418 28,061,918 33,392,185 5,330,267 19.0 Non-Instructional Services: Debt Service 2,651,999 2,969,502 2,825,197 2,828,984 3,173,720 344,736 12.2 Early Childhood Education 339,044 295,454 383,690 384,512 394,445 9,933 2.6 Community Services 1,113,406 1,028,292 1,249,079 1,012,128 1,302,958 290,830 28.7 Regular Capital Outlay 193,028 359,874 288,000 504,806 851,500 346,694 68.7 Operating Transfers 1,185,935 89,925 95,179 80,000 62,739 (17,261) (21.6) Total Non-Instructional Services 5,483,412 4,743,049 4,841,145 4,810,430 5,785,362 974,932 20.3 TOTAL EXPENDITURES 79,432,154 78,643,033 86,197,617 87,241,551 97,729,610 10,488,059 12.0 Excess (Deficiency) of Revenues and Other Sources Over (Under) Expenditures (10,989,845) (7,195,301) (16,987,965) (13,584,708) (15,827,294) (2,242,586) 16.5 OTHER SOURCES OF FUNDS School Funds 0 408,378 0 0 0 0 0.0 Sale of Equipment 0 50 0 0 0 0 0.0 City Appropriation 10,876,736 11,626,736 11,626,736 11,626,736 11,626,736 0 0.0 Transfer from City General Fund for Transportation 2,014,855 2,266,075 2,429,715 2,429,715 2,909,423 479,708 19.7 TOTAL OTHER SOURCES OF FUNDS 12,891,591 14,301,239 14,056,451 14,056,451 14,536,159 479,708 3.4 NET CHANGE IN FUND BALANCE 1,901,746 7,105,938 (2,931,514) 471,743 (1,291,135) 290,830 61.7 FUND BALANCE (BEGINNING) 8,307,286 10,209,032 14,489,409 17,314,970 17,786,713 471,743 2.7 FUND BALANCE (ENDING) 10,209,032 17,314,970 11,557,895 17,786,713 16,495,578 (1,291,135) (7.3) GENERAL PURPOSE SCHOOL FUND SUMMARY JOHNSON
CITY, TENNESSEE CITY SCHOOL SYSTEM
GENERAL
PURPOSE SCHOOL FUND SUMMARY
48 Actual Actual Budget Projected Budget Bdgt. 24 % FY 2021 FY 2022 FY 2023 FY 2023 FY 2024 vs. Proj. 23 Change LOCAL TAXES Current Property Tax 11,987,673 12,416,312 12,012,049 12,883,577 12,412,095 (471,482) (3.7) Trustee's Collections - Prior Year 373,186 214,248 395,150 214,248 354,555 140,307 65.5 Circuit Clerk/Clerk & Master Collection - Prior Ye 93,104 64,049 106,405 64,049 100,000 35,951 56.1 Interest and Penalty 90,387 64,846 188,000 64,846 150,000 85,154 131.3 Pick-up Taxes 3,523 5,298 0 5,299 5,500 201 3.8 Payments in Lieu of Taxes - Local Utilities 200,397 211,881 200,000 211,881 215,000 3,119 1.5 Payments in Lieu of Taxes - Other 15,642 17,765 15,000 17,765 18,000 235 1.3 Local Option Sales Tax 17,153,237 20,211,129 18,155,388 21,454,234 21,545,087 90,853 0.4 Business Tax 386,343 443,078 385,000 443,078 443,000 (78) (0.0) Bank Excise Tax 81,318 79,248 80,000 79,248 80,000 752 0.9 TOTAL LOCAL TAXES 30,384,810 33,727,854 31,536,992 35,438,225 35,323,237 (114,988) (0.3) LICENSES AND PERMITS Marriage Licenses 1,685 1,650 1,500 1,650 1,500 (150) (9.1) TOTAL LICENSES AND PERMITS 1,685 1,650 1,500 1,650 1,500 (150) (9.1) CHARGES FOR SERVICES Tuition - Regular Day Students 257,138 281,872 250,000 240,000 250,000 10,000 4.2 Tuition - Online Learning 275 3,925 0 6,300 0 (6,300) (100.0) Tuition - Educare & ECLC 2,061,871 1,622,371 1,364,660 1,622,371 1,408,800 (213,571) (13.2) Other Charges for Services 29,629 42,438 41,000 34,000 41,000 7,000 20.6 TOTAL CHARGES FOR SERVICES 2,348,913 1,950,606 1,655,660 1,902,671 1,699,800 (202,871) (10.7) OTHER LOCAL REVENUE Interest Earned 85,791 0 0 0 0 0 0.0 Lease/Rentals 2,500 83,480 0 0 0 0 0.0 Retiree's Insurance Payments 86,919 19,212 15,000 15,000 15,000 0 0.0 Miscellaneous Refunds 245,271 147,200 0 92,000 0 (92,000) (100.0) Contributions and Gifts 26,368 25,321 10,000 13,001 10,000 (3,001) (23.1) Other Local Revenue 841 447 1,000 289 1,000 711 246.0 TOTAL OTHER LOCAL REVENUE 447,690 275,660 26,000 120,290 26,000 (94,290) (78.4) STATE EDUCATION FUNDS Basic Education Program 34,745,962 35,352,280 35,883,000 36,025,000 0 (36,025,000) (100.0) Tennessee Investment in Student Achievement 0 0 0 0 44,700,000 44,700,000 100.0 Career Ladder 141,763 109,284 97,500 105,507 89,279 (16,228) (15.4) Driver Education 5,221 10,166 9,000 10,000 9,000 (1,000) (10.0) Mixed Drink Tax 2,685 3,200 0 3,500 3,500 0 0.0 Other State Education Funds 81,664 0 0 0 0 0 0.0 TOTAL STATE EDUCATION FUNDS 34,977,295 35,474,930 35,989,500 36,144,007 44,801,779 8,657,772 24.0 DIRECT FEDERAL GOVERNMENT Other Federal through State 235,545 0 0 0 0 0 0.0 ROTC Reimbursement 46,371 17,032 0 50,000 50,000 0 0.0 TOTAL DIRECT FEDERAL GOVERNMENT 281,916 17,032 0 50,000 50,000 0 0.0 OTHER SOURCES - TRANSFERS IN School Funds 0 408,378 0 0 0 0 0.0 Sale of Equipment 0 50 0 0 0 0 0.0 City General Fund Transfer - Operations 10,876,736 11,626,736 11,626,736 11,626,736 11,626,736 0 0.0 City General Fund Transfer - Transportation 2,014,855 2,266,075 2,429,715 2,429,715 2,909,423 479,708 19.7 TOTAL OTHER SOURCES - TRANSFERS IN 12,891,591 14,301,239 14,056,451 14,056,451 14,536,159 479,708 3.4 TOTAL GENERAL PURPOSE SCHOOL FUND REVENUE 81,333,900 85,748,971 83,266,103 87,713,294 96,438,475 8,725,181 9.9 FUND BALANCE APPROPRIATION 2,931,514 1,291,135 1,291,135 0.0 TOTAL REVENUES 81,333,900 85,748,971 86,197,617 87,713,294 97,729,610 10,016,316 11.4
SCHOOL FUND REVENUE SUMMARY
GENERAL PURPOSE
GENERAL PURPOSE SCHOOL FUND REVENUE SUMMARY
49 Actual Actual Budget Projected Budget Bdgt. 24 % FY 2021 FY 2022 FY 2023 FY 2023 FY 2024 vs. Proj. 23 Change REVENUES Charges for Services 89,060 185,659 704,850 1,088,600 688,600 (400,000) (36.7) Other Local Revenue 44,513 28,806 5,000 43,000 45,000 2,000 4.7 State Matching Food Service Funds 33,108 37,453 35,000 38,232 35,000 (3,232) (8.5) Federal Funds Through State 3,187,713 4,991,900 3,866,450 2,872,766 3,100,000 227,234 7.9 TOTAL REVENUES 3,354,394 5,243,818 4,611,300 4,042,598 3,868,600 (173,998) (4.3) EXPENDITURES School Food Service 3,228,209 3,567,955 4,267,800 3,599,132 3,800,232 201,100 5.6 Capital Outlay 46,589 1,884 343,500 233,393 68,368 (165,025) (70.7) TOTAL EXPENDITURES 3,274,798 3,569,839 4,611,300 3,832,525 3,868,600 36,075 0.9 Excess (Deficiency) of Revenues Over (Under) Expenditures 79,596 1,673,979 0 210,073 0 (210,073) (100.0) FUND BALANCE (BEGINNING) 2,109,743 2,198,090 3,244,268 3,726,292 3,936,365 210,073 5.6 Purchase Method Inventory Adj. 8,751 (145,777) 0 0 0 0 0.0 FUND BALNCE (ENDING) 2,198,090 3,726,292 3,244,268 3,936,365 3,936,365 0 0.0
JOHNSON CITY, TENNESSEE CITY SCHOOL SYSTEM SCHOOL FOOD SERVICES FUND SUMMARY
JOHNSON CITY, TENNESSEE CITY SCHOOL SYSTEM SCHOOL FOOD SERVICES FUND SUMMARY
JOHNSON
50 Actual Actual Budget Projected Budget Bdgt. 24 % FY 2021 FY 2022 FY 2023 FY 2023 FY 2024 vs. Proj. 23 Change REVENUES Federal Funds Direct and through State 8,216,330 13,507,627 21,678,240 12,593,524 10,389,796 (2,203,728) (17.5) TOTAL REVENUES 8,216,330 13,507,627 21,678,240 12,593,524 10,389,796 (2,203,728) (17.5) EXPENDITURES Title 1 1,683,861 1,669,594 1,991,388 1,730,218 2,210,736 480,518 27.8 Title 1 Carryover 133,958 160,448 575,819 199,210 161,501 (37,709) (18.9) Title 1-D 25,808 23,330 28,470 26,435 24,917 (1,518) (5.7) Title I-D Carryover 0 14,670 12,894 8,165 2,632 (5,533) (67.8) Title II 233,134 260,724 283,402 238,105 371,798 133,693 56.1 Title II Carryover 50,341 51,091 106,951 70,771 73,077 2,306 3.3 Title III 27,329 4,115 39,813 21,489 44,774 23,285 108.4 Title III Carryover 23,981 18,742 36,278 35,639 19,043 (16,596) (46.6) Title IV 78,053 105,420 146,850 106,802 151,496 44,694 41.8 Title IV Carryover 63,779 54,994 56,161 37,318 32,476 (4,842) (13.0) 21st Century (Grant 1) 45,693 97,077 158,000 70,917 0 (70,917) (100.0) 21st Century (Grant 1) Carryover 48,013 113,489 50,000 61,717 87,877 26,160 42.4 21st Century (Grant 2) 0 0 0 149,651 149,651 0 0.0 McKinney Homeless 94,700 86,628 96,000 64,320 96,000 31,680 49.3 Carl Perkins 133,874 140,327 131,560 (96,588) 131,560 228,148 (236.2) Carl Perkins Reserve 0 0 0 45,000 250,000 205,000 455.6 IDEA 1,221,027 1,376,286 1,703,244 1,587,952 1,732,359 144,407 9.1 IDEA Carryover 290,391 470,520 641,703 326,958 246,658 (80,300) (24.6) IDEA Discretionary 6,393 0 0 0 0 0 0.0 IDEA Technology Partnership 5,332 0 0 0 0 0 0.0 IDEA Preschool 44,747 57,247 47,997 44,016 50,292 6,276 14.3 IDEA Preschool Carryover 11,911 2,201 0 0 6,276 6,276 100.0 ESSER 1,513,634 2,712 0 0 0 0 0.0 ESSER 2.0 2,136,497 1,487,201 5,270,611 2,559,395 0 (2,559,395) (100.0) ESSER 3.0 205,882 5,697,407 9,665,916 3,600,000 4,383,405 783,405 21.8 LEA Reopening & Programmatic Support 100,000 0 0 0 0 0 0.0 Internet Connectivity 56,250 0 0 0 0 0 0.0 ARP Homeless 1.0 0 18,196 0 11,804 0 (11,804) (100.0) ARP Homeless 2.0 0 88,545 0 14,784 0 (14,784) (100.0) ARP IDEA Part B 0 68,381 0 180,000 189,268 9,268 5.1 Literacy Training Stipend 0 153,164 0 0 0 0 0.0 Civics Grant 0 7,000 0 0 0 0 0.0 Epidemiology & Laboratory Capacity 0 1,324,352 661,183 1,244,623 0 (1,244,623) (100.0) TOTAL EXPENDITURES 8,234,588 13,553,861 21,704,240 12,338,702 10,415,796 (1,922,906) (15.6) Excess (Deficiency) of Revenues Over (Under) Expenditures (18,258) (46,234) (26,000) 254,822 (26,000) (280,822) (110.2) OTHER FINANCING SOURCES (USES) Transfer In 1,174,722 46,238 26,000 26,000 26,000 0 0.0 Transfer Out 0 (408,378) 0 0 0 0 0.0 TOTAL OTHER FINANCING SOURCES (US 1,174,722 (362,140) 26,000 26,000 26,000 0 0.0 NET CHANGE IN FUND BALANCE 1,156,464 (408,374) 0 280,822 0 (280,822) (100.0) FUND BALANCE (BEGINNING) 46,438 1,202,902 1,202,902 794,528 1,075,350 280,822 35.3 FUND BALANCE (ENDING) 1,202,902 794,528 1,202,902 1,075,350 1,075,350 0 0.0
JOHNSON CITY, TENNESSEE CITY SCHOOL SYSTEM SCHOOL FEDERAL PROJECTS FUND
CITY, TENNESSEE CITY SCHOOL SYSTEM SCHOOL FEDERAL PROJECTS FUND
51 Actual Actual Budget Projected Budget Bdgt. 24 % FY 2021 FY 2022 FY 2023 FY 2023 FY 2024 vs. Proj. 23 Change REVENUES Federal Funds Direct and through State 1,453,946 1,647,557 643,623 1,449,973 3,126,073 1,676,100 115.6 TOTAL REVENUES 1,453,946 1,647,557 643,623 1,449,973 3,126,073 1,676,100 115.6 EXPENDITURES Lottery Pre-K 345,527 398,649 350,000 415,971 416,000 29 0.0 Family Resource Center 29,612 29,612 29,612 29,612 29,612 0 0.0 Safe Schools 99,090 33,639 133,550 131,370 0 (131,370) (100.0) Safe Schools Carryover 0 75,589 0 99,411 0 (99,411) (100.0) Indian Trail Stem 10,000 9,418 0 0 0 0 0.0 Learning Camps 887,269 1,000,650 0 693,148 700,000 6,852 1.0 Coordinated School Health 132,440 132,440 132,440 132,440 0 (132,440) (100.0) Innovative School Models 0 0 0 0 2,000,000 2,000,000 100.0 Learning Camps Transportation 0 0 50,000 0 0 0 0.0 TOTAL EXPENDITURES 1,503,938 1,679,997 695,602 1,501,952 3,145,612 1,643,660 109.4 Excess (Deficiency) of Revenues Over ( Under) Expenditures (49,992) (32,440) (51,979) (51,979) (19,539) 32,440 (62.4) OTHER FINANCIAL SOURCES (USES) Transfer In 49,990 41,120 51,979 51,979 19,539 (32,440) (62.4) Transfer Out (44,455) 0 0 0 0 0 0.0 Total Other Financing Sources (Uses) 5,535 41,120 51,979 51,979 19,539 (32,440) (62.4) NET CHANGE IN FUND BALANACE (44,457) 8,680 0 0 0 0 0.0 FUND BALANCE (BEGINNING) 44,457 0 0 8,680 8,680 0 0.0 FUND BALNCE (ENDING) 0 8,680 0 8,680 8,680 0 0.0
JOHNSON CITY, TENNESSEE CITY SCHOOL SYSTEM SCHOOL SPECIAL PROJECTS FUND
JOHNSON CITY, TENNESSEE CITY SCHOOL SYSTEM SCHOOL SPECIAL PROJECTS FUND
CAPITAL EQUIPMENT FUND SUMMARY
CAPITAL EQUIPMENT FUND SUMMARY
52 Actual Actual Budget Projected Budget Bdgt. 24 % FY 2021 FY 2022 FY 2023 FY 2023 FY 2024 vs. Proj. 23 Change REVENUES State Grant 0 747,007 0 0 0 0 0.0 Other 10,000 0 0 0 0 0 0.0 TOTAL REVENUES 10,000 747,007 0 0 0 0 0.0 EXPENDITURES Communications & Marketing 0 0 40,000 48,052 9,400 (38,652) (80.4) Development Services 0 52,976 25,000 25,000 60,000 35,000 140.0 Facilities Management 0 0 40,000 49,456 0 (49,456) (100.0) Fire 504,847 1,712,602 271,500 1,174,641 884,000 (290,641) (24.7) Freedom Hall 0 0 18,000 18,000 60,000 42,000 233.3 Information Technology 1,583,410 2,155,674 224,300 938,924 403,500 (535,424) (57.0) Parks & Recreation 10,879 243,052 324,000 103,593 283,000 179,407 173.2 Police 650,610 441,465 818,280 832,195 990,447 158,252 19.0 Public Works 175,081 212,731 850,000 1,017,602 809,920 (207,682) (20.4) Risk Management 0 0 0 0 34,000 34,000 100.0 Student Transportation 808,088 0 0 0 620,000 620,000 100.0 Miscellaneous Equipment 0 3,500 0 50,627 0 (50,627) (100.0) TOTAL EXPENDITURES 3,732,915 4,822,000 2,611,080 4,258,090 4,154,267 (103,823) (2.4) Excess (Deficiency) of Revenues Over (Under) Expenditures (3,722,915) (4,074,993) (2,611,080) (4,258,090) (4,154,267) 103,823 (2.4) OTHER FINANCING SOURCES (USES) Bond Proceeds 3,583,867 0 0 0 0 0 0.0 General Fund 2,150,088 3,776,751 2,611,080 2,611,080 3,564,267 953,187 36.5 Other Transfers 136,426 0 0 0 0 0 0.0 TOTAL OTHER FINANCING SOURCES (U 5,870,381 3,776,751 2,611,080 2,611,080 3,564,267 953,187 36.5 NET CHANGE IN FUND BALANCE 2,147,466 (298,242) 0 (1,647,010) (590,000) 1,057,010 (64.2) FUND BALANCE (BEGINNING) 933,655 3,081,121 509,286 2,782,879 1,135,869 (1,647,010) (59.2) FUND BALANCE (ENDING) 3,081,121 2,782,879 509,286 1,135,869 545,869 (590,000) (51.9) *NOTE: $590,000 was taken from the Capital Equipment Fund balance for school transportation vehicles originally budgeted in FY 23.
CAPITAL PROJECTS FUND SUMMARY (Facilities and Infrastructure)
53 Actual Actual Budget Projected Budget Bdgt. 24 % FY 2021 FY 2022 FY 2023 FY 2023 FY 2024 vs. Proj. 23 Change REVENUES Federal 0 0 14,715,440 11,115,440 1,800,000 (9,315,440) (83.8) State of Tennessee 190,543 792,502 1,000,000 4,631,919 1,000,000 (3,631,919) (78.4) Interest 102,108 48,683 0 0 0 0 0.0 Other 232,816 119,447 25,000 25,000 0 (25,000) (100.0) TOTAL REVENUES 525,467 960,632 15,740,440 15,772,359 2,800,000 (12,972,359) (82.2) EXPENDITURES Facilities Projects Athletic Complex 2,988 1,235,667 17,090,391 17,090,391 0 (17,090,391) (100.0) Ashe Street Courthouse 0 368,081 0 4,631,919 0 (4,631,919) (100.0) Carver Bleachers 0 0 0 0 50,000 50,000 100.0 Carver Splash Pad 395,240 0 0 0 0 0 0.0 Carver Restrooms 13,244 0 0 0 0 0 0.0 Convention and Visitors Bureau 755,178 0 0 0 0 0.0 Fire Station Improvements 0 42,317 500,000 0 575,000 575,000 100.0 Fire Station Relocation 0 0 5,000,000 0 5,000,000 5,000,000 100.0 Fire Training Center 0 0 3,000,000 0 3,000,000 3,000,000 100.0 Freedom Hall Improvements 8,381 212,745 1,078,000 1,259,000 60,000 (1,199,000) (95.2) Golf Course Improvements 0 0 0 400,000 0 (400,000) (100.0) Juvenile Court 0 0 0 0 20,000 20,000 100.0 Keefauver Farm Master Plan 0 22,500 0 0 0 0 0.0 King Commons Sesquicentennial Legacy Project 407,094 269,349 0 0 0 0 0.0 Kiwanis Park Pavilion 0 0 225,000 225,000 0 (225,000) (100.0) Langston Improvements 0 0 0 100,000 0 (100,000) (100.0) Memorial Park Community Center 38,790 0 0 0 0 0 0.0 Metro-Kiwanis Tennis Courts 0 0 0 0 545,000 545,000 100.0 Municipal Building Improvements 85,277 0 1,147,000 1,147,000 100,000 (1,047,000) (91.3) Parks & Recreation Playgrounds 0 0 150,000 150,000 0 (150,000) (100.0) Public Library Improvements 0 0 0 0 40,000 40,000 100.0 Police Training Complex 0 0 700,000 0 700,000 700,000 100.0 Rotary Park Restrooms 37,427 0 0 0 0 0 0.0 TVA Credit Union Park Improvements 0 0 415,440 0 415,440 415,440 100.0 TOTAL FACILITIES PROJECTS 988,441 2,905,837 29,305,831 25,003,310 10,505,440 (14,497,870) (58.0) Infrastructure Projects Broadband Investment (Brightridge) 0 0 2,300,000 0 0 0 0.0 Cherokee Street Extension 0 0 600,000 0 600,000 600,000 100.0 Christian Church Road 0 0 0 0 100,000 100,000 100.0 Downtown Crosswalk Lighting 0 0 1,000,000 0 1,200,000 1,200,000 100.0 Downtown Cameras 0 0 0 0 265,000 265,000 100.0 Gray Station/SR 75 Intersection 0 0 0 0 1,400,000 1,400,000 100.0 Intersection Improvements 0 350,000 0 0 0 0 0.0 Knob Creek Road Overpass 18,750 542,120 0 0 200,000 200,000 100.0 Lark Street Extension 57,511 0 0 0 0 0 0.0 Oakland/Mountainview Rd. Improvements 0 14,993 2,500,000 0 2,500,000 2,500,000 100.0 Parking Lot at Boone and Main Street 0 0 0 0 100,000 100,000 100.0 State of Franklin/Knob Creek Road Improvements 0 0 750,000 750,000 0 (750,000) (100.0) Traffic Signals 70,884 0 1,300,000 0 600,000 600,000 100.0 West Walnut Street Improvements 241,162 4,362,004 20,004,372 5,004,372 15,000,000 9,995,628 199.7 Winged Deer Park Access Road 41,340 241,833 300,000 150,000 150,000 0 0.0 TOTAL INFRASTRUCTURE PROJECTS 429,647 5,510,950 28,754,372 5,904,372 22,115,000 16,210,628 274.6 TOTAL EXPENDITURES - ALL PROJECTS 1,418,088 8,416,787 58,060,203 30,907,682 32,620,440 1,712,758 5.5 Excess (Deficiency) of Revenues Over (Under) Expenditures (892,621) (7,456,155) (42,319,763) (15,135,323) (29,820,440) (14,685,117) 97.0 OTHER FINANCING SOURCES (USES) General Fund 38,790 3,981,815 1,797,000 2,812,000 1,855,000 (957,000) (34.0) Bond Proceeds 2,007,496 43,762,021 0 0 0 0 0.0 Economic Development Reserve 0 0 0 0 0 0.0 Other Funds - Transfer In 645,893 0 0 0 0 0.0 Other Funds - Transfer (Out) (937,375) 0 0 0 0 0.0 TOTAL OTHER FINANCING SOURCES (USES) 1,754,804 47,743,836 1,797,000 2,812,000 1,855,000 (957,000) (34.0) NET CHANGE IN FUND BALANCE 862,183 40,287,681 (40,522,763) (12,323,323) (27,965,440) (15,642,117) 126.9 FUND BALANCE (BEGINNING) 3,708,610 4,803,850 45,284,613 44,934,278 32,610,955 (12,323,323) (27.4) ADJUSTMENTS 233,057 (157,253) CAPITAL PROJECTS FUND SUMMARY (Facilities and Infrastructure) Actual Actual Budget Projected Budget Bdgt. 24 % FY 2021 FY 2022 FY 2023 FY 2023 FY 2024 vs. Proj. 23 Change FUND BALANCE (ENDING) 4,803,850 44,934,278 4,761,850 32,610,955 4,645,515 (27,965,440) (85.8) *NOTE: Monies drawn from the Capital Projects Fund balance are bond proceeds for ongoing projects issued in prior years.
CAPITAL PROJECTS - SCHOOLS FUND SUMMARY
CAPITAL PROJECTS - SCHOOLS FUND SUMMARY
54 Actual Actual Budget Projected Budget Bdgt. 24 % FY 2021 FY 2022 FY 2023 FY 2023 FY 2024 vs. Proj. 23 Change REVENUES Other 0 0 0 0 0 0 0.0 TOTAL REVENUES 0 0 0 0 0 0 0.0 EXPENDITURES Football Stadium 23,120 440,185 0 0 0 0 0.0 Indian Trail Intermediate School Expansion 1,319,949 107,785 0 0 0 0 0.0 Indian Trail Field Turf 0 6,067 1,100,000 1,100,000 0 (1,100,000) (100.0) Johnson City Public Library Improvements 87,705 0 0 0 0 0 0.0 Message Board at SHHS 0 0 0 47,375 0 (47,375) (100.0) School Classroom Additions 2,752,444 10,325,412 700,000 5,254,064 0 (5,254,064) (100.0) School Maintenance Facility 229,379 0 0 0 0 0 0.0 School Roof Replacements 59,723 0 0 0 0 0 0.0 SHHS Track Turf 0 1,802 300,000 357,964 0 (357,964) (100.0) Liberty Bell SHHS 8/9 Campus 1,670,256 0 0 0 0 0 0.0 Other Misc. Projects 106,000 0 0 346,936 0 (346,936) (100.0) Stabilization of the Bank @ SHHS 0 0 0 0 0 0 0.0 Towne Acres Elementary School 0 0 0 0 2,000,000 2,000,000 100.0 TOTAL EXPENDITURES 6,248,576 10,881,251 2,100,000 7,106,339 2,000,000 (5,106,339) (71.9) Excess (Deficiency) of Revenues Over (Under) Expenditures (6,248,576) (10,881,251) (2,100,000) (7,106,339) (2,000,000) 5,106,339 (71.9) OTHER FINANCING SOURCES (USES) General Fund 0 455,109 0 0 0 0 0.0 Transfers In 378,668 3,853,787 0 1,346,720 0 (1,346,720) (100.0) Transfers (Out) (378,668) 0 0 0 0 0 0.0 Bond Proceeds 17,093,951 2,116,049 0 0 40,000,000 40,000,000 100.0 TOTAL OTHER FINANCING SOURCES (USES) 17,093,951 6,424,945 0 1,346,720 40,000,000 38,653,280 2,870.2 NET CHANGE IN FUND BALANCE 10,845,375 (4,456,306) (2,100,000) (5,759,619) 38,000,000 43,759,619 (759.8) FUND BALANCE (BEGINNING) 0 10,612,318 2,192,318 6,156,012 396,393 (5,759,619) (93.6) ADJUSTMENTS (233,057) FUND BALANCE (ENDING) 10,612,318 6,156,012 92,318 396,393 38,396,393 38,000,000 9,586.4 *NOTE: $40 Million bond issued in FY 24 for the new Town Acres Elementary. This is a X-year project, with architecture and design budgeted in FY 24.
$40 Million bond issued in FY 24 for the new Town Acres Elementary. This is a 4-year project, with architecture and design budgeted in FY 24.
*NOTE:
COMMUNITY DEVELOPMENT FUND SUMMARY
COMMUNITY DEVELOPMENT FUND SUMMARY
55 Actual Actual Budget Projected Budget Bdgt. 24 % FY 2021 FY 2022 FY 2023 FY 2023 FY 2024 vs. Proj. 23 Change REVENUES Community Development Block Grant Entitlement 839,724 770,625 760,000 760,000 585,880 (174,120) (22.9) CDBG Entitlement - Prior Year 390 0 0 0 0 0 0.0 Emergency Shelter Grant 161,250 281,318 161,250 161,250 134,375 (26,875) (16.7) Other 41,938 9,328 0 0 0 0 0.0 TOTAL REVENUES 1,043,302 1,061,271 921,250 921,250 720,255 (200,995) (21.8) EXPENDITURES Housing Rehabilitation 239,611 375,198 680,000 680,000 483,000 (197,000) (29.0) Public Facility 291,256 0 0 0 0 0 0.0 Other Programs 515,330 604,649 161,250 161,250 134,375 (26,875) (16.7) Administration 80,451 122,151 80,000 80,000 102,880 22,880 28.6 TOTAL EXPENDITURES 1,126,648 1,101,998 921,250 921,250 720,255 (200,995) (21.8) Excess (Deficiency) of Revenues Over (Under) Expenditures (83,346) (40,727) 0 0 0 0 0.0 Other Financing Sources (Uses) Transfer In (Out) - General Fund 471,004 (141,335) 0 0 0 0 0.0 TOTAL OTHER FINANCING SOURCES (USES) 471,004 (141,335) 0 0 0 0 0.0 NET CHANGE IN FUND BALANCE 387,658 (182,062) 0 0 0 0 0.0 FUND BALANCE (BEGINNING) 188,122 575,780 575,780 393,718 393,718 0 0.0 FUND BALNCE (ENDING) 575,780 393,718 575,780 393,718 393,718 0 0.0
*NOTE: Draw on fund balance due to capital outlay, which includes unmarked police vehicles and a data analysis system.
56 Actual Actual Budget Projected Budget Bdgt. 24 % FY 2021 FY 2022 FY 2023 FY 2023 FY 2024 vs. Proj. 23 Change REVENUES Fines & Forfeitures 22,248 393,029 100,000 100,000 100,000 0 0.0 Other 808,178 24,778 15,000 15,000 15,000 0 0.0 TOTAL REVENUES 830,426 417,807 115,000 115,000 115,000 0 0.0 EXPENDITURES Operating 107,668 89,152 100,000 100,000 100,000 0 0.0 Capital Outlay 0 247,266 124,400 124,400 129,000 4,600 3.7 TOTAL EXPENDITURES 107,668 336,418 224,400 224,400 229,000 4,600 2.0 Excess (Deficiency) of Revenues Over (Under) Expenditures 722,758 81,389 (109,400) (109,400) (114,000) (4,600) 4.2 OTHER FINANCING SOURCES Operating Transfers Out 0 (11,627) 0 0 0 0 0.0 TOTAL OTHER FINANCING SOURCES 0 (11,627) 0 0 0 0 0.0 FUND BALANCE (BEGINNING) 308,579 1,031,337 1,070,237 1,101,099 991,699 (109,400) (9.9) FUND BALNCE (ENDING) 1,031,337 1,101,099 960,837 991,699 877,699 (114,000) (11.5)
DRUG FUND DRUG FUND
57 Actual Actual Budget Projected Budget Bdgt. 24 % FY 2021 FY 2022 FY 2023 FY 2023 FY 2024 vs. Proj. 23 Change REVENUES Ticket Sales 208 1,315,317 925,000 975,000 863,000 (112,000) (11.5) Building Rental and Surcharge 31,623 206,846 140,000 138,000 165,000 27,000 19.6 Concessions 2,362 100,782 90,000 85,000 90,000 5,000 5.9 Novelty Sales 0 30,828 25,000 25,000 25,000 0 0.0 Other 41,383 1,229,050 217,500 180,000 240,500 60,500 33.6 Parking 10,208 104,487 80,000 80,000 75,000 (5,000) (6.3) TOTAL REVENUES 85,784 2,987,310 1,477,500 1,483,000 1,458,500 (24,500) (1.7) EXPENDITURES Administration 246,368 311,437 385,188 385,188 400,413 15,225 4.0 Shows 25,163 1,590,767 931,113 975,000 928,138 (46,862) (4.8) Maintenance 270,153 459,307 484,140 484,140 497,935 13,795 2.8 Concessions 6,462 40,076 41,112 41,112 37,872 (3,240) (7.9) Parking 240 11,768 11,700 11,700 11,200 (500) (4.3) Capital Outlay - Equipment 0 9,000 0 0 0 0 0.0 TOTAL EXPENDITURES 548,386 2,422,355 1,853,253 1,897,140 1,875,558 (21,582) (1.1) Excess (Deficiency) of Revenues Over (Under) Expenditures (462,602) 564,955 (375,753) (414,140) (417,058) (2,918) 0.7 OTHER FINANCING SOURCES (USES) General Fund 429,783 320,810 360,000 360,000 417,100 57,100 15.9 TOTAL OTHER FINANCING SOURCES (US 429,783 320,810 360,000 360,000 417,100 57,100 15.9 NET CHANGE IN FUND BALANCE (32,819) 885,765 (15,753) (54,140) 42 54,182 (100.1) FUND BALANCE (BEGINNING) 52,971 20,152 27,447 905,917 851,777 (54,140) (6.0) FUND BALANCE (ENDING) 20,152 905,917 11,694 851,777 851,819 42 0.0
FREEDOM HALL FUND SUMMARY
FREEDOM HALL FUND SUMMARY
58 Actual Actual Budget Projected Budget Bdgt. 24 % FY 2021 FY 2022 FY 2023 FY 2023 FY 2024 vs. Proj. 23 Change OPERATING REVENUES Federal Transit Administration 3,019,766 2,753,600 2,100,000 2,100,000 2,213,289 113,289 5.4 State - Operating 0 256,056 746,300 746,300 780,000 33,700 4.5 Passenger Fares 135,633 164,921 200,000 200,000 231,100 31,100 15.6 Service Contracts 8,200 9,500 10,800 10,800 10,800 0 0.0 ETSU 128,866 213,182 240,000 240,000 175,000 (65,000) (27.1) Freedom Grant 102,338 6,164 240,000 240,000 181,500 (58,500) (24.4) Other 35,244 27,371 40,000 40,000 76,500 36,500 91.3 TOTAL OPERATING REVENUES 3,430,047 3,430,794 3,577,100 3,577,100 3,668,189 91,089 2.5 OPERATING EXPENSES Administration 653,734 542,137 717,147 709,975 695,658 (14,317) (2.0) Operations 2,251,187 2,298,247 2,962,081 2,932,460 3,206,468 274,008 9.3 Job Access 192,511 155,796 294,380 291,436 354,608 63,172 21.7 Freedom Grant 194,546 93,937 154,851 153,302 182,462 29,160 19.0 ETSU Service 201,870 234,958 396,889 392,920 339,341 (53,579) (13.6) Demand Response 62,034 102,436 115,500 114,345 145,000 30,655 26.8 Depreciation 571,455 592,890 652,152 645,630 652,152 6,522 1.0 Other 87,273 60,512 0 0 0 0 0.0 TOTAL OPERATING EXPENSES 4,214,610 4,080,913 5,293,000 5,240,068 5,575,689 335,621 6.4 OPERATING INCOME (LOSS) (784,563) (650,119) (1,715,900) (1,662,968) (1,907,500) (244,532) 14.7 TRANSFERS AND CAPITAL CONTRIBUTIONS General Fund 700,249 748,528 961,000 961,000 1,079,348 118,348 12.3 FTA Capital Grant 916,711 276,544 366,750 366,750 335,000 (31,750) (8.7) State Capital Grant 722,400 9,287 50,000 50,000 45,000 (5,000) (10.0) 2,339,360 1,034,359 1,377,750 1,377,750 1,459,348 81,598 5.9 CHANGE IN NET POSITION 1,554,797 384,240 (338,150) (285,218) (448,152) (162,934) 57.1 NET POSITION (BEGINNING) 5,445,628 7,000,425 7,094,407 7,384,665 7,099,447 (285,218) (3.9) NET POSITION (ENDING) 7,000,425 7,384,665 6,756,257 7,099,447 6,651,295 (448,152) (6.3)
TOTAL TRANSFERS AND CAPITAL CONTRIBUTIONS
MASS TRANSIT FUND SUMMARY
MASS TRANSIT FUND SUMMARY
59 Actual Actual Budget Projected Budget Budget % FY 2021 FY 2022 FY 2023 FY 2023 FY 2024 24 vs. 23 Change Total Receipts 2,969,390 2,681,307 3,577,100 3,577,100 3,668,189 91,089 2.5 Total Operating Expenses 3,671,242 3,779,002 4,640,848 4,594,438 4,923,537 329,099 7.2 (less depreciation) Other Expenses Capital Equipment 1,547,061 9,663 410,000 206,000 204,000 (2,000) (1.0) Total Other Expenses 1,547,061 9,663 410,000 206,000 204,000 (2,000) (1.0) Total Operating and Other Expenses 5,218,303 3,788,665 5,050,848 4,800,438 5,127,537 327,099 6.8 Transfers and Capital Contributions General Fund 700,249 748,528 961,000 961,000 1,079,348 118,348 12.3 Grants - Federal & State Capital 1,552,742 354,066 416,750 416,750 380,000 (36,750) (8.8) Total Transfers and Capital Contributions 2,252,991 1,102,594 1,377,750 1,377,750 1,459,348 81,598 5.9 Net Increase (Decrease) in Cash & Cash Equivalents 4,078 (4,764) (95,998) 154,412 0 (154,412) (100.0) Cash & Cash Equivalents (Beginning) 3,120 7,198 688,332 2,434 156,846 154,412 6,344.0 Cash & Cash Equivalents (Ending) 7,198 2,434 592,334 156,846 156,846 0 0.0
MASS TRANSIT FUND CASH ANALYSIS SUMMARY
MASS TRANSIT FUND CASH ANALYSIS SUMMARY
POLICE GRANT FUND
60 Actual Actual Budget Projected Budget Bdgt. 24 % FY 2021 FY 2022 FY 2023 FY 2023 FY 2024 vs. Proj. 23 Change OPERATING REVENUES Federal Grants 137,434 133,212 157,406 157,406 159,500 2,094 1.3 TOTAL REVENUES 137,434 133,212 157,406 157,406 159,500 2,094 1.3 OPERATING EXPENSES Public Safety 137,973 122,723 157,406 169,062 159,500 (9,562) (5.7) TOTAL EXPENDITURES 137,973 122,723 157,406 169,062 159,500 (9,562) (5.7) Excess (Deficiency) of Revenues Over (Under) Expenditures (539) 10,489 0 (11,656) 0 11,656 (100.0) Other Financing Sources (Uses): General Fund 1,706 0 0 0 0 0 0.0 TOTAL OTHER FINANCING SOURCES (USES) 1,706 0 0 0 0 0 0.0 NET CHANGE IN FUND BALANCE 1,167 10,489 0 (11,656) 0 11,656 (100.0) FUND BALANCE (BEGINNING) 0 1,167 0 11,656 0 (11,656) (100.0) FUND BALNCE (ENDING) 1,167 11,656 0 0 0 0 0.0
POLICE GRANT FUND
POLICE TECHNOLOGY FUND
POLICE TECHNOLOGY FUND
*NOTE: The Johnson City Police Department is intentionally growing the fund balance to a healthy level after a significant reduction during the COVID 19 Pandemic.
*NOTE: The Johnson City Police Department is intentionally growing the fund balance to a healthy level, after a significant reduction during the COVID 19 Pandemic.
61 Actual Actual Budget Projected Budget Bdgt. 24 % FY 2021 FY 2022 FY 2023 FY 2023 FY 2024 vs. Proj. 23 Change REVENUES Fines and Forfeitures 169,855 253,235 260,000 260,000 260,000 0 0.0 TOTAL REVENUES 169,855 253,235 260,000 260,000 260,000 0 0.0 EXPENDITURES Operating Technology 236,443 157,766 212,104 212,104 188,074 (24,030) (11.3) TOTAL EXPENDITURES 236,443 157,766 212,104 212,104 188,074 (24,030) (11.3) Excess (Deficiency) of Revenues Over (Under) Expenditures (66,588) 95,469 47,896 47,896 71,926 24,030 50.2 FUND BALANCE (BEGINNING) 164,305 97,717 150,920 193,186 241,082 47,896 24.8 FUND BALANCE (ENDING) 97,717 193,186 198,816 241,082 313,008 71,926 29.8
SOLID WASTE MUNICIPAL FUND SUMMARY
62 Actual Actual Budget Projected Budget Bdgt. 24 % FY 2021 FY 2022 FY 2023 FY 2023 FY 2024 vs. Proj. 23 Change OPERATING REVENUES Residential 3,008,277 3,033,124 3,549,300 3,550,000 3,578,000 28,000 0.8 Commercial 3,130,301 3,259,101 3,386,500 3,596,140 3,668,100 71,960 2.0 Industrial 2,689,045 3,017,089 2,933,100 3,312,200 3,534,200 222,000 6.7 Recycling 474,003 891,419 613,000 505,000 495,000 (10,000) (2.0) Landfill Host Fee 292,562 310,836 315,000 315,000 315,000 0 0.0 Container Rental 1,012,100 1,108,929 1,264,900 1,319,100 1,354,500 35,400 2.7 Interest and Penalties 89,693 154,034 102,000 146,000 154,000 8,000 5.5 Other 271,534 208,502 374,200 323,500 493,060 169,560 52.4 TOTAL OPERATING REVENUE 10,967,515 11,983,034 12,538,000 13,066,940 13,591,860 524,920 4.0 OPERATING EXPENSES Administration 589,037 616,491 796,769 788,801 870,207 81,406 10.3 Residential 1,801,215 1,826,095 2,058,794 2,038,206 2,291,619 253,413 12.4 Commercial 1,858,691 2,020,589 2,209,858 2,187,759 2,404,405 216,646 9.9 Industrial 2,477,128 2,489,950 2,668,111 2,641,429 3,328,317 686,888 26.0 Recycling 1,035,313 1,104,451 1,233,966 1,221,626 1,370,303 148,677 12.2 Brush, Bulk, and Leaf Collection 1,237,112 1,236,073 1,657,052 1,640,481 1,829,733 189,252 11.5 Landfills 95,520 68,541 239,329 220,643 247,391 26,748 12.1 Depreciation 1,045,722 1,119,802 1,117,058 1,117,058 1,117,058 0 0.0 Other 427,063 445,153 512,154 512,154 611,484 99,330 19.4 TOTAL OPERATING EXPENSES 10,566,801 10,927,145 12,493,091 12,368,157 14,070,517 1,702,360 13.8 OPERATING INCOME (LOSS) 400,714 1,055,889 44,909 698,783 (478,657) (1,177,440) (168.5) TRANSFERS IN (OUT) Operating Transfers In: Regional Solid Waste Fund 156,466 167,557 179,572 179,572 199,192 19,620 10.9 Operating Transfers (Out): Water/Sewer Fund (112,272) (138,939) (139,607) (139,607) (147,807) (8,200) 5.9 TOTAL TRANSFERS IN (OUT) 44,194 28,618 39,965 39,965 51,385 11,420 28.6 CHANGE IN NET POSITION 444,908 1,084,507 84,874 738,748 (427,272) (1,166,020) (157.8) NET POSITION (BEGINNING) 12,133,176 12,578,084 12,257,973 13,662,591 14,401,339 738,748 5.4 NET POSITION (ENDING) 12,578,084 13,662,591 12,342,847 14,401,339 13,974,067 (427,272) (3.0)
SOLID WASTE MUNICIPAL FUND SUMMARY
SOLID WASTE MUNICIPAL FUND CASH ANALYSIS SUMMARY
SOLID WASTE MUNICIPAL FUND CASH ANALYSIS SUMMARY
63 Actual Actual Budget Projected Budget Bdgt. 24 % FY 2021 FY 2022 FY 2023 FY 2023 FY 2024 vs. Proj. 23 Change Total Receipts 11,085,510 11,952,236 12,538,000 13,066,940 13,591,860 524,920 4.0 Total Operating Expenses 10,857,550 10,190,644 11,376,033 11,251,099 12,953,459 1,702,360 15.1 (less depreciation) Other Expenses Capital Equipment/Projects 2,019,774 1,035,120 171,000 171,000 897,900 726,900 425.1 Debt - Principal 65,306 81,597 91,686 91,686 95,000 3,314 3.6 Total Other Expenses 2,085,080 1,116,717 262,686 262,686 992,900 730,214 278.0 Total Operating and Other Expenses 12,942,630 11,307,361 11,638,719 11,513,785 13,946,359 2,432,574 21.1 Transfers and Capital Contributions Bond Proceeds 1,003,614 0 0 0 0 0 0.0 Sale of Investments 121,192 0 0 0 0 0 0.0 Operating Transfers In 156,466 167,557 179,572 179,572 199,192 19,620 10.9 Operating Transfers (Out) (122,272) (138,939) (139,607) (139,607) (147,807) (8,200) 5.9 Total Transfers and Capital Contributions 1,159,000 28,618 39,965 39,965 51,385 11,420 28.6 Net Increase (Decrease) in Cash & Cash Equivalents (698,120) 673,493 939,246 1,593,120 (303,114) (1,896,234) (119.0) Cash & Cash Equivalents (Beginning) 4,081,436 3,383,316 3,593,011 4,056,809 5,649,929 1,593,120 39.3 Cash & Cash Equivalents (Ending) 3,383,316 4,056,809 4,532,257 5,649,929 5,346,815 (303,114) (5.4)
SOLID WASTE REGIONAL FUND SUMMARY
SOLID WASTE REGIONAL FUND SUMMARY
64 Actual Actual Budget Projected Budget Bdgt. 24 % FY 2021 FY 2022 FY 2023 FY 2023 FY 2024 vs. Proj. 23 Change OPERATING REVENUES Residential 2,902,546 3,075,819 3,170,000 3,200,000 3,351,200 151,200 4.7 Commercial 463,168 476,234 513,400 513,400 529,000 15,600 3.0 Interest and Penalties 38,873 62,734 50,000 50,000 50,000 0 0.0 Other 132,525 123,828 194,900 165,000 165,000 0 0.0 TOTAL OPERATING REVENUE 3,537,112 3,738,615 3,928,300 3,928,400 4,095,200 166,800 4.2 OPERATING EXPENSES Operations 2,429,344 2,578,292 2,736,761 2,736,761 3,247,829 511,068 18.7 Landfill 6,645 6,911 6,700 6,700 6,700 0 0.0 Depreciation 409,330 386,840 352,290 352,290 352,290 0 0.0 Other 112,085 116,017 125,149 125,149 176,869 51,720 41.3 TOTAL OPERATING EXPENSES 2,957,404 3,088,060 3,220,900 3,220,900 3,783,688 562,788 17.5 OPERATING INCOME (LOSS) 579,708 650,555 707,400 707,500 311,512 (395,988) (56.0) TRANSFERS IN (OUT) Municipal Solid Waste Fund (156,466) (167,557) (179,572) (179,572) (199,192) (19,620) 10.9 Water/Sewer Fund (59,513) (70,223) (73,063) (73,063) (77,355) (4,292) 5.9 TOTAL TRANSFERS IN (OUT) (215,979) (237,780) (252,635) (252,635) (276,547) (23,912) 9.5 CHANGE IN NET POSITION 363,729 412,775 454,765 454,865 34,965 (419,900) (92.3) NET POSITION (BEGINNING) 4,695,991 5,059,720 5,498,282 5,472,495 5,927,360 454,865 8.3 NET POSITION (ENDING) 5,059,720 5,472,495 5,953,047 5,927,360 5,962,325 34,965 0.6
65 Actual Actual Budget Projected Budget Bdgt. 24 % FY 2021 FY 2022 FY 2023 FY 2023 FY 2024 vs. Proj. 23 Change Total Receipts 3,536,124 3,739,772 3,928,300 3,928,400 4,095,200 166,800 4.2 Total Operating Expenses 2,554,537 2,821,157 2,868,610 2,868,610 3,431,398 562,788 19.6 (less depreciation) Other Expenses Capital Equipment 0 0 392,000 392,000 220,100 (171,900) (43.9) Total Other Expenses 0 0 392,000 392,000 220,100 (171,900) (43.9) Total Operating and Other Expenses 2,554,537 2,821,157 3,260,610 3,260,610 3,651,498 390,888 12.0 Transfers Operating Transfers (Out) (215,979) (237,780) (252,635) (252,635) (276,547) (23,912) 9.5 Total Transfers (215,979) (237,780) (252,635) (252,635) (276,547) (23,912) 9.5 Net Increase (Decrease) in Cash & Cash Equivalents 765,608 680,835 415,055 415,155 167,155 (248,000) (59.7) Cash & Cash Equivalents (Beginning) 1,990,092 2,755,700 3,434,932 3,436,535 3,851,690 415,155 12.1 Cash & Cash Equivalents (Ending) 2,755,700 3,436,535 3,849,987 3,851,690 4,018,845 167,155 4.3
SOLID WASTE REGIONAL FUND CASH ANALYSIS SUMMARY
SOLID WASTE REGIONAL FUND CASH ANALYSIS SUMMARY
STORM WATER FUND SUMMARY
STORM WATER FUND SUMMARY
66 Actual Actual Budget Projected Budget Bdgt. 24 % FY 2021 FY 2022 FY 2023 FY 2023 FY 2024 vs. Proj. 23 Change OPERATING REVENUES Storm Water Fees - Single Family 879,888 894,783 880,000 905,000 905,000 0 0.0 Storm Water Fees - Multi Family 447,889 458,059 448,000 460,000 460,000 0 0.0 Storm Water Fees - Other 1,815,974 1,838,790 1,820,000 1,900,000 1,900,000 0 0.0 Interest and Penalties 22,293 36,820 18,000 22,000 22,000 0 0.0 Other 34,033 1,882 2,000 2,000 2,000 0 0.0 TOTAL OPERATING REVENUE 3,200,077 3,230,334 3,168,000 3,289,000 3,289,000 0 0.0 OPERATING EXPENSES Operation 1,065,350 841,371 1,422,137 1,407,915 1,416,524 8,609 0.6 Depreciation 338,151 341,994 440,000 440,000 440,000 0 0.0 Other 380,067 440,608 574,064 574,064 578,617 4,553 0.8 TOTAL OPERATING EXPENSES 1,783,568 1,623,973 2,436,201 2,421,979 2,435,141 13,162 0.5 OPERATING INCOME (LOSS) 1,416,509 1,606,361 731,799 867,021 853,859 (13,162) (1.5) CHANGE IN NET POSITION 1,416,509 1,606,361 731,799 867,021 853,859 (13,162) (1.5) NET POSITION (BEGINNING) 11,761,902 13,178,411 14,149,894 14,784,772 15,651,793 867,021 5.9 NET POSITION (ENDING) 13,178,411 14,784,772 14,881,693 15,651,793 16,505,652 853,859 5.5
67 Actual Actual Budget Projected Budget Bdgt. 24 % FY 2021 FY 2022 FY 2023 FY 2023 FY 2024 vs. Proj. 23 Change Total Receipts 3,117,137 3,375,978 3,168,000 3,289,000 3,289,000 0 0.0 Total Operating Expenses 1,513,368 1,158,085 1,996,201 1,981,979 1,995,141 13,162 0.7 (less depreciation) Other Expenses Capital Equipment/Projects 589,999 3,726,252 4,991,000 3,250,000 1,900,000 (1,350,000) (41.5) Debt Service - Principal 250,000 338,000 456,000 456,000 449,000 (7,000) (1.5) Total Other Expenses 839,999 4,064,252 5,447,000 3,706,000 2,349,000 (1,357,000) (36.6) Total Operating and Other Expenses 2,353,367 5,222,337 7,443,201 5,687,979 4,344,141 (1,343,838) (23.6) Capital Contributions Bond Proceeds 3,011,245 3,017,574 3,000,000 3,000,000 0 (3,000,000) (100.0) Purchase of Investments (2,575,870) (3,000,000) 0 0 0 0 0.0 Capital Grants Received 30,840 35,915 0 0 0 0 0.0 Total Capital Contributions 466,215 53,489 3,000,000 3,000,000 0 (3,000,000) (100.0) Net Increase (Decrease) in Cash & Cash Equivalents 1,229,985 (1,792,870) (1,275,201) 601,021 (1,055,141) (1,656,162) (275.6) Cash & Cash Equivalents (Beginning) 2,416,982 3,646,967 3,970,450 1,854,097 2,455,118 601,021 32.4 Cash & Cash Equivalents (Ending) 3,646,967 1,854,097 2,695,249 2,455,118 1,399,977 (13,162) (0.5)
STORM WATER FUND CASH ANALYSIS SUMMARY STORM WATER FUND CASH ANALYSIS SUMMARY
TRANSPORTATION PLANNING FUND SUMMARY
68 Actual Actual Budget Projected Budget Bdgt. 24 % FY 2021 FY 2022 FY 2023 FY 2023 FY 2024 vs. Proj. 23 Change REVENUES Federal Government 203,598 385,123 279,546 279,546 326,222 46,676 16.7 TOTAL REVENUES 203,598 385,123 279,546 279,546 326,222 46,676 16.7 EXPENDITURES Highway and Transportation Planning 250,853 483,124 334,434 334,434 386,688 52,254 15.6 TOTAL EXPENDITURES 250,853 483,124 334,434 334,434 386,688 52,254 15.6 Excess (Deficiency) of Revenues Over ( Under) Expenditures (47,255) (98,001) (54,888) (54,888) (60,466) (5,578) 10.2 Other Financing Sources (Uses) General Fund 109,232 115,794 55,000 55,000 60,500 5,500 10.0 TOTAL OTHER FINANCING SOURCES (USES 109,232 115,794 55,000 55,000 60,500 5,500 10.0 NET CHANGE IN FUND BALANCE 61,977 17,793 112 112 34 (78) (69.6) FUND BALANCE (BEGINNING) 36,573 98,550 110,750 116,343 116,455 112 0.1 FUND BALANCE (ENDING) 98,550 116,343 110,862 116,455 116,489 34 0.0
TRANSPORTATION PLANNING FUND SUMMARY
69 Actual Actual Budget Projected Budget Bdgt. 24 % FY 2021 FY 2022 FY 2023 FY 2023 FY 2024 vs. Proj. 23 Change OPERATING REVENUES Water Sales 18,197,486 19,017,427 18,575,000 18,800,000 19,158,000 358,000 1.9 Sewer Fees 18,437,089 19,570,885 19,254,000 19,957,000 20,338,000 381,000 1.9 Penalties 340,919 589,534 470,000 470,000 470,000 0 0.0 Customer Service Charges 274,753 233,965 315,000 315,000 315,000 0 0.0 Water Tap Fees 549,225 739,962 471,000 650,000 471,000 (179,000) (27.5) Sewer Tap Fees 652,181 905,854 605,000 600,000 605,000 5,000 0.8 Other 587,683 2,060,908 515,200 582,900 547,300 (35,600) (6.1) TOTAL OPERATING REVENUE 39,039,336 43,118,535 40,205,200 41,374,900 41,904,300 529,400 1.3 OPERATING EXPENSES Administration 4,074,985 4,872,192 5,202,661 5,150,634 5,833,892 683,258 13.3 Water Operating Expenses 5,574,553 5,452,723 5,219,798 5,193,699 5,699,525 505,826 9.7 Sewer Operating Expenses 3,239,625 3,568,951 3,749,680 3,730,931 4,045,371 314,440 8.4 Water Line Extensions 0 0 1,785,277 1,776,350 1,924,050 147,700 8.3 Sewer Line Extensions 0 0 1,189,515 1,183,567 1,200,252 16,685 1.4 Water Treatment 2,559,260 2,684,544 3,119,079 3,103,483 3,348,153 244,670 7.9 Wastewater Treatment 4,292,307 4,406,260 4,418,448 4,396,355 4,874,671 478,316 10.9 Industrial Monitoring 294,667 260,618 326,638 325,004 348,017 23,013 7.1 Depreciation 6,605,385 6,632,850 6,993,691 6,680,000 6,719,426 39,426 0.6 Payment In-Lieu 700,000 750,000 800,000 800,000 800,000 0 0.0 Other 3,493,461 2,888,236 4,735,882 4,735,882 4,793,489 57,607 1.2 TOTAL OPERATING EXPENSES 30,834,243 31,516,374 37,540,669 37,075,905 39,586,846 2,510,941 6.8 OPERATING INCOME (LOSS) 8,205,093 11,602,161 2,664,531 4,298,995 2,317,454 (1,981,541) (46.1) TRANSFERS IN (OUT) Municipal Solid Waste Fund 112,272 138,939 139,607 139,607 147,807 8,200 5.9 Regional Solid Waste Fund 59,513 70,223 73,063 73,063 77,355 4,292 5.9 TOTAL TRANSFERS IN (OUT) 171,785 209,162 212,670 212,670 225,162 12,492 5.9 CHANGE IN NET POSITION 8,376,878 11,811,323 2,877,201 4,511,665 2,542,616 (1,969,049) (43.6) NET POSITION (BEGINNING) 141,074,709 149,451,587 154,837,669 161,262,910 165,774,575 4,511,665 2.8 NET POSITION (ENDING) 149,451,587 161,262,910 157,714,870 165,774,575 168,317,191 2,542,616 1.5
WATER/SEWER FUND SUMMARY WATER/SEWER FUND SUMMARY
WATER/SEWER FUND
SUMMARY
WATER/SEWER FUND
70 Actual Actual Budget Projected Budget Bdgt. 24 % FY 2021 FY 2022 FY 2023 FY 2023 FY 2024 vs. Proj. 23 Change Total Receipts 39,461,776 42,016,581 40,205,200 41,374,900 41,904,300 529,400 1.3 Total Operating Expenses 20,645,508 25,689,209 29,746,978 29,595,905 32,067,420 2,471,515 8.4 (less depreciation) Other Expenses Capital Equipment/Projects 17,948,106 36,605,874 42,986,000 30,276,000 26,873,000 (3,403,000) (11.2) Debt Service - Principal 3,802,705 3,926,761 4,632,259 4,632,259 4,788,740 156,481 3.4 Total Other Expenses 21,750,811 40,532,635 47,618,259 34,908,259 31,661,740 (3,246,519) (9.3) Total Operating and Other Expenses 42,396,319 66,221,844 77,365,237 64,504,164 63,729,160 (775,004) (1.2) Transfers In (Out) Payment In-Lieu (700,000) (750,000) (800,000) (800,000) (800,000) 0 0.0 Operating Transfers In 171,785 209,162 212,670 212,670 225,162 12,492 5.9 Transfers In (Out) (528,215) (540,838) (587,330) (587,330) (574,838) 12,492 (2.1) Capital Contributions Bond Funding 0 35,425,106 24,000,000 13,500,000 19,200,000 5,700,000 42.2 Other 0 2,369,274 13,500,000 10,300,000 3,200,000 (7,100,000) (68.9) Proceeds from Sale of Investments 4,321,383 0 0 0 0 0 0.0 Purchase of Investments 0 (22,004,545) 0 0 0 0 0.0 Total Capital Contributions 4,321,383 15,789,835 37,500,000 23,800,000 22,400,000 (1,400,000) (5.9) Net Increase (Decrease) in Cash & Cash Equivalents 858,625 (8,956,266) (247,367) 83,406 302 (83,104) (99.6) Cash & Cash Equivalents (Beginning) 29,274,179 30,132,804 21,176,538 21,176,538 21,259,944 83,406 0.4 Cash & Cash Equivalents (Ending) 30,132,804 21,176,538 20,929,171 21,259,944 21,260,246 302 0.0
CASH ANALYSIS SUMMARY
CASH ANALYSIS
FLEET MANAGEMENT FUNDFLEETSUMMARYMANAGEMENT FUND SUMMARY (Internal Service Fund)
(INTERNAL SERVICE FUND)
71 Actual Actual Budget Projected Budget Bdgt. 24 % FY 2021 FY 2022 FY 2023 FY 2023 FY 2024 vs. Proj. 23 Change OPERATING REVENUES Maintenance Services 6,708,748 8,319,251 9,470,189 9,381,760 10,473,442 1,091,682 11.6 Other 15,096 9,145 12,000 9,500 9,500 0 0.0 TOTAL OPERATING REVENUE 6,723,844 8,328,396 9,482,189 9,391,260 10,482,942 1,091,682 11.6 OPERATING EXPENSES Operations 546,808 506,720 787,983 780,103 839,027 58,924 7.6 Vehicles and Equipment 5,670,586 7,001,890 8,149,650 8,068,154 9,085,916 1,017,762 12.6 Communications 580,048 97,053 155,299 153,746 158,911 5,165 3.4 Depreciation 492,135 329,295 307,348 307,348 329,295 21,947 7.1 Other 41,494 70,925 81,909 81,909 69,793 (12,116) (14.8) TOTAL OPERATING EXPENSES 7,331,071 8,005,883 9,482,189 9,391,260 10,482,942 1,091,682 11.6 OPERATING INCOME (LOSS) (607,227) 322,513 0 0 0 0 0.0 NET POSITION (BEGINNING) 1,193,250 586,023 586,023 908,536 908,536 0 0.0 NET POSITION (ENDING) 586,023 908,536 586,023 908,536 908,536 0 0.0
CAPITAL
CAPITAL EQUIPMENT/PROJECTS FUNDS
Capital equipment purchases (General Fund) are budgeted at $4,154,267. This includes a $3,564,267 transfer from the General Fund and $590,000 in re-budgeted equipment, including five large school buses and two small school buses.
Major capital equipment purchases from the general fund are spread across multiple departments. Fire equipment totals $884,000. This is for one pumper truck, two administrative vehicles, ten air packs, a gear washer, and three thermal imaging cameras. Police equipment totals $990,447 and includes seventeen police patrol vehicles and an EOD x-ray system. Public Works includes $809,920 for equipment replacement (most of which is over twenty years old), and Information Technology has $403,500 for equipment. Parks and Recreation has $283,000 budget to replace equipment that has gone past its respective life span. Development Services, Freedom Hall, Risk Management, and Communications and Marketing have funds budgeted at $60,000, $60,000, $34,000, and $9,400, respectively, for capital equipment.
Budgeted capital equipment for other funds include the following:
• Mass Transit Fund - $204,000
• Police Drug Fund - $129,000
• Solid Waste Funds - $1,118,000
• Storm Water Fund - $250,000
• Water/Sewer Fund - $1,067,000
Capital facilities projects total $10,505,440, including $8,575,000 for fire station relocation and improvement, as well as a new fire training facility. Other facilities projects include the Police training facility, Metro-Kiwanis tennis courts, TVA Credit Union Park improvements, records and evidence renovations, Freedom Hall improvements, new bleachers at Carver Recreational Center, new flooring at the Johnson City Public Library, and security glass at juvenile court.
Infrastructure capital projects total $22,115,000, including $15,000,000 for the third year of construction for the West Walnut Street improvements project. Other infrastructure projects include Oakland/ Mountainview Road improvements, Gray Station/SR 75 intersection, and downtown crosswalk lighting.
Budgeted capital projects for other funds include the following:
• Storm Water Fund includes $1,650,000 in cash funds for the West Oakland Bridge, West Walnut Street holding pond mitigation, and Buffalo Valley streambank mitigation.
• Water/Sewer Fund capital projects total $25,806,000 made up of $3,406,000 rate (cash) funded, $19,200,000 bond funded, and $3,200,000 grant funded. Major projects include the advance water meter infrastructure, Knob Creek aeration rehabilitation, Boones Creek interceptor replacement, Walnut Street corridor utility improvements, and Knob Creek & CSX utility improvements.
School facility capital projects total $2,000,000, which is for the first year design and construction of a new Towne Acres Elementary School.
Please see the subsequent pages in this section for more detail on funding sources, etc., for capital equipment and projects for FY 2024.
73
GENERAL FUND
CAPITAL EQUIPMENT - FY 2024
74 Cost
Communications and Marketing Trailer 9,400 TOTAL COMMUNICATIONS AND MARKETING 9,400 Development Services Small SUV (2) 60,000 TOTAL DEVELOPMENT SERVICES 60,000 Fire Class A Pumper Engine 7 640,000 Scott Air Packs (10) 90,000 Gear Washer 30,000 Thermal Imaging Cameras (3) 30,000 2 Administrative Vehicles 94,000 TOTAL FIRE 884,000 Information Technology HPE DL380 Gen11 x 2 50,000 HPE StoreOnce 48TB Maintenance 24,000 Simplivity Server node 157,500 VoIP Upgrade and Replacement 172,000 TOTAL INFORMATION TECHNOLOGY 403,500 Parks and Recreation 5-Unit Tow Behind Gang Mower (Golf) 25,000 1-Ton Pickup 4dr 4wd 62,000 3/4-Ton Pick-up 4wd 48,000 72" 35hp Zero Turn Mowers (3) 45,000 Litterkat 9,000 Small SUV 30,000 Stand On Spreader Sprayer 12,000 Toro 2030 Infield Groomer (2) 30,000 Utility Vehicles (2) (Golf) 22,000 TOTAL PARKS AND RECREATION 283,000 Police EOD X-Ray System 25,000 Police Patrol Vehicles (17) 965,447 TOTAL POLICE 990,447 Public Works 1-Ton Extended Cab Utility Truck 4wd - Construction/Concrete 75,000 1-Ton Utility Truck 2wd - Traffic 62,000 Large SUV - Engineering/Surveying 60,000 Single Axle Dump Truck - Asphalt 213,700 Skid Steer - Asphalt 102,500 Small SUV - Traffic 30,000
CAPITAL EQUIPMENT - FY 2024
Other Equipment Funded through the General Fund
75 Cost
Tandem Dump Truck - Construction 266,720 TOTAL PUBLIC WORKS 809,920 Risk Management Small SUV 34,000 TOTAL RISK MANAGEMENT 34,000 Student Transportation Small School Buses (2) (re-budget) 120,000 Large School Buses (5) (re-budget) 470,000 Large School Buses (5) (additional funding) 30,000 TOTAL STUDENT TRANSPORTATION 620,000
Freedom Hall Truck with Liftgate 60,000 TOTAL FREEDOM HALL 60,000 TOTAL GENERAL FUND 4,154,267 MASS TRANSIT FUND ADA Minivans (2) 79,000 DVR Camera System 125,000 TOTAL MASS TRANSIT FUND 204,000 POLICE DRUG FUND Unmarked sedan (3) 111,000 PenLink System 18,000 TOTAL POLICE DRUG FUND 129,000 SOLID WASTE FUNDS Municipal Front Loader (2) 854,900 Pickup Truck 43,000 TOTAL MUNICIPAL SOLID WASTE FUND 897,900 Regional Rear Loader 220,100 TOTAL REGIONAL SOLID WASTE FUND 220,100 TOTAL SOLID WASTE FUNDS 1,118,000 STORM WATER FUND Tandem Axel Dump Truck 250,000 TOTAL STORM WATER FUND 250,000 WATER/SEWER FUND Sewer Vactor Truck 550,000 Ext. Cab 5400 LB 4WD Pick-up (1/2 ton) (4) 180,000
CAPITAL EQUIPMENT - FY 2024
FUNDING SUMMARY
76 Cost
Ext. Cab 4WD Pick-up (1/4 ton) (2) 72,000 Listening Gear (Leak Detection) 30,000 Large Fork Lift 65,000 Sewer E65 Mini-Ex 95,000 Sewer Flow Monitors (5) 35,000 SUV 40,000 TOTAL WATER/SEWER FUND 1,067,000 TOTAL CAPITAL EQUIPMENT 6,922,267 FEDERAL/STATE GRANTS (MASS TRANSIT) 204,000 GENERAL FUND General Fund 3,564,267 Capital Fund Balance 590,000 TOTAL GENERAL FUND 4,154,267 POLICE DRUG FUND 129,000 SOLID WASTE FUNDS 1,118,000 STORM WATER FUND 250,000 WATER/SEWER FUND 1,067,000 TOTAL CAPITAL EQUIPMENT 6,922,267
CAPITAL PROJECTS - FY 2024
77 Funding Source Cost GENERAL
Facilities Management Municipal Building 3rd Floor Renovations Design General Fund 100,000 TOTAL FACILITIES MANAGEMENT 100,000 Fire Fire Station Improvements (re-budget) Federal - ARPA 500,000 Fire Station Relocation (re-budget) Federal - ARPA 5,000,000 Fire Training Center (re-budget) Federal - ARPA 3,000,000 Post Steel Building Station 8 & 9 General Fund 75,000 TOTAL FIRE 8,575,000 Juvenile Court Security Glass General Fund 20,000 TOTAL JUVENILE COURT 20,000 Library Interior Floors 40,000 TOTAL LIBRARY General Fund 40,000 Freedom Hall Emergency Lighting General Fund 60,000 TOTAL FREEDOM HALL 60,000 Parks and Recreation TVA Credit Union Park (re-budget) Federal - ARPA 415,440 Carver Recreation Center Bleachers General Fund 50,000 Metro-Kiwanis Tennis Courts General Fund 545,000 TOTAL PARKS AND RECREATION 1,010,440 Police Police Training Complex Upgrades (re-budget) Federal - ARPA 700,000 TOTAL POLICE 700,000 Public Works Cherokee Street Extension (re-budget) Federal - ARPA 600,000 Christian Church Road (Design) General Fund 100,000 Downtown Cameras General Fund 265,000 Downtown Crosswalk Lighting Federal/State 1,000,000 General Fund 200,000 1,200,000 Gray Station/Bobby Hicks Intersection Federal/State 1,200,000 General Fund 200,000 1,400,000
FUND
78 Funding Source Cost Knob Creek Overpass Design General Fund 200,000 Oakland/Mountainview Improvements Bond Proceeds 2,500,000 Traffic Signals Federal/State 600,000 Roan/Market Streets Roan/Main Streets West Walnut Street Bond Proceeds 15,000,000 Boone/Main Parking Lot (carry-over) Capital Fund Balance 100,000 Winged Deer Park Access Road (carry-over) Capital Fund Balance 150,000 TOTAL PUBLIC WORKS 22,115,000 TOTAL GENERAL FUND PROJECTS 32,620,440 FLEET MANAGEMENT FUND Tank Replacement Fleet Management 216,000 UPS System Fleet Management 150,000 TOTAL FLEET MANAGEMENT PROJECTS 366,000 STORM WATER FUND Buffalo Valley Streambank Mitigation Storm Water Fund 400,000 West Oakland Avenue Bridge Storm Water Fund 750,000 West Walnut Street Holding Pond Mitigation Storm Water Fund 500,000 TOTAL STORM WATER PROJECTS 1,650,000 WATER/SEWER FUND Water System Improvements Advance Meter Infrastructure W/S Bond Issue 6,000,000 Small Diameter Line Replacement W/S Fund 1,200,000 Washington Co. Water Line Extension Federal - ARPA Grant 2,200,000 TOTAL WATER SYSTEM 9,400,000 Sewer System Improvements Boones Creek Interceptor Replacement I-26 to B Station W/S Bond Proceeds 2,050,000 C Station Wastewater Lift Station Replacement W/S Bond Proceeds 1,250,000 Lift Station Phase Out W/S Fund 500,000 Knob Creek Aeration Rehabilitation W/S Bond Issue 2,800,000 Regional Sewer Capacity Improvements - Phase III W/S Bond Proceeds 4,000,000 Root Removal Sewer Rehabilitation W/S Fund 75,000 Sewer Lift Station W/S Fund 50,000 Sinking Creek Lift Station Upgrade Federal - EDA Grant 1,000,000 Wastewater Collection Line Rehab/Replacement W/S Fund 500,000 TOTAL SEWER SYSTEM 12,225,000
FUNDING SUMMARY
FUNDING SOURCE
79 Funding Source Cost Combined Projects Emergency & Security W/S Fund 75,000 Knob Creek Road & CSX Utility Improvements W/S Bond Issue 1,500,000 Local Road Projects/Annexations W/S Fund 500,000 Misc. TFM & LMC Projects W/S Fund 256,000 Plant/Facility Improvements W/S Fund 250,000 Walnut Street Corridor Utility Improvements W/S Bond Proceeds 1,600,000 TOTAL COMBINED WATER/SEWER 4,181,000 TOTAL WATER/SEWER FUND 25,806,000 TOTAL CAPITAL PROJECTS 60,442,440 FEDERAL/STATE GRANTS 16,215,440 FLEET MANAGEMENT FUND 366,000 GENERAL FUND 1,855,000 CAPITAL FUND BALANCE 250,000 GENERAL OBLIGATION BOND PROCEEDS 17,500,000 STORM WATER FUND 1,650,000 WATER /SEWER BOND ISSUE 10,300,000 WATER/SEWER BOND PROCEEDS 8,900,000 WATER/SEWER FUND 3,406,000 TOTAL CAPITAL PROJECTS 60,442,440
Funding Source Cost Towne Acres Elementary School (Design, Engineering) G.O. Bond 2,000,000 TOTAL CAPITAL SCHOOLS PROJECTS 2,000,000 GENERAL OBLIGATION BOND ISSUE 2,000,000 TOTAL CAPITAL SCHOOLS PROJECTS 2,000,000
SCHOOLS -
2024
CAPITAL
FY
Debt Service is the payment of principal and interest on all general obligation bonds issued for the City. The City of Johnson City is subject to debt limitations imposed by its charter. The total bonded indebtedness (excluding sales tax revenue debt) shall not exceed 10% of the assessed taxable value of the property with the corporate limits of the City.
The City of Johnson City’s General Obligation Bond ratings are as follows: Standard and Poor’s – AA; Fitch –AA, and Moody’s Aa2.
The Debt Service Fund provides for the accumulation of resources necessary for paying the general obligation debt service payments of the City (excluding utility funds, internal service funds, and the City’s PEP fund). In FY 2024, principal and interest payments are budgeted at $12,260,433, which is a 4.5% increase, or $529,120, from the prior year budget to budget. The funding sources for the debt service payments include the following: General Fund transfer - $11,117,872; General Purpose School Fund transfer$1,040,210; and Economic Development Reserve - $102,352.
In FY 2024, a new general obligation debt issuance in the amount of $40,000,000 is planned. This amount funds the construction of a new Towne Acres Elementary School. Please refer to the Debt Service Fund Summary, found on page 46, for a detailed breakdown of each debt issue and corresponding payments.
Obligation Bonds - Debt Service Payments
81
DEBT SERVICE
DEBT SERVICE FUND 0 $3,000,000 2019 2020 2021 2022 2023 2024 2025 2026 2027 2028 2029 City Schools $6,000,000 $9,000,000 $12,000,000 $15,000,000
DEBT SUMMARY
General
UTILITY FUND DEBT SERVICE
Principal and Interest Payments within the utility funds are accounted for in their respective funds, with the principal payments recorded as a reduction of the debt liability and the interest payments as an operating expense. All principal and interest payments are solely paid for by user fees.
In FY 2021, the Solid Waste Fund issued $1,000,000 in new debt to finalize construction for the new Solid Waste facility. No new debt is budgeted in the Solid Waste Fund for FY 2024. Total debt service for Solid Waste in FY 2024 is $195,150.
Solid Waste Fund - Debt Service Payments
The issuance of debt is built in to the Water and Sewer Fund rate model to facilitate continued major improvements within the system. The timing of debt issuances for the Water and Sewer Fund is evaluated on an annual basis. Total Water and Sewer Services debt service for FY 2024 is $8,514,325. In the latter half of FY 2022, the City Commission approved $25,000,000 in new debt for Water and Sewer projects to include the following:
• B Wastewater Station Forcemain
• C Station Wastewater Lift Station Replacement
• Lower Boones Creek Interceptor Phase II
• Service Center Replacement
• West Walnut Street Utility Improvements
82
Debt Service
0 $50,000 $100,000 $150,000 $200,000 $250,000 $300,000
2019 2020 2021 2022 2023 2024 2025 2026 2027 2028 2029
Water/Sewer Fund - Debt Service Payments
The Storm Water Fund issued new debt in FY 2022 in the amount of $3,000,000 for West Walnut Street. Total debt service for Storm Water in FY 2024 is $771,002.
Storm Water Fund - Debt Service Payments
83
Service
Debt
0 $2,000,000 $4,000,000 $6,000,000 $8,000,000 $10,000,000
2019 2020 2021 2022 2023 2024 2025 2026 2027 2028 2029 0 $100,000 $200,000 $300,000 $400,000 $500,000 $600,000 $700,000 $800,000
2019 2020 2021 2022 2023 2024 2025 2026 2027 2028 2029
OTHER DEBT
The PEP Fund, sometimes referred to as the Educational Facilities Trust Fund, is a separate governmental fund dedicated to account for the principal and interest payments on debt issued to fund educational facility improvements. A designated percentage of the local option sales tax is the funding source for the debt service payments of this fund.
In FY 2022, the PEP Fund issued $2,100,000 in new debt. These bond proceeds funded the following school facility improvements: additional funds for the design, engineering, and construction for classroom additions at South Side Elementary, Woodland Elementary and Lake Ridge Elementary, Indian Trail field turf, and Science Hill track turf. Total PEP debt service for FY 24 is $4,702,950.
PEP Bonds - Debt Service Payments
The Fleet Management Fund issued new debt in the amount of $2,300,000 for Public Safety radio replacement in FY 2021. As an internal service fund, all expenses are recovered through charges to city departments for fleet services rendered during the fiscal year. Thus, the police and fire departments will be responsible for reimbursement to the Fleet Management Fund for any associated debt service payments related to the new issue. No new debt is budgeted for Fleet Management in FY 2024. Total debt service for FY 2024 in Fleet Management is $321,821.
84
Debt Service
0
$2,000,000 $3,000,000
$1,000,000
$4,000,000 $5,000,000
2019 2020 2021 2022 2023 2024 2025 2026 2027 2028 2029
85 Debt Service 0 $100,000 $200,000 $300,000 $400,000 $500,000 $600,000
2019 2020 2021 2022 2023 2024 2025 2026 2027 2028 2029
Fleet Management Fund - Debt Service Payments
Governmental Funds
86 DEBT SERVICE SCHEDULE BY FUND AS OF JUNE 30, 2024 FY 2037 Description FY 2024 FY 2025 FY 2026 FY 2027 FY 2028 FY 2029 FY 2030 FY 2031 FY 2032 FY 2033 FY 2034 FY 2035 FY 2036 and Beyond Total
General FundPrincipal 2008 TMBF Variable Rate Loan 978,037 767,283 805,461 845,502 887,404 932,100 5,215,787 2009 Qualified School ConstructionSchools 509,171 509,172 559,293 48,002 1,625,638 2014 TMBF LoanFieldhouseSchools 50,000 50,000 50,000 50,000 50,000 50,000 50,000 50,000 50,000 50,000 50,000 50,000 600,000 2014 TMBF LoanFieldhouseCity 12,000 14,000 15,000 17,000 19,000 20,000 22,000 24,000 26,000 28,000 30,000 32,000 259,000 2014 TMBF LoanFarmer's MarketCity 23,800 24,500 25,025 25,725 26,425 27,125 1,819 154,419 2014 TMBF LoanFarmer's MarketTIF 112,200 115,500 117,975 121,275 124,575 127,875 131,175 850,575 2016 GO 490,000 515,000 540,000 565,000 590,000 615,000 640,000 665,000 690,000 720,000 745,000 775,000 805,000 8,355,000 2016A Refunding 241,627 249,485 284,191 214,780 224,602 231,150 239,663 255,378 1,940,876 2016A GO School Maint. Bldg. 150,000 160,000 165,000 175,000 180,000 190,000 195,000 205,000 210,000 220,000 230,000 240,000 250,000 2,570,000 2016A GO ETSU FPAC 300,000 315,000 335,000 350,000 365,000 380,000 395,000 410,000 425,000 440,000 460,000 480,000 495,000 5,150,000 2017 Hands On (FY 2018) 50,000 50,000 50,000 50,000 200,000 2019 GO 230,000 245,000 250,000 190,000 200,000 210,000 220,000 230,000 240,000 250,000 260,000 270,000 280,000 915,000 3,990,000 2019B Refunding 610,827 641,625 674,990 708,354 744,285 780,216 818,713 859,778 903,408 949,605 995,802 1,047,132 1,098,462 4,860,951 15,694,148 2020 Refunding 827,148 862,831 1,689,979 2020 GO 321,000 345,000 362,000 374,000 398,000 342,000 361,000 380,000 82,000 86,000 88,000 92,000 96,000 540,000 3,867,000 2020 GOPortion of Original 513 7,972 8,431 8,891 9,198 9,658 44,150 2022 GO 1,280,000 1,345,000 1,410,000 1,480,000 1,555,000 1,630,000 1,715,000 1,800,000 1,890,000 1,985,000 2,085,000 2,185,000 2,295,000 15,845,000 38,500,000 2023 GONEW 1,525,000 1,300,000 1,365,000 1,430,000 1,500,000 1,575,000 1,655,000 1,740,000 1,825,000 1,920,000 2,010,000 2,095,000 20,060,000 40,000,000 Total General Fund Principal 6,193,782 7,742,827 6,952,826 6,588,836 6,803,949 7,035,466 6,364,370 6,534,156 6,256,408 6,553,605 6,863,802 7,181,132 7,414,462 42,220,951 130,706,572 General FundInterest 2008 TMBF Variable Rate Loan 156,474 127,133 104,114 79,951 54,585 27,963 550,219 2009 Qualified School ConstructionSchools 123,624 123,624 123,624 10,302 381,174 2014 TMBF LoanFieldhouseCity 24,012 22,185 20,315 18,400 16,429 14,412 12,354 10,237 8,062 5,829 3,538 1,189 156,962 2014 TMBF LoanFarmer's MarketCity 4,608 3,929 3,233 2,520 1,788 1,035 327 17,440 2014 TMBF LoanFarmer's MarketTIF 21,722 18,523 15,242 11,881 8,426 4,880 1,541 82,215 2016 GO 349,650 325,150 299,400 272,400 249,800 226,200 201,600 176,000 149,400 121,800 93,000 63,200 32,200 2,559,800 2016A Refunding 85,388 73,307 60,832 46,623 38,032 29,048 19,802 10,215 363,247 2016A GO School Maint. Bldg. 107,550 100,050 92,050 83,800 76,800 69,600 62,000 54,200 46,000 37,600 28,800 19,600 10,000 788,050 2016A GO ETSU FPAC 215,500 200,500 184,750 168,000 154,000 139,400 124,200 108,400 92,000 75,000 57,400 39,000 19,800 1,577,950 2019 GO 175,050 163,550 151,300 138,800 129,300 119,300 108,800 97,800 88,600 79,000 69,000 58,600 47,800 74,000 1,500,900 2019B Refunding 750,496 719,951 687,866 654,114 618,692 581,474 542,459 501,520 458,526 413,351 365,867 316,071 263,709 585,196 7,459,292 2020 Refunding 84,499 43,142 127,641 2020 GO 179,710 163,660 146,410 128,310 109,610 89,710 72,610 54,560 39,360 36,080 32,640 29,120 25,440 66,400 1,173,620 2020 GOPortion of Original 513 2,207 1,809 1,387 943 483 6,829 2022 GO 1,743,600 1,679,600 1,612,350 1,541,850 1,467,850 1,390,100 1,308,600 1,222,850 1,132,850 1,038,350 939,100 834,850 725,600 2,290,400 18,927,950 2023 GONEW 900,000 1,765,688 1,702,125 1,642,163 1,579,275 1,513,350 1,444,163 1,371,488 1,295,100 1,214,888 1,130,625 1,042,200 949,838 3,797,552 21,348,454 Total General Fund Interest 4,924,090 5,531,800 5,204,998 4,800,056 4,505,070 4,206,472 3,898,456 3,607,270 3,309,898 3,021,898 2,719,970 2,403,830 2,074,387 6,813,548 57,021,743 Total General Fund Debt Service 11,117,871 13,274,627 12,157,824 11,388,892 11,309,019 11,241,938 10,262,826 10,141,426 9,566,306 9,575,503 9,583,772 9,584,962 9,488,849 49,034,499 187,728,315 GP School FundPrincipal 2008 TMBF Variable Rate LoanSchools 477,000 477,000 2016A GO School Energy Imp. 390,000 410,000 430,000 450,000 470,000 485,000 505,000 525,000 3,665,000 Total GP School FundPrincipal 867,000 410,000 430,000 450,000 470,000 485,000 505,000 525,000 4,142,000 GP School FundInterest 2008 TMBF Variable Rate LoanSchools** 14,310 14,310 2016A GO School Energy Imp. 158,900 139,400 118,900 97,400 79,400 60,600 41,200 21,000 716,800 Total GP School FundInterest 173,210 139,400 118,900 97,400 79,400 60,600 41,200 21,000 731,110 Total GP School Fund Debt Service 1,040,210 549,400 548,900 547,400 549,400 545,600 546,200 546,000 4,873,110 CITY
OF JOHNSON CITY
Governmental Funds (continued)
87 DEBT SERVICE SCHEDULE BY FUND AS OF JUNE 30, 2024 FY 2037 Description FY 2024 FY 2025 FY 2026 FY 2027 FY 2028 FY 2029 FY 2030 FY 2031 FY 2032 FY 2033 FY 2034 FY 2035 FY 2036 and Beyond Total CITY OF JOHNSON CITY
Med Tech ParkPrincipal 2020 GO Refunding 92,851 97,170 190,021 Total Med Tech ParkPrincipal 92,851 97,170 190,021 Med Tech ParkInterest 2020 GO Refunding 9,501 4,858 14,359 Total Med Tech ParkInterest 9,501 4,858 14,359 Total Med Tech Park Debt Service 102,352 102,028 204,380 Educational FacilitiesPrincipal 2010 Series VII-I-1 (Variable) 1,790,000 1,855,000 1,920,000 1,985,000 2,055,000 2,125,000 2,200,000 2,280,000 2,355,000 2,440,000 2,500,000 23,505,000 2020 GO 1,540,000 1,615,000 840,000 880,000 925,000 975,000 1,020,000 1,070,000 1,115,000 1,160,000 11,140,000 2022 GO 60,000 65,000 70,000 70,000 75,000 80,000 85,000 90,000 90,000 95,000 100,000 105,000 110,000 765,000 1,860,000 Total Educ. Facilities Principal 3,390,000 3,535,000 2,830,000 2,935,000 3,055,000 3,180,000 3,305,000 3,440,000 3,560,000 3,695,000 2,600,000 105,000 110,000 765,000 36,505,000 Educational FacilitiesInterest 2010 Series VII-I-1 (Variable) 705,150 651,450 595,800 538,200 478,650 417,000 353,250 287,250 218,850 148,200 75,000 4,468,800 2020 GO 523,550 446,550 365,800 323,800 279,800 233,550 184,800 133,800 91,000 46,400 2,629,050 2022 GO 84,250 81,250 78,000 74,500 71,000 67,250 63,250 59,000 54,500 50,000 45,250 40,250 35,000 110,600 914,100 Total Educ. Facilities Interest 1,312,950 1,179,250 1,039,600 936,500 829,450 717,800 601,300 480,050 364,350 244,600 120,250 40,250 35,000 110,600 8,011,950 Total Educ. Facilities Debt Service 4,702,950 4,714,250 3,869,600 3,871,500 3,884,450 3,897,800 3,906,300 3,920,050 3,924,350 3,939,600 2,720,250 145,250 145,000 875,600 44,516,950 Total Governmental Fund Principal 10,543,633 11,784,997 10,212,826 9,973,836 10,328,949 10,700,466 10,174,370 10,499,156 9,816,408 10,248,605 9,463,802 7,286,132 7,524,462 42,985,951 171,543,593 Total Governmental Fund Interest 6,419,751 6,855,308 6,363,498 5,833,956 5,413,920 4,984,872 4,540,956 4,108,320 3,674,248 3,266,498 2,840,220 2,444,080 2,109,387 6,924,148 65,779,162 Total Gov. Funds Debt Service 16,963,383 18,640,305 16,576,324 15,807,792 15,742,869 15,685,338 14,715,326 14,607,476 13,490,656 13,515,103 12,304,022 9,730,212 9,633,849 49,910,099 237,322,755
88 DEBT SERVICE SCHEDULE BY FUND AS OF JUNE 30, 2024 FY 2037 Description FY 2024 FY 2025 FY 2026 FY 2027 FY 2028 FY 2029 FY 2030 FY 2031 FY 2032 FY 2033 FY 2034 FY 2035 FY 2036 and Beyond Total CITY OF JOHNSON CITY
Water/SewerPrincipal 2003 RDA Limestone Cove #1 11,353 11,890 12,453 13,042 13,661 14,309 14,987 15,697 16,441 17,220 18,035 18,890 19,785 106,492 304,255 2004 RDA Watauga Flats 9,247 9,690 10,123 10,575 11,021 11,539 12,054 12,592 13,134 13,740 14,354 14,994 15,651 103,553 262,267 2005 RDA Limestone Cove #2 2,929 3,066 3,199 3,338 3,474 3,633 3,790 3,955 4,119 4,304 4,491 4,686 4,884 38,731 88,599 2008 TMBF Variable Rate Loan 53,963 56,717 59,539 62,498 65,596 68,900 367,213 2009 RDA Greggtown Road 9,171 9,503 9,817 10,141 10,449 10,820 11,177 11,546 11,904 12,319 12,726 13,145 13,561 190,302 336,581 2013 GO 690,000 705,000 720,000 740,000 760,000 780,000 805,000 835,000 860,000 890,000 920,000 1,000,000 1,000,000 8,005,000 18,710,000 2016A GO Refunding 1,603,372 1,655,515 1,885,809 1,425,220 1,490,398 1,533,850 1,590,337 1,694,621 12,879,122 2019 GO 465,000 490,000 515,000 540,000 565,000 595,000 625,000 655,000 680,000 710,000 735,000 765,000 795,000 2,585,000 10,720,000 2019B Refunding 579,173 608,375 640,010 671,646 705,715 739,784 776,287 815,222 856,592 900,395 944,198 992,868 1,041,538 4,609,049 14,880,852 2020 State Revolving Loan 629,532 643,696 658,179 672,989 688,131 703,614 719,445 735,632 752,184 769,108 786,413 804,108 822,200 4,396,959 13,782,190 2022 GO 735,000 770,000 810,000 850,000 895,000 940,000 985,000 1,035,000 1,085,000 1,140,000 1,195,000 1,255,000 1,320,000 9,110,000 22,125,000 Total Water/SewerPrincipal 4,788,740 4,963,452 5,324,129 4,999,449 5,208,445 5,401,449 5,543,077 5,814,265 4,279,374 4,457,086 4,630,217 4,868,691 5,032,619 29,145,086 94,456,079 Water/SewerInterest 2003 RDA Limestone Cove #1 13,871 13,334 12,771 12,182 11,563 10,915 10,238 9,526 8,782 8,004 7,187 6,334 5,440 12,255 142,402 2004 RDA Watauga Flats 11,321 10,878 10,445 9,993 9,547 9,029 8,514 7,976 7,434 6,828 6,214 5,574 4,917 13,640 122,310 2005 RDA Limestone Cove #2 3,719 3,582 3,449 3,310 3,174 3,015 2,858 2,693 2,529 2,344 2,157 1,962 1,764 5,853 42,409 2008 TMBF Variable Rate Loan 18,361 15,662 12,827 9,849 6,725 3,445 66,869 2009 RDA Greggtown Road 10,833 10,501 10,187 9,863 9,555 9,184 8,827 8,458 8,100 7,685 7,278 6,859 6,443 37,698 151,471 2013 GO 596,762 582,963 567,100 549,100 529,675 506,875 483,475 456,306 428,125 399,100 369,063 338,013 306,012 1,148,412 7,260,981 2016A GO Refunding 566,612 486,443 403,667 309,377 252,368 192,752 131,398 67,785 2,410,402 2019 GO 466,750 443,500 419,000 393,250 366,250 338,000 308,250 277,000 250,800 223,600 195,200 165,800 135,200 209,400 4,192,000 2019B Refunding 711,454 682,499 652,083 620,086 586,508 551,226 514,241 475,430 434,674 391,849 346,834 299,629 249,991 554,754 7,071,258 2020 State Revolving Loan 323,952 310,099 295,935 281,452 266,643 251,500 236,017 220,186 203,999 187,447 170,523 153,218 135,523 418,627 3,455,121 2022 GO 1,001,950 965,200 926,700 886,200 843,700 798,950 751,950 702,700 650,950 596,700 539,700 479,950 417,200 1,316,600 10,878,450 Total Water/SewerInterest 3,725,585 3,524,661 3,314,164 3,084,662 2,885,708 2,674,891 2,455,768 2,228,060 1,995,393 1,823,557 1,644,156 1,457,339 1,262,490 3,717,239 35,793,673 Total Water/Sewer Debt Service 8,514,325 8,488,113 8,638,292 8,084,111 8,094,153 8,076,340 7,998,845 8,042,325 6,274,767 6,280,643 6,274,373 6,326,030 6,295,109 32,862,325 130,249,752 City Solid WastePrincipal 2019 GO 65,000 70,000 75,000 80,000 80,000 85,000 90,000 95,000 100,000 100,000 105,000 110,000 115,000 375,000 1,545,000 2020 GO 30,000 30,000 30,000 35,000 35,000 35,000 35,000 40,000 40,000 45,000 45,000 45,000 50,000 270,000 765,000 Total City Solid WastePrincipal 95,000 100,000 105,000 115,000 115,000 120,000 125,000 135,000 140,000 145,000 150,000 155,000 165,000 645,000 2,310,000 City Solid WasteInterest 2019 GO 67,250 64,000 60,500 56,750 52,750 48,750 44,500 40,000 36,200 32,200 28,200 24,000 19,600 30,400 605,100 2020 GO 32,900 31,400 29,900 28,400 26,650 24,900 23,150 21,400 19,800 18,200 16,400 14,600 12,800 33,400 333,900 Total City Solid WasteInterest 100,150 95,400 90,400 85,150 79,400 73,650 67,650 61,400 56,000 50,400 44,600 38,600 32,400 63,800 939,000 Total City Solid Waste Debt Service 195,150 195,400 195,400 200,150 194,400 193,650 192,650 196,400 196,000 195,400 194,600 193,600 197,400 708,800 3,249,000 Storm WaterPrincipal 2013 GO 275,000 280,000 290,000 295,000 305,000 315,000 320,000 335,000 345,000 355,000 370,000 3,485,000 2020 GO 84,000 90,000 93,000 96,000 102,000 108,000 114,000 120,000 123,000 129,000 132,000 138,000 144,000 810,000 2,283,000 2022 GO 90,000 95,000 95,000 100,000 105,000 110,000 120,000 125,000 130,000 135,000 145,000 150,000 160,000 1,095,000 2,655,000 Total Storm Water Principal 449,000 465,000 478,000 491,000 512,000 533,000 554,000 580,000 598,000 619,000 647,000 288,000 304,000 1,905,000 8,423,000 Storm WaterInterest 2013 GO 103,612 98,113 91,812 84,563 76,819 67,669 58,219 47,419 36,112 24,469 12,486 701,293 2020 GO 98,190 93,990 89,490 84,840 80,040 74,940 69,540 63,840 59,040 54,120 48,960 43,680 38,160 99,600 998,430 2022 GO 120,200 115,700 110,950 106,200 101,200 95,950 90,450 84,450 78,200 71,700 64,950 57,700 50,200 158,400 1,306,250 Total Storm Water Interest 322,002 307,803 292,252 275,603 258,059 238,559 218,209 195,709 173,352 150,289 126,396 101,380 88,360 258,000 3,005,973 Total Storm Water Debt Service 771,002 772,803 770,252 766,603 770,059 771,559 772,209 775,709 771,352 769,289 773,396 389,380 392,360 2,163,000 11,428,973
Proprietary Funds
89 DEBT SERVICE SCHEDULE BY FUND AS OF JUNE 30, 2024 FY 2037 Description FY 2024 FY 2025 FY 2026 FY 2027 FY 2028 FY 2029 FY 2030 FY 2031 FY 2032 FY 2033 FY 2034 FY 2035 FY 2036 and Beyond Total CITY OF JOHNSON CITY
Fleet MgmtPrincipal 2020 GO 252,028 266,569 281,109 290,802 305,342 1,395,850 Total Fleet Mgmt Principal 252,028 266,569 281,109 290,802 305,342 1,395,850 Fleet MgmtInterest 2020 GO 69,793 57,191 43,863 29,807 15,267 215,921 Total Fleet Mgmt Interest 69,793 57,191 43,863 29,807 15,267 215,921 Total Fleet Mgmt Debt Service 321,821 323,760 324,972 320,609 320,609 1,611,771 Total Proprietary Principal 5,584,768 5,795,021 6,188,238 5,896,251 6,140,787 6,054,449 6,222,077 6,529,265 5,017,374 5,221,086 5,427,217 5,311,691 5,501,619 31,695,086 106,584,929 Total Proprietary Interest 4,217,530 3,985,055 3,740,679 3,475,222 3,238,434 2,987,100 2,741,627 2,485,169 2,224,745 2,024,246 1,815,152 1,597,319 1,383,250 4,039,039 39,954,567 Total Proprietary Debt Service 9,802,298 9,780,076 9,928,916 9,371,473 9,379,221 9,041,549 8,963,704 9,014,434 7,242,119 7,245,332 7,242,369 6,909,010 6,884,869 35,734,125 146,539,496 Total Debt Service Total Principal 16,128,401 17,580,018 16,401,064 15,870,087 16,469,736 16,754,915 16,396,447 17,028,421 14,833,782 15,469,691 14,891,019 12,597,823 13,026,081 74,681,037 278,128,522 Total Interest 10,637,280 10,840,363 10,104,177 9,309,178 8,652,354 7,971,972 7,282,583 6,593,489 5,898,993 5,290,744 4,655,372 4,041,399 3,492,637 10,963,187 105,733,729 Total Debt Service 26,765,681 28,420,381 26,505,241 25,179,265 25,122,090 24,726,887 23,679,030 23,621,910 20,732,775 20,760,435 19,546,391 16,639,222 16,518,718 85,644,224 383,862,251
Proprietary Funds (continued)
QUASI-GOVERNMENTAL AGENCIES
Quasi-Governmental agencies are supported by the City and the County, but are managed privately. Each agency is required to submit an application annually, along with a copy of their latest year-end financial statements or audit. The City Commission determines the level of funding each agency will receive as a part of the annual budget process. Financial support for these agencies is a portion of the General Government expenditures.
The following agencies received an appropriation in the FY 2024 budget.
AEROSPACE PARK $ 137,750
Aerospace Park is a direct-airfield development at Tri-Cities Airport in northeast Tennessee. The site offers 20 acres certified for immediate development and an additional 140 acres under preparation. It is a joint venture among local county and municipal governments including Johnson City. The appropriation is for Johnson City’s share of the debt service.
JOHNSON CITY DEVELOPMENT AUTHORITY $ 460,000
The mission of the Johnson City Development Authority is to promote and assist with the development and redevelopment of Johnson City, with specific emphasis on the downtown district and support for the local business community.
CHAMBER OF COMMERCE $ 50,000
The mission of the Johnson City Development Authority is to promote and assist with the development and redevelopment of Johnson City, with specific emphasis on the downtown district and support for the local business community.

91
Quasi-Governmental Agencies
The mission of the Child Advocacy Center is to combat child sexual abuse and severe physical abuse by coordinating and providing services to children in a safe, caring environment.
The Convention & Visitors Bureau works to showcase the uniqueness of and develop increased civic interest in the City of Johnson City as an attraction to tourists, visitors and individuals. They solicit special events to take place in the city, promote the city’s distinctive resources, and increase the economic contribution of tourism in order to grow the City of Johnson City.
The Industrial Development Board promotes industry, trade, commerce, tourism and recreation by inducing manufacturing, industrial, governmental, education, research and development, financial, service, commercial, medical-related, and recreational enterprises, to locate or remain in the City of Johnson City and State of Tennessee.
The Tri-Cities Airport Commission is the Grantee of Foreign Trade Zone No. 204. The FTZ Committee was established by the Airport Commission to provide guidance in the areas of Zone marketing and administration. In addition to the City of Johnson City, membership in the FTZ No. 204 is comprised of the City of Kingsport, Sullivan County, TN, Washington County, TN, Bristol, TN, Bristol, VA, Washington County, VA, and the Tri-Cities Regional Airport. FTZ No. 204 is a vital component of our region’s economic development efforts. Communities use the FTZ to attract new business and industry, as well as retain existing businesses.
The mission of the Washington County Economic Development Council is to enhance job growth and increase the tax base of Washington County, Johnson City and Jonesborough by engaging the community and business leaders through nurturing existing businesses and actively recruiting new industries and commerce.
This organization is responsible for answering all 9-1-1 calls and dispatching both emergency and nonemergency communications to all public safety agencies within Johnson City and Washington County. The goal of E-911 is to provide professional and prompt service to all citizens who contact 9-1-1, as well as to dispatch those calls to the appropriate agency in a quick and accurate manner.
$ 1,325,000 $84,011
This organization is responsible for helping the city and county prepare for emergency situations. This function moved from the city to county starting in FY 2020.
92 CONVENTION & VISITORS BUREAU $1,001,366 INDUSTRIAL DEVELOPMENT BOARD $15,000 TRI-CITIES AIRPORT COMMISSION $ 19,478 WASHINGTON COUNTY ECONOMIC DEVELOPMENT COUNCIL $ 25,000 WASHINGTON COUNTY EMERGENCY COMMUNICATIONS DISTRICT (E-911) WASHINGTON COUNTY/JOHNSON CITY EMERGENCY MANAGEMENT AGENCY CHILD ADVOCACY CENTER $50,000
WASHINGTON COUNTY/JOHNSON CITY ANIMAL CONTROL SHELTER
This organization was created as a joint venture with Washington County and the City of Johnson City to enforce the animal control laws of the City and state. The Shelter is designed to protect individuals from the dangers of uncontrolled animals, as well as protect the animal population against abuse by people. The goal of the Shelter encompasses promoting, motivating, and enforcing responsible pet ownership. In addition to the operating appropriation, the City has pledged to contribute to the debt service payment on the new animal shelter facility. A separate appropriation for debt service in FY 2024 is $117,697.
WASHINGTON COUNTY/JOHNSON CITY EMERGENCY MEDICAL SERVICES (EMS)
WASHINGTON COUNTY/JOHNSON CITY HEALTH DEPARTMENT
The mission of the Tennessee Department of Health is to promote, protect, and improve the health of persons living in, working in, or visiting the State of Tennessee. This branch was established in 1926 to provide quality health services to all citizens of Johnson City and Washington County. Services provided include, but are not limited to, dental health services, environmental health services, primary care, health promotion, immunizations, and nutrition education.
$ 290,000 QUASI-GOVERNMENTAL
$ 1,550,000 $ 70,476 Increase
This organization provides advanced and basic life support via ground ambulance transportation to the citizens of Johnson City and Washington County. In addition, EMS provides highly capable rescue personnel and equipment, along with support for specialized rescue teams. Quality patient care and timely response are the priorities of this agency.
93
Quasi-Governmental Agencies Budget FY 2020 FY 2021 FY 2022 FY 2023 FY 2024 $ % Aerospace Park (Debt Service Appropriation) 137,750 137,750 137,750 137,750 137,750 - 0.0 Animal Shelter 250,000 250,000 250,000 275,000 290,000 15,000 5.5 Animal Shelter (Debt Service Appropriation) 109,080 109,080 117,697 117,697 117,697 - 0.0 Chamber of Commerce - - 100,000 50,000 50,000 - 0.0 Child Advocacy Center - - - - 50,000 50,000 100.0 Convention and Visitor's Bureau 687,956 687,956 701,366 951,366 1,001,366 50,000 5.3 Emergency Communications 900,000 900,000 975,000 1,075,000 1,325,000 250,000 23.3 Emergency Management Agency (EMA) 84,011 84,011 84,011 84,011 84,011 - 0.0 EMS 939,663 939,663 1,000,000 1,150,000 1,550,000 400,000 34.8 Industrial Development Board 15,000 15,000 15,000 15,000 15,000 - 0.0 Johnson City Development Authority 178,751 135,000 155,000 355,000 460,000 105,000 29.6 Tri-Cities Airport Commission 17,593 17,830 19,613 19,987 19,478 (509) (2.5) NeTREP 220,248 220,248 220,248 220,248 - (220,248) (100.0) Washington County Economic Development Council 20,000 20,000 20,000 20,000 25,000 5,000 25.0 Washington County Health Dept. 70,476 70,476 70,476 70,476 70,476 - 0.0 Total 3,630,528 3,587,014 3,866,161 4,541,535 5,195,778 654,243 14.4
DEPARTMENT OVERVIEW
General Government
ADMINISTRATION
The Administration Division includes the City Manager, two Assistant City Managers, Staff Attorney, Economic Development Director, Economic Development Analyst, Director of Budget and Performance Management, Budget Analyst, and support staff.
The City Commission appoints the City Manager to serve as the Chief Executive Officer and the Chief Administrative Officer under the Commission’s leadership.
Key responsibilities of the City Manager include:
• Implementing the policies established by the City Commission by enforcing all adopted resolutions and ordinances
• Oversee the operations of the government within the guidelines of the City Charter
Key responsibilities of the Assistant City Managers include:
• Supporting the City Manager in managing the day-to-day operations of the City of Johnson City

• Oversight of various divisions/departments
95
General Government General Fund Expenditures
96 Department Overview
Dollars (In Thousands) Fiscal Year
Other Personal Services Operating General Government Expenditures by Category 47% 33% 20%
0 $5,000 $10,000 $15,000 $20,000 2020 2021 2022 2023 2024
In addition to the Office of the City Manager, work is performed by the following:
97 Department Overview
of
City, TN Juvenile Court Judge Juvenile Court (11.5) Board of Commissioners City Manager (4.2) Municipal Court Municipal Court Judge City Attorney Budget (2) Information Technology (14) Purchasing (3.5) Risk Management (5) Human Resources (7) Responsible for other programs outside of General Government Responsible for other programs outside of General Government Responsible for other programs outside of General Government Assistant City Manager (1) Assistant City Manager (1) Interim Assistant City Manager (1) Communications & Marketing (9) Economic Development (2) Legal (2) Staff Attorney (1) General Government
General Government Citizens
Johnson
Department Overview
BUDGET AND PERFORMANCE MANAGEMENT
These employees are responsible for guiding the annual budget process, which begins each October with the preparation of the capital improvement plan. Departmental budgets are prepared in January and February, followed by work sessions with the city manager and assistant city managers as well as the Board of Commissioners.
• Key responsibilities include:
• Generating budget forms for each department
• Compiling budget requests for management review
• Preparing budget document
• Compiling and preparing City’s 5-year capital improvement plan
• Coordinating collection of performance measurement data
2023 ACCOMPLISHMENTS
Launch a new, interactive Capital Improvement Plan dashboard that gives greater transparency about the City’s long-term projects
Re-designed the FY 2024 budget book to GFOA standards, and submitted for budget award consideration
2024 GOALS & OBJECTIVES
Receive the GFOA’s Distinguished Budget Award for FY 2024
Resurrect the City’s Performance Management program
Create more online resources for the community to engage with the budget process
ECONOMIC DEVELOPMENT
These employees promote economic growth and development throughout the City of Johnson City and serve as a resource for all types of businesses and entrepreneurial projects of various sizes and scope.
Key responsibilities include:
• Development and management of business retention, expansion and attraction programs
• Provision and management of financial incentives and other economic development assistance
• Serving as the City’s liaison to other government entities and organizations focused on regional and state economic development efforts
98
2023 ACCOMPLISHMENTS
Assisted in the creation and utilization of a committee to identify and dispose of properties for use as low income housing
2024 GOALS & OBJECTIVES
Develop and implement a plan for the Ashe Street property
Develop and implement a plan for business retention and expansion
Develop an economic development website
COMMUNICATIONS AND MARKETING
The Communications and Marketing Department strives to foster a positive relationship between our municipal government and the citizens it serves. Through a comprehensive communication program, media and employee relations, and special events, Communications and Marketing promotes a positive City image and public trust by telling our story.
Communications and Marketing oversees:
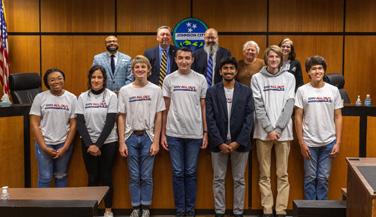
• Communications
• Media and Employee relations
• Special Events
• Grant Writing and Research
• Public Affairs
Key responsibilities include:
• Strategizes dissemination of information to external and internal stakeholders
• Educates the public about government activities and promotes City services

• Manages government relations
• Researches and writes grants
• Coordinates City events
• Enforces, manages and oversees brand standards and management
• Manages media requests
99
Department Overview
Department Overview
2023 ACCOMPLISHMENTS
Designed and adopted the new City flag
Supported other departments in the coordination, implementation and execution of special events and materials
Responded to 225 media inquiries, distributed 180 news releases, and issued 456 posts across all social media channels
Coordinated design/installation planning for fast charge EV station at Spring Street parking lot
Began and continued participation in TVA/BrightRidge sustainability workshops to inform creation of City sustainability plan
2024 GOALS & OBJECTIVES
Oversee installation and message management for downtown digital boards and internal communication
Complete design of and launch new website
Conduct government awareness and civic engagement programs for citizens and students
Develop database of City’s current grants, apply for at least five grants, and obtain at least one Implement new special event application process and revise policies and fee structure as needed
Develop formalized youth program and council
HUMAN RESOURCES
The Human Resources department strives to be the conduit between City administration and the workforce. The department provides services to two primary customers:

• Employees
• City management
The department also serves as the key contact for the Employee Health Center and assists both clinic staff and the employee population in the use thereof.
Key responsibilities include:
• Administer benefits and compensation
• Create initiatives for employee relations
• Perform interview, selection and staffing services
• Develop opportunities for organization and employees
• Administer an annual Health Assessment Program
100
Department Overview
2023 ACCOMPLISHMENTS
Revised the structure of Human Resource Department to include several new hires and promotions
Monitored the operation of the Employee Health Center to ensure effectiveness
Continued partnership with voluntary benefits provider to gather information and vendors to implement an employee wellness program, to include a focus on Mental Health
Continued to expand new Oracle software modules for applications
2024 GOALS & OBJECTIVES
Develop recruiting and retention strategies with the new Human Resources staff member
Implement a more formal onboarding process
Hold leadership and team training workshops
Revise 3 policies per quarter and work on revising the employee handbook
Review departmental practices and processes to ensure excellent customer service to both internal and external customers
INFORMATION TECHNOLOGY
The Information Technology Department provides technical and computer solutions and support for business operations of the City. In the modern municipal workforce, every employee is a data collector, information curator/consumer, contributing to or making data-driven decisions. IT’s job is to empower the City workforce by maintaining the required uptime on digital infrastructure and applications and to deliver the end-user experience necessary for success in their job duties.
Key responsibilities include:
• Design, implement, and maintain the City’s computer network infrastructure to ensure reliable connectivity and data transfer between various departments and locations
• Establish and enforce robust security measures to protect sensitive information, ensure compliance with data privacy laws, and prevent unauthorized access to City systems
• Implement reliable backup solutions and disaster recovery plans to safeguard critical data and systems in the event of hardware failure, cyberattacks, or natural disasters
• Provide technical support to employees, assisting with troubleshooting, resolving software and hardware issues, and answering IT-related questions


• Support the City’s Geographic Information Systems, which provide valuable spatial data for various planning and decision-making processes
101
Department Overview
2023 ACCOMPLISHMENTS
Migrate 300 users to Exchange online and Microsoft Office 365
Continue to enhance Oracle ERP solution/EPM
Retire any windows 2012 servers from the City’s infrastructure
Ensure there is organization-wide compliance with Kari’s Law (911 dialing)
Implement change management policies and procedures to reduce downtime, increase communications, and instill accountability
Fully implement BCP with data center failover
2024 GOALS & OBJECTIVES
Migrate 300 users from Office 2016 to Office 365 cloud infrastructure
Continue to enhance Oracle ERP solution/EPM
Perform full Cybersecurity security assessment and develop policies/controls to address gaps
Ensure there is organization-wide compliance with Kari’s Law (911 dialing)
Fully implemented Disaster Recovery Plan including physical redundant site, providing we can find another site
Build framework for future GIS Strategic Plan
CITY COURT
The City Charter establishes a municipal court and the municipal judge. The Honorable Stan Widener is presiding over the court at this time. The court convenes in the Municipal Court chambers located in the Municipal and Safety Building, 601 E. Market St. The City Judge is appointed by the City Commission for a term of two years.
Key responsibilities include:
• Hear matters regarding city ordinances and violations of state law
• Set fees for traffic violations
JUVENILE COURT
The Johnson City Juvenile Court provides a forum for legal matters concerning children and youth within the geographic boundaries of Johnson City. According to the population estimates from the United States Census Bureau, the estimated population of Johnson City as of July 1, 2022 was 72,514, with 19.5% of those persons being under 18 years old. The Johnson City Juvenile Court typically holds hearings involving approximately 1,500 children every year.
The types of legal proceedings within the jurisdiction of the Juvenile Court, under Tennessee law, include:
• dependency and neglect, abuse of children, and termination of parental rights;
• custody, visitation, and child support for children born outside of marriage;
• juvenile delinquency and juvenile traffic violators; and
• unruly children and youth (including truancy petitions filed by the Johnson City School System).
102
Key responsibilities include:
• Provides probation supervision to juvenile offenders
• Provides diversion services for first time offenders
• Active participation on the multi-disciplinary truancy intervention boards
• Partner with the Johnson City School System to remedy potential educational neglect and truancy of students
• Offer linkage to community resources essential for some children’s success
2023 ACCOMPLISHMENTS
Created a detailed “HOW TO” guide outlining procedural steps for the job responsibilities of each position
Documented the courtroom’s use of technology to safely conduct court hearings
Provided in-person non-legal assistance and information to 304 members of the public
Screened 33 new youth using the Child and Adolescent Needs Survey
Made 21 referrals to Family Crisis Intervention and Prevention, 9 referrals for alcohol and drug counseling, and 14 referrals for individual counseling
Implemented Quest Case Management System software
2024 GOALS & OBJECTIVES
Continue with the development of written guidelines for procedural steps
Continue to use available technology to safely conduct court hearings
Continue with the use of the Child and Adolescent Needs Survey screening and assessment tool by the Juvenile Court’s probation officers
Continue to ensure that all persons who need the Juvenile Court have access to the court
Co-host the Spring Conference Annual Training for the Tennessee Juvenile Court Services Association
Monitor the effectiveness of community service as a tool of treatment and rehabilitation
Enhance the safety and security of Juvenile Court
LEGAL
The City Attorney serves as the in-house legal counsel for the City.
Key responsibilities include:
• Preparation and review of ordinances, leases, options, contracts, legal briefs, court documents, and other legal documents
• Oversight of the acquisition of real estate
• Rendering advice on legal matters pertaining to inquiries of the City Commission and all City departments
• Rendering opinions and advice regarding personnel matters, civil rights, annexation, zoning, planning, utilities, and solid waste disposal
• Litigation in state and federal courts
• Providing assistance to various City appointed boards and commissions.
103
Department Overview
Department Overview
2023 ACCOMPLISHMENTS
Assisted in the creation and utilization of a committee to identify and dispose of properties for use as low income housing
Revised, updated and added new sections to the Code of Johnson City to define the beer board as the legislative authority to regulate and supervise the issuance of beer licenses
2024 GOALS & OBJECTIVES
Review all City employment policies from an employment law perspective and make revisions, as necessary
Provide legal advice and evaluation to department directors, as needed, related to department or personnel issues
PURCHASING
The Purchasing Department’s primary objective is to provide professional services to acquire quality goods and services in a timely manner for departments of the City and Schools at the least possible cost, while ensuring an open and competitive environment consistent with the quality required and in compliance with all applicable procurement legislation.
Key responsibilities include:
• Process contracts for goods and services
• Comply with procurement legislation
• Ensure an open and competitive environment
2023 ACCOMPLISHMENTS
Processed approximately $80 million in contracts for goods and services
Gained certification for 100% of eligible purchasing staff
Realized net proceeds for surplus vehicle/equipment sales
Saved on average approximately 33% using in-house printing over outside printing
Prepared 18 requests for proposals/qualifications , 83 bids and 29 formal quotes
Raised sealed bid limit to $50 thousand and all other thresholds were raised as allowable per TCA
2024 GOALS & OBJECTIVES
Conduct a minimum of five on-line vehicle/equipment auctions
Maintain 100% certification for eligible purchasing staff and pursue new buyer certification

Prepare solicitation documents along with supporting documentation for proposals, bids and formal quotes
Revise procurement card policy
Conduct procurement policy training for new employees authorized to purchase for the City
104
RISK MANAGEMENT
Risk Management administers a variety of insurance and safety programs designed to protect and maintain the financial integrity of City-owned assets and provide a safe environment for City employees and the general public.
Key responsibilities include:
• Identify, minimize, and prevent risk exposures through a comprehensive loss prevention and safety program, including site inspections, employee training, departmental safety consultation services, and TOSHA compliance services.
• Administer the City’s occupational health program, including the Respiratory Protection Program and Vaccination Program.
• Manage the property insurance program, including loss prevention, boiler inspections, and evaluation of City-owned facilities to ensure that the proper level of insurance coverage is maintained.
• Manage the City’s casualty insurance programs, including management of the liability self-insurance program and associated litigation.
• Manage the workers’ compensation self-insurance program, including claims for City / School employees.
• Develop contract insurance specifications and analyzing contracts and coverage to ensure City requirements are achieved.
• Recover expenditures for damage to City property caused by third parties.
• Administer the return-to-duty program, ensuring employees safely return to work following a serious illness or injury.
• Administer communicable disease mitigation strategies, including hazard assessment and identification of mitigation measures to ensure employee and customer safety.
2023 ACCOMPLISHMENTS
Reduced the number of recordable work related injuries by 58% through increased safety awareness and departmental accountability
Reduced the number of lost work days caused by work-related injuries by 7.3% through an aggressive return-to-work program to include departmental accountability
Conducted job-specific training on 39 safety topics
Completed Workers’ Compensation Self-Insurance License renewal by the annual deadline
Completed the Liability and Workers’ Compensation Self-Insurance actuarial study
Filed TOSHA’s annual injury report by the deadline
2024 GOALS & OBJECTIVES
Reduce the number of recordable work related injuries by 5% through increased safety awareness and departmental accountability
Reduce the number of cases with days away from work by 5% through an aggressive return-to-work program to include departmental accountability
Reduce the number of lost work days caused by work-related injuries by 10% through an aggressive return-to-work program to include departmental accountability
105
Department Overview
Department Overview
106 Actual Actual Budget Projected Budget Bdgt. 24 % General Government FY 2021 FY 2022 FY 2023 FY 2023 FY 2024 vs. Proj. 23 Change GENERAL FUND ADMINISTRATIVE GENERAL GOVERNMENT City Commission 61,228 78,530 75,679 75,679 102,166 26,487 35.0% Administration 952,609 1,274,927 1,759,002 1,293,018 2,138,914 845,896 65.4% Communications & Marketing 454,560 481,821 654,974 654,974 829,660 174,686 26.7% Human Resources 421,243 444,169 547,320 624,920 740,201 115,281 18.4% Legal 394,688 384,912 432,015 432,015 454,326 22,311 5.2% Purchasing 359,690 403,887 432,189 431,189 358,396 (72,793) -16.9% TOTAL GENERAL GOVERNMENT 2,644,018 3,068,246 3,901,179 3,511,795 4,623,663 1,111,868 31.7% INFORMATION TECHNOLOGY 2,036,272 2,473,590 3,132,324 3,059,429 3,372,110 312,681 10.2% JUDICIAL City Court 242,470 296,189 281,693 201,693 185,006 (16,687) -8.3% Juvenile Court 772,411 817,010 933,850 925,996 977,068 51,072 5.5% TOTAL JUDICIAL 1,014,881 1,113,199 1,215,543 1,127,689 1,162,074 34,385 3.0% RISK MANAGEMENT 519,587 407,505 489,846 484,477 520,896 36,419 7.5% OTHER PROGRAMS Johnson City Public Library 1,970,525 2,070,225 2,148,951 2,186,877 2,240,975 54,098 2.5% Other Miscellaneous Appropriations 1,112,820 1,601,150 1,049,963 3,625,103 1,079,277 (2,545,826) -70.2% Quasi-Governmental Appropriations 3,568,733 3,904,235 4,541,535 4,541,535 5,195,778 654,243 14.4% TOTAL OTHER 4,681,553 5,505,385 5,591,498 8,166,638 6,275,055 (1,891,583) -23.2% TOTAL GENERAL FUND ADMINISTRATIVE 12,866,836 14,638,150 16,479,341 18,536,905 18,194,773 (342,132) -1.8% GENERAL GOVERNMENT EXPENDITURE SUMMARY Personal Services 4,204,467 4,836,561 5,252,210 5,225,799 6,079,882 827,672 15.8% Operating 2,010,291 2,225,979 3,486,682 2,957,591 3,598,861 112,179 3.8% Other 6,652,078 7,575,610 7,740,449 10,353,515 8,516,030 775,581 7.5% TOTAL GENERAL GOVERNMENT 12,866,836 14,638,150 16,479,341 18,536,905 18,194,773 1,715,432 9.3%
Planning and Development Services

The Planning and Development Services Department provides professional guidance and technical expertise to elected officials, six appointed boards and commissions, city departments, the development community, stakeholders and citizens to assist them in understanding and addressing development concerns and processes in the community.
BUILDING DIVISION
Key responsibilities include:
• Accepting plans and generating plans review on all phases of construction in Johnson City, including building, electrical, plumbing, gas/ mechanical and site plans.
• Issuing permits for each phase of construction
• Conducting inspections
• Issuing certificates of occupancy for each project
CODES DIVISION
Key responsibilities include:
• Enforcement of City codes and minimum housing concerns
• Acting as liaison for the Board of Dwelling Standards and Review and in accordance with this board help resolve minimum and dilapidated housing and unsafe structures
• Citation, mitigation and potential litigating action to help resolve outstanding code violations.
107
Department Overview
Department Overview
PLANNING DIVISION
Key responsibilities include:
• Plans and implements a diverse program whose primary goal is the improvement of quality of life for low and moderate-income citizens of Johnson City
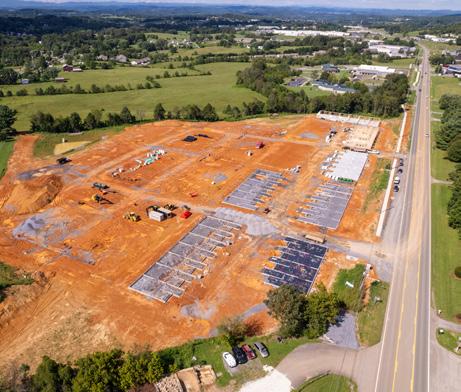
• Developing a series of 1-year plans with the assistance and input of the Housing and Community Development Advisory Board to meet the needs identified and outlines the financial resources available
2023 ACCOMPLISHMENTS
Reintegrated the HUD/THDA Community Development Program back into department operations with the hiring of a Community Development Coordinator
Created a voicemail and email address accessible to all permit staff to ensure all requests are addressed and coordinated throughout the building division Streamlined the inspection scheduling details in City View
2024 GOALS & OBJECTIVES
Lead the Growth Management Plan selection committee, to help identify and recommend a consultant

Work with selected consultant to ensure proper benchmarks are identified and achievable deadlines established
Continue to review and update zoning and city ordinances

108
Department Overview
COMMUNITY DEVELOPMENT DIVISION
Key responsibilities include:
• Plans and implements a diverse program whose primary goal is the improvement of quality of life for low- and moderate-income citizens of Johnson City.
• Developing a series of 1-year plans with the assistance and input of the Housing and Community Development Advisory Board to meet the needs identified and outlines the financial resources available.
2023 ACCOMPLISHMENTS
Provided funding to community partners to rehabilitate 17 homes for low-moderate income individuals and provided funding to fund operations for two shelters

Identified areas of the programs which needed improved compliance and implemented solutions Built relationships with area non-profits to collaborate and provide increased services to the community
2024 GOALS & OBJECTIVES
Increase the availability of affordable housing options for residents by collaborating with developers, nonprofit organizations, and housing authorities to create and maintain affordable housing units
Identify and secure additional external funding opportunities and grants to support community development projects and initiatives
Work on revitalizing distressed neighborhoods by addressing blight, improving housing conditions, and supporting community-led initiatives
Utilize data-driven approaches to assess community needs, track progress, and make informed decisions
109
Department Overview
Development Services
Director of Development Services
(22) Employees
Administrative Specialist II (1)
Planning Community Development
Development Coordinator (1)
Planner II (2)
Code Enforcement
Chief Building Official (1)
Code Enforcement Supervisor (1)
Community Dev. Coordinator (1)
Planner II (2)
Trade Inspector II (3)
Senior Planning Technician (1)
Planning Technician (1)
Trade Inspector I (3)
Code Enforcement Officer (3)
Plans Examiner (1)
Permitting Coordinator (1)
Permitting Technician (2)
110
111 Department Overview Dollars (In Thousands) Fiscal Year
0 $500 $1,000 $1,500 $2,000 $2,500 $3,000 2020 2021 2022 2023 2024
Development
Development Services Expenditures
Operating Personal Services
Services Expenditures by Category 67% 33%
Department Overview
112
Actual Actual Budget Projected Budget Bdgt. 24 % Development Services FY 2021 FY 2022 FY 2023 FY 2023 FY 2024 vs. Proj. 23 Change GENERAL FUND DEVELOPMENT SERVICES Code Enforcement 986,551 1,072,675 1,279,488 1,253,898 1,367,601 113,703 9.1% Planning 556,195 577,028 680,552 666,941 685,624 18,683 2.8% TOTAL DEVELOPMENT SERVICES 1,542,746 1,649,703 1,960,040 1,920,839 2,053,225 132,386 6.9% DEVELOPMENT SERVICES - GENERAL FUND EXPENDITURE SUMMARY Personal Services 1,258,440 1,389,009 1,704,342 1,670,255 1,759,294 89,039 5.3% Operating 284,306 260,694 255,698 250,584 293,931 43,347 17.3% TOTAL EXPENDITURES 1,542,746 1,649,703 1,960,040 1,920,839 2,053,225 132,386 6.9% COMMUNITY DEVELOPMENT FUND CDBG Administration 80,451 122,151 80,000 80,000 102,880 22,880 28.6% Housing Rehabilitation 239,611 375,198 680,000 680,000 483,000 (197,000) -29.0% Public Facility 291,256 0 0 0 0 0 0.0% THDS Emergency Services Grant 161,250 281,318 161,250 161,250 134,375 (26,875) -16.7% Other 354,080 323,331 0 0 0 0 0.0% TOTAL COMMUNITY DEVELOPMENT FUND 1,126,648 1,101,998 921,250 921,250 720,255 (200,995) -21.8% COMMUNITY DEVELOPMENT EXPENDITURE SUMMARY Personal Services 0 0 80,000 80,000 90,978 10,978 13.7% Operating 772,568 778,667 841,250 841,250 629,277 (211,973) -25.2% Other 354,080 323,331 0 0 0 0 0.0% TOTAL EXPENDITURES 1,126,648 1,101,998 921,250 921,250 720,255 (200,995) -21.8% TOTAL DEVELOPMENT SERVICES 2,669,394 2,751,701 2,881,290 2,842,089 2,773,480 (68,609) -2.4%
Facilities Management
The Facilities Management Department is responsible for building maintenance and improvements for more than 118 city-owned facilities.
Key responsibilities include:
• Oversees the design and construction of municipal and schools large capital projects, including new construction, renovations, complex HVAC systems, plumbing, electrical, operating systems, and roofing

• Preparation of annual operating and capital budgets
• Schedule facility modifications, to include providing estimates on equipment, labor, materials and other related costs
• Supporting all other city departments in planning and implementing projects according to their specific program needs
2023 ACCOMPLISHMENTS
Completed Lake Ridge Elementary classrooms addition, site improvements and HVAC upgrades
Completed
2024 GOALS & OBJECTIVES
113 Department
Overview
Complete Ashe Street Courthouse Renovation
new fire department training center
former jail space to evidence storage and offices for police department
multiple improvement and construction projects for City buildings
Construct
Convert
Department Overview
Facilities Management
Facilities Management Director (15) Employees
Facilities Maintenance Manager (1)
Crew Supervisor (1)
Facilities Maintenance Mechanic (7)
Custodian (4)
Administrative Specialist II (1)
114
115 Department Overview Operating Personal Services Facilities Management Expenditures by Category 55% 45% Dollars (In Thousands) Fiscal Year Facilities Management Expenditures 0 $500 $1,000 $1,500 $2,000 2020 2021 2022 2023 2024
Department Overview
116 Actual Actual Budget Projected Budget Bdgt. 24 % Facilities Management FY 2021 FY 2022 FY 2023 FY 2023 FY 2024 vs. Proj. 23 Change GENERAL FUND FACILITIES MANAGEMENT General Facilities 667,925 843,454 1,015,292 1,030,855 1,332,844 301,989 29.3% Municipal Building 279,591 272,653 339,773 332,978 356,974 23,996 7.2% Facilities Center 14,995 19,435 9,153 8,970 3,186 (5,784) -64.5% Keystone 136,595 154,757 139,168 136,385 145,707 9,322 6.8% Post Office 12,245 40,846 32,640 31,987 32,729 742 2.3% TOTAL FACILITIES MANAGEMENT 1,111,351 1,331,145 1,536,026 1,541,175 1,871,440 330,265 21.4% FACILITIES MANAGEMENT EXPENDITURE SUMMARY Personal Services 628,055 734,104 808,106 866,484 1,035,587 169,103 19.5% Operating 483,296 597,041 727,920 674,691 835,853 161,162 23.9% TOTAL EXPENDITURES 1,111,351 1,331,145 1,536,026 1,541,175 1,871,440 330,265 21.4%
In accordance with the City Charter and various state and federal governmental authorities uses proper accounting procedures to insure efficient and responsible management of official City records and related financial information.
Work is carried out by the following divisions:
ADMINISTRATION
Key responsibilities include:
• Insuring all divisions of the Finance Department operate efficiently in accordance with the City Charter and proper accounting procedures.
• Maintaining official records of the City, providing financial information to City Departments and citizens, preparing ordinances and resolutions

ACCOUNTING
Key responsibilities include:
• Ensures that all cash receipts and expenditures are properly authorized, valued, and recorded in the official books of record; that all related assets and liabilities, including accruals, are properly valued and recorded, and that all local, state, and federal reports are prepared in an accurate and timely manner.
• Month-end close and preparation of the monthly financial statements for all departments of the City
• Processes all disbursements related to school construction and ensures that all such transactions are properly authorized, valued, and reflected in the official books of record
• Conducts capital project tracing and fixed asset reporting for the City’s fixed assets, as well as school, land, and buildings
• Processes approximately 12,000 checks for goods and services purchased by the City.


117
Department Overview Finance
Department Overview
COLLECTIONS
Key responsibilities include:
• Ensuring adherence to various property tax laws, including administering the State Tax Relief program at the local level. Month-end close and preparation of the monthly financial statements for all departments of the City
• Maintaining business tax files for the Department of Revenue and working with them on sales tax collections,.Conducts capital project tracing and fixed asset reporting for the City’s fixed assets, as well as school, land, and buildings
• Billing and collection of real, personal, and public utility property taxes, wholesale liquor tax, wholesale beer tax, gross receipts tax, beer server permits, and other fees, licenses, permits, and special assessments.
• Receiving all utility payments and receipt collections for Parks and Recreation, the Senior Center, Police Records, Transit, Golf, and Freedom Hall.
RECORDS
Key responsibilities include:
• Preserving the official records of the City by scanning, filing, and storing them
2023 ACCOMPLISHMENTS
Coordinated the borrowing of funds process for any debt-funded capital approved by the City Commission
Coordinated the verification of TIF properties and complete the calculation of the tax increment payment to the Johnson City Development Authority for the current fiscal year
2024 GOALS & OBJECTIVES
Develop professional staff through participation in the MTAS CMFO program, GFOA governmental accounting submersion classes and training, and customer service training
Participate in implementation training of new financial reporting software and plan for implementation of new utility billing software
118
119 Department Overview Finance Director (19) Employees Administrative Specialist II (1) Assistant Finance Director (1) Accounting Collections Collections Specialist (1) Tax Specialist (1) Staff Accountant (5) Accounting Technician Payroll (2) Accounts Payable Specialist (2) Records Specialist (1) Collections/Customer Service Clerk (4) Finance
23%
120 Department Overview Dollars (In Thousands) Fiscal Year Finance Expenditures 0 $500 $1,000 $1,500 $2,000 2020 2021 2022 2023 2024
Personal
Finance
Operating
Services
Expenditures by Category 77%
121 Department
Actual Actual Budget Projected Budget Bdgt. 24 % Finance FY 2021 FY 2022 FY 2023 FY 2023 FY 2024 vs. Proj. 23 Change GENERAL FUND FINANCE Administration 218,040 223,214 245,305 240,399 236,639 (3,760) -1.6% Accounting 890,266 852,758 969,741 977,946 1,067,223 89,277 9.1% Collections 477,551 462,103 540,838 521,294 575,930 54,636 10.5% Records Management 63,690 65,592 72,841 71,384 77,417 6,033 8.5% TOTAL FINANCE 1,649,547 1,603,667 1,828,725 1,811,023 1,957,209 146,186 8.1% FINANCE EXPENDITURE SUMMARY Personal Services 1,258,469 1,226,439 1,417,418 1,407,942 1,511,438 103,496 7.4% Operating 391,078 377,228 411,307 403,081 445,771 42,690 10.6% TOTAL EXPENDITURES 1,649,547 1,603,667 1,828,725 1,811,023 1,957,209 146,186 8.1%
Overview
Department Overview
The Johnson City Fire Department’s mission is to embrace servant leadership, maintain a positive and active role in the community, and seek opportunities to help others in traditional and non-traditional fire rescue operations. The department accomplishes this mission through trust, education, teamwork, professionalism, and pride, while pursuing service excellence, and maintaining the highest standards of safety for those who face the loss of life, property, and livelihood.

The department’s nine fire stations and 12 emergency response apparatus are staffed by 133 personnel who provide fire suppression, emergency medical services, fire prevention inspection, public education, fire cause and origin determination, hazardous materials response, special rescue operations, training, and related support functions to approximately 71,000 citizens across Johnson City. In 2016, the department was recognized as a Class One Fire Department by the Insurance Service Office (ISO). In 2021 the department was received International Accreditation through the Center for Public Safety Excellence (CPSE).

Work is carried out by the following divisions:
ADMINISTRATION
Key responsibilities include:
• Planning, implementation, and review of departmental short and long-range goals, training, professional development, logistics, records and reports, and budget development and monitoring
• Developing general policies for the direction of the department
• Conducting and evaluating needs assessments
• Making recommendations for the construction of fire stations and the purchase of apparatus and equipment, and conducting project management
• Developing recommendations for the protection of life and property in the City.
• Coordinating and communicating with other City services and divisions to accomplish the overall mission of the City.
122 Fire
PROTECTION
Key responsibilities include:
• The day-to-day provision of emergency services to City residents and guests
• Responding to all calls for emergency medical assistance
• Providing service to the community 24 hours a day, 365 days a year
• Maintaining proficiency through in-service and outside training objectives
• Participation in neighborhood community events, such as fire safety education, smoke detector programs, CPR training, Community Emergency Response Team (CERT) training, homeowners’ association meetings, demonstrations, community gatherings, etc
• Conducting routine equipment maintenance, coordinating apparatus maintenance with Fleet Management, maintaining Insurance Service Office (ISO) components, accomplishing hose testing, and implementing organizational programs
2023 ACCOMPLISHMENTS
Developed an annual audit of the training program that reviews content, delivery methodology, facilities, equipment, relationships to emergency response, and overall outcomes. The audit team shall include internal and external stakeholders
Conducted a comprehensive analysis to determine if the community’s needs match the department’s hazardous materials response resources’ capabilities
Improved water rescue resources by training all personnel to the awareness level and 20 personnel to the technician level
2024 GOALS & OBJECTIVES
Develop a continuity of operations (COO) plan for the Johnson City Fire Department by establishing COOs for each division of Fire Department
Finalize training, policy development, and purchasing equipment to allow the Fire Department to seek accreditation of our Hazmat Team by the Tennessee Emergency Management Agency
TEMA as a Type II Hazmat asset
123
Department Overview
Chief (6)

(36)
(54)
124
District
Lieutenant
District
Fire
Department Overview Fire Chief (136) Employees Administration Protection Prevention Training Deputy Fire Chief (1)
(27) Fire Marshal (1) Fire Prevention Officer (4)
Chief (1)
Equipment Technician (1) Driver Engineer
Firefighters
Assistant Fire Chief (2) Administrative Services Manager (1) Administrative Specialist II (1)
Fire Department
Fire Department Expenditures
Fire Department Expenditures by Category 89% 11%
Personal Services
Operating
125 Department Overview Dollars (In Thousands) Fiscal Year
0 $3,000 $6,000 $9,000 $12,000 $15,000 2020 2021 2022 2023 2024
Department Overview
126
Actual Actual Budget Projected Budget Bdgt. 24 % Fire FY 2021 FY 2022 FY 2023 FY 2023 FY 2024 vs. Proj. 23 Change GENERAL FUND FIRE Administration 585,930 613,737 735,577 744,175 820,658 76,483 10.3% Accreditation 7,504 9,598 10,600 10,494 11,000 506 4.8% Protection 10,417,220 10,940,410 11,492,512 12,292,512 12,363,816 71,304 0.6% Prevention 341,821 418,565 509,079 503,988 558,648 54,660 10.8% Training 245,065 174,839 340,107 336,706 337,793 1,087 0.3% TOTAL FIRE 11,597,540 12,157,149 13,087,875 13,887,875 14,091,915 204,040 1.5% FIRE EXPENDITURE SUMMARY Personal Services 10,361,294 10,913,515 11,614,644 12,414,644 12,490,036 75,392 0.6% Operating 1,236,246 1,243,634 1,473,231 1,473,231 1,601,879 128,648 8.7% TOTAL EXPENDITURES 11,597,540 12,157,149 13,087,875 13,887,875 14,091,915 204,040 1.5%
Parks & Recreation
BY THE NUMBERS
• 1,350 acres of park land
• 24 parks
• 23 lighted tennis courts
• 1 golf course
• 19 play structures
• 1 inclusive playground
• 2 inclusive splash pads
• 5 indoor basketball courts
• 6 sand volleyball courts
The Parks and Recreation Department provides a wide range of programming, services and facilities for people of all ages to gather, celebrate, and participate in activities that promote their engagement in health, wellness, lifelong learning, community, and the environment. Parks and Recreation staff provide leadership, strategic planning, financial management and administrative support to meet citizens’ expectations for service delivery, quality customer service, diverse programming, and well-managed facilities.
Work is carried out by the following divisions:
ADMINISTRATIVE
ATHLETIC SERVICES
Key responsibilities include providing leadership to all department divisions. Key responsibilities include:
• Coordinating adult and youth league and tournament play for over 300 teams and 5,100 participants.
• Provides athletic facilities and maintenance of those facilities, and coordinates schedules for the following Johnson City Schools’ programs: 1) Seventh grade baseball; 2) Eighth grade baseball, football, and soccer; 3) two middle school programs; and 4) freshman, junior varsity, varsity, and events for football, baseball, tennis, soccer, softball and lacrosse.
• 1 18-hole disc golf course
• 9 outdoor basketball courts
• 11 youth baseball fields
• 10 softball fields
• 12 rectangular fields
• 19.75 miles of hiking and walking trails, mountain bike trails at Tannery Knobs and Winged Deer Park
• 1 dog park
• 1 football stadium
• 1 baseball stadium
• 4 recreational centers
• 1 multi-generational community center with amphitheater
• 5 swimming pools
• 1 lakefront area
• 2 boat ramps
• 2 amphitheaters,
• 1 boardwalk
• 1 festival plaza
• 1 historic cabin
• 30+ pavilions
127
Department Overview
Department Overview
PARK SERVICES
Key responsibilities include:
• Managing the daily schedule of events and services to park patrons and participants in programmed sporting leagues.
• Maintaining all City park system structures, athletic fields, and common landscaped areas.
RECREATION SERVICES
Key responsibilities include:
• Coordinating and delivery of a range of community recreation programs and services across the

• City targeting children, youth, adults and seniors as well as other specialized populations
• Supporting local community and cultural groups, including a range of arts, culture and heritage initiatives
• Maintaining the health, safety and reliability of City facilities.
2023 ACCOMPLISHMENTS
Partner with East Tennessee State University for potential internships

Renovation of the Community Garden at Carver Recreation Center
Developed new partnerships to increase programming opportunities
2024 GOALS & OBJECTIVES
Complete Parks and Recreation Department Master Plan
Successful opening and operation of the new complex at Winged Deer Park
Establish a Nature program, outdoor classroom and office space in the house at Winged Deer Park
Spearhead a citywide civility initiative
128
Johnson City Senior Services, a division of the Parks and Recreation Department operating as the Johnson City Senior Center at Memorial Park Community Center provides recreational programs, leisure services and educational opportunities for adults 50 and over. Nationally accredited through the National Institute of Senior Centers/National Council of Aging the division is led by its mission of engaging adults in active life through active living operating from a philosophy of whole person wellness.
Key responsibilities include:
• Offering a broad range of education and enrichment opportunities in the areas of health awareness, active lifestyle, functional fitness, lifelong learning, social enrichment, volunteers, transportation, travel, and social services.

• Providing affordable quality programs and activities to enrich the lives of adults in our community from all economic and social backgrounds.
2023 ACCOMPLISHMENTS
Hosted the Aging Well Conference
Held a 10-year anniversary and reaccreditation celebration

2024 GOALS & OBJECTIVES
Become a major sponsor fo the First District TN Senior Olympics, including coordination, registration and promotion of the events
Develop a Backyard Bucket List series that will include at least three events
129 Department
Overview
SENIOR SERVICES
Department Overview
GOLF SERVICES

Pine Oaks Golf Course, a division of the Parks and Recreation Department, provides services, programming and facilities for golfers of all levels to enjoy the game. In addition to daily play opportunities, the course offers a practice range, a stocked golf shop, annual pass options and gift certificates.
2023 ACCOMPLISHMENTS
Key responsibilities include:
• Coordinate adult, youth and tournament play
• Maintaining all structures, practice areas, turf, and landscaped areas.

Grew customer database to 4,643 allowing for increased and improved communication
Partnered with the Tennessee Golf Foundation to begin construction of a new building at the practice facility

2024 GOALS & OBJECTIVES
In conjunction with Tennessee Golf Foundation construct and open a new building at the practice facility that will house a full-time TGF employee
Improve safety and appearance of cart crossing on Buffalo Road, parking lot and entrance sign

130
Assistant Director (2)
Administrative Specialist III (1)
Administrative Specialist II (1)
Administrative Specialist I (1)
Promotions & Events Coordinator (1)
Program Coordinator I (1)
Parks and Recreation
Recreation Services Mangager (.25)
Aquatics Center Supervisor (1)
Head Lifeguard (1) Program Coordinator I (2.8)
Athletic Manager (1) Program Coordinator II (1)
Program Coordinator I (2.7)
Center Supervisor (1)
Program Coordinator II (1)
Program Coordinator I (1.4)
Park Maintenance Supervisor (1)
Custodian (3.65)
Receptionist (2.7)
Recreation Services Manager (.25)
Park Naturalist (1)
Park Services Manager (1)
Asst. Park Services Manager (1)
Park Maintenance Supervisor (4)
Lead Custodian (2)
Public Service Worker (12)
Park Services Technician (7)
Administrative Specialist II (1)
Custodian (2.8)
Services Manager (.25)
131 Department
Parks & Recreation Director (93.4) Employees Administration MPCC Aquatics Nature/Fairmont Athletics Carver Parks Services Langston Seniors Golf (13.95) Employees (8) Employees Recreation Services
Center Supervisor (1) Program Coordinator II (2) Public Service Worker (1) Receptionist (.7) Program Coordinator I (1.4)
Overview
Manager (.25)
Center
Program Coordinator
Receptionist
Recreation
Supervisor (1)
II (1.5)
(.7)
Parks & Recreation Expenditures
67% 33%
132 Dollars (In Thousands) Fiscal Year
0 $2,000 $4,000 $6,000 $8,000 $10,000 2020 2021 2022 2023 2024
Personal Services
Category
Department Overview
Operating
Parks and Recreation Expenditures by
133 Department
Actual Actual Budget Projected Budget Bdgt. 24 % Parks & Recreation FY 2021 FY 2022 FY 2023 FY 2023 FY 2024 vs. Proj. 23 Change GENERAL FUND PARKS & RECREATION Administration 561,942 709,843 767,923 752,565 879,964 127,399 16.9% Aquatics 325,476 481,119 470,256 460,851 594,089 133,238 28.9% Athletics 273,380 337,968 457,191 448,047 608,786 160,739 35.9% Carver Recreation Center 347,387 370,088 443,904 435,026 486,611 51,585 11.9% Langston Community Center 176,744 272,412 306,658 300,525 323,712 23,187 7.7% Memorial Park Community Center 675,863 779,402 954,309 935,223 1,048,790 113,567 12.1% Park Services 2,627,135 2,735,061 3,213,722 3,149,446 3,549,184 399,738 12.7% Nature/Fairmont Gym 99,945 97,152 111,066 108,845 143,948 35,103 32.3% TOTAL PARKS & RECREATION 5,087,872 5,783,045 6,725,029 6,590,528 7,635,084 1,044,556 15.8% PARKS & RECREATION EXPENDITURE SUMMARY Personal Services 3,337,641 3,746,078 4,463,850 4,374,573 5,050,521 675,948 15.5% Operating 1,750,231 2,036,967 2,261,179 2,215,955 2,584,563 368,608 16.6% TOTAL EXPENDITURES 5,087,872 5,783,045 6,725,029 6,590,528 7,635,084 1,044,556 15.8% PINE OAKS GOLF COURSE Administration 296,387 294,158 318,923 312,545 317,604 5,059 1.6% Pro Shop 33,153 27,665 41,000 40,180 53,000 12,820 31.9% Concessions 527 434 450 441 0 (441) -100.0% Golf Car Operations 26,575 31,014 32,170 31,527 35,500 3,973 12.6% Maintenance 622,986 559,368 629,529 616,938 681,937 64,999 10.5% TOTAL PINE OAKS GOLF COURSE 979,628 912,639 1,022,072 1,001,631 1,088,041 86,410 8.6% PINE OAKS GOLF COURSE EXPENDITURE SUMMARY Personal Services 552,510 590,580 649,671 636,678 681,658 44,980 7.1% Operating 427,118 322,059 372,401 364,953 406,383 41,430 11.4% TOTAL EXPENDITURES 979,628 912,639 1,022,072 1,001,631 1,088,041 86,410 8.6% SENIORS' CENTER Administration 304,225 401,010 435,315 429,208 477,521 48,313 11.3% Programming 147,172 151,795 259,596 254,404 283,559 29,155 11.5% Activities 22,380 46,305 69,100 67,718 73,450 5,732 8.5% Transportation 54,837 60,641 69,507 68,117 77,597 9,480 13.9% Volunteers 166 978 9,220 9,036 9,220 184 2.0% Health Education 67,274 70,953 78,850 77,273 83,711 6,438 8.3% TOTAL SENIORS' CENTER 596,054 731,682 921,588 905,756 1,005,058 99,302 11.0% SENIORS' CENTER EXPENDITURE SUMMARY Personal Services 529,512 627,299 759,976 752,376 833,646 81,270 10.8% Operating 66,542 104,383 161,612 153,380 171,412 18,032 2.0% TOTAL EXPENDITURES 596,054 731,682 921,588 905,756 1,005,058 99,302 11.0% TOTAL PARKS & RECREATION, GOLF, AND SENIORS 6,663,554 7,427,366 8,668,689 8,497,915 9,728,183 1,230,268 14.5%
Overview
Department Overview
Police
The Johnson City Police Department currently consists of 153 sworn men and women providing law enforcement services to citizens and visitors. Operating as the eighth largest police department in the eighth largest city in the state of Tennessee, the U.S. Census Bureau estimated Johnson City’s population at 72,514 in 2022. JCPD’s jurisdiction spans 44 square miles with more than 500 miles of roadway through Washington, Carter, and Sullivan counties. In addition to law enforcement officers, the FY 2024 budget includes 13 full-time civilian employees.

Many of the Police Department’s activities are made possible through the acquisition and management of grant funding from federal and state agencies. Other funding sources support the Police Department’s mission and include the Technology Fund, a municipal court set-aside percentage of citation revenue, defensive driving fees, and the Drug Fund funded through fines and forfeitures.

Work is carried out by the following divisions:
ADMINISTRATIVE
Key responsibilities include:
• Oversight of the Office of Professional Standards, Accreditation Unit, Planning and Research, Crime Analysis Unit, Juvenile Court Officer, Property and Facilities Unit/Evidence, Records Unit, School Resource Unit, and Training Unit
• Interacting with other city staff and managing policy, budgets, personnel, fleet, and technology
134
CRIMINAL INVESTIGATIONS
Key responsibilities include:
• Investigates criminal activity and follows up on reports generated by other divisions
• Collecting, analyzing and preserving evidence
• Coordinating search and arrest warrants and arresting suspects as necessary
• Coordination with other lawenforcement agencies to more effectively address public safety issues
OPERATIONS
Key responsibilities include:
• Responding to calls for service involving traffic accidents, ordinance violations, crimes against persons and property, and other calls for assistance
• Enforcing laws
• Special event policing, crime prevention programs, community outreach and education, and involvement in community projects and programs designed to improve citizen partnerships for a safer community
• Prevention of crimes by maintaining a highly visible presence and enforcing proactive community enforcement measures
• Staffing of special operations units to include bicycle unit, canine unit, crisis intervention team, crisis negotiations unit, explosive ordnance unit, and SWAT unit
2023 ACCOMPLISHMENTS
Increased recruitment in FY 23 due to policy changes and new interview/onboarding processes
Contracted with Axon to outfit every patrol and criminal investigation officer with a body-worn camera
Engage with the community with over twelve service projects including: Shop with a Cop, Law Enforcement Torch Run for Special Olympics, and Community Roundtables
Began renovation designs of the former Women’s Detention Center to provide much needed space for Property and Evidence
2024 GOALS & OBJECTIVES
Improve the safety of residents and visitors by increasing patrol in ‘Hot Spot’ designated areas
Prioritize recruitment efforts to restore and increase staffing to meet FBI recommendations
Expand training for all officers to include Advanced Law Enforcement Rapid Response Training and collaborative training efforts with surrounding jurisdictions
Continue the renovation and expansion of Property and Evidence into one secure area
Address items in the investigatory findings of the Audit of Sex-Related Crimes
Onboard a new Homeless Outreach Coordinator to effectively address homelessness within the community and provide support to citizens experiencing homelessness through a collaborative approach with the City and outside organizations
135
Department Overview
Department Overview
JOHNSON CITY/WASHINGTON COUNTY FAMILY JUSTICE CENTER
Key responsibilities include:
• Provision of both direct and indirect services to victims of domestic violence, sexual assault and human trafficking.
• Provision of outreach, education and presentations to the community.
2023 ACCOMPLISHMENTS
Received renewal of the Victim of Crime Act (VOCA) Grant for FY 23
Began effort to move and expand the Family Justice Center facility
2024 GOALS & OBJECTIVES
Receive the Award for the FY 2024 Victims of Crime Act (VOCA) Grant
Increase comprehensive support services
Relocate to a different facility to better serve clients
Expand educational workshops to empower survivors, bring awareness to the community, promote prevention and reduce stigma
136
Police Department Expenditures
Police Department Expenditures by Category
Personal Services Operating
Other
137 Department Overview Dollars (In Thousands) Fiscal Year
0 $5,000 $10,000 $15,000 $20,000 2020 2021 2022 2023 2024
82% 15% 3%
Department Overview
Training
Sergeant (2)
Police Department
Chief of Police (170) Employees
Administrative Specialist II (1)
Special Assistant to U.S. Attorney General (1)
Deputy Chief (1)
Family Justice Center (1)
Patrol
Major (1)
Captain (5)
Lieutenant (6)
Lieutenant (6)
Sergeant (11)
Police Officer (92)
Sergeant (2)
Police Officer (3)
Canine Records
Sergeant (1)
Records Clerk (6)
Police Officer (1)
Digital Forensic Analyst (1)
Crime Analyst (1)
Services Administration Property
Major (1)
Administrative Specialist II (1)
Sergeant (1)
Police Officer (2)
Criminal Investigation Division Accreditation
Captain (1)
Lieutenant (1)
Sergeant (3)
Police Officer (16)
Clerical Specialist (1)
Drug Fund
Police Officer (1)
Administrative Services Manager (1)
Administrative Specialist II (1)
Planning and Research Analyst (1)
Homeless Outreach Coordinator (1)
Police Grant Fund
Family Justice Center Secretary (2)

138
139 Department Overview Actual Actual Budget Projected Budget Bdgt. 24 % Police FY 2021 FY 2022 FY 2023 FY 2023 FY 2024 vs. Proj. 23 Change GENERAL FUND POLICE Administration 467,234 456,760 630,823 624,515 691,240 66,725 10.7% Criminal Investigation Division 1,718,286 1,781,193 1,888,354 1,869,470 2,292,804 423,334 22.6% Crime Prevention 2,130 6,206 10,788 10,680 10,788 108 1.0% Patrol 8,971,440 9,357,454 10,355,098 9,757,903 10,815,333 1,057,430 10.8% Canine 345,118 320,095 426,978 422,708 418,417 (4,291) -1.0% SWAT 32,811 10,671 14,540 14,395 14,540 145 1.0% EOD (Bomb Squad) 2,203 3,943 6,085 6,024 6,085 61 1.0% Records 544,018 592,121 643,071 636,640 741,703 105,063 16.5% Training 272,672 293,784 371,875 368,156 461,047 92,891 25.2% Services Administration 385,216 354,581 372,536 368,811 470,429 101,618 27.6% Property 339,585 355,236 369,669 365,972 379,758 13,786 3.8% Accreditation 245,734 221,022 259,314 256,721 252,258 (4,463) -1.7% Detention 937,737 845,327 1,081,915 1,071,096 10,000 (1,061,096) -99.1% Family Justice Center 119,331 127,261 155,457 153,902 170,257 16,355 10.6% TOTAL GENERAL FUND 14,383,515 14,725,654 16,586,503 15,926,993 16,734,659 807,666 5.1% OTHER PROGRAMS Police Grant Fund 137,973 122,723 157,406 169,062 159,500 (9,562) -5.7% Drug Fund 107,668 336,418 224,400 224,400 229,000 4,600 2.0% Police Technology Fund 236,443 157,766 212,104 212,104 188,074 (24,030) -11.3% TOTAL OTHER PROGRAMS 482,084 616,907 593,910 605,566 576,574 (28,992) -4.8% TOTAL POLICE 14,865,599 15,342,561 17,180,413 16,532,559 17,311,233 778,674 4.7% POLICE EXPENDITURE SUMMARY Personal Services 12,450,327 12,873,509 14,163,909 13,552,851 14,197,755 644,904 4.8% Operating 1,933,188 1,852,145 2,422,594 2,374,142 2,536,904 162,762 6.9% Other 482,084 616,907 593,910 605,566 576,574 (28,992) -4.8% TOTAL EXPENDITURES 14,865,599 15,342,561 17,180,413 16,532,559 17,311,233 778,674 4.7%
Department Overview
Public Works
Services provided by the Public Works Department are instrumental in addressing environmental, public health, and local transportation issues. Public Works manages the maintenance of streets with services including stormwater infrastructure, asphalt paving, pothole and cut/patch repair, the removal of snow and ice from bridges and streets, as well as street sweeping.
Work is carried out by the following divisions:
Key responsibilities include:
• Pavement maintenance (patching, resurfacing, traffic calming and alley maintenance)
• Right-of-way maintenance (mowing, street sweeping, and snow removal)
• Landscaping and urban forestry
• Maintenance of public spaces in downtown

• Construction and maintenance of sidewalks, roadways and public parking lots
TRAFFIC
Key responsibilities include:
• Installs and maintains all traffic control signage, pavement markings and signalization
140
STREET
ENGINEERING
Key responsibilities include:
• Performs development plan reviews
• Oversees public and private construction
• Designs and manages construction projects
• Reviews street light requests
The general fund supports the streets, traffic and engineering divisions.
STORMWATER
Key responsibilities include:
• Maintains and upgrades the stormwater system
The stormwater fund supports the stormwater division.

2023 ACCOMPLISHMENTS
Completed North State of Franklin and Knob Creek roads intersection
Completed two mural installations
Completed center turn lane on West State of Franklin Road between W. Watauga Avenue and University Parkway
Completed 100 percent of the resurfacing program
2024 GOALS & OBJECTIVES
Complete Cherokee Street Extension
Complete upgraded downtown crosswalk lighting
Complete bike pump track and dog park
Complete West Walnut Street Detention Basin
141
Department Overview
Public Works Expenditures
Public Works Expenditures by Category 60%
40%
Operating Personal Services
142 Department Overview Dollars (In Thousands) Fiscal Year
0 $5,000 $10,000 $15,000 $20,000 2020 2021 2022 2023 2024
Public Works
143 Department Overview PUBLIC WORKS Public Works Director (159.6) Employees Traffic Engineering Streets Division Solid Waste Stormwater Tree Beautification & Landscaping Pavement Maintenance ROW Maintenance Streets Sweeping Downtown Maintenance Construction Admin. Admistrative Specialist II (1) General Supervisor (1) Crew Supervisor (1) MEO (10) 66.6 Employees 8.5 Employees City Engineer (1) Civil Engineer (3) Construction Inspector (3) Surveyor (1) Engineering Technician (1) Survey Technician (1) Survey Supervisor (1) Crew Supervisor (2) Landscape Technician (3) MEO (1) Tree Trimmer (2) City Forester (1) Asst. Director of Public Works (1) Operations Manager (1) Design & Construction Coordinator (2) Office Manager (1) Administrative Specialist II (2) Engineering Manager (1) System Specialist (1) Signal Technician (3) Signs & Markings Specialist (1) Signs & Markings Technician (1) Administrative Specialist II (1) Civil Engineer (1) Custodian (1) Facilities Maintenance Mechanic (1) Crew Supervisor (1) MEO (3) Tree Trimmer (2) General Supervisor (2) Crew Supervisor (2) Concrete Maintenance Worker (5) Facilities Maintenance Technician (1) MEO (10) MEO (1) MEO (2)
Department Overview
144
Actual Actual Budget Projected Budget Bdgt. 24 % Public Works FY 2021 FY 2022 FY 2023 FY 2023 FY 2024 vs. Proj. 23 Change GENERAL FUND PUBLIC WORKS Administration 480,834 289,342 442,592 433,740 422,470 (11,270) -2.6% Street Division 514,864 509,812 550,380 539,372 642,856 103,484 19.2% Pavement Maintenance 866,705 762,058 919,440 901,052 1,022,255 121,203 13.5% Street Resurfacing/Reconstruction 4,498,572 2,743,408 3,861,150 3,782,927 5,414,195 1,631,268 43.1% ROW Maintenance 485,518 475,985 546,443 535,514 534,812 (702) -0.1% Street Sweeping 216,247 187,984 214,026 209,745 226,531 16,786 8.0% Mowing 425,478 369,724 457,950 448,791 501,500 52,709 11.7% Tree Beautification 312,026 322,091 379,640 372,047 404,277 32,230 8.7% Snow Removal 177,794 181,782 250,005 245,005 248,940 3,935 1.6% Landscaping 348,839 389,802 385,178 377,474 442,742 65,268 17.3% Construction Administration 1,657,385 1,680,682 1,960,606 1,921,394 2,110,532 189,138 9.8% Downtown Maintenance 182,250 192,810 186,922 183,184 222,221 39,037 21.3% Traffic Calming 18,565 21,657 19,000 18,620 30,000 11,380 61.1% Sidewalk New /Replacement 186,904 251,300 164,600 161,308 219,600 58,292 36.1% Signage/Painting 1,159,877 1,202,638 1,335,681 1,308,967 1,457,409 148,442 11.3% Street Lighting 1,643,759 1,557,467 1,700,000 1,667,000 1,700,000 33,000 2.0% Traffic Signals 214,622 234,242 275,600 270,088 318,200 48,112 17.8% Engineering 865,592 847,865 989,363 969,576 1,163,159 193,583 20.0% TOTAL PUBLIC WORKS 14,255,831 12,220,649 14,638,576 14,345,804 17,081,699 2,735,895 19.1% PUBLIC WORKS - GENERAL FUND EXPENDITURE SUMMARY Personal Services 5,241,102 5,247,609 6,180,226 6,006,621 6,806,204 799,583 13.3% Operating 9,014,729 6,973,040 8,458,350 8,339,183 10,275,495 1,936,312 23.2% TOTAL EXPENDITURES 14,255,831 12,220,649 14,638,576 14,345,804 17,081,699 2,735,895 19.1% OTHER FUNDS: STORM WATER MANAGEMENT Operations 1,065,350 841,371 1,422,137 1,407,915 1,416,524 8,609 0.6% Other* 718,218 782,602 1,014,064 1,014,064 1,018,617 4,553 0.4% TOTAL STORM WATER MANAGEMENT 1,783,568 1,623,973 2,436,201 2,421,979 2,435,141 13,162 0.5% * Other includes debt service interest, depreciation, admin fees, and other fees
SOLID WASTE
Solid Waste, a division of Public Works, is responsible for the collection of residential, commercial, and industrial refuse in Johnson City and Washington County. The division’s 54 employees service an area of 320 square miles, operating an average of 30 routes daily. Additional brush and leaf collection is provided up to 34 weeks annually.
Key responsibilities include:
• Collection of residential, commercial and industrial refuse within Johnson City and Washington County
• Collection of brush and leaves
• Process recyclable material from the curbside recycling program and five drop-off sites throughout the City
2023 ACCOMPLISHMENTS
Completed analysis of current and future costs of solid waste operations
Implemented a rate increase to ensure solid waste operations are fully funded through Fiscal Year 2031
2024 GOALS & OBJECTIVES
Complete a feasibility study of alternative fueled vehicles
Implement software to produce more efficiencies and productivity in the industrial roll off division of solid waste
145
Department Overview
146 Department
Solid Waste Manager (66.6) Employees Public Works Director Municipal Solid Waste Administration City Collections Commerical Collections Industrial Collections Iris Glen Landfill Recycling Refuse Collection Yard Waste Diversion Litter Collection Leaf Collection Regional Solid Waste Solid Waste Safety Trainer (.5) Management Analyst (.5) Office Manager (.2) General Supervisor (1) Service Technician (2) Solid Waste Safety Trainer (.5) Sanitation Equipment Operator (10) Sanitation Equipment Operator (7) General Supervisor (1) Crew Supervisor (1) MEO (6.5) MEO (2) Sanitation Equipment Operator (6) Management Analyst (.5) Administrative Specialist I (1) General Supervisor (1) Customer Service Clerk (.1) Environmental Auditor (.6) Sanitation Equipment Operator (9) Administrative Specialist II (.85) Administrative Specialist III (.8) Sanitation Equipment Operator (11) Administrative Specialist II (1.05) MEO (.5) Solid Waste
Overview
Solid Waste Expenditures
Solid Waste Expenditures by Category
Operating Personal Services
Other
147 Department Overview Dollars (In Thousands) Fiscal Year
0 $5,000 $10,000 $15,000 $20,000 2020 2021 2022 2023 2024
59% 26% 15%
Department Overview
148
Actual Actual Budget Projected Budget Bdgt. 24 % Solid Waste FY 2021 FY 2022 FY 2023 FY 2023 FY 2024 vs. Proj. 23 Change SOLID WASTE MUNICIPAL SOLID WASTE Administration 589,037 616,491 796,769 788,801 870,207 81,406 10.3% Residential Collection 1,801,215 1,826,095 2,058,794 2,038,206 2,291,619 253,413 12.4% Commercial Collection 1,858,691 2,020,589 2,209,858 2,187,759 2,404,405 216,646 9.9% Industrial Collection 2,477,128 2,489,950 2,668,111 2,641,429 3,328,317 686,888 26.0% Bowser Ridge Landfill 10,300 0 145,500 127,752 145,500 17,748 13.9% Cash Hollow 2,210 0 6,000 5,940 6,000 60 1.0% Iris Glen Landfill 72,641 67,551 85,829 84,971 93,616 8,645 10.2% Civitan Landfill 10,369 990 2,000 1,980 2,275 295 14.9% Recycling 1,035,313 1,104,451 1,233,966 1,221,626 1,370,303 148,677 12.2% Litter Collection 162,216 66,098 198,994 197,004 216,711 19,707 10.0% Refuse Collection 787,655 827,460 968,674 958,986 1,002,772 43,786 4.6% Leaf Collection 222,143 259,231 256,549 253,984 271,800 17,816 7.0% Yard Waste Diversion 65,098 83,284 232,835 230,507 338,450 107,943 46.8% Other* 1,585,057 1,703,894 1,768,819 1,768,819 1,876,349 107,530 46.8% TOTAL MUNICIPAL SOLID WASTE 10,679,073 11,066,084 12,632,698 12,507,764 14,218,324 1,710,560 13.7% * Other includes debt service interest, depreciation, admin fees, and other fees/transfers MUNICIPAL SOLID WASTE EXPENDITURE SUMMARY Personal Services 2,673,716 2,449,558 3,209,041 3,160,655 3,543,770 383,115 12.1% Operating 6,420,300 6,912,632 7,654,838 7,578,290 8,798,205 1,219,915 16.1% Other 1,585,057 1,703,894 1,768,819 1,768,819 1,876,349 107,530 6.1% TOTAL EXPENDITURES 10,679,073 11,066,084 12,632,698 12,507,764 14,218,324 1,710,560 13.7% REGIONAL SOLID WASTE Administration 2,429,344 2,578,292 2,736,761 2,736,761 3,247,829 511,068 18.7% WCUD Landfill 6,645 6,911 6,700 6,700 6,700 0 0.0% Other* 737,394 740,637 730,074 730,074 805,706 75,632 10.4% TOTAL REGIONAL SOLID WASTE 3,173,383 3,325,840 3,473,535 3,473,535 4,060,235 586,700 16.9% REGIONAL SOLID WASTE EXPENDITURE SUMMARY Personal Services 923,730 974,378 1,165,899 1,165,899 1,319,303 153,404 13.2% Operating 1,512,259 1,610,825 1,577,562 1,577,562 1,935,226 357,664 22.7% Other 737,394 740,637 730,074 730,074 805,706 75,632 10.4% TOTAL EXPENDITURES 3,173,383 3,325,840 3,473,535 3,473,535 4,060,235 586,700 16.9% * Other includes debt service interest, depreciation, admin fees, and other fees/transfers TOTAL SOLID WASTE 13,852,456 14,391,924 16,106,233 15,981,299 18,278,559 2,297,260 14.4%
Fleet Management
Fleet Management’s primary objective is to ensure all city departments have the resources available in vehicles, equipment and radios to provide efficient services to the citizens of Johnson City. Fleet Management is one of only 12 organizations in the state to have earned a Blue Seal of Excellence from the National Institute for Automotive Service Excellence.
Key responsibilities include:
• Maintains two fuel sites and an automated fueling system
• Provide effective management, maintenance and repair of fleet assets in a timely, cost effective manner
• Performs preventive maintenance and repairs on all city vehicles, equipment and radios
• Responsible for the communication system and tower sites
• Oversees 700 radios
2023 ACCOMPLISHMENTS
Dispensed over one million gallons of fuel/lubricants
Performed over 18,389 services and repairs
Maintained six operations (heavy truck garage, transit garage, light vehicle garage, tire shop, parts department and communication shop)
Maintained 909 city owned vehicles/ equipment, 246 miscellaneous equipment and 20 vehicles for outside agencies
Earned a Blue Seal of Excellence from the National Institute for Automotive Service Excellence
2024 GOALS & OBJECTIVES
Maintain 100% safety rating for all school and fire vehicles
Perform 85% of all repairs in-house
Evaluate the productivity and efficiency of each technician, striving to maintain an 80% production rating for each
Achieve a Master ASE Certification for 60% of the technicians
Achieve a minimum of 75% of all vehicle/equipment preventative maintenance performed on schedule
Achieve 70% of all repairs/maintenance completed within one workday
Provide fleet employees with a unique work environment that balances exceptional customer service, hard work, personal growth and gratification
Provide a customer-focused, strategic and systematic approach to continuous performance improvement
149
Department Overview
Department Overview
Fleet Management
Fleet Management Director (34.5) Employees
Operations Vehicles & Equipment Communications
Fleet Management Superintendent (1)
Inventory Control Manager (1)
Fleet Management Supervisor (1)
Fleet Management Maintenance Technician (1)
Inventory Specialist (2) Secretary (1)
Administrative Specialist II (1)
Administrative Specialist I (.5)
Master Service Technician (3)
Senior Service Technician (4)
Fleet Maintenance Supervisor (4)
Auto Technician (12)
Tire Service Worker (2)
Radio Services Manager (1)
150
151 Department Overview Dollars (In Thousands) Fiscal Year
0 $2,000 $4,000 $6,000 $8,000 $10,000 $12,000 2020 2021 2022 2023 2024
Personal
Other
Expenditures
Fleet Management Expenditures
Operating
Services
Fleet Management
by Category 69% 27% 4%
Department Overview
152
Actual Actual Budget Projected Budget Bdgt. 24 % Fleet Management FY 2021 FY 2022 FY 2023 FY 2023 FY 2024 vs. Proj. 23 Change FLEET MANAGEMENT Operations 546,808 506,720 787,983 780,103 839,027 58,924 7.6% Vehicles and Equipment 5,670,586 7,001,890 8,149,650 8,068,154 9,085,916 1,017,762 12.6% Communications 580,048 97,053 155,299 153,746 158,911 5,165 3.4% Other 533,629 400,220 389,257 389,257 399,088 9,831 2.5% TOTAL FLEET MANAGEMENT 7,331,071 8,005,883 9,482,189 9,391,260 10,482,942 1,091,682 11.6% FLEET MANAGEMENT EXPENDITURE SUMMARY Personal Services 2,106,262 2,065,218 2,700,256 2,673,254 2,825,839 152,585 5.7% Operating 4,691,180 5,540,445 6,392,676 6,328,749 7,258,015 929,266 14.7% Other 533,629 400,220 389,257 389,257 399,088 9,831 2.5% TOTAL EXPENDITURES 7,331,071 8,005,883 9,482,189 9,391,260 10,482,942 1,091,682 11.6%
Freedom Hall
Freedom Hall Civic Center is a multipurpose arena that opened on July 5, 1974, providing assembly, cultural, sports, entertainment facilities and services to the Johnson City schools, community and region. FHCC is located on the Liberty Bell campus and is adjacent to the Liberty Bell Middle School.
Over the last 50 years, Freedom Hall Civic Center has entertained millions of visitors with ice performances, circuses, horse shows, sporting events, conventions, music concerts, lecturers, bull riding, rodeos and other events.
Key responsibilities include:
• Schedule events, performances and lectures
• Maintain a facility that has a fixed seating capacity of 5,368 and a maximum capacity of 6,868
• Promote shows to maximize growth and sales
• Produce events at the Civic Center
2023 ACCOMPLISHMENTS
Hosted 19 basketball events, 19 ticketed events and 12 local events
Outsourced concessions
Secured sponsorships with Pepsi, Dr. Enuf and Chick-fil-a
Completed repairs on aging equipment and performed building maintenance
Booked two nationally-known conferences
Restarted the Independence Day Fireworks Celebration
2024 GOALS & OBJECTIVES
Host 20 or more ticketed events, 15 basketball events and 8 or more local events
Build on food and beverage opportunities
Develop a sponsorship and partnership plan
Research parking software
Explore possibilities for locker and dressing room
Renovate the kitchen
Partner with the Johnson City Visitors and Convention Bureau on conference opportunities
Acquire education grant for children’s summer activities
Start a club room in the dining hall for events and revenue
153 Department
Overview
Department Overview

154
General Manager (6) Employees
Administration
Box Office Manager (1)
Maintenance Building Manager (1)
Maintenance Worker (2)
Box Office Clerk (1)
Freedom Hall
Freedom Hall Expenditures
Freedom Hall Expenditures by Category
71% 29%
Operating Personal Services
155 Department Overview Dollars (In Thousands) Fiscal Year
0 $500 $1,000 $1,500 $2,000 $2,500 2020 2021 2022 2023 2024
Department Overview
156
Actual Actual Budget Projected Budget Bdgt. 24 % Freedom Hall FY 2021 FY 2022 FY 2023 FY 2023 FY 2024 vs. Proj. 23 Change FREEDOM HALL Administration 246,368 311,437 385,188 385,188 400,413 15,225 4.0% Shows 25,163 1,590,767 931,113 975,000 928,138 (46,862) -4.8% Maintenance 270,153 459,307 484,140 484,140 497,935 13,795 2.8% Concessions 6,462 40,076 41,112 41,112 37,872 (3,240) -7.9% Parking 240 11,768 11,700 11,700 11,200 (500) -4.3% Capital Outlay 0 9,000 0 0 0 0 0.0% TOTAL FREEDOM HALL 548,386 2,422,355 1,853,253 1,897,140 1,875,558 (21,582) -1.1% FREEDOM HALL EXPENDITURE SUMMARY Personal Services 338,137 481,970 528,213 528,213 541,599 13,386 2.5% Operating 210,249 1,931,385 1,325,040 1,368,927 1,333,959 (34,968) -2.6% Capital Outlay 0 9,000 0 0 0 0 0.0% TOTAL EXPENDITURES 548,386 2,422,355 1,853,253 1,897,140 1,875,558 (21,582) -1.1%
The Metropolitan Transportation Planning Organization (MTPO) serves as the regional transportation planning and coordination agency for the Johnson City Urban Area. The urbanized area includes the City of Johnson City, the Town of Jonesborough, the City of Elizabethton, the Town of Bluff City, a portion of the Town of Unicoi, and Carter, Sullivan, and Washington Counties. It should be noted that the urban area is defined by the U.S. Census Bureau. Federal law requires an MTPO to be established for any urbanized area over 50,000.

The current population of the Johnson City Urban Area is 128,519 and considered a small urban area by Federal Highway Administration. The City of Johnson City is the lead jurisdiction for the MTPO and is the largest jurisdiction in the MTPO. Per the MTPO bylaws, the Mayor of Johnson City or their proxy is the Chairman of the MTPO Executive Board and the City Manager or their proxy is the Chairman of the Executive Staff.
Johnson City, being the lead agency is responsible to ensure all federal laws and regulations are met in carrying out transportation planning activities. This is accomplished through the MTPO staff who are employees of Johnson City.

Key responsibilities include:
• Tasks associated with the development and maintenance of the Metropolitan (Long Range) Transportation Plan and the Transportation Improvement Program

157
Department Overview MTPO
Department Overview
2023 ACCOMPLISHMENTS
Managed state, federal and public review processes of the federally required Transportation Improvement Program containing the project phases scheduled for completion in the Fiscal Years 2023-2026.
Managed state, federal and public review processes of the federally required Metropolitan Transportation Plan in conjunction with a consultant.
Prepared a draft of the new Fiscal Years 2024-2025 Unified Planning Work Program.
2024 GOALS & OBJECTIVES
Finalize adoption of a new Fiscal Years 2024-2025 Unified Planning Work Program.
Adjust 2020 Johnson City Urban Area boundary to refine the lines as appropriate. Adjust the Johnson City MTPO Metropolitan Planning Area (MPA) boundary, which must include all parts of the designated urban area, along with areas that are expected to be urban within the next 20 years.
Facilitate coordination between TDOT and the City of Johnson City on the transfer of the Knob Creek Project
158

159 Department Overview
MPO Manager (1) MTPO (3) Employees
MTPO
Senior Transportation Planner (1) Transit Planner (1)
MTPO Expenditures by Category 76%
Personal Services
24%
Operating
160
Overview Dollars (In Thousands) Fiscal Year MTPO Expenditures 0 $100 $200 $300 $400 $500 2020 2021 2022 2023 2024
Department
161 Department
Metropolitan Transportation Actual Actual Budget Projected Budget Bdgt. 24 % Planning Organization FY 2021 FY 2022 FY 2023 FY 2023 FY 2024 vs. Proj. 23 Change MTPO Fund MTPO - FWHA 235,447 465,933 315,502 315,502 306,115 (9,387) -3.0% MTPO - FTA 15,406 17,191 18,932 18,932 80,573 61,641 325.6% TOTAL MTPO 250,853 483,124 334,434 334,434 386,688 52,254 15.6% MTPO EXPENDITURE SUMMARY Personal Services 189,431 199,963 217,214 217,214 294,728 77,514 35.7% Operating 61,422 283,161 117,220 117,220 91,960 (25,260) -21.5% TOTAL EXPENDITURES 250,853 483,124 334,434 334,434 386,688 52,254 15.6%
Overview
Department Overview Transit
STUDENT TRANSIT
The Student Transportation division operates a total of 52 large and small school buses. These buses operate along 206 routes within the corporate boundaries of Johnson City. School bus service is provided for eight elementary schools, two middle schools, one alternative school and one high school. Service for Special Education students is provided for ages 3 to 21 throughout the system.
Key responsibilities include:
• Provide bus service to schools
• Transport 5,400 passengers per day; 947,242 passengers annually
• Cover 535,132 miles annually
2023 ACCOMPLISHMENTS
Achieved 100% state inspection rate for school buses
Completed emergency evacuation training for all elementary students and teachers
Planned CIP bus replacement on schedule
Trained for railroad crossings, evacuation procedures and hostile threats
2024 GOALS & OBJECTIVES
Maintain a 100% state inspection rate for the entire school bus fleet
Continue emergency evacuation training for students and teachers
Hire, train, retain and recruit new school bus drivers
Continue replacing the aging bus fleet
Comply with all state requirements and regulations
Create and update school bus routes using tools provided by GIS
162
163 Department Overview Dollars (In Thousands) Fiscal Year Student Transportation Expenditures 0 $500 $1,000 $1,500 $2,000 $2,500 $3,000 2020 2021 2022 2023 2024 Personal Services Operating Student Transportation Expenditures by Category 76% 24%
Department Overview
MASS TRANSIT
Johnson City Transit began operations in October 1979. JCT receives federal grant funding through the Federal Transit Administration and state grant funding through the Tennessee Department of Transportation. As a grant recipient, Johnson City Transit falls under and complies with various federal and state requirements, including Title VI of the Civil Rights Act of 1964 and the Americans with Disabilities Act of 1990, as amended.
Work is carried out by the following divisions:
Regular Fixed Route
Key responsibilities include:
• Oversee 15 fixed routes
• Originate and terminate route at the Johnson City Transit Center
• Maintain and operate Johnson City Transit Center
Key responsibilities include:
• Partner with East Tennessee State University
• Shuttle service to campus and adjacent housing during fall and spring semesters
• Oversee three BucShot routes
• Maintain ADA accessibility
Paratransit
Key responsibilities include:
• Provide curb-to-curb paratransit service for mobility-impaired individuals
Job Access
Key responsibilities include:
New Freedom
Key responsibilities include:
• Maintain program funds to support new transportation services, beyond those required by the Americans with Disabilities Act
• Assist individuals with disabilities with transportation, including transportation to and from jobs and employment support services
• Provide the Orange Route fixed-route service to Boones Creek and Med-Tech areas
• Connect welfare recipients, disabled individuals and low-income persons to a job and related employment activities
164
BucShot
2023 ACCOMPLISHMENTS
Consulted with an architectural and engineering firm to remodel the former Greyhound space
Replaced logos on the transit building’s exterior
Applied for and awarded a Tennessee Department of Transportation grant to upgrade facility features at the transit bus lot
Continued working with the Tennessee Department of Transportation on funding opportunities
2024 GOALS & OBJECTIVES
Order three replacement ADA buses
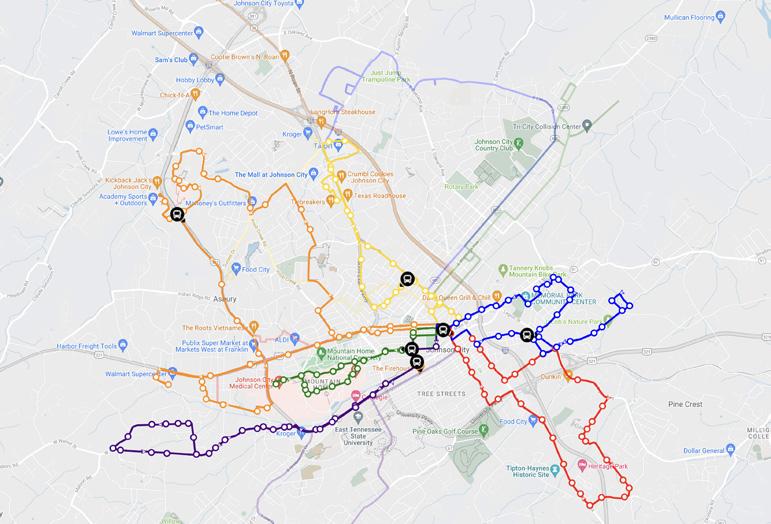
Purchase and install an overhead fall protection system for the garage
Renovate 30-year-old transit center windows and exterior doors with energy-efficient materials
Redesign the Greyhound office space for transit use
Continue working with the city IT department to enable remote viewing, utilizing existing fiber optic cables for transit security lot cameras
Continue working with Johnson City Metropolitan Transportation Planning Organization on the upcoming release of revised urbanized areas updates
Continue working with Tennessee Department of Transportation and local representatives on identifying other types of funding for operations
Prepare for the Federal Transit Authority triennial review
165
Department Overview
Mass Transit Expenditures
Mass Transit Expenditures by Category
68% 20% 12%
Personal Services Operating Other
166 Department Overview Dollars (In Thousands) Fiscal Year
0 $1,000 $2,000 $3,000 $4,000 $5,000 $6,000 2020 2021 2022 2023 2024
Student Transportation
School Bus Transportation
Administrative Specialist II (1)
School Transportation Supervisor (2)
Transit Operator (16.1)
Transit
Transit Director (85.8) Employees
Mass Transit
Special Education
Special Education Supervisor (1)
Transit Operator (12)
Administration Operations
Assitant Transit Director (1)
Transit Senior Planner (1)
Administrative Specialist III (1)
Transit Technology Specialist (1)

Accounts Paybable Specialist (1)
Para Transit Coordinator (1)
Transit Operator (36.7)
Job Access
Transit Operator (4.2)
Freedom Grant
Transit Operator (2)
ETSU Service
Transit Operator (3.8)
167
Department Overview
Department Overview
168 Actual Actual Budget Projected Budget Bdgt. 24 % Transit FY 2021 FY 2022 FY 2023 FY 2023 FY 2024 vs. Proj. 23 Change GENERAL FUND SCHOOL TRANSPORTATION School Transit Operations 1,373,041 1,546,181 1,704,874 1,629,267 1,826,888 197,621 12.1% Special Education Vans 705,636 722,427 885,691 846,412 1,088,227 241,815 28.6% TOTAL GENERAL FUND 2,078,677 2,268,608 2,590,565 2,475,679 2,915,115 439,436 17.8% SCHOOL TRANSPORTATION - GENERAL FUND EXPENDITURE SUMMARY Personal Services 1,707,605 1,767,666 1,880,086 1,779,410 2,204,657 425,247 23.9% Operating 371,072 500,942 710,479 696,269 710,458 14,189 2.0% TOTAL EXPENDITURES 2,078,677 2,268,608 2,590,565 2,475,679 2,915,115 439,436 17.8% MASS TRANSIT FUND Administration 653,734 542,137 717,147 709,975 695,658 (14,317) -2.0% Operations 2,251,187 2,298,247 2,962,081 2,932,460 3,206,468 274,008 9.3% Job Access 192,511 155,796 294,380 291,436 354,608 63,172 21.7% Demand Response 62,034 102,436 115,500 114,345 145,000 30,655 26.8% ETSU 201,870 234,958 396,889 392,920 339,341 (53,579) -13.6% Freedom Grant 194,546 93,937 154,851 153,302 182,462 29,160 19.0% Other 658,728 653,402 652,152 645,630 652,152 6,522 1.0% TOTAL MASS TRANSIT FUND 4,214,610 4,080,913 5,293,000 5,240,068 5,575,689 335,621 6.4% MASS TRANSIT FUND EXPENDITURE SUMMARY Personal Services 2,888,168 2,662,346 3,561,199 3,525,586 3,826,790 301,204 8.5% Operating 667,714 765,165 1,079,649 1,068,852 1,096,747 27,895 2.6% Other 658,728 653,402 652,152 645,630 652,152 6,522 1.0% TOTAL EXPENDITURES 4,214,610 4,080,913 5,293,000 5,240,068 5,575,689 335,621 6.4% TOTAL SCHOOL AND MASS TRANSIT 6,293,287 6,349,521 7,883,565 7,715,747 8,490,804 775,057 10.0%
Water & Sewer Services
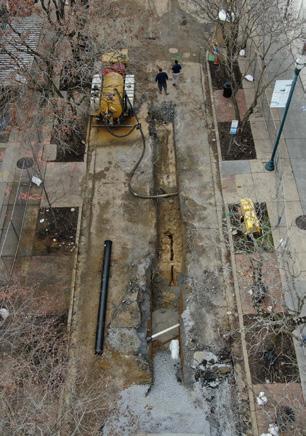
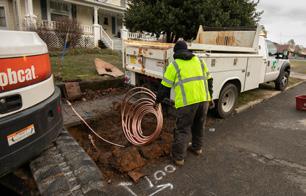
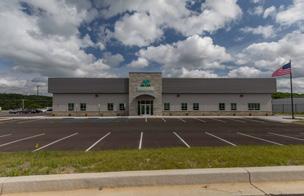
Department Overview
The City of Johnson City Water and Sewer Services Department began its operations in the early 1900s, providing potable water service to the citizens and businesses of the city. Treatment of wastewater began in the mid-1950s. Over the years, the department has expanded to serve residents in parts of four counties that surround the corporate limits of Johnson City, Tennessee. As of December 2021, the department serves 46,704 water accounts, of which 28,675 are inside the city limits and 18,029 are outside the city limits, and 29,886 wastewater customers, of which 25,108 are inside the city limits and 4,778 are outside the city limits. The system serves a total population of approximately 100,000 individuals.
The department has two water treatment plants with the capacity to produce 28 million gallons of potable water per day. The Unicoi Water Treatment Plant, located to the south of the city with Unicoi springs being the source of raw water, can produce an average of 4 million gallons per day. The Watauga Water Treatment Plant, located on the eastern edge of the city with the Watauga River being the source of raw water, can provide 24 million gallons per day. There are 973 miles of water
169
Department Overview
transmission lines dispersed throughout the service area, along with 60 booster stations.
The department also operates three wastewater treatment plants with the total capacity to treat 26 million gallons of wastewater per day. The Brush Creek Wastewater Treatment Plant, located on the eastern edge of the city, can treat 16 million gallons per day. The Knob Creek Wastewater Treatment Plant, located in the northeastern part of the city, has the capacity to treat 4 million gallons per day. The Regional Wastewater Treatment Plant, located near the Tri-Cities Regional Airport, can treat 6 million gallons per day. There are currently 749 miles of wastewater collection lines and 97 lift stations throughout the system.
Key responsibilities include:
• Provide potable water service to the citizens and businesses of Johnson City
• Treat wastewater
• Serve 46,704 water accounts
• Serve 29,886 wastewater accounts
• Maintain two water treatment plants
• Operate three wastewater facilities
2023 ACCOMPLISHMENTS
Achieved full compliance with all federal and state drinking water standards and achieved high level of compliance with each of the three major wastewater state permits.
Assisted the Fire Department in the preparation for the ISO inspection in Spring 2023.
Continued delivery of the Water and Sanitary Sewer System Capital Delivery Plan
Completed construction on the New Water and Sewer Service Center complex at 2250 Eddie Williams Road and successfully moved in Water and Sewer staff.
Completed construction on the Lower Brush Creek Sanitary Sewer Interceptor Contract I project and nearly completed construction on the Lower Brush Creek Interceptor Contract II project serving flow upstream including downtown, the ETSU campus, the Veterans Administration campus, Johnson City Medical Center, and significant residential and commercial areas.
Completed the construction of operational improvements at the Brush Creek Wastewater Treatment Plant including an aeration system replacement, electrical replacement, and building renovation project.
Completed significant master planning activities on Advanced Metering Infrastructure (AMI), Supervisory Control & Data Acquisition (SCADA), and the Knob Creek Wastewater Treatment Plant campus, and will complete the Water System Master plan revision in early FY 2024.
2024 GOALS & OBJECTIVES
Achieve full compliance with all applicable regulatory agencies
Assess infrastructure growth, needs, sustainability and testing
Advance Sanitary Sewer System Capital Improvement and Water System Capital Improvement plans
Prioritize customer service activities through evaluation and improvements to billing and operating systems
Optimize operating costs at treatment and pumping facilities
170
171 Department Overview Water & Sewer Director (187.4) Employees W/WW Treatment Plants Water & Sewer Facility Maintenance Water & Sewer Line Maintenance Engineering City Water Treatment Plant (10) Employees City Water Treatment Plant (10) Employees City Services (8.83) Employees Regional Services (4.59) Employees City Services (49) Employees Customer Service (11) Employees Meter Reading (13) Employees Administration (11) Employees Industrial Monitoring (3.4) Employees Knob Creek Wastewater Treatment Plant (7.5) Employees Unicoi Water Treatment Plant (1) Employee Regional Sewer Treatment Plant (9.5 Employees) Regional Services (33) Employees Water and Sewer
Water & Sewer Expenditures
Water & Sewer Expenditures by Category
36% 33% 31%
Personal Services
Operating Other
172 Dollars (In Thousands) Fiscal Year
0 $5,000 $10,000 $15,000 $20,000 $25,000 $30,000 $35,000 $40,000 2020 2021 2022 2023 2024
Department Overview
173 Department Overview Actual Actual Budget Projected Budget Bdgt. 24 % Water/Sewer FY 2021 FY 2022 FY 2023 FY 2023 FY 2024 vs. Proj. 23 Change ADMINISTRATION MUNICIPAL Administration 1,400,214 2,489,645 2,006,924 1,991,674 2,220,103 228,429 11.5% Engineering 971,437 1,065,393 1,386,617 1,358,885 1,453,194 94,309 6.9% Meter Reading 540,963 509,579 693,416 689,949 873,634 183,685 26.6% Customer Service 451,717 507,643 673,525 670,157 888,605 218,448 32.6% Other* 7,853,995 7,234,962 9,163,008 8,849,317 8,712,233 (137,084) -1.5% TOTAL ADMINISTRATION MUNICIPAL 11,218,326 11,807,222 13,923,490 13,559,982 14,147,769 587,787 4.3% ADMINISTRATION REGIONAL Administration 383,077 43,692 125,073 124,448 71,556 (52,892) -42.5% Meter Reading 205,557 171,167 212,441 211,379 209,867 (1,512) -0.7% Customer Service 122,020 85,073 104,665 104,142 116,933 12,791 12.3% Other* 2,944,851 3,036,124 3,366,565 3,366,565 3,600,682 234,117 7.0% TOTAL ADMINISTRATION REGIONAL 3,655,505 3,336,056 3,808,744 3,806,534 3,999,038 192,504 5.1% * Other includes debt service interest, depreciation, admin fees, PILOT, and other fees/transfers TOTAL ADMINISTRATION 14,873,831 15,143,278 17,732,234 17,366,516 18,146,807 780,291 4.5% ADMINISTRATION EXPENDITURE SUMMARY Personal Services 2,702,271 2,785,868 3,481,078 3,446,267 3,960,888 514,621 14.9% Operating Expenses 1,372,714 2,086,324 1,721,583 1,704,367 1,873,004 168,637 9.9% Other 10,798,846 10,271,086 12,529,573 12,215,882 12,312,915 97,033 0.8% TOTAL EXPENDITURES 14,873,831 15,143,278 17,732,234 17,366,516 18,146,807 780,291 4.5% WATER MUNICIPAL Water Facility Maintenance 872,782 928,607 862,300 857,989 865,175 7,186 0.8% Water Line Maintenance 2,974,896 2,720,846 2,734,650 2,720,975 3,094,590 373,615 13.7% Water Line Extension - - 1,260,493 1,254,191 1,348,709 94,518 7.5% Unicoi Water Treatment 184,294 221,278 217,982 216,892 263,839 46,947 21.6% Water Treatment 2,335,662 2,370,254 2,862,947 2,848,632 3,046,164 197,532 6.9% TOTAL WATER MUNICIPAL 6,367,634 6,240,985 7,938,372 7,898,679 8,618,477 719,798 9.1% WATER REGIONAL Water Facility Maintenance 245,230 232,088 309,259 307,713 298,822 (8,891) -2.9% Water Line Maintenance 1,481,645 1,571,182 1,313,589 1,307,021 1,440,938 133,917 10.2% Water Line Extension - - 524,784 522,160 575,341 53,181 10.2% Water Treatment 39,304 93,012 38,150 37,959 38,150 191 0.5% TOTAL WATER REGIONAL 1,766,179 1,896,282 2,185,782 2,174,853 2,353,251 178,398 8.2% TOTAL WATER 8,133,813 8,137,267 10,124,154 10,073,532 10,971,728 898,196 8.9% WATER EXPENDITURE SUMMARY Personal Services 3,627,796 3,489,617 4,565,678 4,542,849 5,026,551 483,702 10.6% Operating Expenses 4,506,017 4,647,650 5,558,476 5,530,683 5,945,177 414,494 7.5% TOTAL EXPENDITURES 8,133,813 8,137,267 10,124,154 10,073,532 10,971,728 898,196 8.9% SEWER MUNICIPAL Sewer Facility Maintenance 575,589 607,395 589,104 586,158 618,315 32,157 5.5% Sewer Line Maintenance 1,683,637 2,062,411 1,762,607 1,753,793 1,898,912 145,119 8.3% Sewer Line Extension - - 784,479 780,557 776,972 (3,585) -0.5% Brush Creek Wastewater 1,889,962 2,328,588 2,033,322 2,023,154 2,237,287 214,133 10.6% Knob Creek Wastewater 1,342,185 976,976 1,089,049 1,083,604 1,252,629 169,025 15.6% Industrial Monitoring 294,667 260,618 326,638 325,004 348,017 23,013 7.1% TOTAL SEWER MUNICIPAL 5,786,040 6,235,988 6,585,199 6,552,270 7,132,132 579,862 8.8%
Department Overview
174
Actual Actual Budget Projected Budget Bdgt. 24 % Water/Sewer FY 2021 FY 2022 FY 2023 FY 2023 FY 2024 vs. Proj. 23 Change SEWER REGIONAL Sewer Facility Maintenance 719,041 658,138 644,718 641,494 640,003 (1,491) -0.2% Sewer Line Maintenance 261,358 241,007 753,251 749,485 888,141 138,656 18.5% Sewer Line Extension - - 405,036 403,011 423,280 20,269 5.0% Regional Wastewater Treatment 1,060,160 1,100,696 1,296,077 1,289,597 1,384,755 95,158 7.4% TOTAL SEWER REGIONAL 2,040,559 1,999,841 3,099,082 3,083,587 3,336,179 252,592 8.2% TOTAL SEWER 7,826,599 8,235,829 9,684,281 9,635,857 10,468,311 832,454 8.6% SEWER EXPENDITURE SUMMARY Personal Services 3,400,978 3,270,055 5,000,073 4,975,071 5,366,268 391,197 7.9% Operating Expenses 4,425,621 4,965,774 4,684,208 4,660,786 5,102,043 441,257 9.5% TOTAL EXPENDITURES 7,826,599 8,235,829 9,684,281 9,635,857 10,468,311 832,454 8.6% TOTAL WATER/SEWER 30,834,243 31,516,374 37,540,669 37,075,905 39,586,846 2,510,941 6.8%
BUDGET ORDINANCE
Ordinance No. 4848-23
An Ordinance to Establish the Property Tax Rates, Appropriate Funds, and Adopt a Budget for the Fiscal Year
July 1, 2023 through June 30, 2024
WHEREAS, the TennesseeCodeAnnotatedTitle 9 Chapter 1 Section 116 requires that all funds of the State of Tennessee and all its political subdivisions shall first be appropriated before being expended and that only funds that are available shall be appropriated; and
WHEREAS, the Municipal Budget Law of 1982 requires that the governing body of each municipality adopt and operate under an annual budget ordinance presenting a financial plan with at least the information required by state statute, that no municipality may expend any moneys regardless of the source except in accordance with the budget ordinance, and that the governing body shall not make any appropriation in excess of estimated available funds.
NOW THEREFORE BE IT ORDAINED BY THE CITY OF JOHNSON CITY AS FOLLOWS:
SECTION 1. In order to provide revenue for municipal purposes, there is hereby imposed on the value of all property within the City of Johnson City located within Washington County a levy at the rate of $1.98 upon each One Hundred Dollars' ($100.00) worth of assessed value of all taxable property, this levy to be the tax rate for the year 2023.
SECTION 2. Further, for the same said purposes of raising revenue, there is hereby imposed on the value of all property within the City of Johnson City located within Carter County a levy at the rate of $1.80 upon each One Hundred Dollars' ($100.00) worth of assessed value of all taxable property, this levy to be the tax rate for the year 2023.
SECTION 3. Further, for the same said purposes of raising revenue, there is hereby imposed on the value of all property within the City of Johnson City located within Sullivan County a levy at the rate of $1.80 upon each One Hundred Dollars' ($100.00) worth of assessed value of all taxable property, this levy to be the tax rate for the year 2023.
SECTION 4. The following funding amounts for the governmental funds shall be and hereby are adopted as appropriations for the operation of the City of Johnson City, Tennessee, along with revenue projections for the fiscal year 2024:
175
2022 2023 2024 General Fund Actual Estimated Proposed Revenue: Local Taxes 83,642,884 86,519,500 92,974,740 Licenses and Permits 1,102,607 1,207,000 1,238,000 Intergovernmental 13,804,790 12,857,680 13,555,680 Charges for Services 3,927,114 4,231,769 4,502,923 Fines and Forfeitures 793,102 900,000 1,000,000 Other 2,220,643 1,085,720 1,180,050 Total Receipts 105,491,140 106,801,669 114,451,393 Expenditures: Development Services 1,649,703 1,920,839 2,053,225 Facilities Management 1,331,145 1,541,175 1,871,440 Finance 1,603,667 1,811,023 1,957,209 Fire Department 12,157,149 13,887,875 14,091,915 General Government 3,475,751 3,996,272 5,144,559 Information Technology 2,473,590 3,059,429 3,372,110 Judicial 1,113,199 1,127,689 1,162,074 Library 2,070,225 2,186,977 2,240,975 Miscellaneous 1,601,150 3,625,103 1,079,277 Parks & Recreation (Incl. Golf & Seniors) 7,427,366 8,497,915 9,728,183 Police Department 14,725,654 15,926,993 16,734,659 Public Works 12,220,649 14,345,804 17,081,699 Quasi-Governmental Agencies 3,904,235 4,541,535 5,195,778 Student Transportation 2,268,608 2,475,679 2,915,115 Total Operating Expenditures 68,022,091 78,944,308 84,628,218 Transfers Out to Other Funds 29,976,660 29,127,799 29,823,175 Total Appropriation 97,998,751 108,072,107 114,451,393 Surplus (Deficit) 7,492,389 (1,270,438) 0 Beginning Fund Balance 45,438,220 52,953,945 51,683,507 Year-End Adjustment 23,336 Ending Fund Balance 52,953,945 51,683,507 51,683,507
176 2022 2023 2024 General Purpose School Fund Actual Estimated Proposed Revenue: Local Taxes/Licenses 33,729,504 35,439,875 35,324,737 Charges for Service 1,950,606 1,902,671 1,699,800 Other Local Revenue 684,088 120,290 26,000 State/Federal Education Funds 35,491,962 36,194,007 44,851,779 City Appropriation 11,626,736 11,626,736 11,626,736 Transfers In from General Fund (Transportation) 2,266,075 2,429,715 2,909,423 Total Receipts 85,748,971 87,713,294 96,438,475 Expenditures: Total Appropriation 78,643,033 87,241,551 97,729,610 Surplus (Deficit) 7,105,938 471,743 (1,291,135) Beginning Fund Balance 10,209,032 17,314,970 17,786,713 Ending Fund Balance 17,314,970 17,786,713 16,495,578 2022 2023 2024 School Food Services Fund Actual Estimated Proposed Revenues: Charges for Services 185,659 1,088,600 688,600 State Matching Food Service Funds 37,453 38,232 35,000 Federal Funds Through State 4,991,900 2,872,766 3,100,000 Other 28,806 43,000 45,000 Total Receipts 5,243,818 4,042,598 3,868,600 Expenditures: Total Appropriation 3,569,839 3,832,525 3,868,600 Surplus (Deficit) 1,673,979 210,073 0 Beginning Fund Balance 2,198,090 3,726,292 3,936,365 Purchase Method Inventory Adj. (145,777) Ending Fund Balance 3,726,292 3,936,365 3,936,365 2022 2023 2024 School Federal Projects Fund Actual Estimated Proposed Revenues: Federal Funds Direct and Through State 13,507,627 12,593,524 10,389,796 Transfers In 46,238 26,000 26,000 Total Receipts 13,553,865 12,619,524 10,415,796 Expenditures: Total Appropriation 13,553,861 12,338,702 10,415,796 Transfers Out (408,378) 0 0 Surplus (Deficit) (408,374) 280,822 0 Beginning Fund Balance 1,202,902 794,528 1,075,350 Ending Fund Balance 794,528 1,075,350 1,075,350 2022 2023 2024 School Special Projects Fund Actual Estimated Proposed Revenues: Federal Funds Direct and Through State 1,647,557 1,449,973 3,126,073 Transfers In 41,120 51,979 19,539 Total Receipts 1,688,677 1,501,952 3,145,612 Expenditures: Total Appropriation 1,679,997 1,501,952 3,145,612 Surplus (Deficit) 8,680 0 0 Beginning Fund Balance 0 8,680 8,680 Ending Fund Balance 8,680 8,680 8,680
177 2022 2023 2024 Capital Equipment Fund Actual Estimated Proposed Revenues: Grants/Other 747,007 0 0 Total Receipts 747,007 0 0 Expenditures: (FY2024Budgetequipmentlistandfundingsource-AppendixA) Vehicles & Equipment 4,822,000 4,258,090 4,154,267 Total Appropriation 4,822,000 4,258,090 4,154,267 Transfers In: Transfers In - General Fund 3,776,751 2,611,080 3,564,267 Total Transfers In 3,776,751 2,611,080 3,564,267 Surplus (Deficit) (298,242) (1,647,010) (590,000) Beginning Fund Balance 3,081,121 2,782,879 1,135,869 Ending Fund Balance 2,782,879 1,135,869 545,869 Capital Projects Fund 2022 2023 2024 (Facilities and Infrastructure) Actual Estimated Proposed Revenues: Federal 0 11,115,440 1,800,000 State of Tennessee 792,502 4,631,919 1,000,000 Interest 48,683 0 0 Other 119,447 25,000 0 Total Receipts 960,632 15,772,359 2,800,000 Transfers In: General Fund 3,981,815 2,812,000 1,855,000 Bond Proceeds 43,762,021 0 0 Total Transfers In 47,743,836 2,812,000 1,855,000 Expenditures: (FY2024Budgetlistedbyprojectandfundingsource-AppendixA) Facilities Projects 2,905,837 25,003,310 10,505,440 Infrastructure Projects 5,510,950 5,904,372 22,115,000 Total Appropriation 8,416,787 30,907,682 32,620,440 Surplus (Deficit) 40,287,681 (12,323,323) (27,965,440) Beginning Fund Balance 4,803,850 44,934,278 32,610,955 Adjustments (157,253) 0 0 Ending Fund Balance 44,934,278 32,610,955 4,645,515
178 2022 2023 2024 Capital Projects - Schools Fund Actual Estimated Proposed Revenues: Other 0 0 0 Total Receipts 0 0 0 Transfers In: General Fund 455,109 0 0 Bond Proceeds 2,116,049 0 40,000,000 Other 3,853,787 1,346,720 0 Total Transfers In 6,424,945 1,346,720 40,000,000 Expenditures: School Projects 10,881,251 7,106,339 2,000,000 Total Appropriation 10,881,251 7,106,339 2,000,000 Surplus (Deficit) (4,456,306) (5,759,619) 38,000,000 Beginning Fund Balance 10,612,318 6,156,012 396,393 Ending Fund Balance 6,156,012 396,393 38,396,393 2022 2023 2024 Debt Service Fund Actual Estimated Proposed Revenues: Interest 62,617 0 0 Other 135,719 0 0 Total Receipts 198,336 0 0 Transfers In: General Fund 8,939,207 10,595,280 11,117,872 General Purpose School Fund 995,768 1,029,330 1,040,210 Economic Development Reserve 153,245 106,703 102,352 Total Transfers In 10,088,220 11,731,313 12,260,434 Expenditures: (FY2024PrincipalandInterestDetailonAppendixB) City Projects - Principal and Interest 8,145,541 10,019,188 9,637,429 School Projects - Principal and Interest 1,686,723 1,712,125 2,623,005 Total Appropriation 9,832,264 11,731,313 12,260,434 Surplus (Deficit) 454,292 0 0 Beginning Fund Balance 0 454,292 454,292 Ending Fund Balance 454,292 454,292 454,292 2022 2023 2024 Educational Facilities Trust Fund Actual Estimated Proposed Revenues: Local Option Sales Tax 3,065,712 3,183,180 3,342,000 Interest 12,591 4,000 4,000 Total Receipts 3,078,303 3,187,180 3,346,000 Expenditures: Debt Service 3,887,043 4,616,297 4,702,950 Bank Service Charges 58,939 3,000 9,000 Total Appropriation 3,945,982 4,619,297 4,711,950 Operating Transfer In 1,973,735 1,900,000 1,900,000 Surplus (Deficit) 1,106,056 467,883 534,050 Beginning Fund Balance 6,136,193 7,242,249 7,710,132 Ending Fund Balance 7,242,249 7,710,132 8,244,182
179 2022 2023 2024 Community Development Fund Actual Estimated Proposed Revenues: Community Development Block Grant 770,625 760,000 585,880 Emergency Shelter Grant 281,318 161,250 134,375 Other 9,328 0 0 Total Receipts 1,061,271 921,250 720,255 Expenditures: Housing Rehabilitation 375,198 680,000 483,000 Other Programs 604,649 161,250 134,375 Administration 122,151 80,000 102,880 Total Appropriation 1,101,998 921,250 720,255 Transfers In (Out) (141,335) 0 0 Surplus (Deficit) (182,062) 0 0 Beginning Fund Balance 575,780 393,718 393,718 Ending Fund Balance 393,718 393,718 393,718 2022 2023 2024 Drug Fund Actual Estimated Proposed Revenues: Fines & Forfeitures 393,029 100,000 100,000 Other 24,778 15,000 15,000 Total Receipts 417,807 115,000 115,000 Expenditures: Operating 89,152 100,000 100,000 Capital Outlay 247,266 124,400 129,000 Total Appropriation 336,418 224,400 229,000 Transfer Out (11,627) Surplus (Deficit) 81,389 (109,400) (114,000) Beginning Fund Balance 1,031,337 1,101,099 991,699 Ending Fund Balance 1,101,099 991,699 877,699 2022 2023 2024 Freedom Hall Fund Actual Estimated Proposed Revenues: Ticket Sales 1,315,317 975,000 863,000 Building Rental & Surcharge 206,846 138,000 165,000 Concessions & Novelty Sales 131,610 110,000 115,000 Other 1,333,537 260,000 315,500 Total Receipts 2,987,310 1,483,000 1,458,500 Expenditures: Administration 311,437 385,188 400,413 Shows 1,590,767 975,000 928,138 Maintenance 459,307 484,140 497,935 Concessions & Parking 51,844 52,812 49,072 Capital Outlay - Equipment 9,000 0 0 Total Appropriation 2,422,355 1,897,140 1,875,558 Transfers In - General Fund 320,810 360,000 417,100 Surplus (Deficit) 885,765 (54,140) 42 Beginning Fund Balance 20,152 905,917 851,777 Ending Fund Balance 905,917 851,777 851,819
180 2022 2023 2024 Police Grant Fund Actual Estimated Proposed Revenues: Federal Grants 133,212 157,406 159,500 Total Receipts 133,212 157,406 159,500 Expenditures: Public Safety 122,723 169,062 159,500 Total Appropriation 122,723 169,062 159,500 Surplus (Deficit) 10,489 (11,656) 0 Beginning Fund Balance 1,167 11,656 0 Ending Fund Balance 11,656 0 0 2022 2023 2024 Police Technology Fund Actual Estimated Proposed Revenues: Fines and Forfeitures 253,235 260,000 260,000 Total Receipts 253,235 260,000 260,000 Expenditures: Operating Technology 157,766 212,104 188,074 Total Appropriation 157,766 212,104 188,074 Surplus (Deficit) 95,469 47,896 71,926 Beginning Fund Balance 97,717 193,186 241,082 Ending Fund Balance 193,186 241,082 313,008 2022 2023 2024 Transportation Planning Fund Actual Estimated Proposed Revenues: Federal Government 385,123 279,546 326,222 Total Receipts 385,123 279,546 326,222 Expenditures: Highway and Transportation Planning 483,124 334,434 386,688 Total Appropriation 483,124 334,434 386,688 Surplus (Deficit) (98,001) (54,888) (60,466) Transfers In - General Fund 115,794 55,000 60,500 Beginning Fund Balance 98,550 116,343 116,455 Ending Fund Balance 116,343 116,455 116,489
SECTION 5. The following funding amounts for the proprietary funds shall be and hereby are adopted as appropriations for the operation of the City of Johnson City, Tennessee, along with revenue projections for the fiscal year 2024:
- see Appendix A)
181 2022 2023 2024 Mass Transit Fund Actual Estimated Proposed Revenues: Federal - Transit Administration 2,753,600 2,100,000 2,213,289 State - Operating 256,056 746,300 780,000 Other Federal Grants 6,164 240,000 181,500 Passenger Fares 164,921 200,000 231,100 Other 250,053 290,800 262,300 Total Receipts 3,430,794 3,577,100 3,668,189 Expenses: Administration 542,137 709,975 695,658 Operations 2,298,247 2,932,460 3,206,468 Job Access 155,796 291,436 354,608 Freedom Grant 93,937 153,302 182,462 ETSU Service 234,958 392,920 339,341 Demand Response 102,436 114,345 145,000 Other 653,402 645,630 652,152 Total Appropriation 4,080,913 5,240,068 5,575,689 Transfers In: General Fund 748,528 961,000 1,079,348 FTA Capital Grant 276,544 366,750 335,000 State Capital Grant 9,287 50,000 45,000 Total Transfers In 1,034,359 1,377,750 1,459,348 Net Operating Income (Loss) 384,240 (285,218) (448,152) Net Position (Beginning) 7,000,425 7,384,665 7,099,447 Net Position (Ending) 7,384,665 7,099,447 6,651,295 Receipts (per audit for FY 2022) 2,681,307 3,577,100 3,668,189 Capital Equipment/Projects 9,663 206,000 204,000 (FY 2024 Budget
Total Operating Expense (less Depreciation) 3,779,002 4,594,438 4,923,537 Total Operating and Other Expenses 3,788,665 4,800,438 5,127,537 Other Non-Operating Revenue 1,102,594 1,377,750 1,459,348 Net Increase (Decrease) in Cash & Cash Equivalents (4,764) 154,412 0 Beginning Cash Balance 7,198 2,434 156,846 Ending Cash Balance 2,434 156,846 156,846
182 2022 2023 2024 Solid Waste Municipal Fund Actual Estimated Proposed Revenues: Residential 3,033,124 3,550,000 3,578,000 Commercial 3,259,101 3,596,140 3,668,100 Industrial 3,017,089 3,312,200 3,534,200 Recycling 891,419 505,000 495,000 Landfill Host Fee 310,836 315,000 315,000 Container Rental 1,108,929 1,319,100 1,354,500 Other 362,536 469,500 647,060 Total Receipts 11,983,034 13,066,940 13,591,860 Expenses: Administration 616,491 788,801 870,207 Residential 1,826,095 2,038,206 2,291,619 Commercial 2,020,589 2,187,759 2,404,405 Industrial 2,489,950 2,641,429 3,328,317 Recycling 1,104,451 1,221,626 1,370,303 Brush, Bulk, and Leaf Collection 1,236,073 1,640,481 1,829,733 Landfills 68,541 220,643 247,391 Other 1,564,955 1,629,212 1,728,542 Total Appropriation 10,927,145 12,368,157 14,070,517 Transfers In: Regional Solid Waste Fund 167,557 179,572 199,192 Transfers Out: Water/Sewer Fund (138,939) (139,607) (147,807) Net Operating Income (Loss) 1,084,507 738,748 (427,272) Net Position (Beginning) 12,578,084 13,662,591 14,401,339 Net Position (Ending) 13,662,591 14,401,339 13,974,067 Receipts (per audit for FY 2022) 11,952,236 13,066,940 13,591,860 Capital Equipment/Projects 1,035,120 171,000 897,900 (FY 2024 Budget - see Appendix A) Debt Service Principal 81,597 91,686 95,000 Total Operating Expense (less Depreciation) 10,190,644 11,251,099 12,953,459 Total Operating and Other Expenses 11,307,361 11,513,785 13,946,359 Transfers In 167,557 179,572 199,192 Transfers Out (138,939) (139,607) (147,807) Total Other Non-Operating Revenue (Expenses) 28,618 39,965 51,385 Net Increase (Decrease) in Cash & Cash Equivalents 673,493 1,593,120 (303,114) Beginning Cash Balance 3,383,316 4,056,809 5,649,929 Ending Cash Balance 4,056,809 5,649,929 5,346,815
183 2022 2023 2024 Solid Waste Regional Fund Actual Estimated Proposed Revenues: Residential 3,075,819 3,200,000 3,351,200 Commercial 476,234 513,400 529,000 Other 186,562 215,000 215,000 Total Receipts 3,738,615 3,928,400 4,095,200 Expenses: Operations 2,578,292 2,736,761 3,247,829 Landfill 6,911 6,700 6,700 Other 502,857 477,439 529,159 Total Appropriation 3,088,060 3,220,900 3,783,688 Transfers Out: Municipal Solid Waste (167,557) (179,572) (199,192) Water/Sewer Fund (70,223) (73,063) (77,355) Total Transfers Out (237,780) (252,635) (276,547) Net Operating Income (Loss) 412,775 454,865 34,965 Net Position (Beginning) 5,059,720 5,472,495 5,927,360 Net Position (Ending) 5,472,495 5,927,360 5,962,325 Receipts (per audit for FY 2022) 3,739,772 3,928,400 4,095,200 Capital Equipment (FY 2024 Budget - see Appendix A) 0 392,000 220,100 Total Operating Expense (less Depreciation) 2,821,157 2,868,610 3,431,398 Total Operating and Other Expenses 2,821,157 3,260,610 3,651,498 Other Non-Operating Revenue (Expenses -Transfers Out) (237,780) (252,635) (276,547) Net Increase (Decrease) in Cash & Cash Equivalents 680,835 415,155 167,155 Beginning Cash Balance 2,755,700 3,436,535 3,851,690 Ending Cash Balance 3,436,535 3,851,690 4,018,845 2022 2023 2024 Storm Water Fund Actual Estimated Proposed Revenues: Storm Water Fees - Single Family 894,783 905,000 905,000 Storm Water Fees - Multi-Family 458,059 460,000 460,000 Storm Water Fees - Other 1,838,790 1,900,000 1,900,000 Other 38,702 24,000 24,000 Total Receipts 3,230,334 3,289,000 3,289,000 Expenses: Operations 841,371 1,407,915 1,416,524 Other 782,602 1,014,064 1,018,617 Total Appropriation 1,623,973 2,421,979 2,435,141 Net Operating Income (Loss) 1,606,361 867,021 853,859 Net Position (Beginning) 13,178,411 14,784,772 15,651,793 Net Position (Ending) 14,784,772 15,651,793 16,505,652 Receipts (per audit for FY 2022) 3,375,978 3,289,000 3,289,000 Capital Equipment/Projects 3,726,252 3,250,000 1,900,000 (FY 2024 Budget - see Appendix A) Debt Service Principal 338,000 456,000 449,000 Total Operating Expense (less Depreciation) 1,158,085 1,981,979 1,995,141 Total Operating and Other Expenses 5,222,337 5,687,979 4,344,141 Bond Proceeds 3,017,574 3,000,000 0 Purchase of Investments (3,000,000) 0 0 Capital Grant Received 35,915 0 0 Total Other Non-Operating Revenue (Expenses) 53,489 3,000,000 0 Net Increase (Decrease) in Cash & Cash Equivalents (1,792,870) 601,021 (1,055,141) Beginning Cash Balance 3,646,967 1,854,097 2,455,118 Ending Cash Balance 1,854,097 2,455,118 1,399,977
184 2022 2023 2024 Water/Sewer Fund Actual Estimated Proposed Revenues: Water Sales 19,017,427 18,800,000 19,158,000 Sewer Fees 19,570,885 19,957,000 20,338,000 Tap Fees 1,645,816 1,250,000 1,076,000 Customer Service Charges 233,965 315,000 315,000 Penalties 589,534 470,000 470,000 Other 2,060,908 582,900 547,300 Total Receipts 43,118,535 41,374,900 41,904,300 Expenses: Administration 4,872,192 5,150,634 5,833,892 Water Operating Expenses 5,452,723 5,193,699 5,699,525 Sewer Operating Expenses 3,568,951 3,730,931 4,045,371 Water Line Extensions 0 1,776,350 1,924,050 Sewer Line Extensions 0 1,183,567 1,200,252 Water Treatment 2,684,544 3,103,483 3,348,153 Wastewater Treatment 4,406,260 4,396,355 4,874,671 Industrial Monitoring 260,618 325,004 348,017 Payment-In-Lieu 750,000 800,000 800,000 Depreciation 6,632,850 6,680,000 6,719,426 Other 2,888,236 4,735,882 4,793,489 Total Appropriation 31,516,374 37,075,905 39,586,846 Transfers In: Municipal Solid Waste Fund 138,939 139,607 147,807 Regional Solid Waste Fund 70,223 73,063 77,355 Total Transfers In 209,162 212,670 225,162 Net Operating Income (Loss) 11,811,323 4,511,665 2,542,616 Net Position (Beginning) 149,451,587 161,262,910 165,774,575 Net Position (Ending) 161,262,910 165,774,575 168,317,191 Receipts (per audit for FY 2022) 42,016,581 41,374,900 41,904,300 Capital Equipment/Projects 36,605,874 30,276,000 26,873,000 (FY 2024 Budget - see Appendix A) Debt Service Principal 3,926,761 4,632,259 4,788,740 Total Operating Expense (less Depreciation) 25,689,209 29,595,905 32,067,420 Total Operating and Other Expenses 66,221,844 64,504,164 63,729,160 Transfer Out - Payment-In-Lieu (750,000) (800,000) (800,000) Transfer In - Other Funds 209,162 212,670 225,162 Bond Funding 35,425,106 13,500,000 19,200,000 Other 2,369,274 10,300,000 3,200,000 Interest on Investments 0 0 0 Proceeds from Sale of Investments 0 0 0 Payment to Refunded Bonds 0 0 0 Purchase of Investments (22,004,545) 0 0 Total Other Non-Operating Revenue 15,789,835 23,800,000 22,400,000 Net Increase (Decrease) in Cash & Cash Equivalents (8,956,266) 83,406 302 Beginning Cash Balance 30,132,804 21,176,538 21,259,944 Ending Cash Balance 21,176,538 21,259,944 21,260,246
SECTION 6. Property tax revenues collected exclusively from properties located in Med Tech Park are designated as an economic development reserve in the General Fund for fiscal year 2024.
SECTION 7. No appropriation listed above shall be exceeded without an amendment of the budget ordinance approved by the City Commission.
SECTION 8. If for any reason a budget ordinance is not adopted prior to the beginning of the next fiscal year, the appropriations in this budget ordinance shall become the appropriations for the next fiscal year until the adoption of a new budget ordinance in accordance with Section 6-56-210, TennesseeCodeAnnotated,provided sufficient revenues are being collected to support the continuing appropriations.
SECTION 9. All unencumbered balances of appropriations remaining at the end of the fiscal year shall lapse and revert to the respective fund balances.
SECTION 10. BE IT FURTHER ORDAINED that a public hearing on this ordinance shall be held by the City Commission on first reading, prior to adoption.
SECTION 11. BE IT FURTHER ORDAINED that inasmuch as the fiscal year of the City begins July 1, 2023, this ordinance shall take effect from and after its passage on third and final reading on July 1, 2023, the public welfare requiring it.
Approved and signed in open meeting on the ___ day of June 2023, following passage on Third Reading.

 Todd Fowler, Mayor
Attest:
Stephanie Laos, City Recorder
Approved as to Form:
Sunny Sandos, City Attorney
June 1, 2023
June 1, 2023
June 8, 2023
June 15, 2023
Public Hearing: Passed on First Reading: ______________ Passed on Second Reading: Passed on Third Reading:

185
APPENDIX A
CAPITAL EQUIPMENT AND PROJECTS (BY DEPARTMENT - INCLUDING FUNDING SOURCE)
186
GENERAL FUND
CAPITAL EQUIPMENT - FY 2024
187 Cost
Communications and Marketing Trailer 9,400 TOTAL COMMUNICATIONS AND MARKETING 9,400 Development Services Small SUV (2) 60,000 TOTAL DEVELOPMENT SERVICES 60,000 Fire Class A Pumper Engine 7 640,000 Scott Air Packs (10) 90,000 Gear Washer 30,000 Thermal Imaging Cameras (3) 30,000 2 Administrative Vehicles 94,000 TOTAL FIRE 884,000 Information Technology HPE DL380 Gen11 x 2 50,000 HPE StoreOnce 48TB Maintenance 24,000 Simplivity Server node 157,500 VoIP Upgrade and Replacement 172,000 TOTAL INFORMATION TECHNOLOGY 403,500 Parks and Recreation 5-Unit Tow Behind Gang Mower (Golf) 25,000 1-Ton Pickup 4dr 4wd 62,000 3/4-Ton Pick-up 4wd 48,000 72" 35hp Zero Turn Mowers (3) 45,000 Litterkat 9,000 Small SUV 30,000 Stand On Spreader Sprayer 12,000 Toro 2030 Infield Groomer (2) 30,000 Utility Vehicles (2) (Golf) 22,000 TOTAL PARKS AND RECREATION 283,000 Police EOD X-Ray System 25,000 Police Patrol Vehicles (17) 965,447 TOTAL POLICE 990,447 Public Works 1-Ton Extended Cab Utility Truck 4wd - Construction/Concrete 75,000 1-Ton Utility Truck 2wd - Traffic 62,000 Large SUV - Engineering/Surveying 60,000 Single Axle Dump Truck - Asphalt 213,700 Skid Steer - Asphalt 102,500 Small SUV - Traffic 30,000
CAPITAL EQUIPMENT - FY 2024
Other Equipment Funded through the General Fund
188 Cost
Tandem Dump Truck - Construction 266,720 TOTAL PUBLIC WORKS 809,920 Risk Management Small SUV 34,000 TOTAL RISK MANAGEMENT 34,000 Student Transportation Small School Buses (2) (re-budget) 120,000 Large School Buses (5) (re-budget) 470,000 Large School Buses (5) (additional funding) 30,000 TOTAL STUDENT TRANSPORTATION 620,000
Freedom Hall Truck with Liftgate 60,000 TOTAL FREEDOM HALL 60,000 TOTAL GENERAL FUND 4,154,267 MASS TRANSIT FUND ADA Minivans (2) 79,000 DVR Camera System 125,000 TOTAL MASS TRANSIT FUND 204,000 POLICE DRUG FUND Unmarked sedan (3) 111,000 PenLink System 18,000 TOTAL POLICE DRUG FUND 129,000 SOLID WASTE FUNDS Municipal Front Loader (2) 854,900 Pickup Truck 43,000 TOTAL MUNICIPAL SOLID WASTE FUND 897,900 Regional Rear Loader 220,100 TOTAL REGIONAL SOLID WASTE FUND 220,100 TOTAL SOLID WASTE FUNDS 1,118,000 STORM WATER FUND Tandem Axel Dump Truck 250,000 TOTAL STORM WATER FUND 250,000 WATER/SEWER FUND Sewer Vactor Truck 550,000 Ext. Cab 5400 LB 4WD Pick-up (1/2 ton) (4) 180,000
CAPITAL EQUIPMENT - FY 2024
FUNDING SUMMARY
189 Cost
Ext. Cab 4WD Pick-up (1/4 ton) (2) 72,000 Listening Gear (Leak Detection) 30,000 Large Fork Lift 65,000 Sewer E65 Mini-Ex 95,000 Sewer Flow Monitors (5) 35,000 SUV 40,000 TOTAL WATER/SEWER FUND 1,067,000 TOTAL CAPITAL EQUIPMENT 6,922,267 FEDERAL/STATE GRANTS (MASS TRANSIT) 204,000 GENERAL FUND General Fund 3,564,267 Capital Fund Balance 590,000 TOTAL GENERAL FUND 4,154,267 POLICE DRUG FUND 129,000 SOLID WASTE FUNDS 1,118,000 STORM WATER FUND 250,000 WATER/SEWER FUND 1,067,000 TOTAL CAPITAL EQUIPMENT 6,922,267
CAPITAL PROJECTS - FY 2024
190 Funding Source Cost GENERAL FUND Facilities Management Municipal Building 3rd Floor Renovations Design General Fund 100,000 TOTAL FACILITIES MANAGEMENT 100,000 Fire Fire Station Improvements (re-budget) Federal - ARPA 500,000 Fire Station Relocation (re-budget) Federal - ARPA 5,000,000 Fire Training Center (re-budget) Federal - ARPA 3,000,000 Post Steel Building Station 8 & 9 General Fund 75,000 TOTAL FIRE 8,575,000 Juvenile Court Security Glass General Fund 20,000 TOTAL JUVENILE COURT 20,000 Library Interior Floors 40,000 TOTAL LIBRARY General Fund 40,000 Freedom Hall Emergency Lighting General Fund 60,000 TOTAL FREEDOM HALL 60,000 Parks and Recreation TVA Credit Union Park (re-budget) Federal - ARPA 415,440 Carver Recreation Center Bleachers General Fund 50,000 Metro-Kiwanis Tennis Courts General Fund 545,000 TOTAL PARKS AND RECREATION 1,010,440 Police Police Training Complex Upgrades (re-budget) Federal - ARPA 700,000 TOTAL POLICE 700,000 Public Works Cherokee Street Extension (re-budget) Federal - ARPA 600,000 Christian Church Road (Design) General Fund 100,000 Downtown Cameras General Fund 265,000 Downtown Crosswalk Lighting Federal/State 1,000,000 General Fund 200,000 1,200,000 Gray Station/Bobby Hicks Intersection Federal/State 1,200,000 General Fund 200,000 1,400,000
191 Funding Source Cost Knob Creek Overpass Design General Fund 200,000 Oakland/Mountainview Improvements Bond Proceeds 2,500,000 Traffic Signals Federal/State 600,000 Roan/Market Streets Roan/Main Streets West Walnut Street Bond Proceeds 15,000,000 Boone/Main Parking Lot (carry-over) Capital Fund Balance 100,000 Winged Deer Park Access Road (carry-over) Capital Fund Balance 150,000 TOTAL PUBLIC WORKS 22,115,000 TOTAL GENERAL FUND PROJECTS 32,620,440 FLEET MANAGEMENT FUND Tank Replacement Fleet Management 216,000 UPS System Fleet Management 150,000 TOTAL FLEET MANAGEMENT PROJECTS 366,000 STORM WATER FUND Buffalo Valley Streambank Mitigation Storm Water Fund 400,000 West Oakland Avenue Bridge Storm Water Fund 750,000 West Walnut Street Holding Pond Mitigation Storm Water Fund 500,000 TOTAL STORM WATER PROJECTS 1,650,000 WATER/SEWER FUND Water System Improvements Advance Meter Infrastructure W/S Bond Issue 6,000,000 Small Diameter Line Replacement W/S Fund 1,200,000 Washington Co. Water Line Extension Federal - ARPA Grant 2,200,000 TOTAL WATER SYSTEM 9,400,000 Sewer System Improvements Boones Creek Interceptor Replacement I-26 to B Station W/S Bond Proceeds 2,050,000 C Station Wastewater Lift Station Replacement W/S Bond Proceeds 1,250,000 Lift Station Phase Out W/S Fund 500,000 Knob Creek Aeration Rehabilitation W/S Bond Issue 2,800,000 Regional Sewer Capacity Improvements - Phase III W/S Bond Proceeds 4,000,000 Root Removal Sewer Rehabilitation W/S Fund 75,000 Sewer Lift Station W/S Fund 50,000 Sinking Creek Lift Station Upgrade Federal - EDA Grant 1,000,000 Wastewater Collection Line Rehab/Replacement W/S Fund 500,000 TOTAL SEWER SYSTEM 12,225,000
192 Funding Source Cost Combined Projects Emergency & Security W/S Fund 75,000 Knob Creek Road & CSX Utility Improvements W/S Bond Issue 1,500,000 Local Road Projects/Annexations W/S Fund 500,000 Misc. TFM & LMC Projects W/S Fund 256,000 Plant/Facility Improvements W/S Fund 250,000 Walnut Street Corridor Utility Improvements W/S Bond Proceeds 1,600,000 TOTAL COMBINED WATER/SEWER 4,181,000 TOTAL WATER/SEWER FUND 25,806,000 TOTAL CAPITAL PROJECTS 60,442,440 FEDERAL/STATE GRANTS 16,215,440 CAPITAL FUND BALANCE 250,000 STORM WATER FUND 1,650,000 WATER /SEWER BOND ISSUE 10,300,000 WATER/SEWER BOND PROCEEDS 8,900,000 WATER/SEWER FUND 3,406,000 TOTAL CAPITAL PROJECTS 60,442,440 FUNDING SUMMARY Funding Source Cost FEDERAL/STATE GRANTS 16,215,440 FLEET MANAGEMENT FUND 366,000 GENERAL FUND 1,855,000 CAPITAL FUND BALANCE 250,000 GENERAL OBLIGATION BOND PROCEEDS 17,500,000 STORM WATER FUND 1,650,000 WATER /SEWER BOND ISSUE 10,300,000 WATER/SEWER BOND PROCEEDS 8,900,000 WATER/SEWER FUND 3,406,000 TOTAL CAPITAL PROJECTS 60,442,440 FUNDING SUMMARY
CAPITAL SCHOOLS - FY 2024
FUNDING SOURCE
193 Funding Source Cost Towne Acres Elementary School (Design, Engineering) G.O. Bond 2,000,000 TOTAL CAPITAL SCHOOLS PROJECTS 2,000,000 GENERAL OBLIGATION BOND ISSUE 2,000,000 TOTAL CAPITAL SCHOOLS PROJECTS 2,000,000
APPENDIX B
DEBT SERVICE SCHEDULE PRINCIPAL AND INTEREST (BY ISSUE AND FUND TYPE)
194
195 DEBT SERVICE SCHEDULE BY FUND AS OF JUNE 30, 2024 FY 2037 Description FY 2024 FY 2025 FY 2026 FY 2027 FY 2028 FY 2029 FY 2030 FY 2031 FY 2032 FY 2033 FY 2034 FY 2035 FY 2036 and Beyond Total Governmental Funds General FundPrincipal 2008 TMBF Variable Rate Loan 978,037 767,283 805,461 845,502 887,404 932,100 5,215,787 2009 Qualified School ConstructionSchools 509,171 509,172 559,293 48,002 1,625,638 2014 TMBF LoanFieldhouseSchools 50,000 50,000 50,000 50,000 50,000 50,000 50,000 50,000 50,000 50,000 50,000 50,000 600,000 2014 TMBF LoanFieldhouseCity 12,000 14,000 15,000 17,000 19,000 20,000 22,000 24,000 26,000 28,000 30,000 32,000 259,000 2014 TMBF LoanFarmer's MarketCity 23,800 24,500 25,025 25,725 26,425 27,125 1,819 154,419 2014 TMBF LoanFarmer's MarketTIF 112,200 115,500 117,975 121,275 124,575 127,875 131,175 850,575 2016 GO 490,000 515,000 540,000 565,000 590,000 615,000 640,000 665,000 690,000 720,000 745,000 775,000 805,000 8,355,000 2016A Refunding 241,627 249,485 284,191 214,780 224,602 231,150 239,663 255,378 1,940,876 2016A GO School Maint. Bldg. 150,000 160,000 165,000 175,000 180,000 190,000 195,000 205,000 210,000 220,000 230,000 240,000 250,000 2,570,000 2016A GO ETSU FPAC 300,000 315,000 335,000 350,000 365,000 380,000 395,000 410,000 425,000 440,000 460,000 480,000 495,000 5,150,000 2017 Hands On (FY 2018) 50,000 50,000 50,000 50,000 200,000 2019 GO 230,000 245,000 250,000 190,000 200,000 210,000 220,000 230,000 240,000 250,000 260,000 270,000 280,000 915,000 3,990,000 2019B Refunding 610,827 641,625 674,990 708,354 744,285 780,216 818,713 859,778 903,408 949,605 995,802 1,047,132 1,098,462 4,860,951 15,694,148 2020 Refunding 827,148 862,831 1,689,979 2020 GO 321,000 345,000 362,000 374,000 398,000 342,000 361,000 380,000 82,000 86,000 88,000 92,000 96,000 540,000 3,867,000 2020 GOPortion of Original 513 7,972 8,431 8,891 9,198 9,658 44,150 2022 GO 1,280,000 1,345,000 1,410,000 1,480,000 1,555,000 1,630,000 1,715,000 1,800,000 1,890,000 1,985,000 2,085,000 2,185,000 2,295,000 15,845,000 38,500,000 2023 GONEW 1,525,000 1,300,000 1,365,000 1,430,000 1,500,000 1,575,000 1,655,000 1,740,000 1,825,000 1,920,000 2,010,000 2,095,000 20,060,000 40,000,000 Total General Fund Principal 6,193,782 7,742,827 6,952,826 6,588,836 6,803,949 7,035,466 6,364,370 6,534,156 6,256,408 6,553,605 6,863,802 7,181,132 7,414,462 42,220,951 130,706,572 General FundInterest 2008 TMBF Variable Rate Loan 156,474 127,133 104,114 79,951 54,585 27,963 550,219 2009 Qualified School ConstructionSchools 123,624 123,624 123,624 10,302 381,174 2014 TMBF LoanFieldhouseCity 24,012 22,185 20,315 18,400 16,429 14,412 12,354 10,237 8,062 5,829 3,538 1,189 156,962 2014 TMBF LoanFarmer's MarketCity 4,608 3,929 3,233 2,520 1,788 1,035 327 17,440 2014 TMBF LoanFarmer's MarketTIF 21,722 18,523 15,242 11,881 8,426 4,880 1,541 82,215 2016 GO 349,650 325,150 299,400 272,400 249,800 226,200 201,600 176,000 149,400 121,800 93,000 63,200 32,200 2,559,800 2016A Refunding 85,388 73,307 60,832 46,623 38,032 29,048 19,802 10,215 363,247 2016A GO School Maint. Bldg. 107,550 100,050 92,050 83,800 76,800 69,600 62,000 54,200 46,000 37,600 28,800 19,600 10,000 788,050 2016A GO ETSU FPAC 215,500 200,500 184,750 168,000 154,000 139,400 124,200 108,400 92,000 75,000 57,400 39,000 19,800 1,577,950 2019 GO 175,050 163,550 151,300 138,800 129,300 119,300 108,800 97,800 88,600 79,000 69,000 58,600 47,800 74,000 1,500,900 2019B Refunding 750,496 719,951 687,866 654,114 618,692 581,474 542,459 501,520 458,526 413,351 365,867 316,071 263,709 585,196 7,459,292 2020 Refunding 84,499 43,142 127,641 2020 GO 179,710 163,660 146,410 128,310 109,610 89,710 72,610 54,560 39,360 36,080 32,640 29,120 25,440 66,400 1,173,620 2020 GOPortion of Original 513 2,207 1,809 1,387 943 483 6,829 2022 GO 1,743,600 1,679,600 1,612,350 1,541,850 1,467,850 1,390,100 1,308,600 1,222,850 1,132,850 1,038,350 939,100 834,850 725,600 2,290,400 18,927,950 2023 GONEW 900,000 1,765,688 1,702,125 1,642,163 1,579,275 1,513,350 1,444,163 1,371,488 1,295,100 1,214,888 1,130,625 1,042,200 949,838 3,797,552 21,348,454 Total General Fund Interest 4,924,090 5,531,800 5,204,998 4,800,056 4,505,070 4,206,472 3,898,456 3,607,270 3,309,898 3,021,898 2,719,970 2,403,830 2,074,387 6,813,548 57,021,743 Total General Fund Debt Service 11,117,871 13,274,627 12,157,824 11,388,892 11,309,019 11,241,938 10,262,826 10,141,426 9,566,306 9,575,503 9,583,772 9,584,962 9,488,849 49,034,499 187,728,315 GP School FundPrincipal 2008 TMBF Variable Rate LoanSchools 477,000 477,000 2016A GO School Energy Imp. 390,000 410,000 430,000 450,000 470,000 485,000 505,000 525,000 3,665,000 Total GP School FundPrincipal 867,000 410,000 430,000 450,000 470,000 485,000 505,000 525,000 4,142,000 GP School FundInterest 2008 TMBF Variable Rate LoanSchools** 14,310 14,310 2016A GO School Energy Imp. 158,900 139,400 118,900 97,400 79,400 60,600 41,200 21,000 716,800 Total GP School FundInterest 173,210 139,400 118,900 97,400 79,400 60,600 41,200 21,000 731,110 Total GP School Fund Debt Service 1,040,210 549,400 548,900 547,400 549,400 545,600 546,200 546,000 4,873,110 CITY OF JOHNSON CITY
Governmental Funds (continued)
196 DEBT SERVICE SCHEDULE BY FUND AS OF JUNE 30, 2024 FY 2037 Description FY 2024 FY 2025 FY 2026 FY 2027 FY 2028 FY 2029 FY 2030 FY 2031 FY 2032 FY 2033 FY 2034 FY 2035 FY 2036 and Beyond Total CITY OF JOHNSON CITY
Med Tech ParkPrincipal 2020 GO Refunding 92,851 97,170 190,021 Total Med Tech ParkPrincipal 92,851 97,170 190,021 Med Tech ParkInterest 2020 GO Refunding 9,501 4,858 14,359 Total Med Tech ParkInterest 9,501 4,858 14,359 Total Med Tech Park Debt Service 102,352 102,028 204,380 Educational FacilitiesPrincipal 2010 Series VII-I-1 (Variable) 1,790,000 1,855,000 1,920,000 1,985,000 2,055,000 2,125,000 2,200,000 2,280,000 2,355,000 2,440,000 2,500,000 23,505,000 2020 GO 1,540,000 1,615,000 840,000 880,000 925,000 975,000 1,020,000 1,070,000 1,115,000 1,160,000 11,140,000 2022 GO 60,000 65,000 70,000 70,000 75,000 80,000 85,000 90,000 90,000 95,000 100,000 105,000 110,000 765,000 1,860,000 Total Educ. Facilities Principal 3,390,000 3,535,000 2,830,000 2,935,000 3,055,000 3,180,000 3,305,000 3,440,000 3,560,000 3,695,000 2,600,000 105,000 110,000 765,000 36,505,000 Educational FacilitiesInterest 2010 Series VII-I-1 (Variable) 705,150 651,450 595,800 538,200 478,650 417,000 353,250 287,250 218,850 148,200 75,000 4,468,800 2020 GO 523,550 446,550 365,800 323,800 279,800 233,550 184,800 133,800 91,000 46,400 2,629,050 2022 GO 84,250 81,250 78,000 74,500 71,000 67,250 63,250 59,000 54,500 50,000 45,250 40,250 35,000 110,600 914,100 Total Educ. Facilities Interest 1,312,950 1,179,250 1,039,600 936,500 829,450 717,800 601,300 480,050 364,350 244,600 120,250 40,250 35,000 110,600 8,011,950 Total Educ. Facilities Debt Service 4,702,950 4,714,250 3,869,600 3,871,500 3,884,450 3,897,800 3,906,300 3,920,050 3,924,350 3,939,600 2,720,250 145,250 145,000 875,600 44,516,950 Total Governmental Fund Principal 10,543,633 11,784,997 10,212,826 9,973,836 10,328,949 10,700,466 10,174,370 10,499,156 9,816,408 10,248,605 9,463,802 7,286,132 7,524,462 42,985,951 171,543,593 Total Governmental Fund Interest 6,419,751 6,855,308 6,363,498 5,833,956 5,413,920 4,984,872 4,540,956 4,108,320 3,674,248 3,266,498 2,840,220 2,444,080 2,109,387 6,924,148 65,779,162 Total Gov. Funds Debt Service 16,963,383 18,640,305 16,576,324 15,807,792 15,742,869 15,685,338 14,715,326 14,607,476 13,490,656 13,515,103 12,304,022 9,730,212 9,633,849 49,910,099 237,322,755
Proprietary Funds
197 DEBT SERVICE SCHEDULE BY FUND AS OF JUNE 30, 2024 FY 2037 Description FY 2024 FY 2025 FY 2026 FY 2027 FY 2028 FY 2029 FY 2030 FY 2031 FY 2032 FY 2033 FY 2034 FY 2035 FY 2036 and Beyond Total CITY OF JOHNSON CITY
Water/SewerPrincipal 2003 RDA Limestone Cove #1 11,353 11,890 12,453 13,042 13,661 14,309 14,987 15,697 16,441 17,220 18,035 18,890 19,785 106,492 304,255 2004 RDA Watauga Flats 9,247 9,690 10,123 10,575 11,021 11,539 12,054 12,592 13,134 13,740 14,354 14,994 15,651 103,553 262,267 2005 RDA Limestone Cove #2 2,929 3,066 3,199 3,338 3,474 3,633 3,790 3,955 4,119 4,304 4,491 4,686 4,884 38,731 88,599 2008 TMBF Variable Rate Loan 53,963 56,717 59,539 62,498 65,596 68,900 367,213 2009 RDA Greggtown Road 9,171 9,503 9,817 10,141 10,449 10,820 11,177 11,546 11,904 12,319 12,726 13,145 13,561 190,302 336,581 2013 GO 690,000 705,000 720,000 740,000 760,000 780,000 805,000 835,000 860,000 890,000 920,000 1,000,000 1,000,000 8,005,000 18,710,000 2016A GO Refunding 1,603,372 1,655,515 1,885,809 1,425,220 1,490,398 1,533,850 1,590,337 1,694,621 12,879,122 2019 GO 465,000 490,000 515,000 540,000 565,000 595,000 625,000 655,000 680,000 710,000 735,000 765,000 795,000 2,585,000 10,720,000 2019B Refunding 579,173 608,375 640,010 671,646 705,715 739,784 776,287 815,222 856,592 900,395 944,198 992,868 1,041,538 4,609,049 14,880,852 2020 State Revolving Loan 629,532 643,696 658,179 672,989 688,131 703,614 719,445 735,632 752,184 769,108 786,413 804,108 822,200 4,396,959 13,782,190 2022 GO 735,000 770,000 810,000 850,000 895,000 940,000 985,000 1,035,000 1,085,000 1,140,000 1,195,000 1,255,000 1,320,000 9,110,000 22,125,000 Total Water/SewerPrincipal 4,788,740 4,963,452 5,324,129 4,999,449 5,208,445 5,401,449 5,543,077 5,814,265 4,279,374 4,457,086 4,630,217 4,868,691 5,032,619 29,145,086 94,456,079 Water/SewerInterest 2003 RDA Limestone Cove #1 13,871 13,334 12,771 12,182 11,563 10,915 10,238 9,526 8,782 8,004 7,187 6,334 5,440 12,255 142,402 2004 RDA Watauga Flats 11,321 10,878 10,445 9,993 9,547 9,029 8,514 7,976 7,434 6,828 6,214 5,574 4,917 13,640 122,310 2005 RDA Limestone Cove #2 3,719 3,582 3,449 3,310 3,174 3,015 2,858 2,693 2,529 2,344 2,157 1,962 1,764 5,853 42,409 2008 TMBF Variable Rate Loan 18,361 15,662 12,827 9,849 6,725 3,445 66,869 2009 RDA Greggtown Road 10,833 10,501 10,187 9,863 9,555 9,184 8,827 8,458 8,100 7,685 7,278 6,859 6,443 37,698 151,471 2013 GO 596,762 582,963 567,100 549,100 529,675 506,875 483,475 456,306 428,125 399,100 369,063 338,013 306,012 1,148,412 7,260,981 2016A GO Refunding 566,612 486,443 403,667 309,377 252,368 192,752 131,398 67,785 2,410,402 2019 GO 466,750 443,500 419,000 393,250 366,250 338,000 308,250 277,000 250,800 223,600 195,200 165,800 135,200 209,400 4,192,000 2019B Refunding 711,454 682,499 652,083 620,086 586,508 551,226 514,241 475,430 434,674 391,849 346,834 299,629 249,991 554,754 7,071,258 2020 State Revolving Loan 323,952 310,099 295,935 281,452 266,643 251,500 236,017 220,186 203,999 187,447 170,523 153,218 135,523 418,627 3,455,121 2022 GO 1,001,950 965,200 926,700 886,200 843,700 798,950 751,950 702,700 650,950 596,700 539,700 479,950 417,200 1,316,600 10,878,450 Total Water/SewerInterest 3,725,585 3,524,661 3,314,164 3,084,662 2,885,708 2,674,891 2,455,768 2,228,060 1,995,393 1,823,557 1,644,156 1,457,339 1,262,490 3,717,239 35,793,673 Total Water/Sewer Debt Service 8,514,325 8,488,113 8,638,292 8,084,111 8,094,153 8,076,340 7,998,845 8,042,325 6,274,767 6,280,643 6,274,373 6,326,030 6,295,109 32,862,325 130,249,752 City Solid WastePrincipal 2019 GO 65,000 70,000 75,000 80,000 80,000 85,000 90,000 95,000 100,000 100,000 105,000 110,000 115,000 375,000 1,545,000 2020 GO 30,000 30,000 30,000 35,000 35,000 35,000 35,000 40,000 40,000 45,000 45,000 45,000 50,000 270,000 765,000 Total City Solid WastePrincipal 95,000 100,000 105,000 115,000 115,000 120,000 125,000 135,000 140,000 145,000 150,000 155,000 165,000 645,000 2,310,000 City Solid WasteInterest 2019 GO 67,250 64,000 60,500 56,750 52,750 48,750 44,500 40,000 36,200 32,200 28,200 24,000 19,600 30,400 605,100 2020 GO 32,900 31,400 29,900 28,400 26,650 24,900 23,150 21,400 19,800 18,200 16,400 14,600 12,800 33,400 333,900 Total City Solid WasteInterest 100,150 95,400 90,400 85,150 79,400 73,650 67,650 61,400 56,000 50,400 44,600 38,600 32,400 63,800 939,000 Total City Solid Waste Debt Service 195,150 195,400 195,400 200,150 194,400 193,650 192,650 196,400 196,000 195,400 194,600 193,600 197,400 708,800 3,249,000 Storm WaterPrincipal 2013 GO 275,000 280,000 290,000 295,000 305,000 315,000 320,000 335,000 345,000 355,000 370,000 3,485,000 2020 GO 84,000 90,000 93,000 96,000 102,000 108,000 114,000 120,000 123,000 129,000 132,000 138,000 144,000 810,000 2,283,000 2022 GO 90,000 95,000 95,000 100,000 105,000 110,000 120,000 125,000 130,000 135,000 145,000 150,000 160,000 1,095,000 2,655,000 Total Storm Water Principal 449,000 465,000 478,000 491,000 512,000 533,000 554,000 580,000 598,000 619,000 647,000 288,000 304,000 1,905,000 8,423,000 Storm WaterInterest 2013 GO 103,612 98,113 91,812 84,563 76,819 67,669 58,219 47,419 36,112 24,469 12,486 701,293 2020 GO 98,190 93,990 89,490 84,840 80,040 74,940 69,540 63,840 59,040 54,120 48,960 43,680 38,160 99,600 998,430 2022 GO 120,200 115,700 110,950 106,200 101,200 95,950 90,450 84,450 78,200 71,700 64,950 57,700 50,200 158,400 1,306,250 Total Storm Water Interest 322,002 307,803 292,252 275,603 258,059 238,559 218,209 195,709 173,352 150,289 126,396 101,380 88,360 258,000 3,005,973 Total Storm Water Debt Service 771,002 772,803 770,252 766,603 770,059 771,559 772,209 775,709 771,352 769,289 773,396 389,380 392,360 2,163,000 11,428,973
198 DEBT SERVICE SCHEDULE BY FUND AS OF JUNE 30, 2024 FY 2037 Description FY 2024 FY 2025 FY 2026 FY 2027 FY 2028 FY 2029 FY 2030 FY 2031 FY 2032 FY 2033 FY 2034 FY 2035 FY 2036 and Beyond Total CITY OF JOHNSON CITY
Fleet MgmtPrincipal 2020 GO 252,028 266,569 281,109 290,802 305,342 1,395,850 Total Fleet Mgmt Principal 252,028 266,569 281,109 290,802 305,342 1,395,850 Fleet MgmtInterest 2020 GO 69,793 57,191 43,863 29,807 15,267 215,921 Total Fleet Mgmt Interest 69,793 57,191 43,863 29,807 15,267 215,921 Total Fleet Mgmt Debt Service 321,821 323,760 324,972 320,609 320,609 1,611,771 Total Proprietary Principal 5,584,768 5,795,021 6,188,238 5,896,251 6,140,787 6,054,449 6,222,077 6,529,265 5,017,374 5,221,086 5,427,217 5,311,691 5,501,619 31,695,086 106,584,929 Total Proprietary Interest 4,217,530 3,985,055 3,740,679 3,475,222 3,238,434 2,987,100 2,741,627 2,485,169 2,224,745 2,024,246 1,815,152 1,597,319 1,383,250 4,039,039 39,954,567 Total Proprietary Debt Service 9,802,298 9,780,076 9,928,916 9,371,473 9,379,221 9,041,549 8,963,704 9,014,434 7,242,119 7,245,332 7,242,369 6,909,010 6,884,869 35,734,125 146,539,496 Total Debt Service Total Principal 16,128,401 17,580,018 16,401,064 15,870,087 16,469,736 16,754,915 16,396,447 17,028,421 14,833,782 15,469,691 14,891,019 12,597,823 13,026,081 74,681,037 278,128,522 Total Interest 10,637,280 10,840,363 10,104,177 9,309,178 8,652,354 7,971,972 7,282,583 6,593,489 5,898,993 5,290,744 4,655,372 4,041,399 3,492,637 10,963,187 105,733,729 Total Debt Service 26,765,681 28,420,381 26,505,241 25,179,265 25,122,090 24,726,887 23,679,030 ####### ####### ####### ####### ####### ####### ####### 383,862,251
Proprietary Funds (continued)
PERSONNEL SUMMARY
Personnel Summary
199 Actual FY 2020 Actual FY 2021 Actual FY 2022 Actual FY 2023 Budget FY 2024 Change 24 vs. 23 Administration 8.2 8.2 8.2 9.2 11.2 2 City Court 1 1 1 1 1 0 Communications & Marketing 4 5 6 7 9 2 Development Services 20 20 20 22 22 0 Facilities Management 9 9 11 14 15 1 Family Justice Center 1 1 1 1 1 0 Finance 19 19 19 19 19 0 Fire 130 130 131 133 136 3 Human Resources 4 4 4 7 7 0 Information Technology 15 14 14 14 14 0 Juvenile Court 11.5 11.5 11.5 11.5 11.5 0 Legal 2 2 2 2 2 0 Parks and Recreation 67.15 66.45 67.75 67.75 71.45 3.7 Pine Oaks Golf Course 7 7 8 8 8 0 Police 182.8 182.8 183.8 165 167 2 Public Works 81.5 81.5 81.5 81.5 84.5 3 Purchasing 4 4 4 4 3.5 -0.5 Risk Management 0.5 0.5 0.5 0.7 0.7 0 Senior Services 14.15 14.75 14.75 14.45 14.45 0 Student Transportation 30.4 30.4 30.95 32.6 32.6 0 GENERAL FUND TOTAL 612.2 612.1 619.95 614.7 630.9 16.2
Includes Full-Time and Part-Time Employees
Personnel Summary
Personnel Summary
200 F - 23 Actual FY 2020 Actual FY 2021 Actual FY 2022 Actual FY 2023 Budget FY 2024 Change 24 vs. 23
Includes Full-Time and Part-Time Employees OTHER FUNDS Community Development Fund 0 0 0 1 1 0 Fleet Management Fund 35.1 34.5 34.5 34.5 34.5 0 Freedom Hall Fund 6 6 6 6 6 0 Insurance Fund 3.5 3.5 3.5 4.3 4.3 0 Mass Transit Fund 57.6 56.85 53.85 53.65 52.9 -0.75 Police Grants Fund 2 2 2 2 2 0 Solid Waste Fund 64.6 63.6 65.6 65.6 66.6 1 Storm Water Fund 8.5 8.5 8.5 8.5 8.5 0 Transportation Planning Fund 2.25 2.25 2.25 2.25 3 0.75 Water & Sewer Fund 173.6 175.1 178.4 182.4 187.4 5 OTHER FUNDS TOTAL 353.15 352.3 354.6 360.2 366.2 6 TOTAL ALL FUNDS 965.35 964.4 974.55 974.9 997.1 22.2
201 Activity Position Actual 2020 Actual 2021 Actual 2022 Actual 2023 Budget 2024 Administration 41321 City Manager 1 1 1 1 1 Staff Attorney 0 0 0 0 1 Economic Development Director 0 0 0 1 1 Economic Development Analyst 0 0 0 0 1 Executive Assistant 1 1 1 1 1 Administrative Specalist II 1 1 1 1 1 Total Employees 3 3 3 4 6 41351 Assistant City Manager 2 2 2 2 2 Director of Budget and Performance Management 1 1 1 1 1 Budget Analyst 1 1 1 1 1 Receptionist 1.2 1.2 1.2 1.2 1.2 Total Employees 5.2 5.2 5.2 5.2 5.2 Total Full Time 4 4 4 4 4 Total Part Time 1.2 1.2 1.2 1.2 1.2 Total Full Time - Administration 7 7 7 8 10 Total Part Time - Administration 1.2 1.2 1.2 1.2 1.2 Total Employees 8.2 8.2 8.2 9.2 11.2 41211 City Court Municipal Court Clerk 1 1 1 1 1 Total Employees 1 1 1 1 1 Development Services 41711 Planning Director of Development Services 1 1 1 1 1 Development Coordinator 1 1 1 1 1 Senior Planner 1 1 1 1 0 Planner 0 1 1 1 0 Planner II 1 0 0 0 2 Senior Planning Technician 1 1 1 1 1 Administrative Specialist II 1 1 1 1 1 Total Employees 6 6 6 6 6 Personnel Summary
Personnel Summary
202 Activity Position Actual 2020 Actual 2021 Actual 2022 Actual 2023 Budget 2024 41721 Code Administration Chief Building Official 1 1 1 1 1 Code Enforcement Officer 3 3 3 4 3 Code Enforcement Supervisor 0 0 0 0 1 Customer Service Clerk 0 0 0 0 0 Development Services Manager 1 1 1 1 0 Development Technician 1 1 1 1 0 Permit Technician 2 2 2 2 2 Permitting Coordinator 1 1 1 1 1 Planning Technician 0 0 0 0 1 Plans Examiner 0 0 0 0 1 Trade Inspector 2 2 2 2 2 Trade Inspector II 3 3 3 4 4 Total Employees 14 14 14 16 16 Total Employees 20 20 20 22 22 41381 Communications & Marketing Communications & Marketing Director 1 1 1 1 1 Communication Specialist 0 1 1 1 1 Digital Communications Manager 1 1 1 1 1 Grants Coordinator 0 0 0 1 1 Multimedia Specialist 0 0 1 1 1 Public Information Officer 0 0 0 0 1 Public Information Specialist 1 1 1 1 1 Special Events Coordinator 1 1 1 0 1 Special Events Manager 0 0 0 1 1 Total Employees 4 5 6 7 9 42910 Family Justice Center Family Justice Center Manager 1 1 1 1 1 Total Employees 1 1 1 1 1 43911 Facilities Management Facilities Management Director 1 1 1 1 1 Administrative Specialist II 0 0 1 1 1 Crew Supervisor 1 1 1 1 1 Custodian 0 0 0 0 3 Facilities Maintenance Manager 1 1 1 1 1 Facilities Maintenance Techinician I 2 2 3 3 4 Facilities Maintenance Technician II 3 3 3 3 3 Total Employees 8 8 10 10 14 43914 Keystone Custodian 1 1 1 1 1 Total Full Time - Facilities Management 9 9 11 14 15 Finance 41511 Administration Finance Director 1 1 1 1 1 Administrative Specialist II 1 1 1 1 1 Total Employees 2 2 2 2 2
203 Activity Position Actual 2020 Actual 2021 Actual 2022 Actual 2023 Budget 2024 41531 Accounting Assistant Finance Director 0 0 1 1 1 Accounting Technician Payroll 3 2 2 2 2 Accounts Payable Specialist 2 2 2 2 2 Finance Supervisor 1 1 1 0 0 Staff Accountant 4 5 4 5 5 Total Employees 10 10 10 10 10 41551 Collections Collection Specialist 1 1 1 1 1 Collections/Customer Service Clerk 4 4 4 4 4 Tax Specialist 1 1 1 1 1 Total Employees 6 6 6 6 6 Total Full Time 6 6 6 6 6 41561 Records Management Records Specialist 1 1 1 1 1 1 1 1 1 1 Total Full Time - Finance 19 19 19 19 19 Total Employees 19 19 19 19 19 Fire Department 42211 Administration Fire Chief 1 1 1 1 1 Deputy Fire Chief 1 1 1 1 1 Asst Fire Chief 0 0 0 2 2 Administrative Services Manager 1 1 1 1 1 Administrative Specialist II 0 0 0 1 1 Clerical Specialist II 1 1 1 0 0 Total Employees 4 4 4 6 6 42221 Protection District Fire Chief 6 6 6 6 6 Fire Lieutenant 27 27 27 27 27 Fire Driver Engineer 36 36 36 36 36 Firefighter 51 51 51 51 54 Total Employees 120 120 120 120 123 42231 Prevention Fire Marshal 0 0 1 1 1 Fire Prevention Officer III 1 1 1 1 1 Fire Prevention Officer 3 3 3 3 3 Total Employees 4 4 5 5 5 42241 Training District Fire Chief 1 1 1 1 1 Fire Equipment Technician 1 1 1 1 1 Total Employees 2 2 2 2 2 Total Employees 130 130 131 133 136 Personnel
Summary
Personnel Summary
204 Activity Position Actual 2020 Actual 2021 Actual 2022 Actual 2023 Budget 2024 41651 Human Resources Director of Human Resources 1 1 1 1 1 Asst Director of Human Resources 0 0 0 1 1 CDL Compliance & Traning Coordinator 0 0 0 1 1 Human Resource Analyst 0 0 2 1 1 Human Resource Generalist 2 2 1 2 2 Human Resource Manager 1 1 0 0 0 Talent and Acquisition Specialist 0 0 0 1 1 Total Employees 4 4 4 7 7 51111 Information Technology Information Technology Director 1 1 1 1 1 Assistant Director, Technology Security Officer 1 1 1 1 1 Cloud Software Support Specialist 0 0 0 1 1 Communication Specialist 1 0 0 0 0 Geospatial Administrator 0 0 1 1 1 Geospatial Analyst 1 1 1 1 1 Geospatial Manager 1 1 1 1 1 Geospatial Programmer 1 1 0 0 0 IT Administrator 1 1 1 0 0 IT Specialist 3 3 3 3 3 IT Technician 1 1 1 0 0 Network Security Engineer 1 1 1 1 1 Network Specialist 0 0 0 1 1 Technology Administrator 1 1 1 1 1 Technology Supervisor 1 1 1 1 1 Voice and Collaboration Engineer 1 1 1 1 1 Total Employees 15 14 14 14 14 41281 Juvenile Court Director of Court Services 1 1 1 1 1 Juvenile Court Judge 1 1 1 1 1 Juvenile Court Clerk 1 0 0 0 0 Chief Deputy Court Clerk 0 1 1 1 1 Child Support Enforcement Specialist 1 1 1 1 1 Courtroom Assistant 1 1 1 1 1 Deputy Clerk 2 2 2 2 2 Youth Services Officer 4 4 4 4 4 Receptionist 0.5 0.5 0.5 0.5 0.5 Total Employees 11.5 11.5 11.5 11.5 11.5 Total Full Time - Juvenile Court 11 11 11 11 11 Total Part Time - Juvenile Court 0.5 0.5 0.5 0.5 0.5 Total Employees 11.5 11.5 11.5 11.5 11.5 41275 Legal City Attorney 0 1 1 1 1 Staff Attorney 1 0 0 0 0 Paralegal 1 1 1 1 1 Total Employees 2 2 2 2 2
205 Activity Position Actual 2020 Actual 2021 Actual 2022 Actual 2023 Budget 2024 Parks & Recreation 44500 Administration Director of Parks and Recreation 1 1 1 1 1 Assistant Director of Parks and Recreation 1 1 2 2 2 Administrative Specialist I 1 1 1 1 1 Administrative Specialist II 1 1 1 1 1 Administrative Specialist III 1 1 1 1 1 Program Coordinator I 1 1 1 1 1 Promotions and Events Coordinator 1 1 1 1 1 Total Employees 7 7 8 8 8 44501 Aquatics Recreation Services Manager 0.25 0.25 0.25 0.25 0.25 Aquatics Center Supervisor 1 1 1 1 1 Head Lifeguard 1 1 1 1 1 ProgramCoordinatorI 2.8 2.8 2.8 2.8 2.8 Total Employees 5.05 5.05 5.05 5.05 5.05 Total Full Time 2.25 2.25 2.25 2.25 2.25 Total Part Time 2.8 2.8 2.8 2.8 2.8 44502 Athletic Services Athletic Manager 1 1 1 1 1 Program Coordinator I 2 2 2 2 3 Program Coordinator II 1 1 1 1 1 ProgramCoordinatorI 0.7 0.7 0.7 0.7 0.7 Total Employees 4.7 4.7 4.7 4.7 5.7 Total Full Time 4 4 4 4 5 Total Part Time 0.7 0.7 0.7 0.7 0.7 44503 Carver Recreation Center Recreation Services Manager 0.25 0.25 0.25 0.25 0.25 Center Supervisor 1 1 1 1 1 Program Coordinator II 1 1 1 1 1 Public Service Worker 0 0 1 1 1 ProgramCoordinatorI 1.4 1.4 1.4 1.4 1.4 PublicServiceWorker 0.7 0.7 0 0 0 Receptionist 0.7 0.7 0.7 0.7 0.7 Total Employees 5.05 5.05 5.35 5.35 5.35 Total Full Time 2.25 2.25 3.25 3.25 3.25 Total Part Time 2.8 2.8 2.1 2.1 2.1 Personnel Summary
Personnel Summary
206 Activity Position Actual 2020 Actual 2021 Actual 2022 Actual 2023 Budget 2024 44504 Community Center Center Supervisor 1 1 1 1 1 Custodian 2 2 2 2 3 Park Maintenance Supervisor 1 1 1 1 1 Program Coordinator I 2 2 2 3 3 Program Coordinator II 1.5 1.5 1.5 0.5 0.5 Receptionist 1 2 2 2 2 Custodian 1.95 1.95 1.95 1.95 0.65 Receptionist 2.4 0.7 0.7 0.7 0.7 Total Employees 12.85 12.15 12.15 12.15 11.85 Total Full Time 8.5 9.5 9.5 9.5 10.5 Total Part Time 4.35 2.65 2.65 2.65 1.35 44505 Langston Community Center Recreation Services Manager 0.25 0.25 0.25 0.25 0.25 Center Supervisor 1 1 1 1 1 Program Coordinator II 1.5 1.5 1.5 1.5 1.5 Receptionist 0.7 0.7 0.7 0.7 0.7 Total Employees 3.45 3.45 3.45 3.45 3.45 Total Full Time 2.75 2.75 2.75 2.75 2.75 Total Part Time 0.7 0.7 0.7 0.7 0.7 44506 Nature Recreation Services Manager 0.25 0.25 0.25 0.25 0.25 Park Naturalist 1 1 1 1 1 Total Employees 1.25 1.25 1.25 1.25 1.25 44507 Park Services Park Services Manager 1 1 1 1 1 Assistant Park Services Manager 1 1 1 1 1 Administrative Specialist II 1 1 1 1 1 Lead Custodian 0 0 2 2 2 Park Maintenance Supervisor 4 4 4 4 4 Park Services Technician 7 7 7 7 7 Public Service Worker 11 11 9 9 12 Custodian 2.8 2.8 2.8 2.8 2.8 Total Employees 27.8 27.8 27.8 27.8 30.8 Total Full Time 25 25 25 25 28 Total Part Time 2.8 2.8 2.8 2.8 2.8 Total Full Time - Park & Recreation 53 54 56 56 61 Total Part Time - Park & Recreation 14.15 12.45 11.75 11.75 10.45 Total Employees 67.15 66.45 67.75 67.75 71.45
207 Activity Position Actual 2020 Actual 2021 Actual 2022 Actual 2023 Budget 2024 Pine Oaks Golf Course 44611 Pine Oaks Administration Golf Manager 1 1 1 1 1 Golf Assistant Manager 0 0 1 1 1 Golf Shop Attendant 2 2 1 1 1 Total Employees 3 3 3 3 3 44681 Pine Oaks Maintenance Golf Maintenance Manager 1 1 1 1 1 Golf Course Superintendent 1 1 1 1 1 Golf Maintenance Technician 1 1 1 1 1 Public Service Worker 1 1 2 2 2 Total Employees 4 4 5 5 5 Total Employees - Pine Oaks Golf Course 7 7 8 8 8 Police 42111 Police Administration Police Chief 1 1 1 1 1 Deputy Police Chief 0 1 1 1 1 Special Assistant to U.S. Attorney General 0 0 1 1 1 Administrative Speciliast II 1 1 1 1 1 Total Employees 2 3 4 4 4 42121 Police CID Police Captain 1 1 1 1 1 Police Lieutenant 1 1 1 1 1 Police Sergeant 3 3 3 3 3 Police Officer 13 13 13 16 16 Clerical Spec II 1 1 1 1 1 Total Employees 19 19 19 22 22 42131 Police Patrol Police Major 1 1 1 1 1 Police Captain 4 4 4 5 5 Police Lieutenant 5 5 5 6 6 Police Sergeant 11 11 11 11 11 Police Officer 98 98 98 92 92 Total Employees 119 119 119 115 115 42132 Police Canine Police Sergeant 0 0 0 2 2 Police Officer K9 5 5 5 3 3 Total Employees 5 5 5 5 5 42152 Police Records Police Sergeant 1 1 1 1 1 Police Officer 1 1 1 1 1 Police Records Clerk 6 6 6 6 6 Digital Forensic Analyst 0 0 0 0 1 Crime Analyst 1 1 1 1 1 Total Employees 9 9 9 9 10 Personnel
Summary
Personnel Summary
208 Activity Position Actual 2020 Actual 2021 Actual 2022 Actual 2023 Budget 2024 42153 Police Training Police Lieutenant 0 1 0 0 0 Police Sergeant 1 1 2 2 2 Police Officer 1 0 0 0 0 Total Employees 2 2 2 2 2 42154 Police Services Administration Police Major 1 1 1 1 1 Administrative Specialist II 1 1 1 1 1 Total Employees 2 2 2 2 2 42155 Police Property Police Sergeant 1 1 1 1 1 Police Officer 2 2 2 2 2 Total Employees 3 3 3 3 3 42156 Accreditation Police Captain 1 0 0 0 0 Police Sergeant 1 1 1 0 0 Police Officer 0 0 0 1 1 Administrative Services Manager 1 1 1 0 0 Administrative Specialist II 1 1 1 1 1 Planning and Research Analyst 0 0 0 1 1 Homeless Outreach Coordinator 0 0 0 0 1 Total Employees 4 3 3 3 4 42158 Police Detention Jail Superintendent 1 1 1 0 0 Chief Correctional Officer 1 1 1 0 0 Lead Custodian 1 1 1 0 0 Correctional Officer 12 12 12 0 0 CorrectionalOfficer 2.8 2.8 2.8 0 0 Total Employees 17.8 17.8 17.8 0 0 Total Full Time 15 15 15 0 0 Total Part Time 2.8 2.8 2.8 0 0 Total Full Time - Police 180 180 181 165 167 Total Part Time - Police 2.8 2.8 2.8 0 0 Total Employees 182.8 182.8 183.8 165 167 Public Works 43111 Administration Director of Public Works 1 1 1 1 1 Administrative Specialist III 1 1 1 1 1 Total Employees 2 2 2 2 2
209 Activity Position Actual 2020 Actual 2021 Actual 2022 Actual 2023 Budget 2024 43311 Streets Administration Asst Director of Public Works 1 1 1 1 1 Administrative Specialist II 1 1 1 1 1 Design & Construction Coordinator 2 2 2 2 2 Office Manager 1 1 1 1 1 Operations Manager 0.5 0.5 0.5 0.5 0.5 Total Employees 5.5 5.5 5.5 5.5 5.5 43321 Pavement Maintenance General Supervisor 1 1 1 1 1 Crew Supervisor 0 0 0 0 1 MEO II 9 9 9 9 8 MEO III 2 2 2 2 2 Total Employees 12 12 12 12 12 43331 ROW Maintenance Crew Supervisor 0 0 0 0 1 Facilities Maintenance Mechanic 1 1 1 1 1 MEO II 3 3 3 3 2 MEO III 1 1 1 1 1 Tree Trimmer I 2 2 2 2 2 Total Employees 7 7 7 7 7 43332 Street Sweeping MEO II 2 2 2 2 2 Total Employees 2 2 2 2 2 43334 Tree Beautification City Forester 1 1 1 1 1 Crew Supervisor 1 1 1 1 1 Tree Trimmer I 1 1 1 1 1 Tree Trimmer II 1 1 1 1 1 Total Employees 4 4 4 4 4 43337 Downtown Maintenance MEO II 1 1 1 1 1 Total Employees 1 1 1 1 1 43338 Landscaping Crew Supervisor 1 1 1 1 1 Landscape Technician 1 2 2 2 3 Landscape Worker 1 0 0 0 0 MEO II 1 1 1 1 1 Total Employees 4 4 4 4 5 Personnel
Summary
Personnel Summary
210 Activity Position Actual 2020 Actual 2021 Actual 2022 Actual 2023 Budget 2024 43351 Construction Administration General Supervisor 2 2 2 2 2 Crew Supervisor 3 2 2 2 2 Concrete Maintenance Worker 0 0 0 5 5 Facilities Maintenance Mechanic 7 7 7 2 2 MEO II 6 7 7 7 7 MEO III 3 3 3 3 3 Total Employees 21 21 21 21 21 43511 Traffic Traffic Engineering Manager 1 1 1 1 1 Administrative Specialist II 1 1 1 1 1 Civil Engineer III 1 1 1 1 1 Custodian 0 0 0 0 1 Traffic Signal Technician 3 3 3 3 2 Traffic Signal Technician II 0 0 0 0 1 Traffic Signs & Markings Specialist 1 1 1 1 1 Traffic Signs & Markings Technician I 5 5 5 5 4 Traffic Signs & Markings Technician II 0 0 0 0 1 Traffic System Specialist 1 1 1 1 1 Total Employees 13 13 13 13 14 43711 Engineering City Engineer 1 1 1 1 1 Civil Engineer III-PE 2 2 2 2 3 Construction Inspector 3 3 3 3 3 Engineering Technician II 1 1 1 1 1 Survey Supervisor 1 1 1 1 1 Survey Technician 1 1 1 1 1 Surveyor 1 1 1 1 1 Total Employees 10 10 10 10 11 Total Full Time - Public Works 81.5 81.5 81.5 81.5 84.5 Purchasing 41611 Purchasing Director of Purchasing 1 1 1 1 1 Assistant Director of Purchasing 1 1 1 1 1 Administrative Specialist I 0 0 0 0 0.5 Buyer 1 1 1 1 1 Total Employees 3 3 3 3 3.5 Total Full Time 3 3 3 3 3.5 51411 Central Printing Printer Specialist 1 1 1 1 0 Total Employees 1 1 1 1 0 Total Full Time - Purchasing 4 4 4 4 3.5
211 Activity Position Actual 2020 Actual 2021 Actual 2022 Actual 2023 Budget 2024 41993 Risk Management Director of Risk Management 0.2 0.2 0.2 0.2 0.2 Asst Director of Risk Management 0 0 0 0.2 0.2 Risk Management Specialist 0.3 0.3 0.3 0.3 0.3 Total Employees 0.5 0.5 0.5 0.7 0.7 Senior Services 44911 Administration Senior Services Manager 1 1 1 1 1 Administrative Specialist II 1 1 1 1 1 Administrative Specialist III 1 1 1 1 1 Receptionist 1 2 2 2 2 AdministrativeSpecialistII 1.05 0.65 0.65 0.65 0.65 Receptionist 2.3 2.3 2.3 2.3 2.3 Total Employees 7.35 7.95 7.95 7.95 7.95 Total Full Time Employees 4 5 5 5 5 Total Part Time Employees 3.35 2.95 2.95 2.95 2.95 44912 Programming Program Coordinator II 3 3 3 4 4 ProgramCoordinatorII 0.65 0.65 0.65 0 0 SCH&ECoordinator 0.65 0.65 0.65 0 0 Total Employees 4.3 4.3 4.3 4 4 Total Full Time 3 3 3 4 4 Total Part Time 1.3 1.3 1.3 0 0 44916 Transportation Seniors Transportation Aide 1 1 1 1 1 Total Employees 1 1 1 1 1 Total Full Time 1 1 1 1 1 44917 Case Management In-Home Service Coordinator 1 1 1 1 1 MealCoordinator 0.5 0.5 0.5 0.5 0.5 Total Employees 1.5 1.5 1.5 1.5 1.5 Total Full-Time Employees 1 1 1 1 1 Total Part-Time Employees 0.5 0.5 0.5 0.5 0.5 Total Full Time - Senior Services 9 10 10 11 11 Total Part Time - Senior Services 5.15 4.75 4.75 3.45 3.45 Total Employees 14.15 14.75 14.75 14.45 14.45 Personnel
Summary
Personnel Summary
212 Activity Position Actual 2020 Actual 2021 Actual 2022 Actual 2023 Budget 2024 Transit General Fund Transportation 55231 Student Transportation (Transit) Transit Director 0.25 0.25 0.25 0.25 0.25 Administrative Specialist II 1 1 1 1 1 Operations Supervisor 1 0 0 0 0 School Transportation Supervisor 1 2 2 2 2 Transit Operator II 5.4 5.4 5.4 5.4 5.4 Transit Operator III 1.5 1.5 1.5 1.2 1.2 TransitOperatorI 0.4 0.4 0.4 0.5 0.5 TransitOperatorII 7.95 7.95 7.45 8 8 TransitOperatorIII 0.8 0.8 0.8 1 1 Total Employees 19.3 19.3 18.8 19.35 19.35 Total Full Time 10.15 10.15 10.15 9.85 9.85 Total Part Time 9.15 9.15 8.65 9.5 9.5 55241 Special Education Transportation Transit Director 0.25 0.25 0.25 0.25 0.25 Special Education Supervisor 1 1 1 1 1 Transit Operator I 2.4 2.4 2.4 2.4 2.4 Transit Operator II 0.4 0.4 0.4 0.4 0.4 Transit Operator III 1.2 1.2 1.2 1.2 1.2 TransitOperatorI 4.5 4.5 4.5 5.5 5.5 TransitOperatorII 0.75 0.75 1.5 1.5 1.5 TransitOperatorIII 0.6 0.6 0.9 1 1 Total Employees 11.1 11.1 12.15 13.25 13.25 Total Full Time 5.25 5.25 5.25 5.25 5.25 Total Part Time 5.85 5.85 6.9 8 8 Total Full Time - Transit General Fund 15.4 15.4 15.4 15.1 15.1 Total Part Time - Transit General Fund 15 15 15.55 17.5 17.5 Total Employees 30.4 30.4 30.95 32.6 32.6 TOTAL GENERAL FUND - FULL TIME 573.4 575.4 583.4 580.3 597.8 TOTAL GENERAL FUND - PART TIME 38.8 36.7 36.55 34.4 33.1 TOTAL EMPLOYEES 612.2 612.1 619.95 614.7 630.9
213 Activity Position Actual 2020 Actual 2021 Actual 2022 Actual 2023 Budget 2024 Community Development Fund 47111 Community Development Administration Community Development Coordinator 0 0 0 1 1 Total Employees 0 0 0 1 1 Fleet Management Fund 51211 Operations Fleet Management Director 1 1 1 1 1 Administrative Specialist I 0 0 0 0 0.5 Administrative Specialist II 1 1 1 1 1 Fleet Management Superintendent 1 1 1 1 1 Inventory Control Manager 1 1 1 1 1 Inventory Specialist 1 2 2 2 2 Parts Runner 1 0 0 0 0 AdministrativeSpecialistI 0.5 0.5 0.5 0.5 0 PartsClerk 0.6 0 0 0 0 Total Employees 7.1 6.5 6.5 6.5 6.5 Total Full Time 6 6 6 6 6.5 Total Part Time 1.1 0.5 0.5 0.5 0 51221 Vehicles & Equipment Fleet Management Supervisor 1 1 1 1 1 Fleet Maintenance Supervisor 4 4 4 4 4 Fleet Management Maintenance Technician 1 1 1 1 1 Senior Service Technician 5 5 4 4 4 Service Technician 14 14 15 15 15 Tire Service Worker 2 2 2 2 2 Total Employees 27 27 27 27 27 51231 Communications Radio Services Manager 1 1 1 1 1 Total Employees 1 1 1 1 1 Total Full Time - Fleet Management Fund 34 34 34 34 34.5 Total Part Time - Fleet Management Fund 1.1 0.5 0.5 0.5 0 Total Employees 35.1 34.5 34.5 34.5 34.5 Freedom Hall Fund 44311 Freedom Hall Administration Civic Center General Manager 1 1 1 1 1 Box Office Clerk 1 1 1 1 1 Box Office Manager 1 1 1 1 1 Total Employees 3 3 3 3 3 44331 Freedom Hall Maintenance Freedom Hall Building Manager 1 1 1 1 1 Freedom Hall Maintenance Supervisor 1 0 0 0 0 Freedom Hall Maintenance Worker 1 2 2 2 2 Total Employees 3 3 3 3 3 Total Full Time - Freedom Hall Fund 6 6 6 6 6 Personnel Summary
Personnel Summary
214 Activity Position Actual 2020 Actual 2021 Actual 2022 Actual 2023 Budget 2024 Insurance Fund 44392 Insurance Fund - Workers Comp Director of Risk Management 0.5 0.5 0.5 0.5 0.5 Asst Director of Risk Management 0 0 0 0.5 0.5 Claims Manager 0 0 0 0.5 0.5 Occupational H&S Coordinator 0.6 0.6 0.6 0.6 0.6 Risk Management Coordinator 1.1 1.1 1.1 0.6 0.6 Total Employees 2.2 2.2 2.2 2.7 2.7 44393 Insurance Fund - Liability Director of Risk Management 0.3 0.3 0.3 0.3 0.3 Asst Director of Risk Management 0 0 0 0.3 0.3 Claims Manager 0 0 0 0.5 0.5 Occupational H&S Coordinator 0.4 0.4 0.4 0.4 0.4 Risk Management Coordinator 0.6 0.6 0.6 0.1 0.1 Total Employees 1.3 1.3 1.3 1.6 1.6 Total Employees - Insurance Fund 3.5 3.5 3.5 4.3 4.3 Mass Transit Fund 55111 Administration Transit Director 0.5 0.5 0.5 0.5 0.5 Assistant Transit Director 1 1 1 1 1 Accounts Payable Specialist 1 1 1 1 1 Administrative Specialist III 1 1 1 1 1 Management Analyst 0.75 0.75 0 0 0 Safety & Training Coordinator 1 0 0 0 0 Senior Planner 0 1 1 1 1 Transit Planner 1 0 0.75 0.75 0 Transit Technology Specialist 1 1 1 1 1 Total Employees 7.25 6.25 6.25 6.25 5.5 55131 Operations Maintenance Coordinator 1 1 0 0 0 Para Transit Coordinator 1 1 1 1 1 Transit Operator III 3.2 3.2 3.2 3.8 3.8 Transit Operator II 17.3 17.3 17.3 18.3 18.3 Transit Operator I 13.6 14.6 14.6 13.6 13.6 Clerical Specialist II 2 2 0 0 0 TransitOperatorI 0 0 0 1 1 Total Employees 38.1 39.1 36.1 37.7 37.7 Total Full Time 38.1 39.1 36.1 36.7 36.7 Total Part Time 0 0 0 1 1
215 Activity Position Actual 2020 Actual 2021 Actual 2022 Actual 2023 Budget 2024 55141 Job Access Transit Operator I 1.05 1.3 1.3 1.3 1.3 Transit Operator II 0.3 0.3 0.3 0.3 0.3 Transit Operator III 1.6 1.6 1.6 1.6 1.6 TransitOperatorI 0.5 0.5 0.5 0.5 0.5 TransitOperatorII 0.5 0.5 0.5 0.5 0.5 Total Employees 3.95 4.2 4.2 4.2 4.2 Total Full Time 2.95 3.2 3.2 3.2 3.2 Total Part Time 1 1 1 1 1 55154 ETSU/BucShot Transit Operator I 1.7 1.7 1.7 0.7 0.7 Transit Operator II 2.2 2.2 2.2 2.2 2.2 Transit Operator III 0.9 0.9 0.9 0.6 0.6 TransitOperatorI 0.5 0.5 0.5 0 0 Total Employees 5.3 5.3 5.3 3.5 3.5 Total Full Time 4.8 4.8 4.8 3.5 3.5 Total Part Time 0.5 0.5 0.5 0 0 55168 Freedom Grant Transit Operator I 1 1 1 1 1 Transit Operator II 2 1 1 1 1 Total Employees 3 2 2 2 2 Total Full Time - Mass Transit Fund 56.1 55.35 52.35 51.65 50.9 Total Part Time - Mass Transit Fund 1.5 1.5 1.5 2 2 Total Employees 57.6 56.85 53.85 53.65 52.90 42170 Police Grants Family Justice Center Secretary 2 2 2 2 2 Total Employees 2 2 2 2 2 Solid Waste 43411 Regional Solid Waste Administration Solid Waste Manager 0.2 0.2 0.2 0.2 0.2 Assistant Solid Waste Manager 1.6 0.8 0.8 0.8 0.8 Administrative Specialist II 1.05 1.05 1.05 1.05 1.05 Administrative Specialist III 0.2 0.2 0.2 0.2 0.2 Crew Supervisor 0.5 0.5 0.5 0.5 0 General Supervisor 0.5 0.5 0.5 0.5 1 Management Analyst 0.5 0.5 0.5 0.5 0.5 MEO III 0.5 0.5 0.5 0.5 0.5 Sanitation Equipment Operator 6 6 7 7 8 Sanitation Equipment Operator II 2 2 2 2 2 Sanitation Equipment Operator III 1 1 1 1 1 Service Technician 2 2 2 2 2 SW Health, Safety, & Skills Training Specialist 0.5 0.5 0.5 0.5 0.5 Total Employees 16.55 15.75 16.75 16.75 17.75
Personnel Summary
Personnel Summary
216 Activity Position Actual 2020 Actual 2021 Actual 2022 Actual 2023 Budget 2024 43211 Municipal Solid Waste Administration Solid Waste Manager 0.8 0.8 0.8 0.8 0.8 Assistant Solid Waste Manager 0.4 0.2 0.2 0.2 0.2 Administrative Specialist II 1.95 1.95 1.95 1.95 1.95 Administrative Specialist III 0.8 0.8 0.8 0.8 0.8 Crew Supervisor 0.5 0.5 0.5 0.5 0 General Supervisor 0.5 0.5 0.5 0.5 1 Management Analyst 0.5 0.5 0.5 0.5 0.5 SW Health, Safety, & Skills Training Specialist 0.5 0.5 0.5 0.5 0.5 Total Employees 5.95 5.75 5.75 5.75 5.75 43221 Municipal Solid Waste City Collections Sanitation Equipment Operator 8 8 8 8 9 Sanitation Equipment Operator II 2 2 2 2 1 Total Employees 10 10 10 10 10 43222 Municipal Solid Waste Commercial Collections Sanitation Equipment Operator 5 5 5 5 5 Sanitation Equipment Operator II 1 1 1 1 1 Total Employees 6 6 6 6 6 43223 Municipal Solid Waste Industrial Collections Sanitation Equipment Operator II 1 0 0 0 0 Sanitation Equipment Operator 6 7 7 7 7 Total Employees 7 7 7 7 7 43233 Municipal Solid Waste Iris Glen Landfill/Environmental Auditor Environmental Auditor 0.6 0.6 0.6 0.6 0.6 Total Employees 0.6 0.6 0.6 0.6 0.6 43241 Municipal Solid Waste Recycling Sanitation Equipment Operator 7 7 7 6 5 Sanitation Equipment Operator II 1 1 1 2 2 Sanitation Equipment Operator III 1 1 1 1 2 Total Employees 9 9 9 9 9 43341 Municipal Solid Waste Refuse Collection General Supervisor 1 1 1 1 1 Crew Supervisor 1 1 1 1 1 MEO II 5 5 6 6 6 MEO III 0.5 0.5 0.5 0.5 0.5 Total Employees 7.5 7.5 8.5 8.5 8.5 43342 Municipal Solid Waste Litter Collection MEO II 2 2 2 2 2 Total Employees 2 2 2 2 2 Total Employees 48.05 47.85 48.85 48.85 48.85 Total Employees - Solid Waste 64.6 63.6 65.6 65.6 66.6
217 Activity Position Actual 2020 Actual 2021 Actual 2022 Actual 2023 Budget 2024 56111 Storm Water Fund Operations Manager 0.5 0.5 0.5 0.5 0.5 Crew Supervisor 1 1 1 1 1 Environmental Specialist 1 1 1 2 2 Geospatial Coordinator 1 1 1 1 1 MEO II 3 3 3 3 3 MEO III 1 1 1 1 1 Storm Water Inspector 1 1 1 0 0 Total Employees 8.5 8.5 8.5 8.5 8.5 Transportation Planning Fund 41741 MTPO - FWHA Transportation Planning Coordinator 1 1 1 1 1 Senior Transportation Planner 1 1 1 1 1 Total Employees 2 2 2 2 2 41742 MTPO - Federal Transportation Management Analyst 0.25 0.25 0 0 0 Transit Planner 0 0 0.25 0.25 1 Total Employees 0.25 0.25 0.25 0.25 1 Total Employees - Transportation Planning Fund 2.25 2.25 2.25 2.25 3 Water & Sewer Fund 52111 City W/S Administration Director of W/WW 1 1 1 1 1 Assistant Director of W/WW - Capital 1 1 1 1 1 Administrative Specialist III 1 1 1 1 1 Custodian 0 0 0 0 2 Customer Service Manager 1 1 1 1 1 Customer Service Supervisor 1 1 1 1 1 Lead Custodian 0 0 0 0 1 Management Analyst 1 1 1 1 1 W/S Health, Safety, & Skills Training Specialist 1 1 1 1 1 Water/Wastewater Operations Manager 0 1 1 1 1 Total Employees 7 8 8 8 11 52121 City W/S Engineering Assistant Director of W/WW 1 1 1 1 0 Civil Engineer III-PE 2 1 1 1 1 Construction Inspector 3 5 5 5 5 Development Coordinator 0 0 0 1 1 Engineering Technician 1 1 0 0 0 Engineering Technician II 1 0 1 2 2 Geospatial Coordinator 1 1 1 1 1 Geospatial Specialist 0 0 1 1 1 Geospatial Technician 1 1 0 0 0 IT Specialist 0 0 1 1 1 Survey Supervisor 1 1 1 1 1 W/WW Engineering Services Coordinator 1 1 1 1 1 Total Employees 12 12 13 15 14
Personnel Summary
Personnel Summary
218 Activity Position Actual 2020 Actual 2021 Actual 2022 Actual 2023 Budget 2024 52122 City W/S Meter Reading Customer Service Supervisor 1 1 1 1 1 Meter Reader 7 7 7 8 8 Senior Meter Reader 0 0 0 1 1 Total Employees 8 8 8 10 10 52123 City W/S Customer Service Administartive Specialist I 6 7 8 8 6 Administartive Specialist II 0 0 0 0 2 Inventory Control Manager 1 1 1 1 1 Inventory Specialist 0 0 0 0 1 CustomerServiceClerk 0.5 0 0 0 0 Total Employees 7.5 8 9 9 10 Total Full Time 7 8 9 9 10 Total Part Time 0.5 0 0 0 0 52131 City W/S Water Facility W/WW Superintendent 0.125 0.125 0.125 0.125 0.125 Administartive Specialist I 0.125 0.125 0.125 1 1 Geospatial Specialist 0 0 0.125 0.125 0.125 Inst/Control Tech 0.25 0.25 0.25 0.25 0.25 Mechanical Engineer 0.125 0.125 0 0 0 W/WW Maintenance Mechanic I 1.375 1.375 1.375 4 4 W/WW Maintenance Mechanic II 0.25 0.25 0.25 0.5 0.5 W/WW Maintenance Supervisor 0.25 0.25 0.25 0.25 0.25 Total Employee 2.5 2.5 2.5 6.25 6.25 52132 City W/S Sewer Facility W/WW Superintendent 0.125 0.125 0.125 0.125 0.125 Geospatial Specialist 0 0 0.125 0.125 0.125 Inst/Control Tech 0.25 0.25 0.25 0.25 0.25 Mechanical Engineer 0.125 0.125 0 0 0 Secretary 0.125 0.125 0.125 0 0 W/WW Maintenance Mechanic I 1.705 1.705 1.705 1.33 1.33 W/WW Maintenance Mechanic II 0.25 0.25 0.25 0.5 0.5 W/WW Maintenance Supervisor 0.25 0.25 0.25 0.25 0.25 Total Employees 2.83 2.83 2.83 2.58 2.58 52141 City W/S Water Line Maintenance Asst W/WW Maint Superintendent 0.625 0.625 0.625 0.75 0.75 Crew Supervisor 2 2 2 2 2 General Supervisor 1 1 1 1 1 MEO II 9 8 8 7 7 MEO III 1 1 1 1 1 Senior ServiceTech 0.125 0.125 0.125 0.125 0.125 W/WW Maint Superintendent 0.125 0.125 0.125 0.125 0.125 W/WW Service Worker 8 8 8 6 8 Total Employees 21.875 20.875 20.875 18 20
219 Activity Position Actual 2020 Actual 2021 Actual 2022 Actual 2023 Budget 2024 52142 City W/S Sewer Line Maintenance Asst W/WW Maint Superintendent 0.625 0.625 0.625 0.75 0.75 Crew Supervisor 1 1 1 1 1 General Supervisor 1 1 1 1 1 MEO II 4 4 4 1 1 MEO III 0 0 0 1 1 Public Service Worker 2 2 1 0 0 Senior Service Tech 0.125 0.125 0.125 0.125 0.125 Sewer Rehabilitation Coordinator 1 1 1 1 1 W/WW Maint Superintendent 0.125 0.125 0.125 0.125 0.125 W/WW Service Worker 6 6 7 8 8 Total Employees 15.875 15.875 15.875 14 14 52151 City W/S Water Line Extension Asst W/WW Superintendent 0.125 0.125 0.125 0.25 0.25 Crane Truck Operator 0 0 1 0 0 Crew Supervisor 1 1 1 0 0 MEO II 3 2 2 5 5 MEO III 3 3 2 3 3 Public Service Worker 2 2 2 2 2 Senior Service Tech 0.125 0.125 0.125 0.125 0.125 W/WW Maint Superintendent 0.125 0.125 0.125 0.125 0.125 W/WW Service Worker 0 1 1 1 1 Total Employees 9.375 9.375 9.375 11.5 11.5 52152 City W/S Sewer Line Extension Asst W/WW Superintendent 0.125 0.125 0.125 0.25 0.25 Blaster Equipment Operator 1 0 0 0 0 Crew Supervisor 0 0 0 1 1 General Supervisor 2 2 2 2 2 MEO III 3 4 4 2 2 Senior Service Tech 0.125 0.125 0.125 0.125 0.125 W/WW Maint Superintendent 0.125 0.125 0.125 0.125 0.125 Total Employees 6.375 6.375 6.375 5.5 5.5 52161 City W/S Water Treatment W/WW Superintendent 0.125 0.125 0.125 0.125 0.125 Chief Water Plant Operator 1 1 1 1 1 Geospatial Specialist 0 0 0.125 0.125 0.125 Inst/Control Tech 0.5 0.5 0.5 1.25 1.25 Laboratory Analyst 1 1 1 1 1 Mechanical Engineer 0.125 0.125 0 0 0 Secretary 0.125 0.125 0.125 0 0 W/WW Maintenance Mechanic I 0.625 0.625 0.625 0.25 0.25 W/WW Maintenance Mechanic II 0.5 0.5 0.5 0.25 0.25 Water Plant Operator I 1 0 0 0 0 Water Plant Operator II 4 5 4 5 5 Water Plant Operator III 1 1 2 1 1 Total Employees 10 10 10 10 10 Personnel
Summary
Personnel Summary
220 Activity Position Actual 2020 Actual 2021 Actual 2022 Actual 2023 Budget 2024 52162 City W/S Brush Creek W/WW Superintendent 0.125 0.125 0.125 0.125 0.125 Inst/Control Tech 0.5 0.5 0.5 0.25 0.25 Geospatial Specialist 0 0 0.125 0.125 0.125 Mechanical Engineer 0.125 0.125 0 0 0 Chief WW Plant Operator 0.33 0.33 0.33 0 0 Laboratory Analyst 1 1 1 1 1 MEO III 0.75 0.75 0.75 1.25 1.25 WW Plant Operator III 1 1 1 1 1 WW Plant Operator II 1 1 1 1 1 WW Plant Operator I 3 3 4 3 3 W/WW Maintenance Mechanic II 0.5 0.5 0.5 0.25 0.25 W/WW Maintenance Mechanic I 0.955 0.955 0.955 0.58 0.58 Secretary 0.125 0.125 0.125 0 0 Total Employees 9.41 9.41 10.41 8.58 8.58 52163 City W/S Knob Creek W/WW Superintendent 0.125 0.125 0.125 0.125 0.125 Inst/Control Tech 0.5 0.5 0.5 0.25 0.25 Geospatial Database Specialist 0 0 0.125 0.125 0.125 Mechanical Engineer 0.125 0.125 0 0 0 Chief WW Plant Operator 0.33 0.33 0.33 0 0 Laboratory Analyst 1 1 1 1 1 WW Plant Operator III 1 1 1 1 1 WW Plant Operator I 4 4 4 4 4 MEO III 0.75 0.75 0.75 0.5 0.5 W/WW Maintenance Mechanic II 0.5 0.5 0.5 0.25 0.25 W/WW Maintenance Mechanic I 0.625 0.625 0.625 0.25 0.25 Secretary 0.125 0.125 0.125 0 0 Total Employees 9.08 9.08 9.08 7.5 7.5 52164 City W/S Unicoi Water Plant Operator II 1 1 1 1 1 Total Employees 1 1 1 1 1 52171 City W/S Industrial Monitoring Environmental Auditor 0.4 0.4 0.4 0.4 0.4 Cross Connection Inspector 1 1 2 2 2 Pre-Treatment Coordinator 1 1 1 1 1 CrossConnectionInspector 0.7 0.7 0 0 0 Total Employees 3.1 3.1 3.4 3.4 3.4 Total Full Time 2.4 2.4 3.4 3.4 3.4 Total Part Time 0.7 0.7 0 0 0 Total Full Time - City Water & Sewer Services 124.72 125.72 129.72 130.31 135.31 Total Part Time - City Water & Sewer Services 1.2 0.7 0 0 0 Total Employees 125.92 126.42 129.72 130.31 135.31
221 Activity Position Actual 2020 Actual 2021 Actual 2022 Actual 2023 Budget 2024 53122 Regional W/S Meter Reading Senior Meter Reader 1 1 1 0 0 Meter Reader 3 3 3 3 3 Total Employees 4 4 4 3 3 53123 Regional W/S Customer Service Customer Service Clerk 1 1 1 1 1 Stores Clerk 1 1 1 1 1 Total Employees 2 2 2 2 2 53131 Regional W/S Water Facilities Maintenance W/WW Superintendent 0.125 0.125 0.125 0.125 0.125 Inst/Control Tech 0.25 0.25 0.25 0.25 0.25 Geospatial Database Specialist 0 0 0.125 0.125 0.125 Mechanical Engineer 0.125 0.125 0 0 0 W/WW Maintenance Supervisor 0.25 0.25 0.25 0.25 0.25 W/WW Maintenance Mechanic II 0.25 0.25 0.25 0.5 0.5 W/WW Maintenance Mechanic 1.375 1.375 1.375 1 1 Secretary 0.125 0.125 0.125 0 0 Total Employees 2.5 2.5 2.5 2.25 2.25 53132 Regional W/S Sewer Facilities Maintenance W/WW Superintendent 0.125 0.125 0.125 0.125 0.125 Inst/Control Tech 0.25 0.25 0.25 0.25 0.25 Geospatial Database Specialist 0 0 0.125 0.125 0.125 Mechanical Engineer 0.125 0.125 0 0 0 W/WW Maintenance Supervisor 0.25 0.25 0.25 0.25 0.25 W/WW Maintenance Mechanic II 0.25 0.25 0.25 0.25 0.25 W/WW Maintenance Mechanic I 1.715 1.715 1.715 1.34 1.34 Secretary 0.125 0.125 0.125 0 0 Total Employees 2.84 2.84 2.84 2.34 2.34 53141 Regional W/S Water Line Maintenance Senior Auto Tech 0.125 0.125 0.125 0.125 0.125 W/WW Maint Superintendent 0.125 0.125 0.125 0.125 0.125 Asst W/WW Maint Superintendent 0.625 0.625 0.625 0.75 0.75 Crew Supervisor 3 3 3 2 2 MEO II 3 4 4 2 2 Public Service Worker 2 2 2 2 2 W/WW Service Worker 3 3 3 4 4 Total Employees 11.875 12.875 12.875 11 11 53142 Regional W/S Sewer Line Maintenance W/WW Maint Superintendent 0.125 0.125 0.125 0.125 0.125 Asst W/WW Maint Superintendent 0.625 0.625 0.625 0.75 0.75 Senior Auto Tech 0.125 0.125 0.125 0.125 0.125 General Supervisor 1 1 1 1 1 Crew Supervisor 0 0 0 1 1 MEO III 1 1 1 2 2 MEO II 3 3 3 5 5 W/WW Service Worker 2 2 2 2 2 Total Employees 7.875 7.875 7.875 12 12
Personnel Summary
Personnel Summary
222 Activity Position Actual 2020 Actual 2021 Actual 2022 Actual 2023 Budget 2024 53151 Regional W/S Water Line Extension W/WW Maint Superintendent 0.125 0.125 0.125 0.125 0.125 Asst W/WW Maint Superintendent 0.125 0.125 0.125 0.25 0.25 Senior Auto Tech 0.125 0.125 0.125 0.125 0.125 Crane Truck Operator 0 0 0 1 1 MEO III 1 1 1 0 0 MEO II 1 1 1 1 1 W/WW Service Worker 2 2 2 3 3 Total Employees 4.375 4.375 4.375 5.5 5.5 53152 Regional W/S Sewer Line Extension W/WW Maint Superintendent 0.125 0.125 0.125 0.125 0.125 Asst W/WW Maint Superintendent 0.125 0.125 0.125 0.25 0.25 Senior Auto Tech 0.125 0.125 0.125 0.125 0.125 Blaster Equipment Operator 1 1 1 1 1 MEO III 1 1 1 2 2 W/WW Service Worker 1 1 1 1 1 Total Employees 3.375 3.375 3.375 4.5 4.5 53162 Regional W/S Sewer Treatment W/WW Superintendent 0.125 0.125 0.125 0.125 0.125 Chief WW Plant Operator 0.34 0.34 0.34 1 1 Inst/Control Tech 0.5 0.5 0.5 0.25 0.25 Geospatial Database Specialist 0 0 0.125 0.125 0.125 Mechanical Engineer 0.125 0.125 0 0 0 Laboratory Analyst 1 1 1 1 1 W/WW Maintenance Mechanic II 0.5 0.5 0.5 0.5 0.5 W/WW Maintenance Mechanic I 0.625 0.625 0.625 0.25 0.25 WW Plant Operator III 1 1 1 1 1 WW Plant Operator II 1 0 0 0 0 WW Plant Operator I 3 4 4 5 5 MEO III 0.5 0.5 0.5 0.25 0.25 Secretary 0.125 0.125 0.125 0 0 Total Employees 8.84 8.84 8.84 9.5 9.5 Total Employees 47.68 48.68 48.68 52.09 52.09 Total Full Time - Water & Sewer Fund 172.4 174.4 178.4 182.4 187.4 Total Part Time - Water & Sewer Fund 1.2 0.7 0 0 0 Total Employees 173.6 175.1 178.4 182.4 187.4 GRAND TOTAL FULL TIME 922.75 925 936 938 962 GRAND TOTAL PART TIME 42.6 39.4 38.55 36.9 35.1 TOTAL EMPLOYEES 965.35 964.4 974.55 974.9 997.1
Accrual Basis of Accounting – A basis of accounting in which revenues and expenditures are recorded at the time they are earned or incurred as opposed to when cash is actually received or spent.
Appropriation – Authorization for spending a specific amount of money for a specific purpose during a fiscal year.
Approved Budget – The budget as formally adopted by the City Commission for the upcoming fiscal year, beginning July 1.
Assessed Valuation – A value that is established for real or personal property for use as a basis for levying property taxes.
Balanced Budget – Occurs when planned expenditures equal anticipated revenues. In Tennessee, it is required that the budget be approved by the City Commission be balanced.
Bond Rating – A rating (made by an established bond rating company) from a schedule of grades indicating the probability of timely repayment of principal and interest on bonds issued.
Budget – A comprehensive financial plan of operation for a fiscal year that matches all planned revenues and expenditures with various municipal services. The City’s budget is adopted annually.
Budget Calendar – The schedule of key dates or milestones which the City staff follows in the preparation and adoption of the budget.
Budget Document – The official written statement prepared by the City staff which reflects the decisions and allocations made by the City Commission.
Budget Ordinance – The formal legal documentation of budgeted appropriations approved by the City Commission. The adoption of the budget ordinance requires approval on three readings.
Capital – Category of expenditures for capital acquisitions that include: land, buildings, infrastructure, and equipment over $5,000, which have useful lives extending beyond a single reporting period.
Capital Equipment Fund – Used to account for acquisition of major capital equipment including vehicles, mowers, large trucks, etc.
Capital Improvements Plan – Issued separately, but in coordination with the budget document, the CIP is the plan or schedule of project expenditures for public facilities, infrastructure, and equipment with estimated project costs, sources of funding, and timing of work/purchases over a five year period. Generally, projects and/or equipment over $15,000 are included in the CIP.
Capital Projects Fund – Used to account for acquisition and/or construction of major capital projects, including buildings, parks, streets, and other City facilities.
223
GLOSSARY
A B C
Glossary
City Commission – The five member governing body of the City of Johnson City.
City Manager – The Chief Executive Officer of the City of Johnson City, hired by the City Commission.
Community Development Block Grant (CDBG) – A federal entitlement program designed to benefit low and moderate income persons, specifically in the areas of housing.
Cost-of-Living Adjustment (COLA) – An increase in salaries to offset the adverse effect of inflation on compensation.
Debt Limit – The maximum amount of gross or net debt that is legally permitted.
Debt Service Fund – The fund established for the purpose of accumulating resources to repay the principal and interest on long-term general obligation debt, excluding debt payable for the Enterprise Funds of the City (Golf, Solid Waste, and Water/Sewer).
Deficit – An excess of expenditures over revenues or expenses over income.
Department – A major administrative or operational division of the City, which is responsible for a group of related activities.
Depreciation – A decrease in value of property through wear, deterioration, or obsolescence.
Drug Fund – A fund used to account for drug related fines and confiscations received, as well as usage of these monies to further drug investigations.
Enterprise Fund – A grouping of activities whose expenditures are entirely offset by revenues collected from user fees or charges. This is a business-like activity. Enterprise Funds for the City of Johnson City are Golf, Mass Transit, Solid Waste (Municipal and Regional), Storm Water, and Water/Sewer.
Estimated Revenue – The amount of projected revenue to be collected during the fiscal year.
Expenditure – The money spent by the City for programs and projects included within the approved budget.
Fiscal Year – The time period beginning on July 1 of a calendar year and ending on June 30 of the following calendar year.
Fixed Assets – Equipment and other capital items used in governmental type operations, which are intended to be held and have long-term value, such as land, buildings, machinery, vehicles, and other equipment.
Full-Time Equivalent – A part-time position converted to the decimal equivalent of a full-time position based on 2080 hours.
224
D E F
Fund – An accounting entity which has a set of self-balancing accounts and where all financial transactions for special activities or governmental functions are recorded.
Fund Balance – Amounts shown as fund balance represent monies remain unspent after all budgeted expenditures have been made.
General Fund – The general operating fund of the City used to account for all financial resources except those required to be accounted for in another fund. Most department operations of the City are funded by the General Fund, including Police, Fire, Administration, Parks & Recreation, Senior Center, Risk Management, Information Technology, and Public Works.
Generally Accepted Accounting Principles (GAAP) – The rules and procedures that serve as the guide for the fair presentation of Financial Statements.
General Obligation Bonds – Bonds issued by a government that are backed by the full faith and credit of its taxing authority.
Goal – A statement of specific direction, purpose, or intent to be accomplished by staff within a program.
Grants – A contribution of cash or other assets from another government or non-profit foundation to be used for a specific purpose.
Infrastructure – Long-lived capital assets that normally are stationary in nature, including streets, bridges, water/sewer line and treatment facilities, storm drainage, traffic signals, etc.
Intergovernmental Revenue – Funds received from federal, state, and local government sources.
Internal Service Fund – Fund used to account for the furnishings of goods or services by one department to other departments or agencies on a cost-reimbursement basis. The Motor Transport Fund and Insurance Fund are internal service funds for the City of Johnson City.
Line Item – A budgetary account representing a specific object of expense.
Long-Term Debt – Debt issued with a maturity of more than one year after the date of issuance.
Merit Increase – An amount of money set aside to reward employees who have performed with excellence throughout the fiscal year.
Modified Accrual Basis of Accounting – Basis of accounting to which: 1) revenues are recognized in the accounting period in which they become available and measurable and 2) expenditures are recognized in the accounting period in which the fund liability is incurred, if measurable.
225 Glossary
G I L M
Objective – A statement of specific direction, purpose, or intent to be accomplished by staff within a program.
Operating Budget – The City’s financial plan which outlines proposed personnel and operating expenditures for the coming fiscal year, as well as revenue estimates which will be used to finance them.
Payment in Lieu of Taxes – Payment that a property owner not subject to taxation makes to a government to compensate for services that the property owner receives, which are normally financed through property taxes.
Personal Services – Category of expenditures which include employees, salaries and wages, and employee benefits.
Property Tax – A tax levied on the assessed value of real and personal property.
Property Tax Rate – The amount of tax levied for each $100 of assessed valuation.
Public Hearing – An open meeting or portion of the regularly scheduled meeting of the City Commission for the purpose of obtaining public comment or input on a particular issue.
Reserved Fund Balance – A portion of the City’s fund balance that is legally restricted for a specific purpose and is not available for general appropriation.
Retained Earnings – An equity account reflecting the accumulated earnings of an enterprise or internal service fund.
Revenue – Income received from various sources used to finance government services.
Revenue Bonds – Bonds usually sold for constructing a project that will produce revenue for the City. The revenue is then used to pay the principal and interest on the bond.
Special Revenue Fund – A fund used to account for resources that are subject to certain spending restrictions, where specific revenue sources are used to finance certain activities.
Supplemental Budget – A budget that is prepared to meet unexpected needs or to spend revenues not anticipated at the time the original budget was adopted.
226 Glossary
O P R S
Transfer – An amount distributed from one fund to finance activities in another fund. Transfers are shown as an expenditure in the originating fund and a revenue in the receiving fund.
Unreserved Fund Balance – The portion of fund balance that is not restricted for a specific purpose and is available for general appropriation.
227 Glossary
T U
