
In August 2023, the City of Johnson City launched the process of developing a long-term planning document focused on shaping our future. As Mayor, I am proud to present the results of this multi-year effort: the Horizon 2045 Growth Management Plan. This plan will guide the City in setting priorities to ensure our growth is smart and strategic in the years ahead. Horizon 2045 replaces both the 2000 Comprehensive Plan and the 2021-2025 Bridge Plan as the foundation for our city’s future land use strategy.
Johnson City and its neighboring communities have drawn national attention, with frequent articles highlighting the region’s many strengths. Along with the excitement of being “discovered” comes a shared concern among residents about how this notoriety will impact our future. The Horizon 2045 Growth Management Plan is designed to proactively address and manage development and essential services through thoughtful prioritization.
While Johnson City experienced a 24 percent population increase in the 1980s, current projections for this decade anticipate a moderate growth rate of 13 to 14 percent, more in line with recent trends. The Horizon 2045 plan prepares us to face this population gain and to look ahead in anticipation of the unexpected.
I am extremely proud of how this plan represents the thoughts, ideas and concerns of our community members. Through workshops, online engagement, community meetings, and other input sessions, more than 23,000 community data points were collected to inform the document’s findings. Within this diverse conversation, common threads emerged providing Horizon 2045 organizers with a snapshot of the priorities and investments important to our stakeholders.
The key outcome of Horizon 2045 focuses on a series of planning themes to support the land use strategy:
• Quality Growth and Development
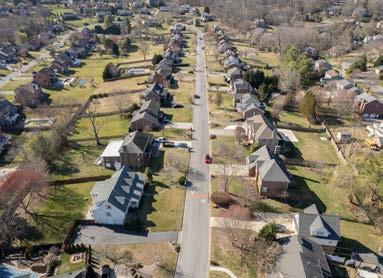
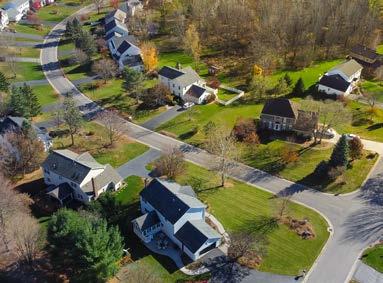
• Strong Neighborhoods
• Prosperous Economy
• Vibrant Downtown

• Coordinated Transportation System
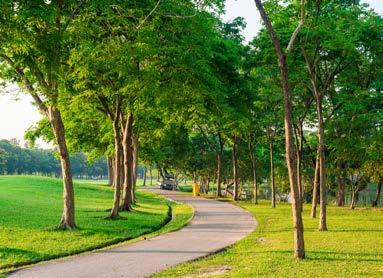
• Healthy Environment
• Supportive Services and Utilities
• First-Class Education System
On behalf of the Horizon 2045 Growth Management Plan organizers and City leadership, we express our gratitude to every citizen who participated in the process by adding their voice to the conversation. Special recognition to the Planning and Development Services Department along with lead organizer and Planning Manager Whitney Hodges, whose contributions were pivotal to the Horizon 2045 Plan. A thriving and prosperous city is only possible through civic engagement, and I am encouraged by the participation that went into informing this document.
With the Horizon 2045 Growth Management Plan, the City of Johnson City is positioned for a future filled with abundant opportunity for lifelong residents, newcomers, and visitors. The Horizon 2045 Growth Management Plan aims to enhance the quality of life for everyone who calls Johnson City home.

Mayor John Hunter
Johnson City’s Growth Management Plan will guide the City’s direction over the next quarter century and so is named “Horizon 2045.” “Horizon” symbolizes looking ahead — planning not just for the present but for what is beyond the visible. “2045” gives the plan a concrete target year, symbolizing commitment to measurable long-term goals. Exploring the possibilities before us, Horizon 2045 aligns a new land use strategy with broader community initiatives, such as a healthy economy, fiscal responsibility, housing affordability, sense of place, and quality of life. The Plan also reviews, updates, and consolidates previous planning efforts undertaken by the City. Development of the Plan uses the vision of our community and the expertise of its stakeholders to help ensure that Johnson City grows in a way that is manageable and desirable for all.
Horizon 2045 acts as a guide for City staff and elected officials to inform future land use decisions and will be used by multiple groups with varied interests.
To align department policies, inform financial decisions, and incrementally decide how to fulfill the community’s vision.
To promote the community’s vision and encourage consistency in land use decision making.
To guide decisions about growth and development while allowing staff and elected officials to evaluate the economic conditions and community preferences.
To understand where the City will focus growth and investment and identify where concentrated development may occur.
To understand the vision for future growth, development, and sustainability.
To continue working toward the common community goal.
To streamline cross-jurisdictional recommendations and policy strategies.

This process diagram shows the different phases of Horizon 2045 as well as the major tasks and general timeline for each phase. The process diagram also shows the deliverables, meetings, and the community engagement opportunities associated with each phase. Three digital engagement series were interspersed throughout the timeline. The process culminated with adoption in Summer 2025.
August 2023–January 2024 PHASE
February 2024–November 2024
Project Initiation
Baseline Conditions Development of Vision and Goals
Community Characteristics Report
Digital Engagement Hub
Future Land Use Strategy Development of Policy Framework
December 2024–June 2025
Reporting Adoption
Guiding Statement and Planning Themes
Conceptual Growth Strategy
Future Land Use Strategy
Policy Framework
Comprehensive Plan Report
The key outcome of the plan is the Future Land Use Map, which guides future growth and development in Johnson City. A series of planning themes support the land use strategy:
• Quality Growth and Development
• Strong Neighborhoods
• Prosperous Economy
• Vibrant Downtown
• Coordinated Transportation System
• Healthy Environment
• Supportive Services and Utilities
• First-Class Education System
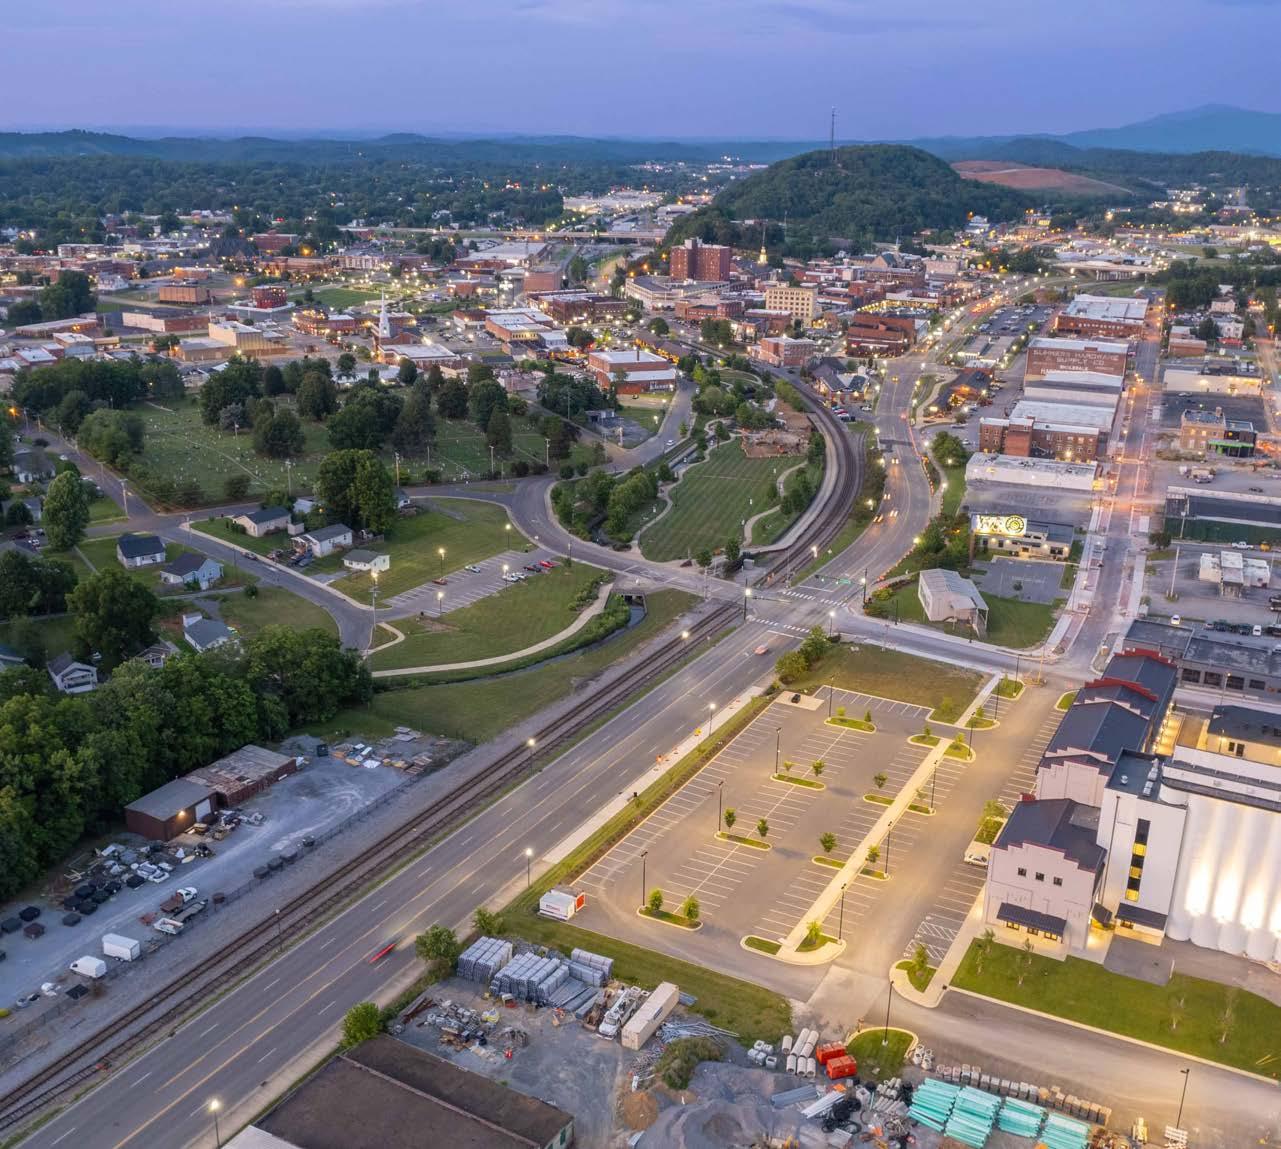
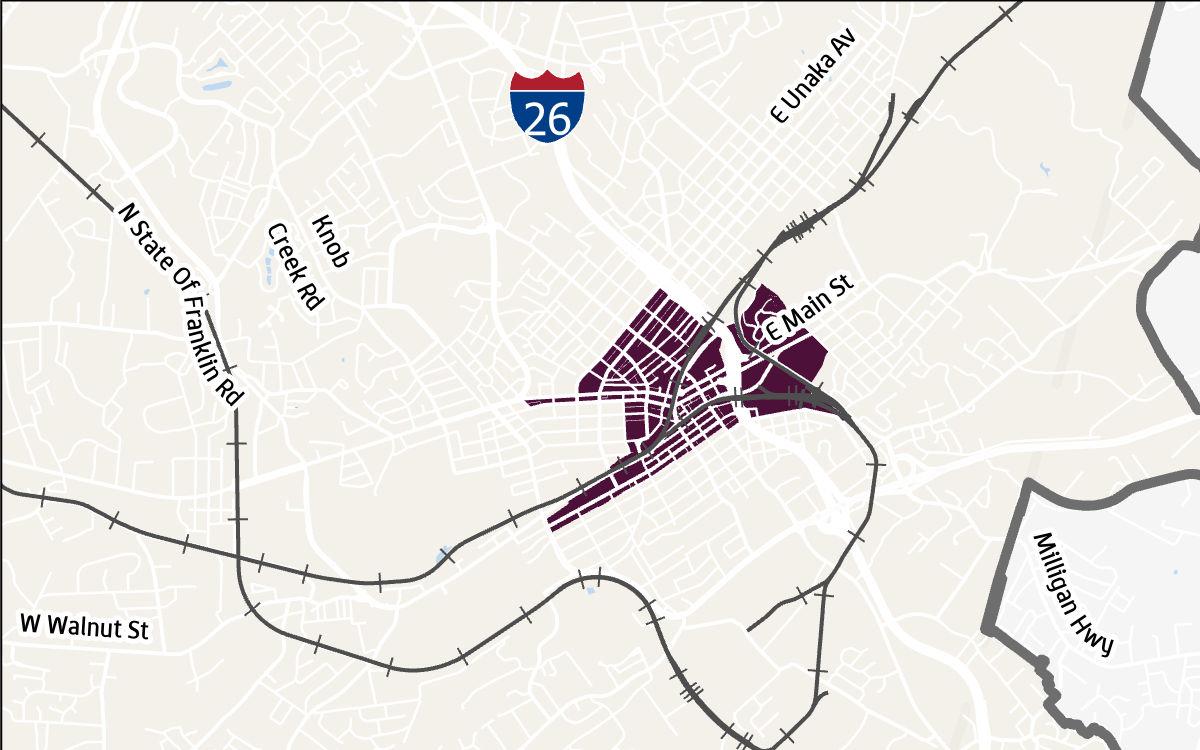
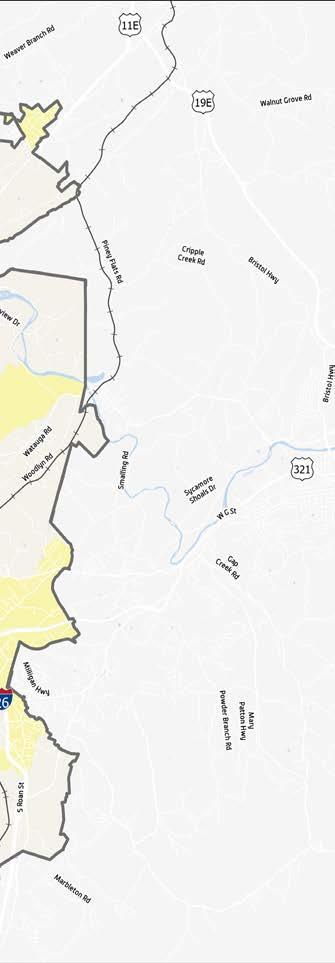
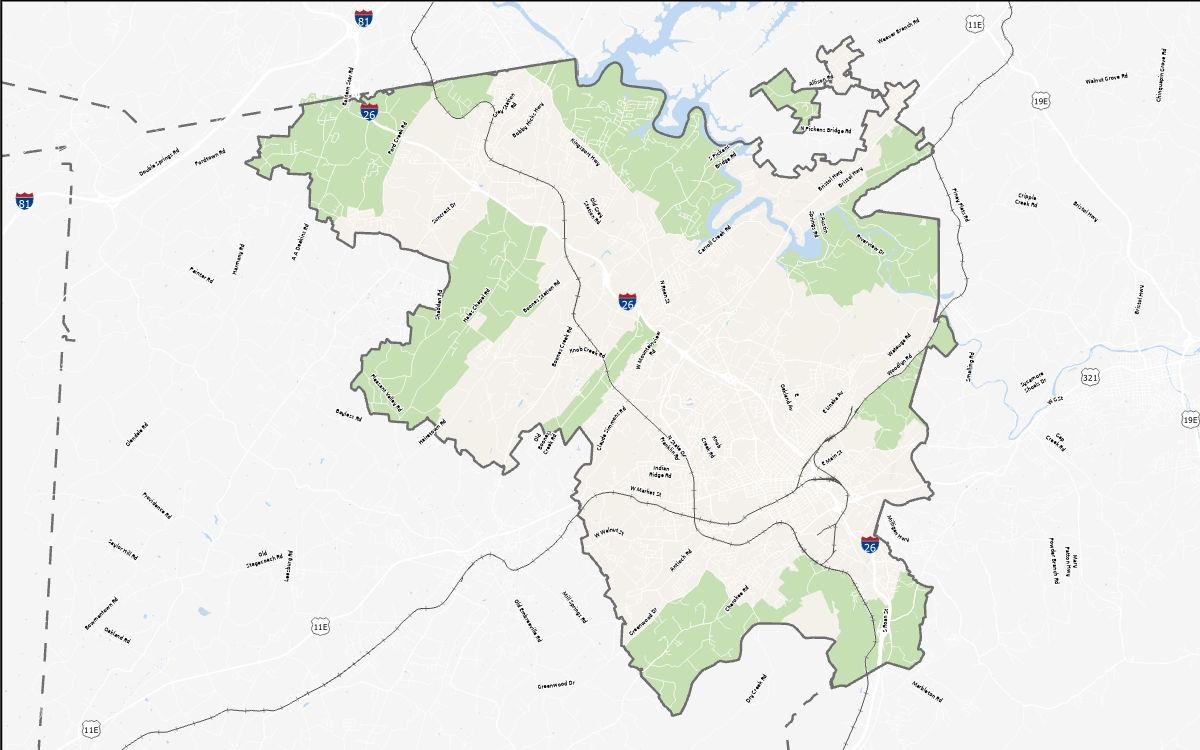
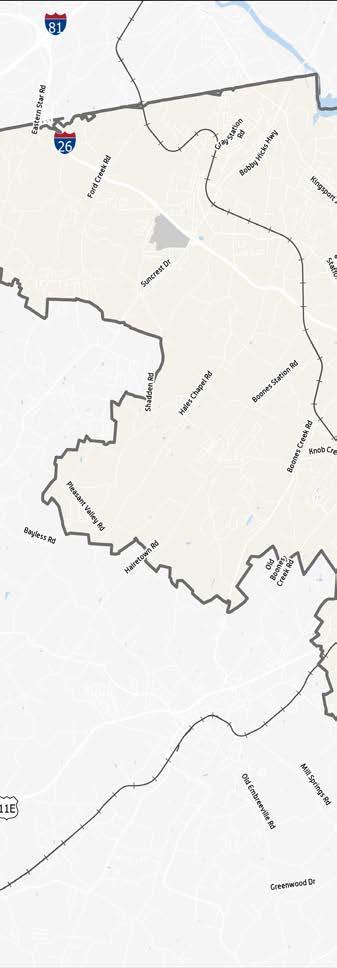
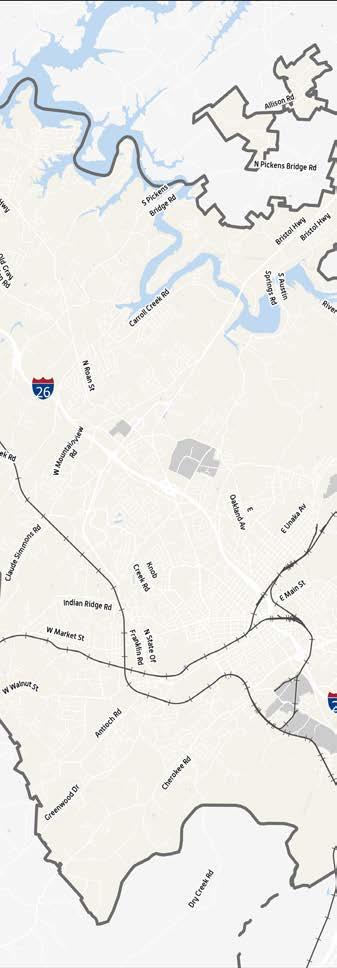
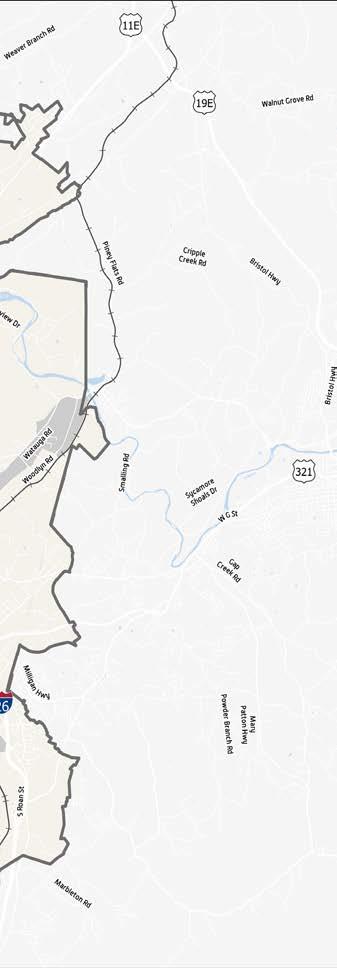
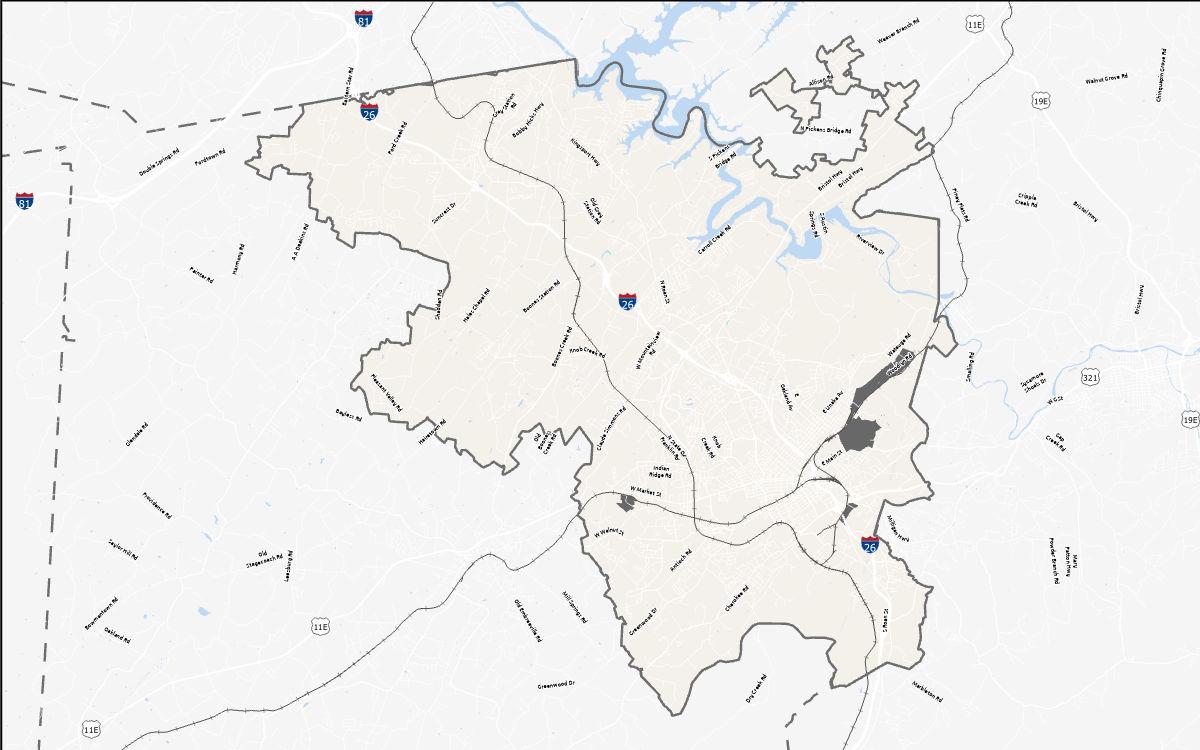
Johnson City is located in Northeast Tennessee and is part of the Johnson City Metropolitan Statistical Area (MSA) and the Tri-Cities region. The Johnson City MSA includes three counties: Washington, Carter, and Unicoi. Johnson City is primarily located in Washington County but is also partially within Carter and Sullivan Counties. The Tri-Cities region is a nine-county area that includes the Johnson City MSA and the Kingsport-Bristol MSA. The City was founded in 1856 as a railroad station called “Johnson’s Depot” and became a major throughway for visitors and rail commerce.
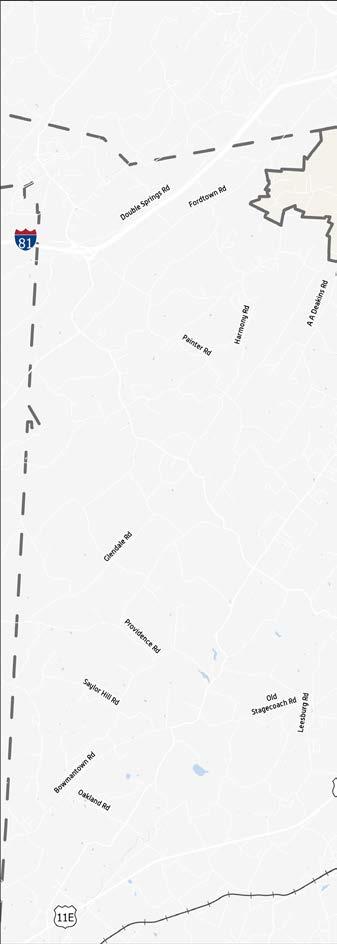
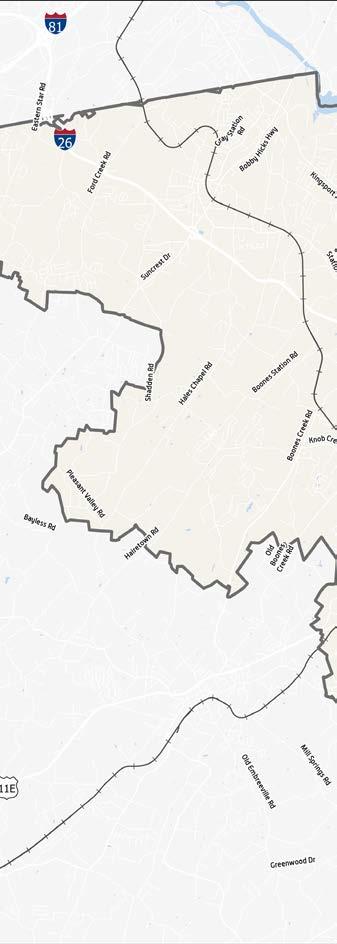
Horizon 2045 focuses not just within the Johnson City limits but beyond to incorporate an area called the urban growth boundary (UGB). UGBs were introduced by the state to help manage growth. Using the UGB as our Study Area allows the planning process to incorporate City services that extend beyond City limits, such as water and sewer and solid waste removal. This gives a more comprehensive picture of the areas that influence, and are influenced by, Johnson City.
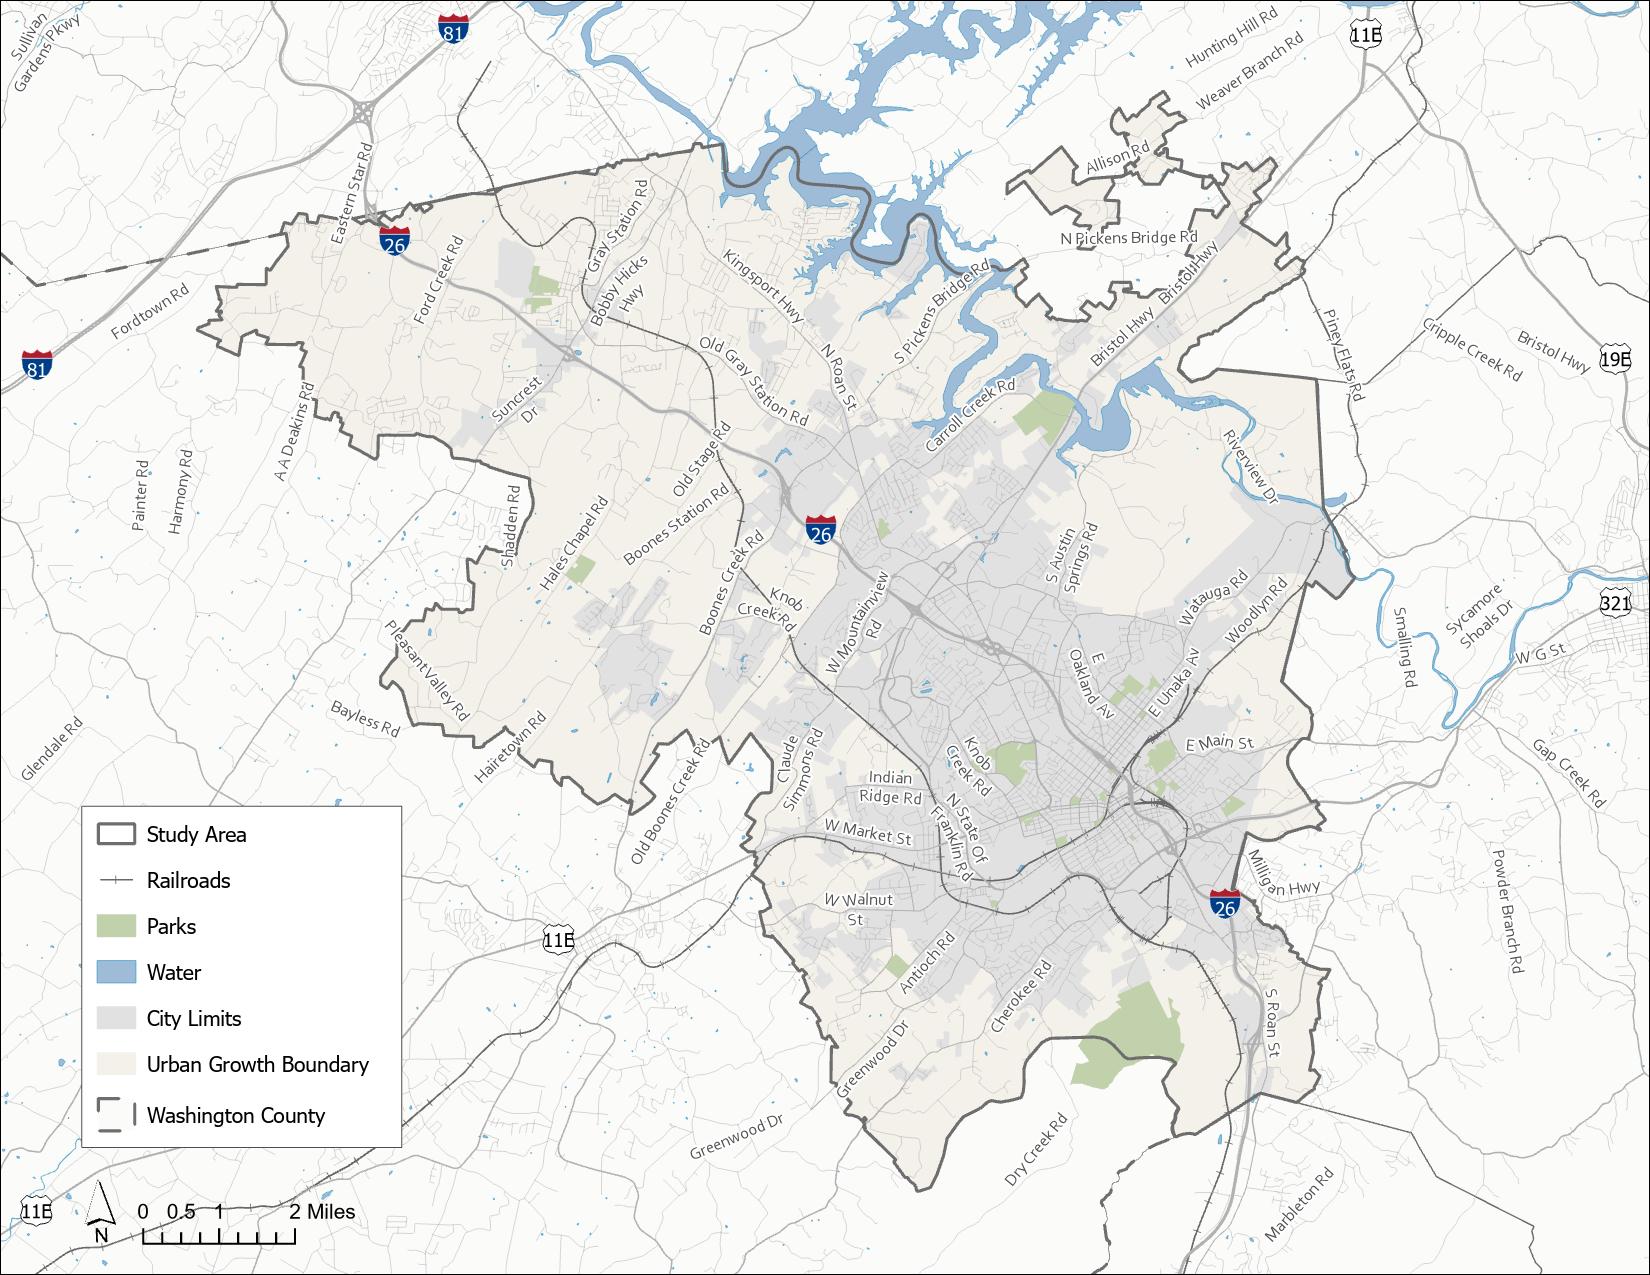
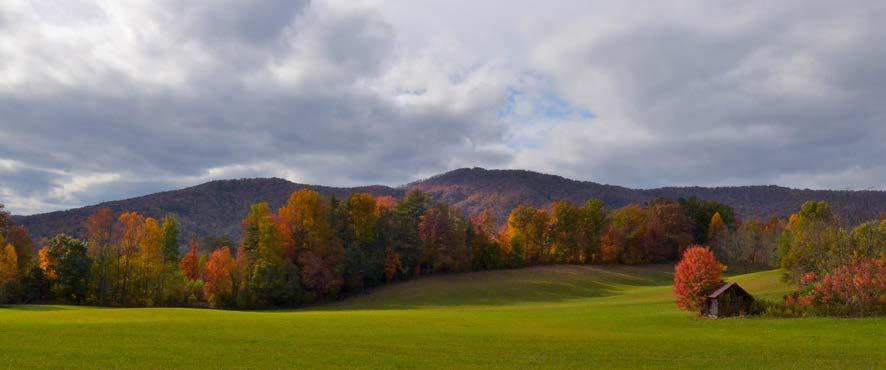
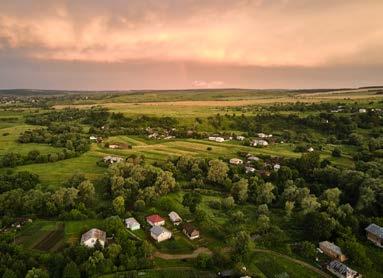
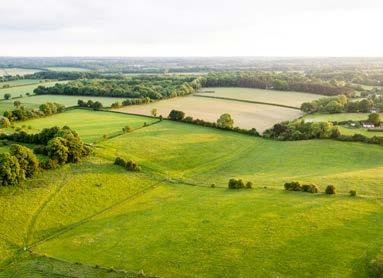
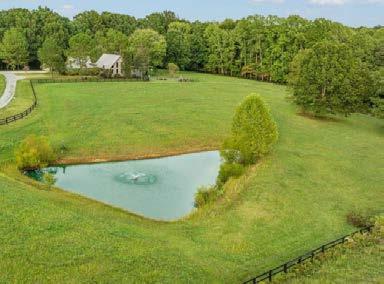
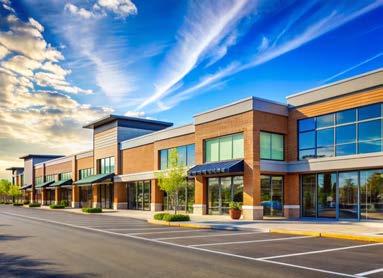
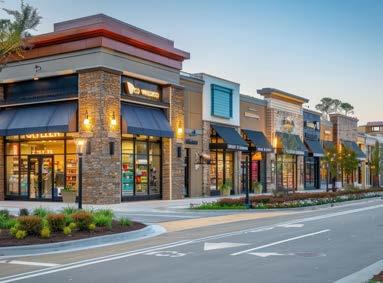
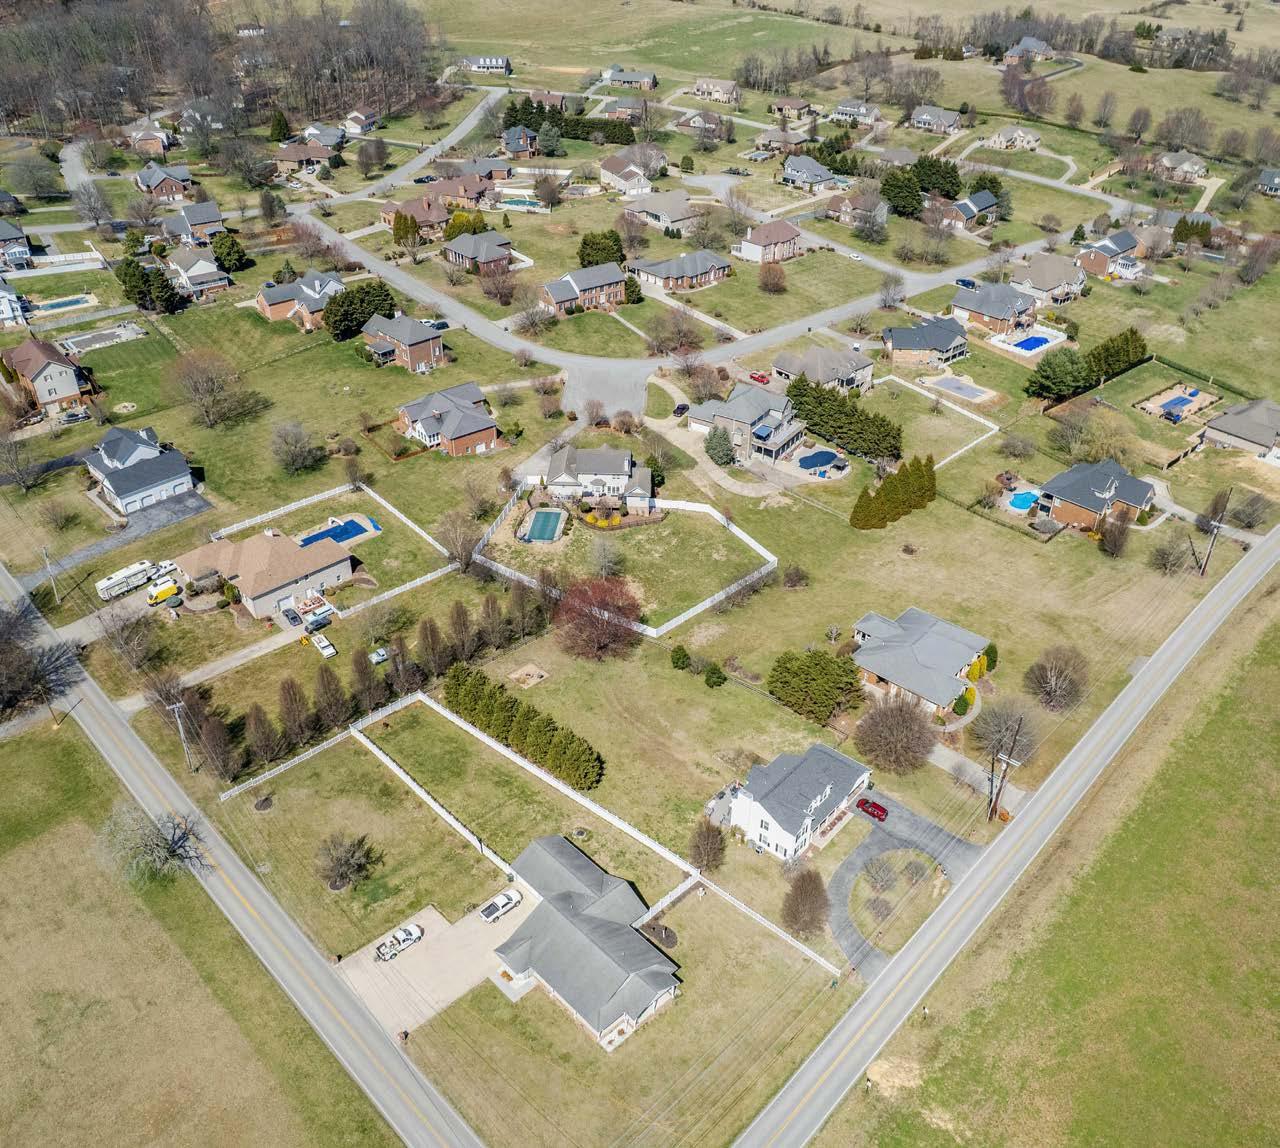
Johnson City, situated in a semi-rural setting along the foothills of the Appalachian Mountains, seamlessly blends rolling farmlands with regional employment and retail centers. As part of the larger Tri-Cities region (2020 population of 207,285), Johnson City has unique opportunities for a City its size.
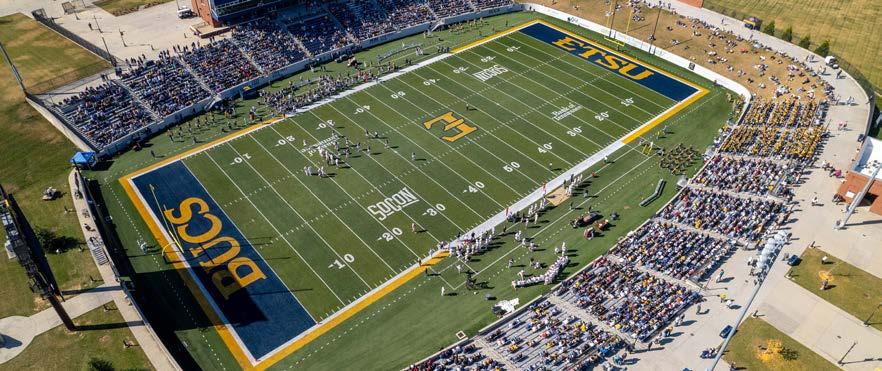
Major institutions serve as medical and educational resources and contribute to Johnson City’s high quality of life, including East Tennessee State University (ETSU), Johnson City Medical Center Hospital, and the James H. Quillen Veterans Administration Hospital.
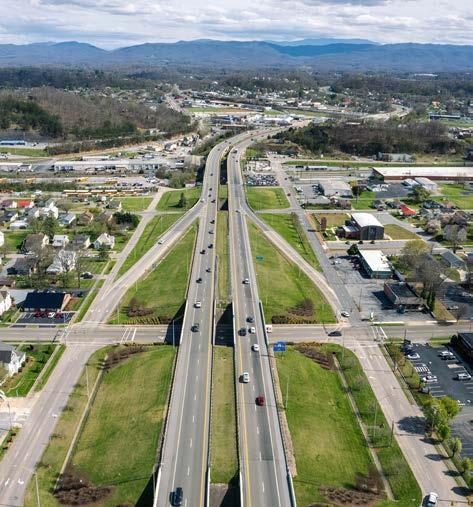
The City is strategically located near the intersection of I-81 and I-26 and is in proximity to larger municipal areas, including:
• Asheville, NC, 65 miles to the south
• Knoxville, TN, 100 miles to the west
• Roanoke, VA, 150 miles to the north
These interstate arteries give Johnson City access to transportation and technology corridors stretching from Alabama, through Tennessee, and to Virginia.
In addition to the major interstate corridors, Johnson City is serviced by the Tri-Cities Regional Airport, a full-service commercial airport serving Northeast Tennessee, Southwest Virginia, Western North Carolina, and Eastern Kentucky. In 2023, the airport reported a total passenger count of 448,514 and more than 49,700 aircraft operations. Designated as a Foreign Trade Zone (FTZ), the Tri-Cities Regional Airport enables area businesses and economic developers to engage in international trade, enhancing competitiveness in global markets.
This section analyzes existing demographic conditions in the Study Area, estimates future ones, and compares the Johnson City to the Study Area and the Johnson City MSA.
Population Trends
The Johnson City population has increased by 13.2% since 2010. Growth in the MSA has primarily been concentrated in Washington County, with Carter and Unicoi experiencing slight declines. This results in a comparably slower growth rate for the MSA.
Population Growth (2010-2023)
Total Population (2023)
72,918
JOHNSON CITY
100,865 STUDY AREA
209,536 MSA
Source: ESRI Business Analyst Online; Kimley-Horn
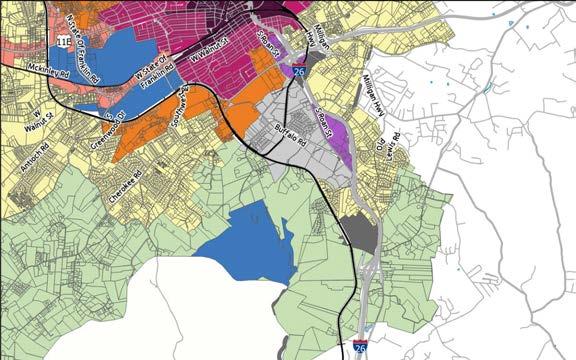
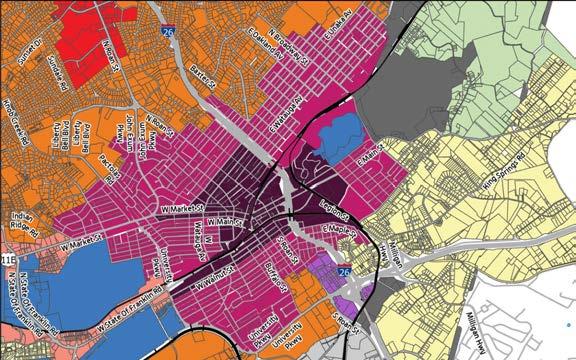
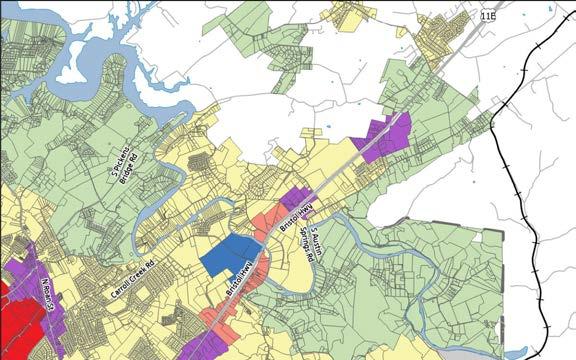
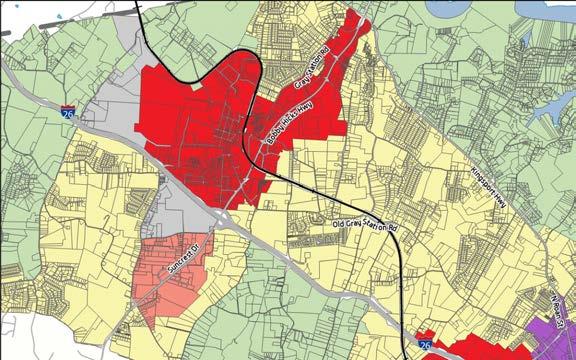
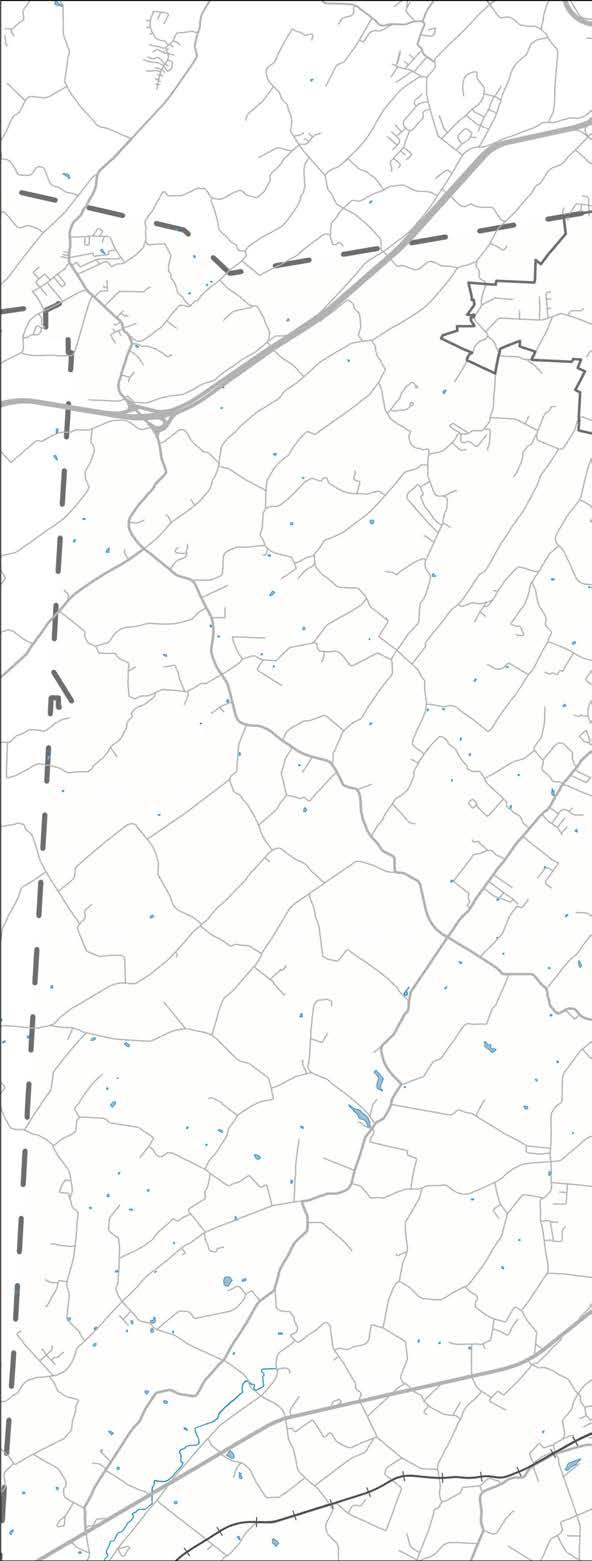
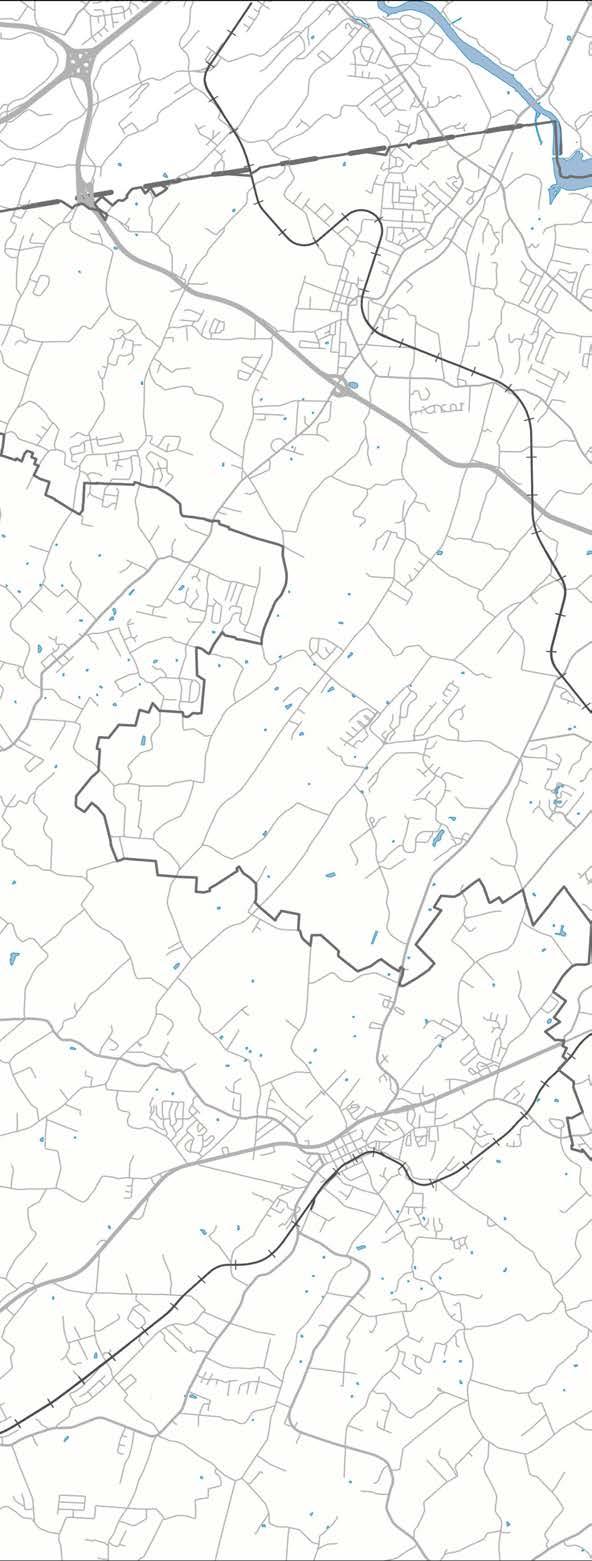
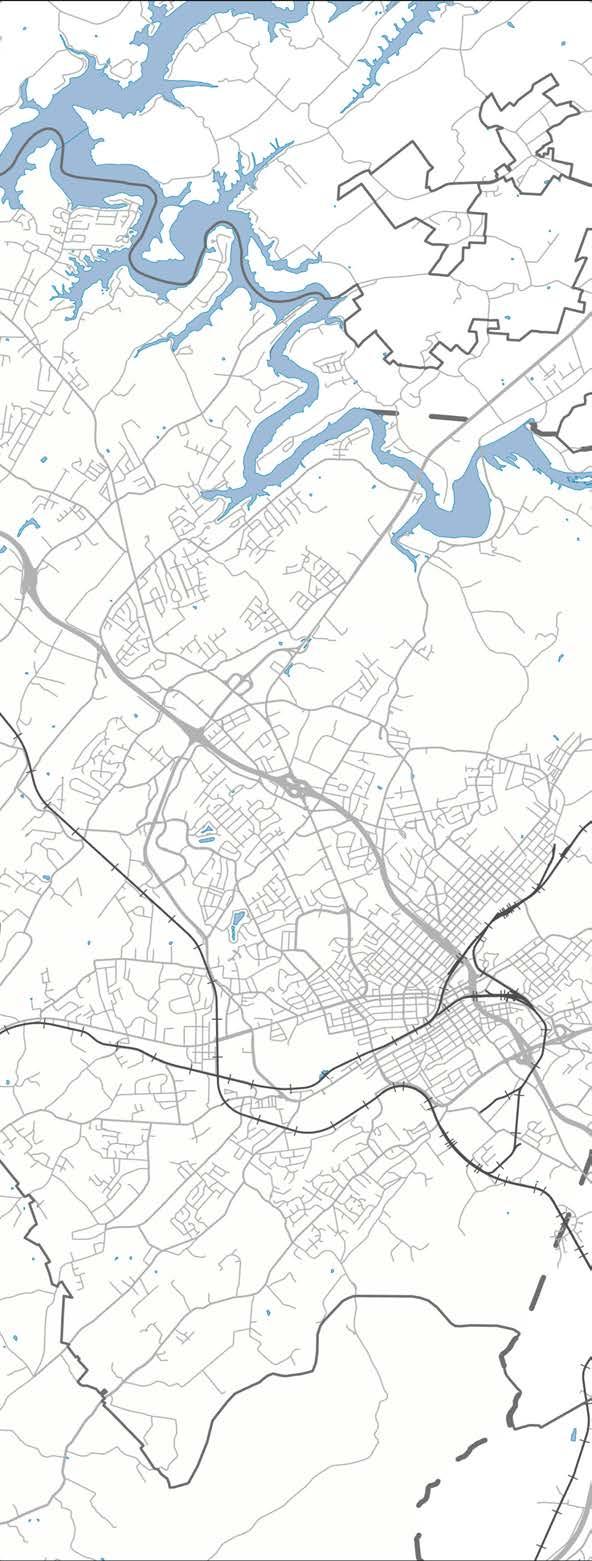
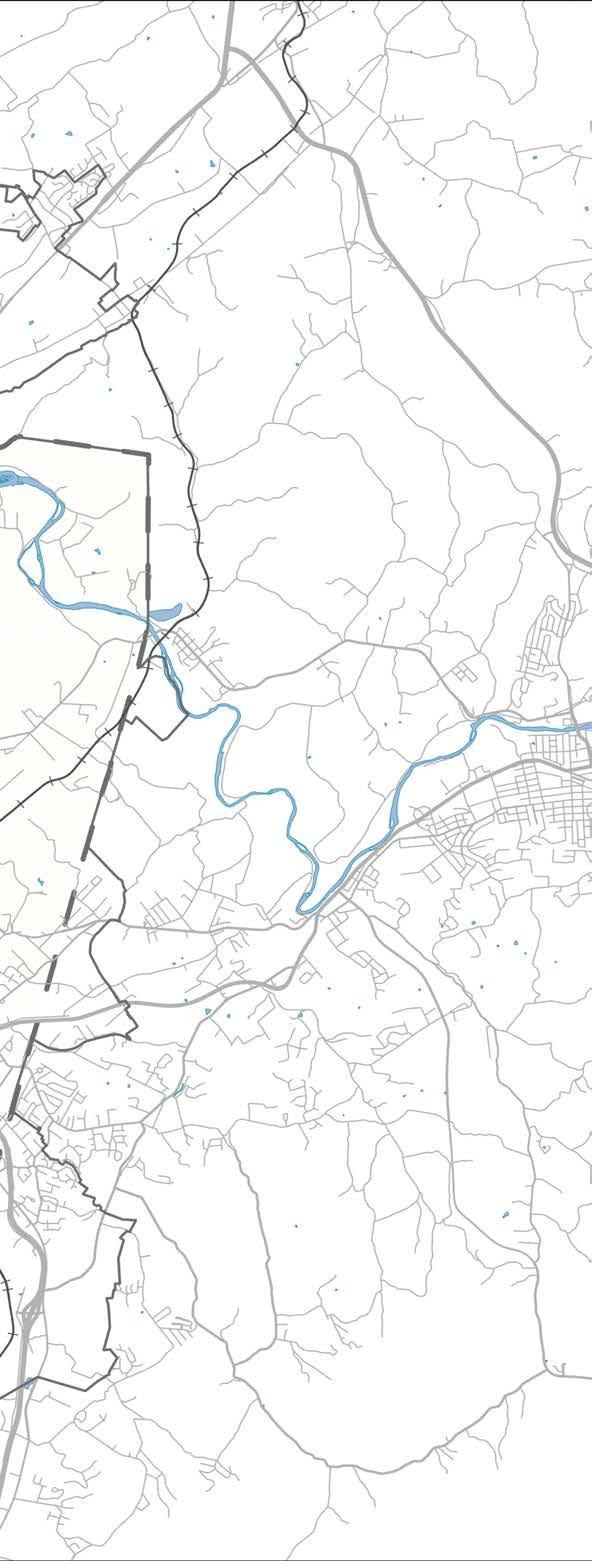
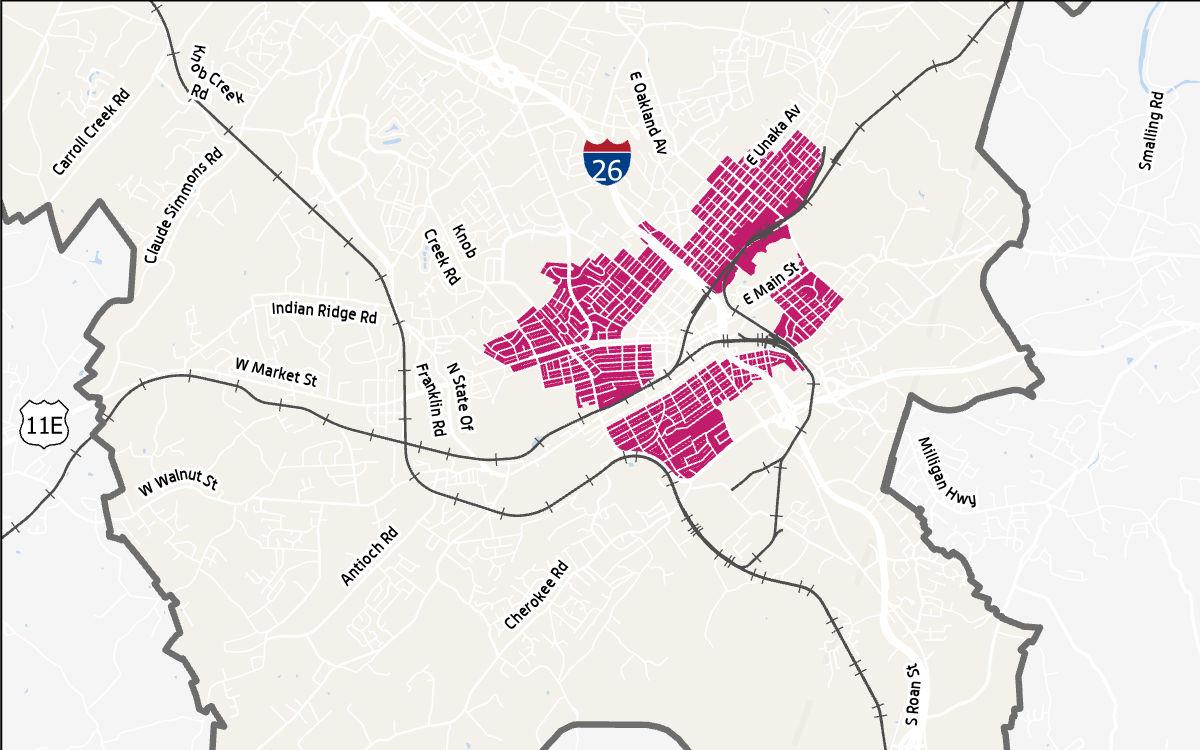
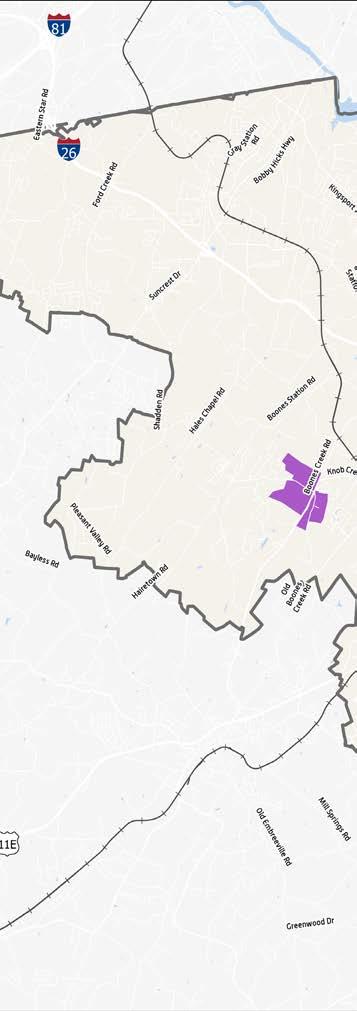
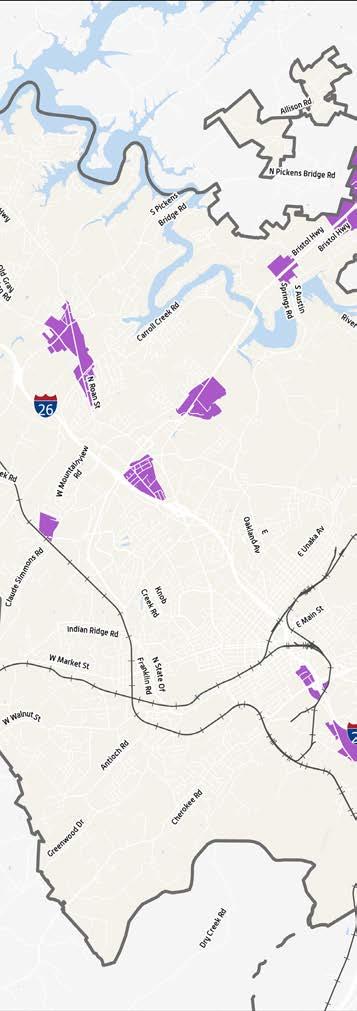
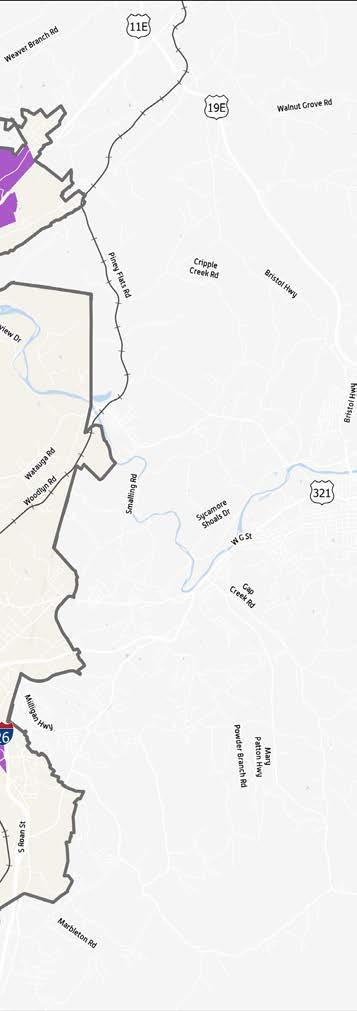
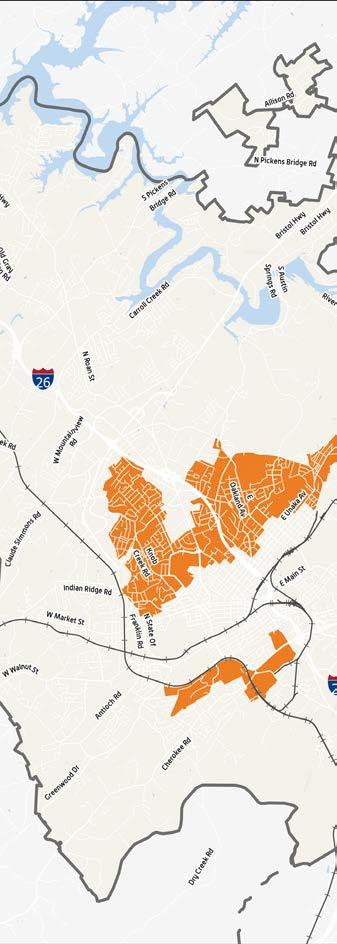
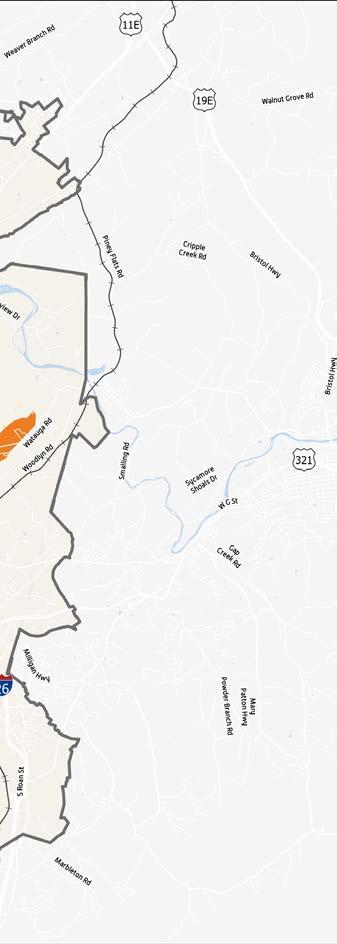
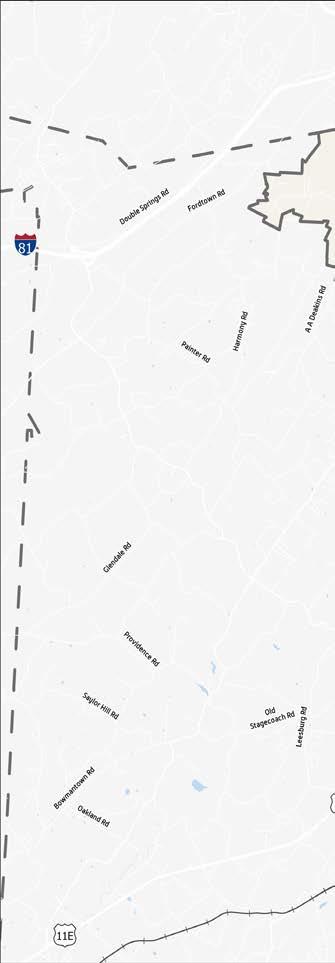
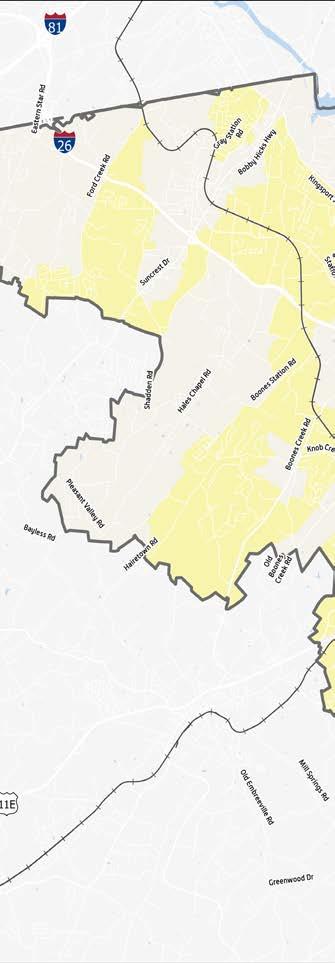
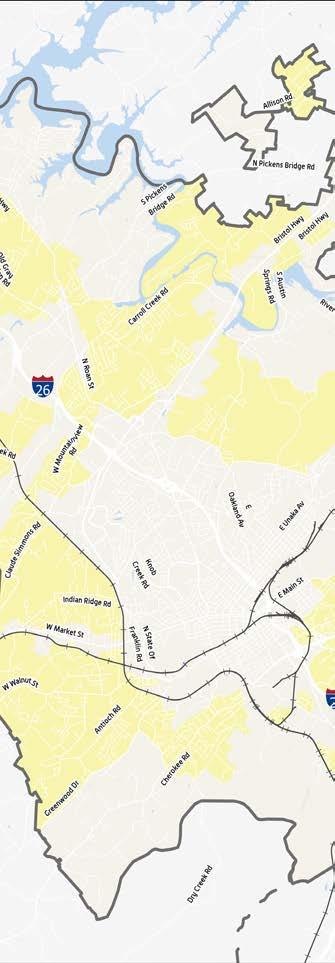
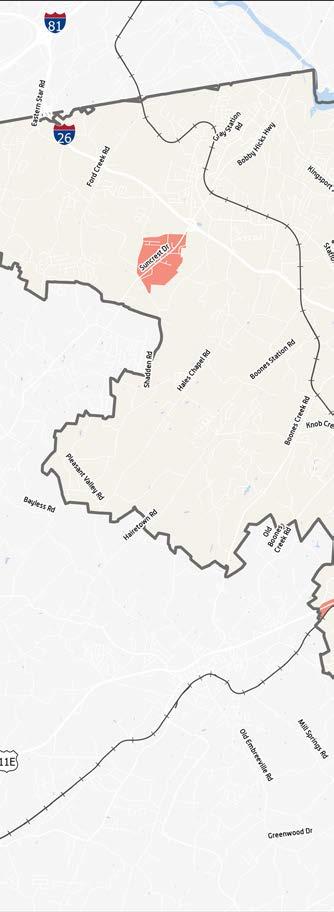
POPULATION GROWTH BY CENSUS TRACTS, 2010–2023
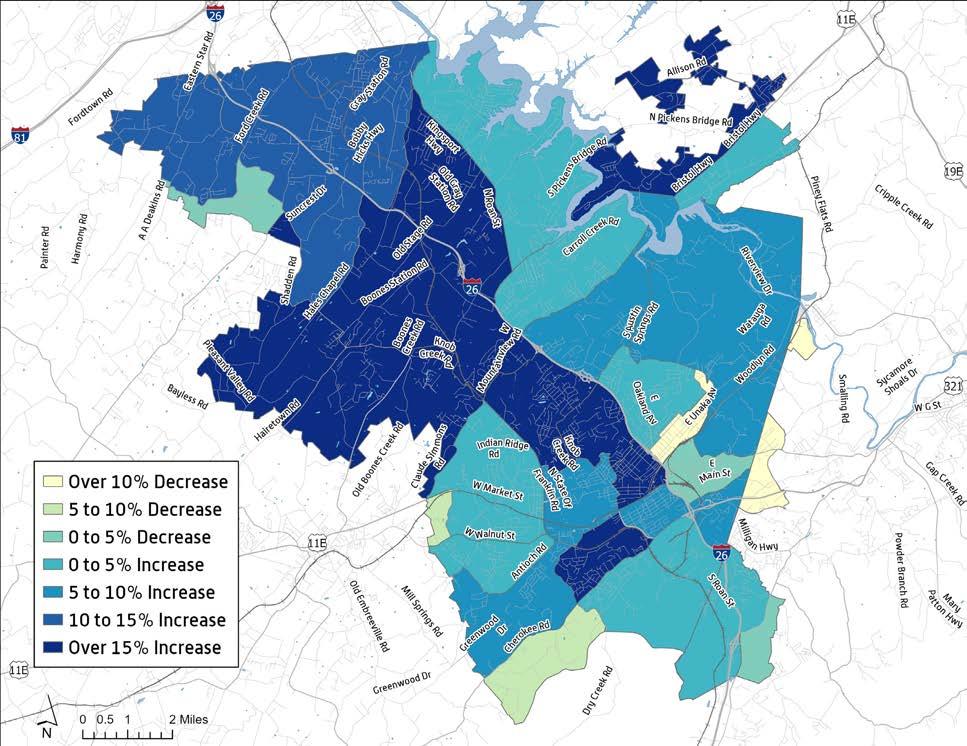
Source: ESRI Business Analyst Online; Kimley-Horn
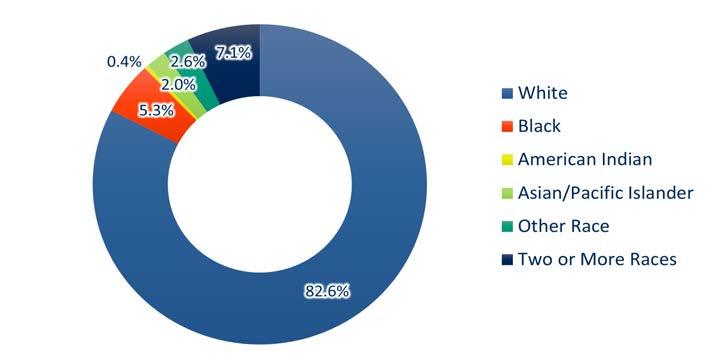
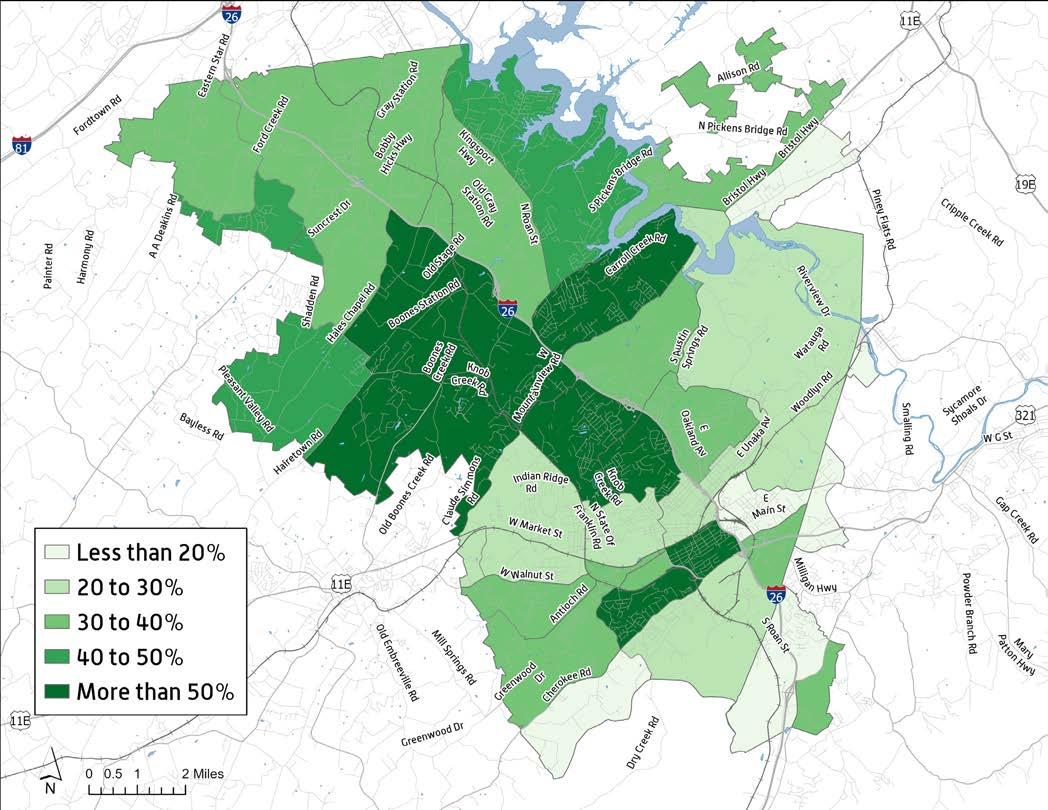
In the Study Area, more than 17% of residents belong to a minority racial population, compared to 12.5% of the MSA. The United States Census defines race separately from ethnicity. Race is a person’s self-identification with one or more social groups. Ethnicity determines whether a person is of Hispanic origin or not. Race and ethnicity are independent of each other. Both Hispanics and non-Hispanics may report as any race of combination of races. Approximately 6% of the Study Area population identifies as Hispanic.
6% OF POPULATION IDENTIFIES AS HISPANIC
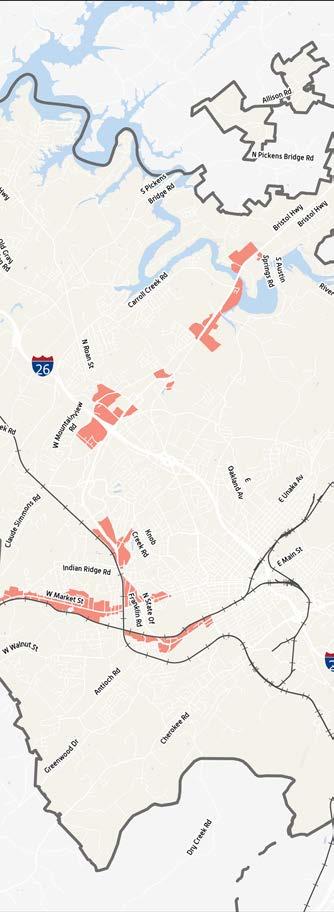
MINORITY POPULATION BY CENSUS TRACTS (2023)
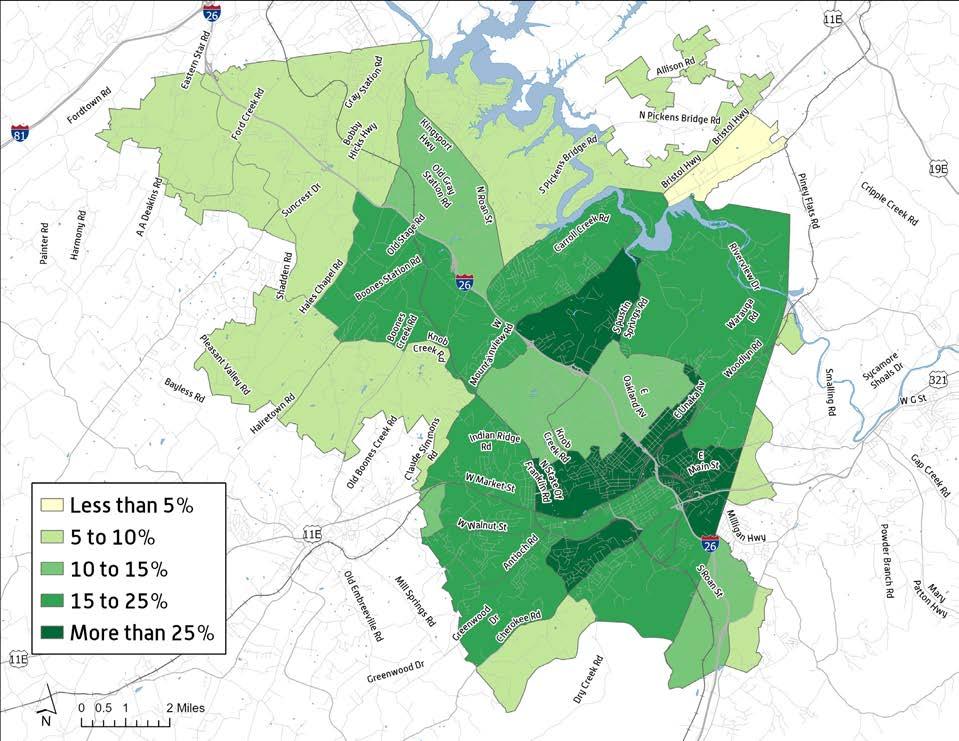
Johnson City is one of the fastest growing municipalities in the region. The Study Area accounts for more than 48% of the population in the MSA and more than 74% of the population in Washington County. During the next 20 years, the Study Area is moderately projected to add roughly 13,600 residents. In the higher growth projection, more than 24,100 new residents are estimated.
The Study Area accounts for more than 74% of the Total Population in Washington County.
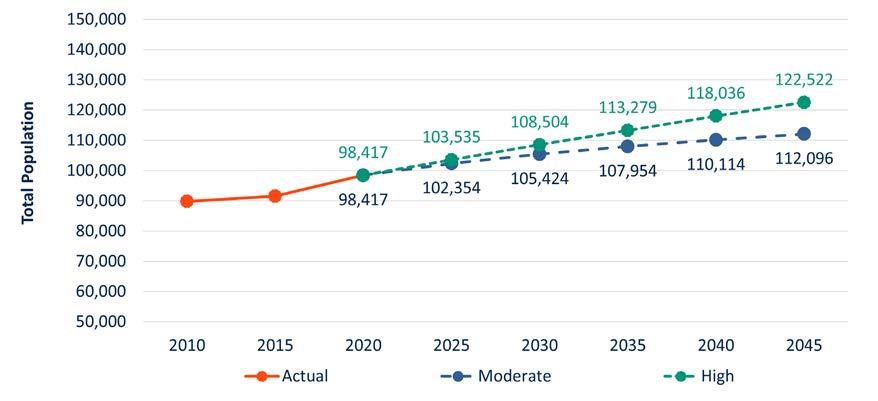
Source: Woods and Poole, OSBM, US Census, Kimley-Horn
The median age in the Study Area is 40.4 years, compared to 43.3 in the Johnson City MSA. The Study Area’s older population is growing faster than other age cohorts. Approximately 32.9% of Study Area residents are 55 years or older. Many seniors desire alternate housing options, such as more affordable single-family homes or retirement communities. The largest age cohort group in the Study Area is residents under the age of 25, representing almost 30% of the population. The needs of a young population include:
• Access to world-class education facilities
• Employment prospects
Population by Age Group, 2010-2023
• Housing options
• Spaces for recreation, socializing, and entertainment
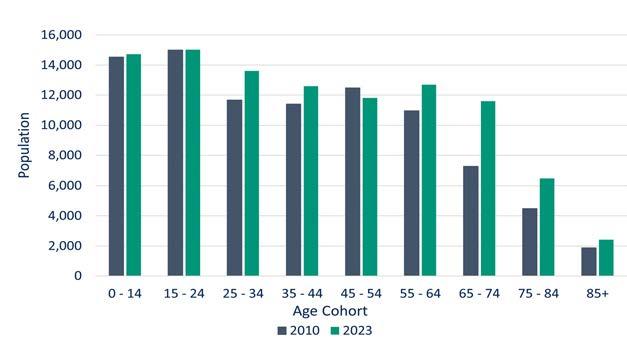
Source: ESRI Business Analyst Online; Kimley-Horn
Nearly half (46.8%) of the Study Area population has an associate degree or higher. A variety of job types in Johnson City are needed to support the range of education levels and skill sets held by the local population.
Population by Educational Attainment (2023)
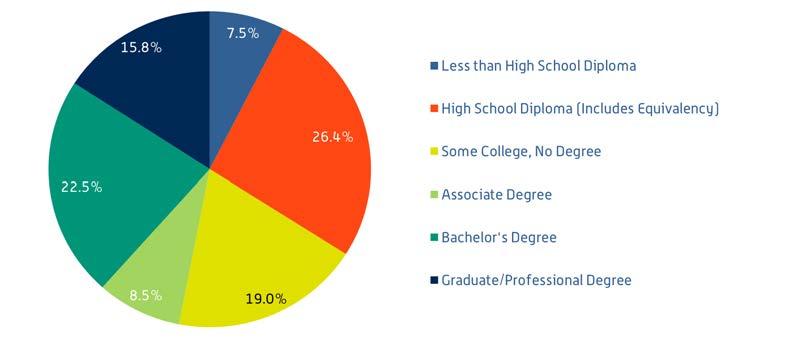
Source: ESRI Business Analyst Online
Source: ESRI Business Analyst Online; Kimley-Horn
Understanding how land currently is used helps us evaluate how these uses support the City’s goals as well as identify gaps and trends that can be addressed through a revised land use vision and supportive policies.
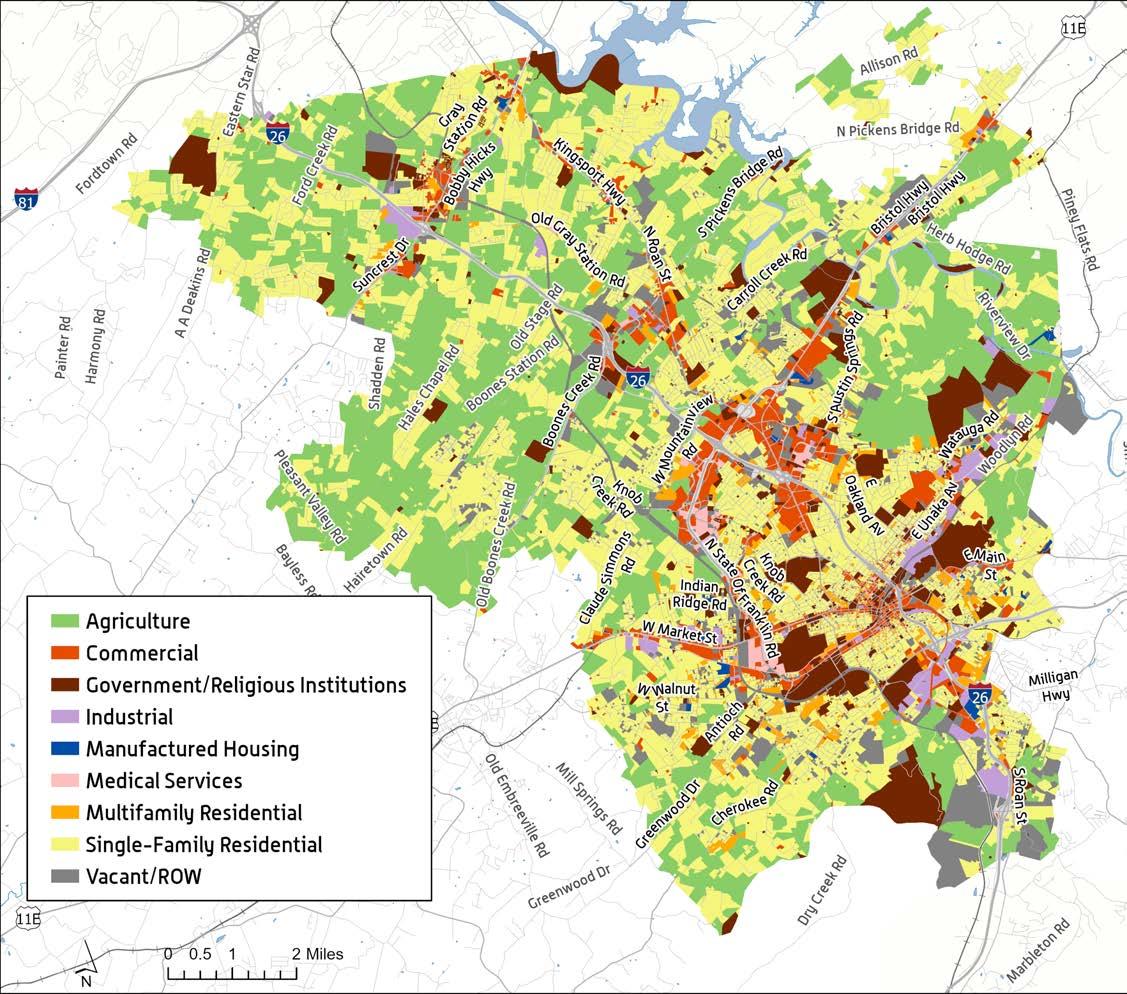
Source: City of Johnson City; Washington County; Kimley-Horn
Existing land use categories are based on surveys conducted for property valuation.
24.7% | 30,076 acres
Includes all areas used for agricultural purposes, including working farms, grazing land, and forestry.
2.6% | 3,185 acres
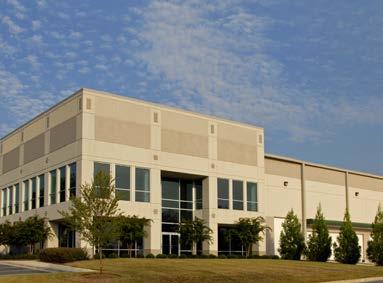
Land designated for retail or wholesale uses, personal services, hotels, restaurants, offices, and other uses.
RELIGIOUS INSTITUTIONS
8.4% | 10,204 acres
Includes government buildings, parks, utilities, schools (public/ private), places of worship, and cemeteries. State-owned properties are also included.
1.0% | 1,163 acres
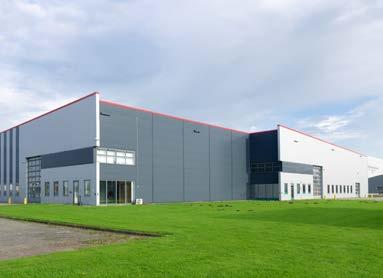
Land used for manufacturing, warehousing, or transportation and logistics.
0.2% | 246 acres
Areas occupied by mobile homes, modular homes, or other types of manufactured housing.
MEDICAL SERVICES
0.3% | 358 acres
Includes areas owned and operated by hospitals, doctor’s offices, nursing facilities, and clinics.
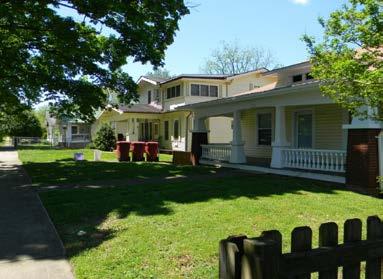
RESIDENTIAL
1.5% | 1,858 acres
Includes apartments, condominiums, townhomes, and duplexes but does not include manufactured housing.
RESIDENTIAL
56.6% | 68,995 acres
Land occupied by singleresidence homes, one per lot.
4.9% | 5,921 acres
Vacant areas with minimal development, and the rightof-way for roads, railroads, utility easements, and other land occupied by public/private utilities.
The recommendations and strategies identified in previous planning efforts are the initial building blocks used to create a holistic land use strategy for Johnson City. The following section provides an overview of the relevant previous planning documents. Other important plan documents are highlighted in the Policy Framework chapters.
Adopted by the Board of Commissions and the Regional Planning Commission in 2000, the Comprehensive Plan contains a vision, goals, and policies for the City. The Comprehensive Plan provides guidance on land use, transportation, housing, economic development, education, parks and recreation, and utilities through a forecast year of 2020.
• Focus on creating a strong and diversified economy
• Maintain a first-class education system through maintenance of schools and redistricting to prevent overcrowding
• Implement a varied regional transportation system
• Revitalize historic Downtown
• Create safe and people-oriented neighborhoods
• Protect the natural and built environment
• Acquire land to develop parks and recreation facilities
• Support the development of a variety of housing types
• Provide high-quality public services with fiscal and technological efficiency
• Develop a regional transportation system focused on efficiency, accessibility, and connectivity
The Bridge Plan is a review, assessment, and re-adoption of the 2020 City of Johnson City Comprehensive Plan. Led by the Regional Planning Commission, the Bridge Plan creates a five-year extension of the Comprehensive Plan and focuses specifically on the Recommendations section of the original 2020 Comprehensive Plan. Some key modifications to the Recommendations are included below.
• Urban Growth and Services Element: Introduce “Urban Neighborhood” zoning to promote infill
• Transportation Element: Provide greater accommodations for multimodal transportation
• Economic Development Element: Direct resources to support local businesses and support tourism
• Housing Element: Clarify housing types in zoning that cause confusion
• Community Facilities Element: Increase coordination between City and JC Public Schools
• Downtown Revitalization Element: Improve pedestrian access to parking structures
• Historic Preservation Element: Encourage public awareness of preservation through social media and events
City staff, in partnership with the City Commission, developed the Strategic Plan in 2020. The Strategic Plan relies on input from citizens, businesses, and strategic partners to determine what is most important to the community’s future. Four focus areas were considered, including economic vitality, quality of place, futureready infrastructure, and excellence in government.
• Support existing businesses and increase talent retention efforts
• Recruit and attract new businesses with focus on remote workers
• Cultivate a local entrepreneurial ecosystem and prepare our workforce for 21st Century jobs
• Encourage economic development in traditionally underserved areas
• Maintain a resilient economy during challenging times
• Support local businesses through local policies, procedures, and ordinances
• Market the area to outside interests by working with regional partners
• Focus strategies on sectors and populations hardest hit by economic downturns
The engagement process in Johnson City positioned the community as an active partner in the planning process. Horizon 2045 combines community input and technical data to represent the City’s needs and the values and aspirations of its residents. Engagement for the Horizon 2045 Growth Management Plan included activities that invited input from the community, stakeholders, and committee members. Each phase of the plan — Envision, Plan, and Finalize — was supported by engagement activities designed to involve the community and gather meaningful input. These efforts ensured that public feedback helped shape the direction of the plan every step of the way.
Engagement Focus
Build awareness of the process
Educate on the plan’s purpose
Collect input on vision, needs, and goals
Confirm what we learned
Collect input on the land use strategy and supportive policies
Present key elements of the comprehensive plan
Collect final input before adoption
Engagement Activities
Advisory Committee Meetings (2)
Stakeholder Meetings
Community Workshop
City Commission and Planning Commission Work Session
Digital Engagement
Community Workshop
Pop-Up Events
Digital Engagement
Advisory Committee Meetings (2)
Planning Commission Work Sessions (3)
City Commission and Planning Commission Work Session
Community Workshop
Digital Engagement
Planning Commission Work Session
City Commission and Planning Commission Work Session
Planning Commission Adoption and Certification
City Commission Adoption
BY THE NUMBERS
Workshops, and Surveys
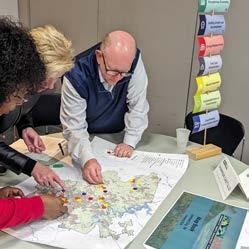
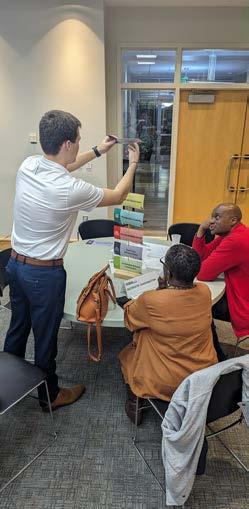
During this phase, the project team engaged the community through multiple avenues, including two Advisory Committee meetings, a joint work session with the Planning and City Commission, stakeholder meetings, a public workshop, an online survey, and interactive digital tools. These efforts provided a platform for residents to share their perspectives on what they love about Johnson City, areas needing improvement, and their vision for the City’s future growth. This list shows all of Phase 1 engagement activities:
• Advisory Committee Meeting #1 – October 3, 2023
• Project Website Launch – November 1, 2023
• Online Survey – September to December 2023
• Stakeholder Meetings, Round 1 – October 3, November 9 and 10, 2023
• City Commission Update – November 2, 2023
• Vision for the Future Public Workshop – November 9, 2023
• Joint Workshop Session #1 – January 18, 2024
• Advisory Committee Meeting #2 – January 25, 2024
STAKEHOLDER GROUPS AND TOPICS
- Water/Sewer
- Parks and Recreation
- Education
- Downtown
- Public Works
- Transportation
- Housing/Homelessness
- Economic Development
- Public Safety
- Business Leaders
- Development Community
- Sustainability and Environmental Stewardship
- Washington and Sullivan Counties
The first phase of engagement for Horizon 2045 invited Johnson City residents to share their vision for the City’s future, helping to establish priorities that guided the Growth Management Plan. Through a combination of digital engagement and an interactive public workshop, community members provided valuable input on what makes Johnson City special, areas in need of improvement, and the opportunities that lie ahead. Conversations centered on balancing growth with maintaining Johnson City’s unique identity, ensuring that future development supports economic opportunity and quality of life.
An interactive website was available to the community throughout the Horizon 2045 process. The website served as a digital engagement hub where participants could find information as well as provide feedback at key milestones. During the first phase of engagement, participants engaged with an interactive map and took an online survey.
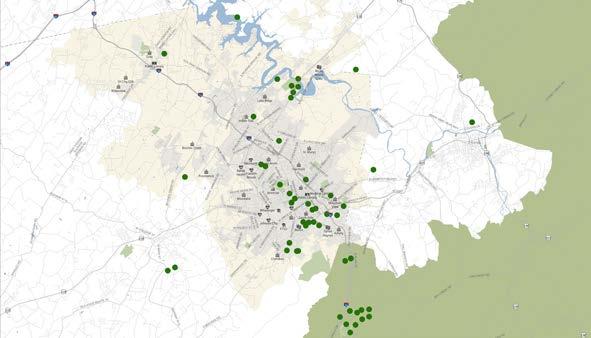
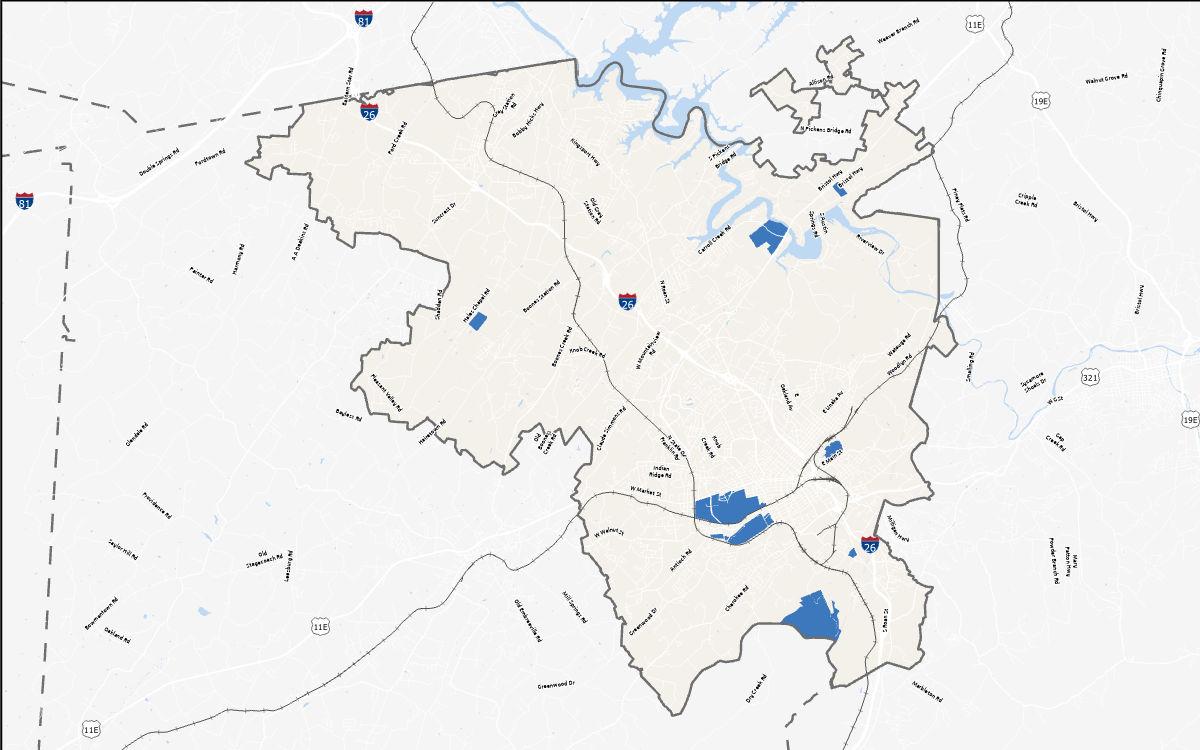
INTERACTIVE ONLINE MAP | Visitors to the project website dropped pins on an interactive map to identify places in the Study Area they felt need no changes, need small changes, or need lots of changes.
No Changes Needed
Founders Park, Downtown Library, Tannery Knobs, Tweetsie Trail
Small Changes Needed
State of Franklin/University Parkway intersection, Winged Deer Park, King Springs Road and Milligan Highway intersection (convert to roundabout)
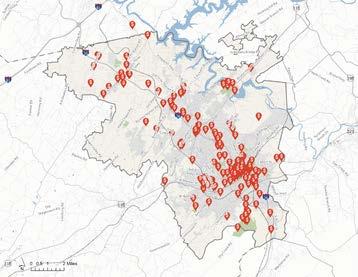
Lots of Changes Needed
Vacant lot at E State of Franklin and Legion Street, Buffalo Mountain upgrades, one-way tunnel on Knob Creek Road
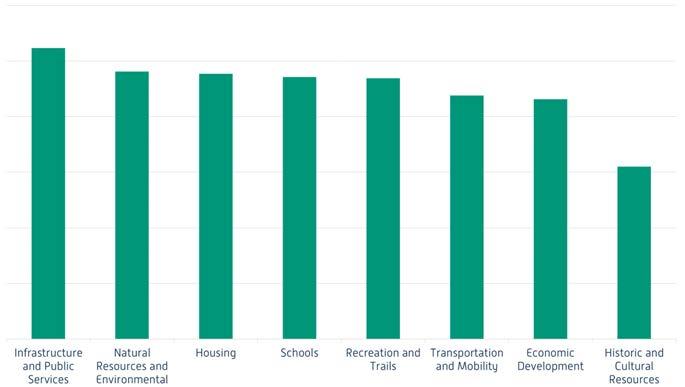
ONLINE SURVEY | An online survey allowed participants to share what they love about Johnson City and respond to a variety of themes that helped shape the Growth Management Plan.
Survey respondents love Johnson City’s friendly, community-oriented atmosphere and small-town feel. They value the Downtown and parks as well as the mountains and natural scenery that surround the City.
The top-ranking choice was Infrastructure and Public Works, followed by Natural Resources and Environment and Housing. The lowest-ranking choices were Historic and Cultural Resources and Economic Development.
309
PARTICIPANTS
6,941 DATA POINTS 408 COMMENTS More
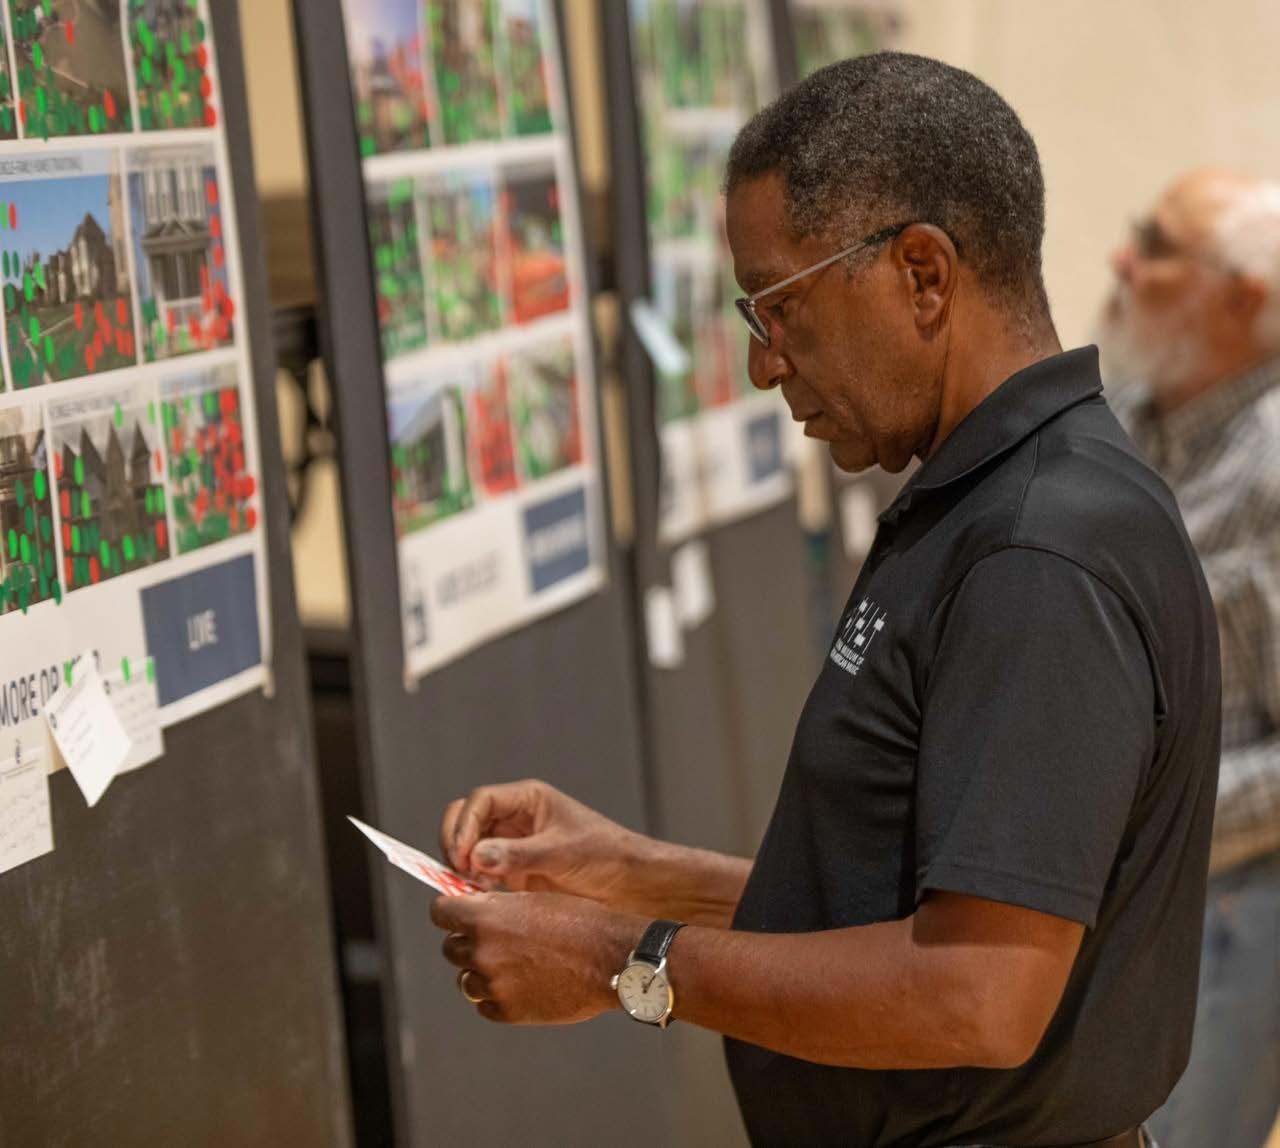
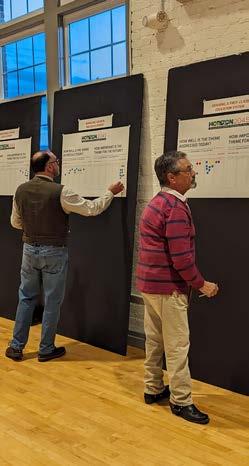
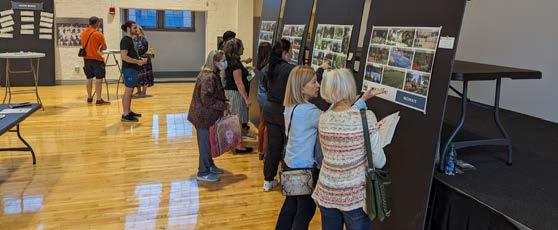
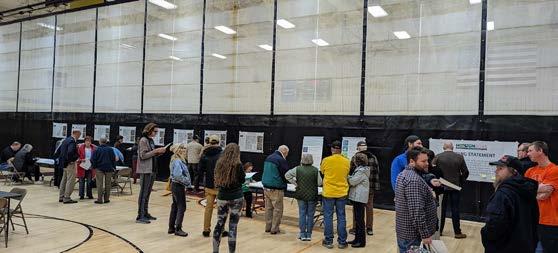
At the first public workshop, participants could view a series of boards and maps that described the planning process, purpose of the plan, and key takeaways from the initial review of community characteristics data.
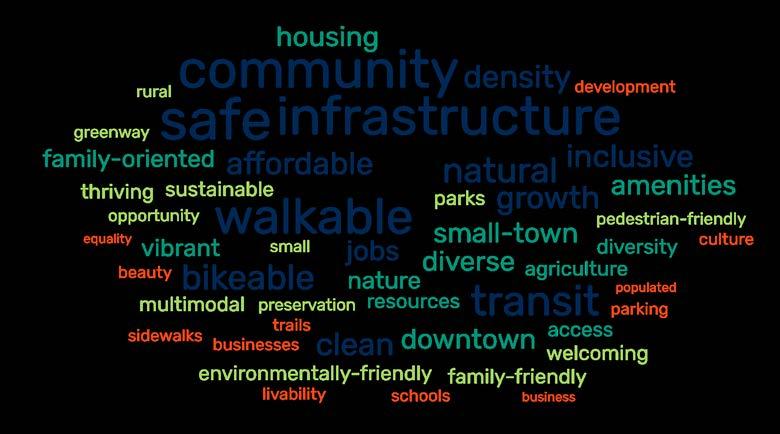
VISION BOARD | Themes from the prompt: “In 2045, I envision Johnson City to be...”
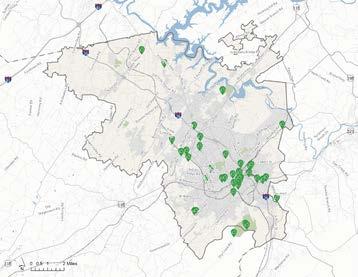
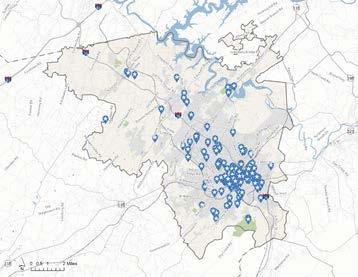
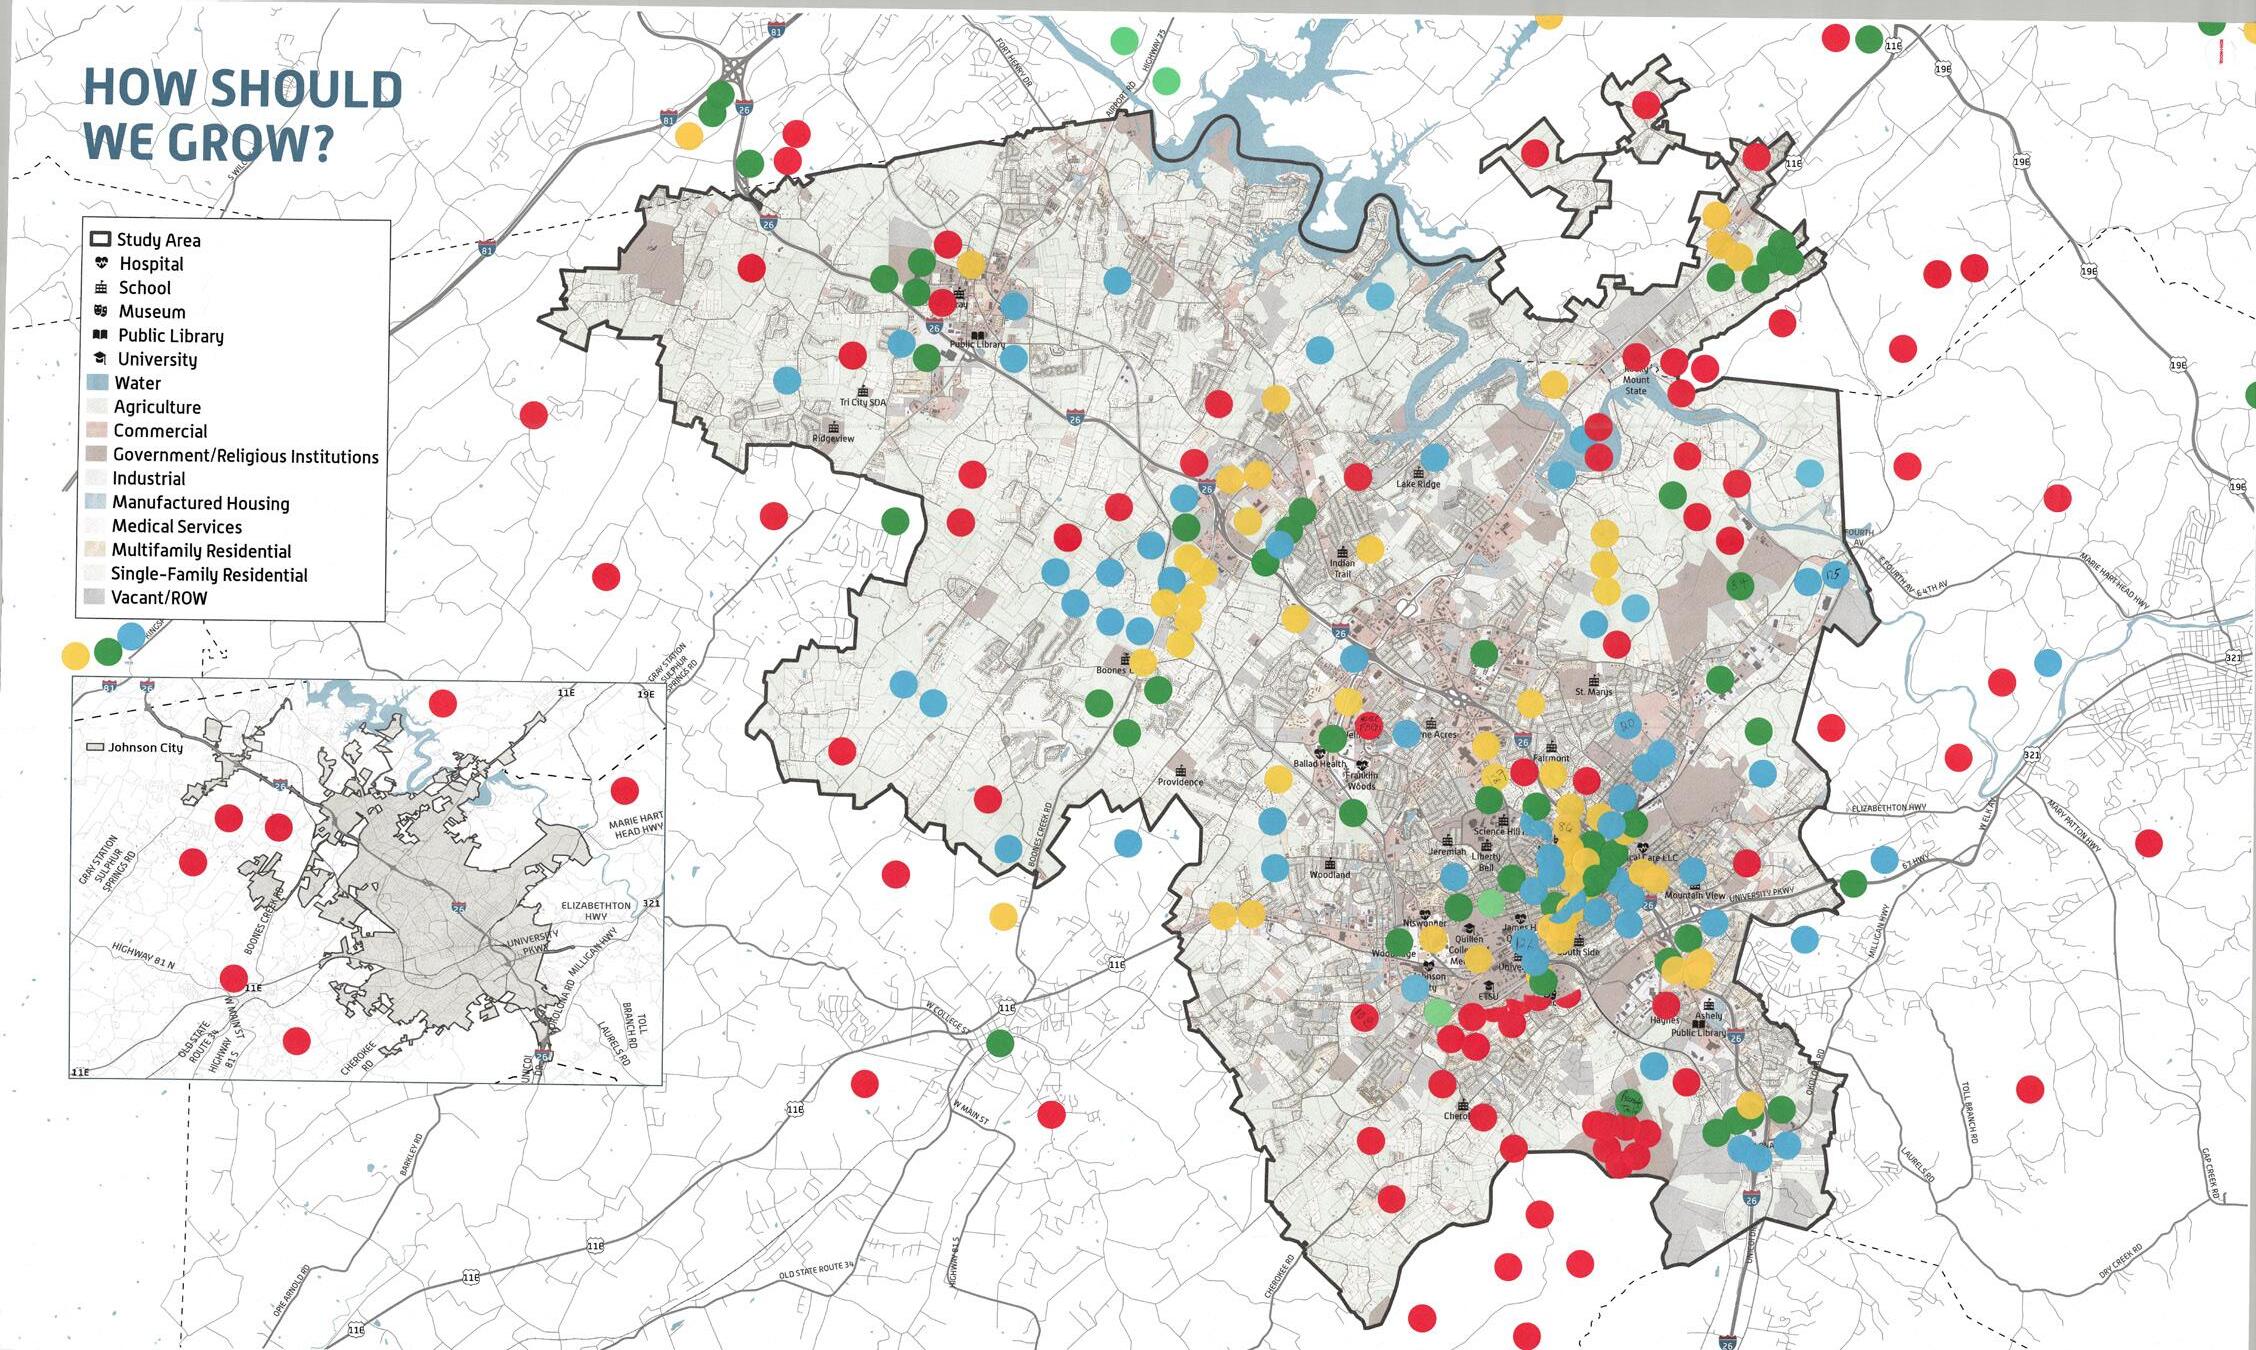
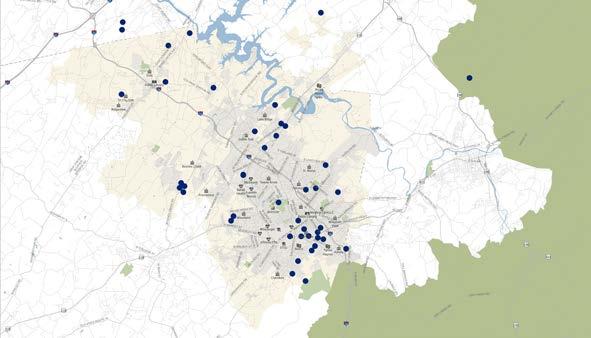
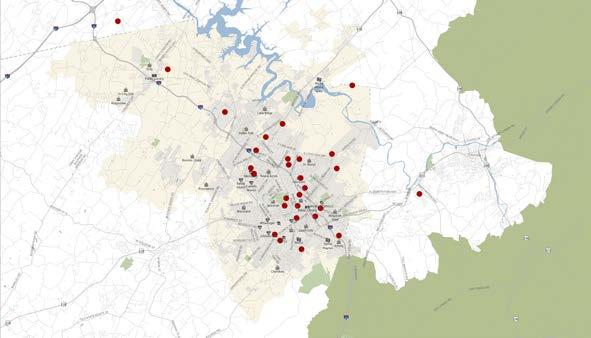
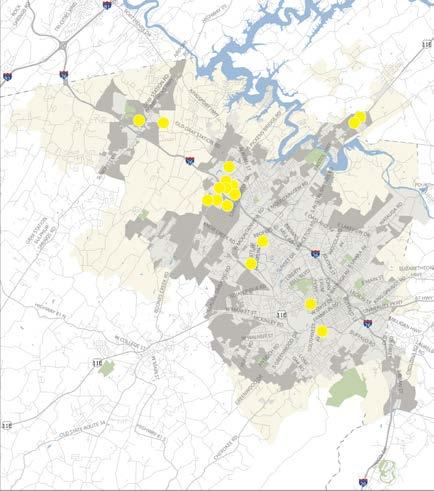
HOW SHOULD WE GROW | Participants placed dots where they think new growth should occur.
Blue dots represent where participants think new people should live, green where new jobs should locate, yellow where new shops and restaurants should locate, and red are areas that need to be protected from new development.
MORE OR LESS | Participants placed green dots on land uses they wanted more of, and red dots on uses they wanted less of.
LIVE WORK/ SHOP/EAT
RECREATE MOVE
More housing of all types
Fewer franchise restaurants and strip malls
More greenways and trails and indoor recreation
More bicycle lanes and public transportation

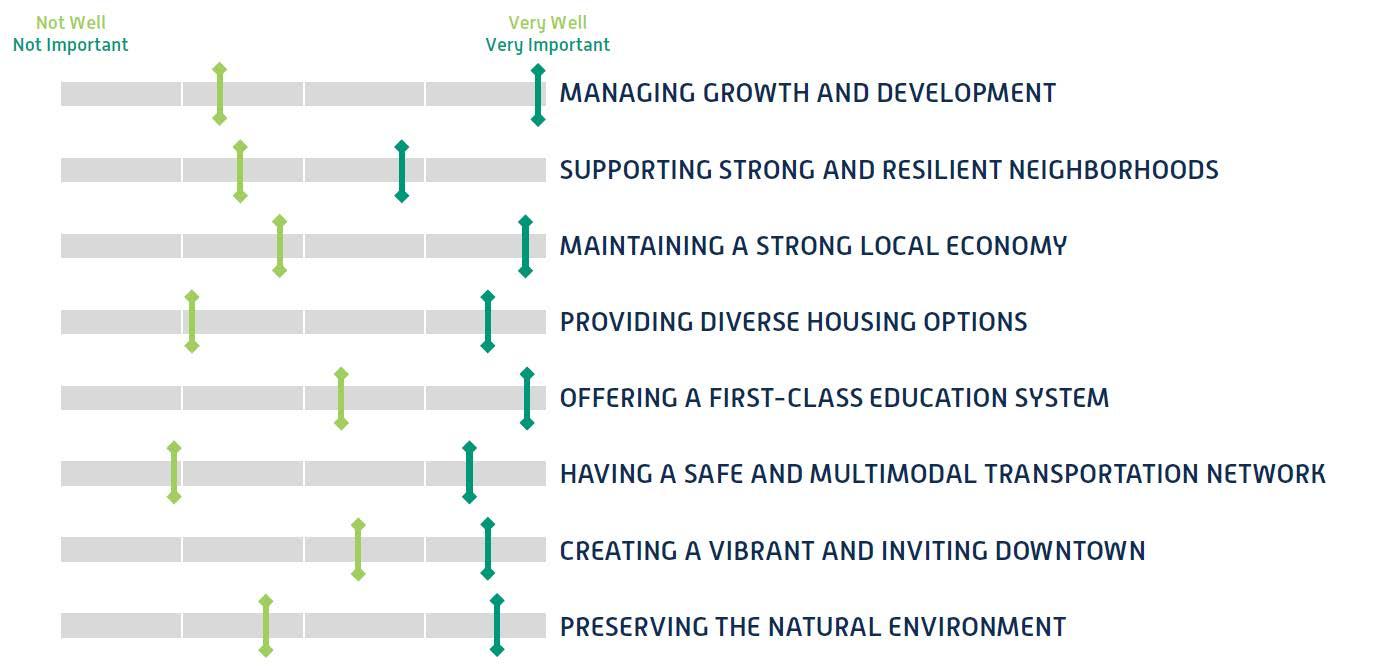
PLANNING PRINCIPLES | How well is each theme addressed today? How important is it for the future?

Community members who participated in the first phase of engagement shared a strong commitment to preserving Johnson City’s character while embracing opportunities for growth. Through online engagement and interactive public workshop activities, several themes emerged that reflect the community’s priorities and aspirations for the future.
Residents want to see thoughtful, well-managed development that enhances Johnson City without compromising its small-town feel and natural assets. Many participants supported new growth in targeted areas while expressing a desire to protect greenspaces and beloved community landmarks.
Housing emerged as a key concern, with participants calling for a greater variety of housing types to support affordability and accessibility. Many residents highlighted the need for a mix of residential options that serve different income levels while ensuring neighborhoods remain vibrant and well-connected.
Roads, sidewalks, and public transportation were mentioned as areas needing improvement. Many participants emphasized the importance of maintaining and upgrading infrastructure to support Johnson City’s continued growth while improving mobility for all residents.
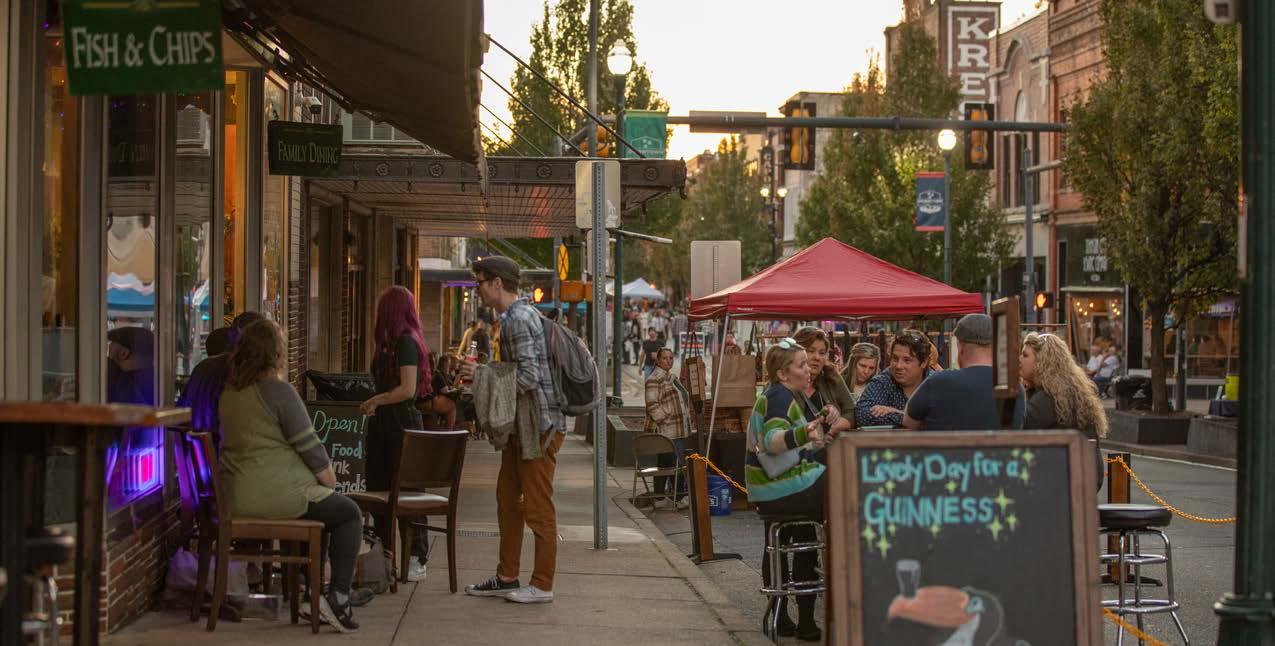
Downtown was recognized as a vital community asset, with strong support for continued investment in local businesses, walkability, and placemaking efforts that enhance its role as a cultural and economic hub.
Preserving Johnson City’s outdoor amenities and natural beauty was a clear priority. Residents want to see future development that is environmentally responsible and protects access to parks, trails, and recreational spaces.

The second phase of engagement built upon the foundational feedback from Phase 1, focusing on refining priorities and exploring future growth options. This phase aimed to further understand the community’s preferences for growth, development, and infrastructure by engaging participants in activities that encouraged thoughtful discussion and collective decision-making.
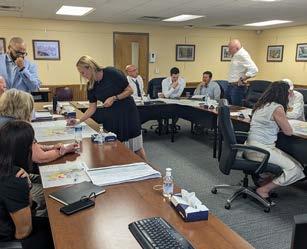
During this phase, the project team facilitated a joint workshop with the Planning and City Commission, a second Advisory Committee meeting, and a second public workshop. These efforts provided opportunities for participants to prioritize planning themes, evaluate representative street segments, define preferred activity center types, and consider different growth scenarios for Johnson City’s future.
• Options for the Future Public Workshop – February 29, 2024
• Digital Engagement Series #2 – March 20-April 29, 2024
• Digital Engagement Series #3 – April-September, 2024
• Advisory Committee Meeting #3 – May 9, 2024
• Planning Commission Work Session #1 – May 14, 2024
• Planning Commission Work Session #2 – June 11, 2024
• Planning Commission Work Session #3 – August 13, 2024
• Advisory Committee Meeting #4 – October 1, 2024
• Joint Work Session #2 – October 3, 2024
• Planning Commission Work Session #5 – November 12, 2024
• Stakeholder Meetings, Round 2 – December 10 and 11, 2024
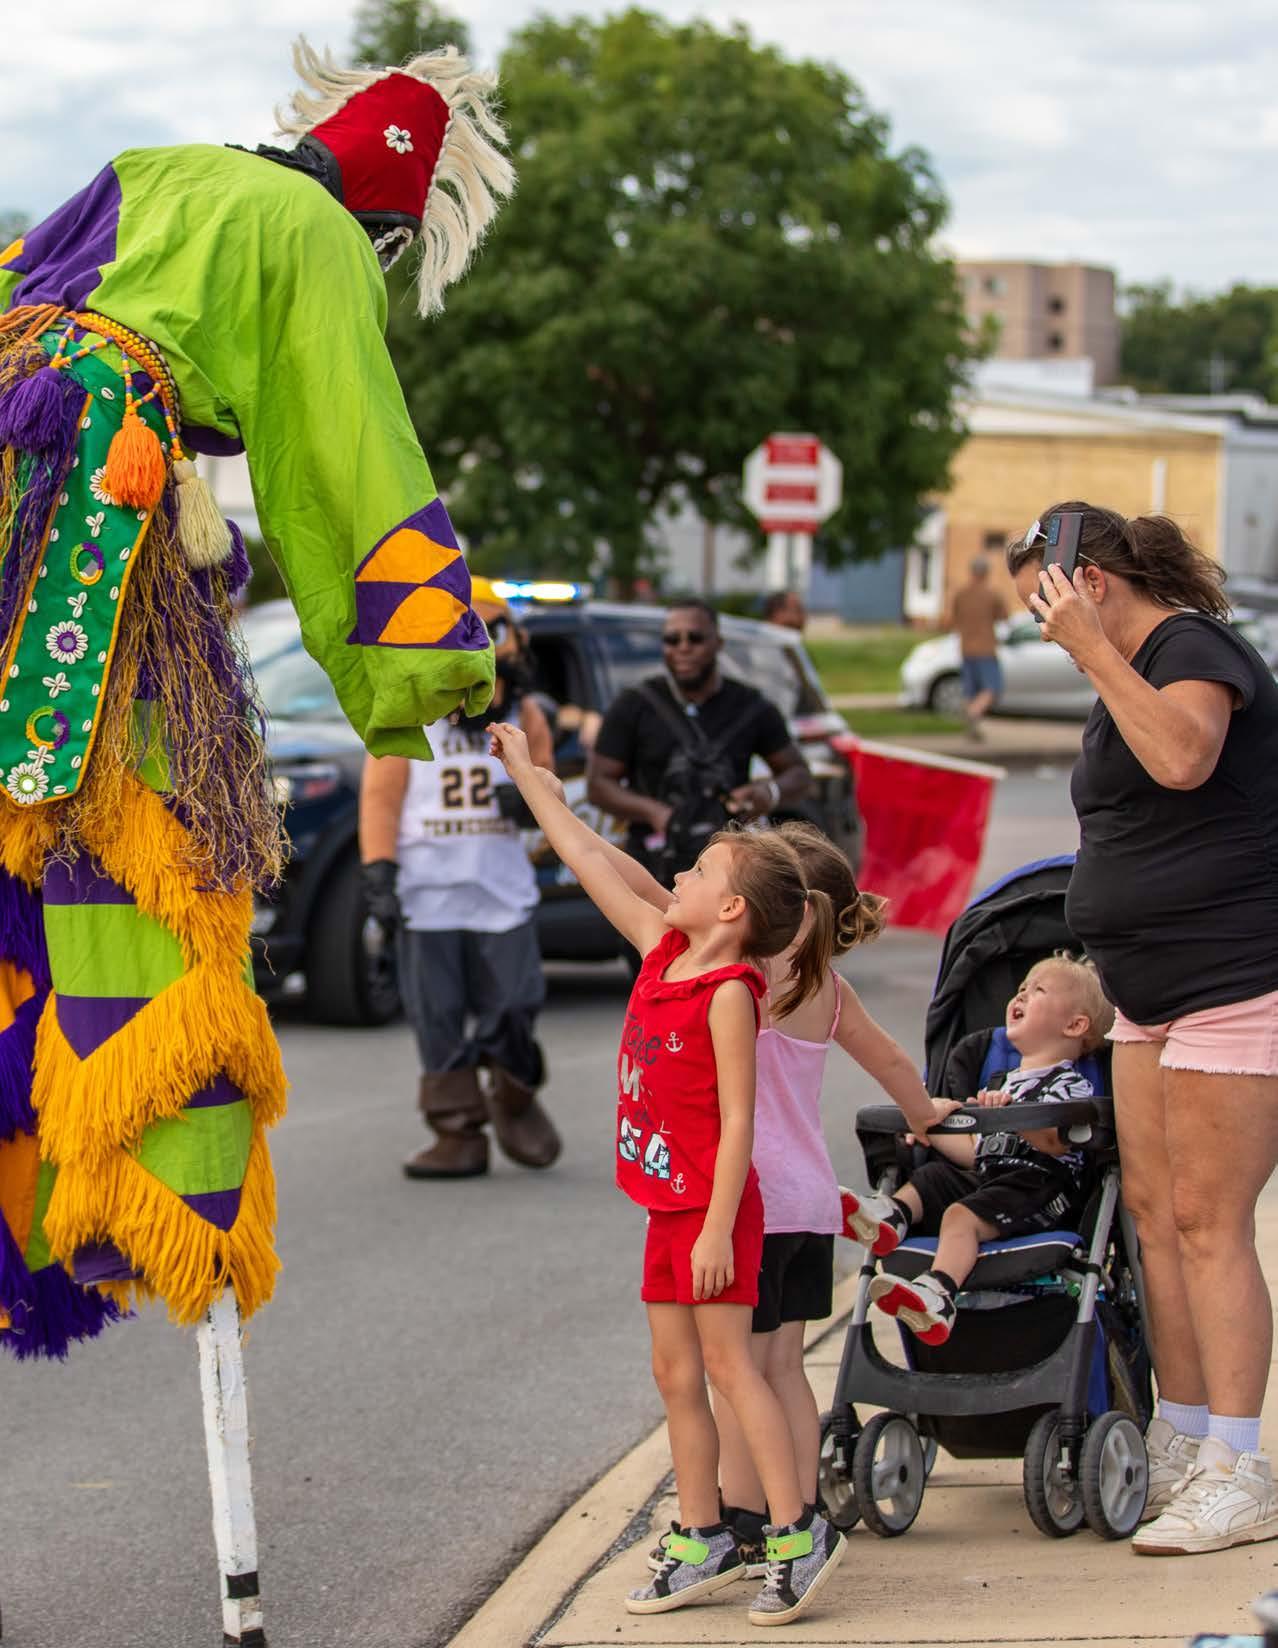
Pop-up events provided informal opportunities to engage residents, gather community input, and ideas for Johnson City’s future.
- Fridays After 5
- Meet the Mountains
- Doughboys Baseball Game
- Umoja Festival
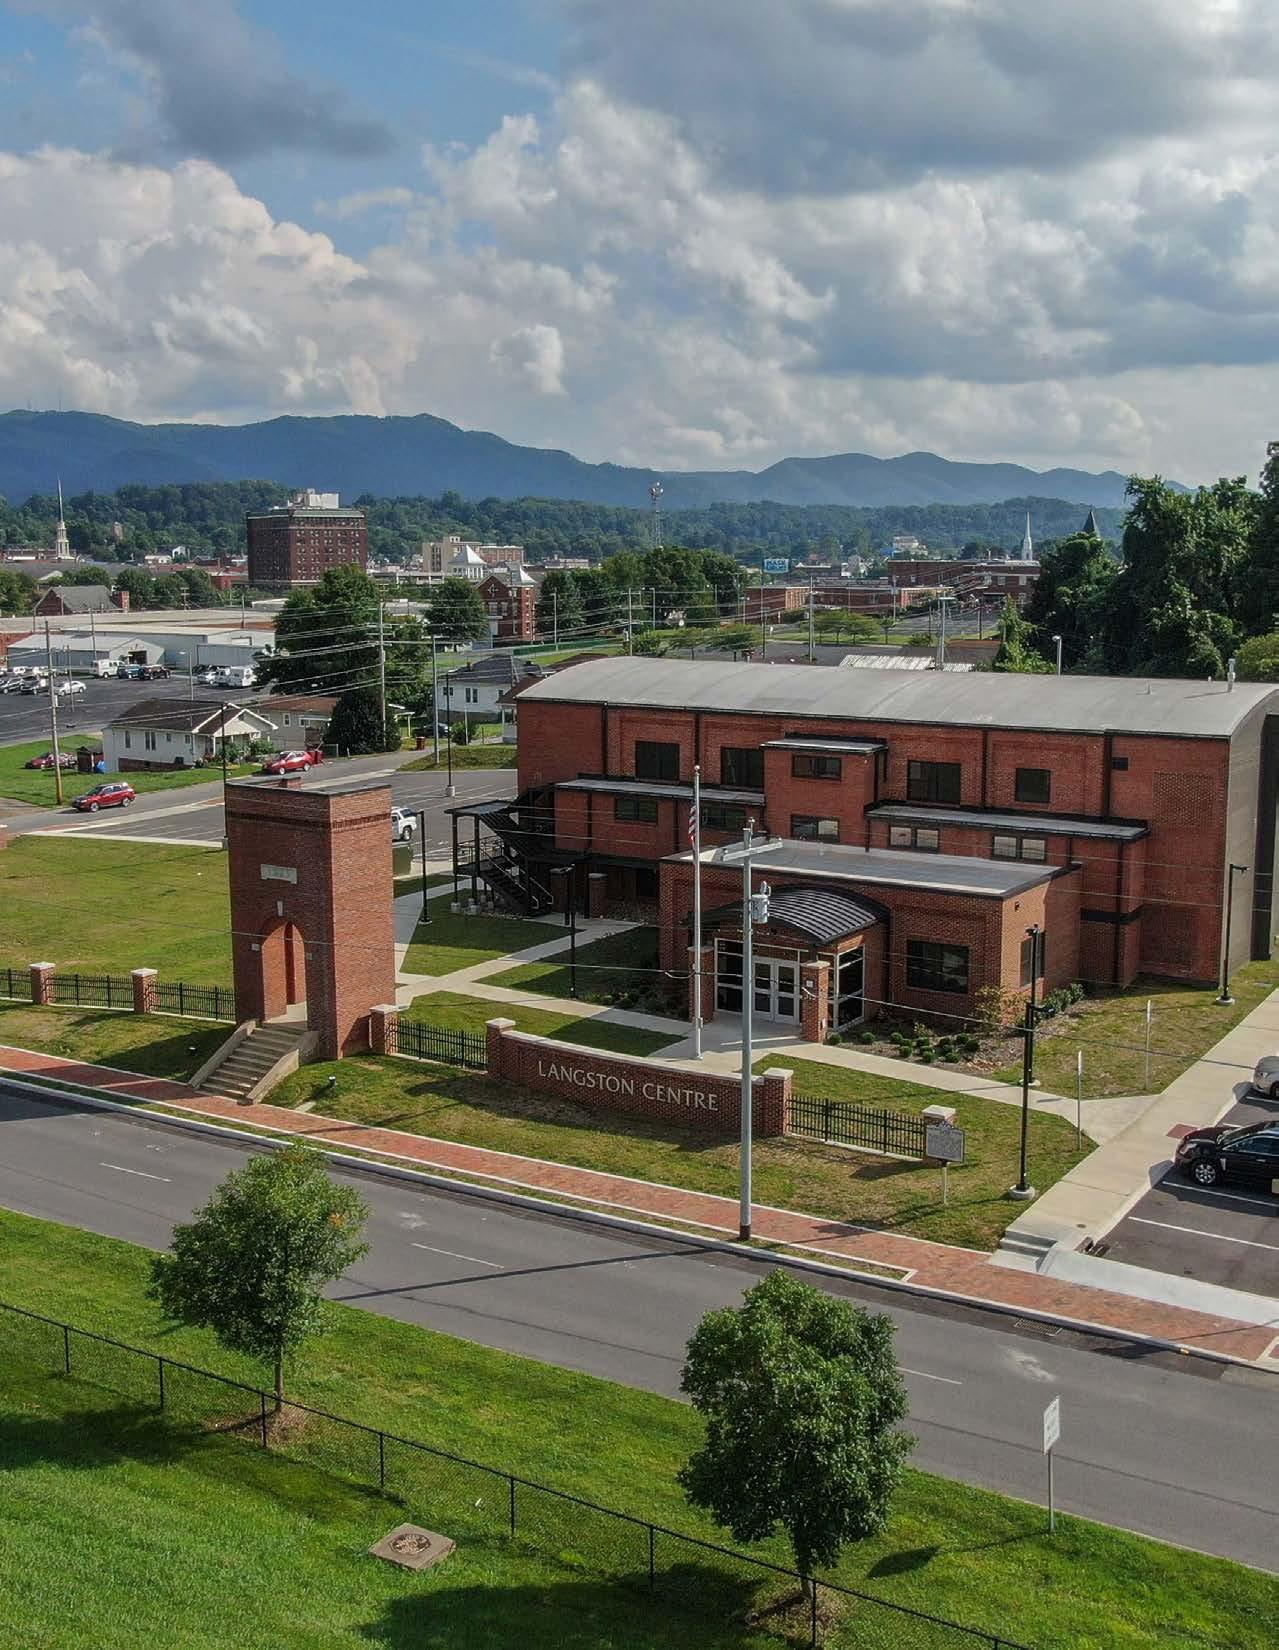
- Langston Centre
- Senior Advisory Meeting
- Southside Neighborhood
- Lakeside Concert Series
- Back to School Bash
- Rotary (various)
- EnvisionJC (various)
- Science Hill Economics and Government Classes
- Farmers Market
- ETSU
- JC 101
Phase 2 was centered around various pop-up events, two online engagement series and an interactive public workshop designed to give community members the opportunity to weigh in on growth strategies, transportation priorities, land use preferences, and share their big ideas for Johnson City. Participants engaged in a series of interactive activities aimed at defining where and how Johnson City should grow. They evaluated planning themes, ranked their priorities, identified key transportation corridors, and provided feedback on different growth scenarios. This phase of engagement reinforced the need for balanced growth that enhances quality of life, improves mobility, and supports economic vitality while preserving the community’s unique character.
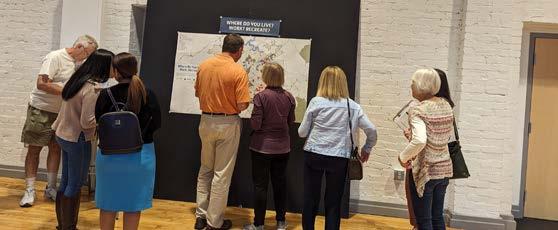
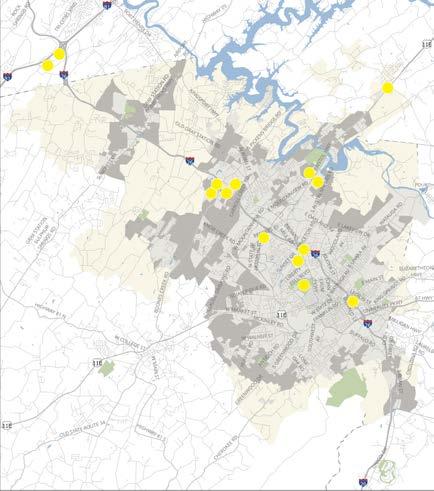
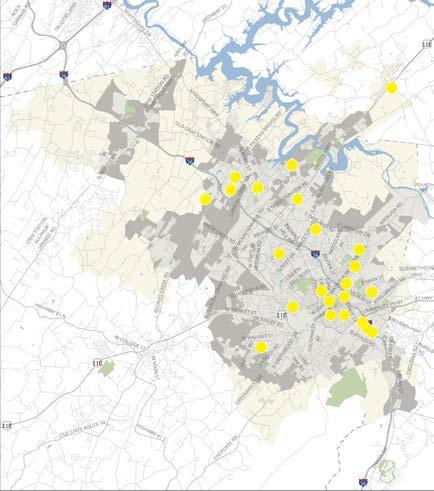
WHERE DO YOU LIVE/WORK/RECREATE? | Participants placed dots on a map to represent where they live, where they work, and where they recreate.
Attendees lived in areas scattered throughout the study area, and some attendees lived outside of the Study Area.
A large number of attendees worked in and around Downtown. A few attendees worked along the I-26 corridor.
Many of the attendees identified areas around Downtown for recreation, some identified Buffalo Mountain, and others picked areas such as the ETSU trail system or Winged Deer Park.
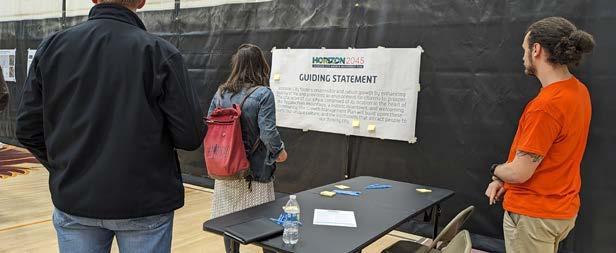
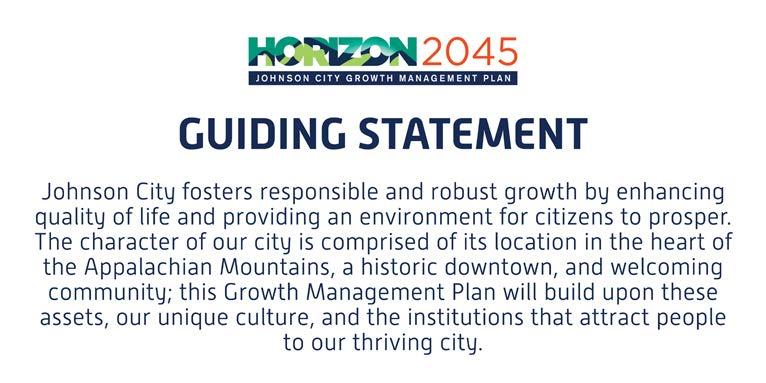
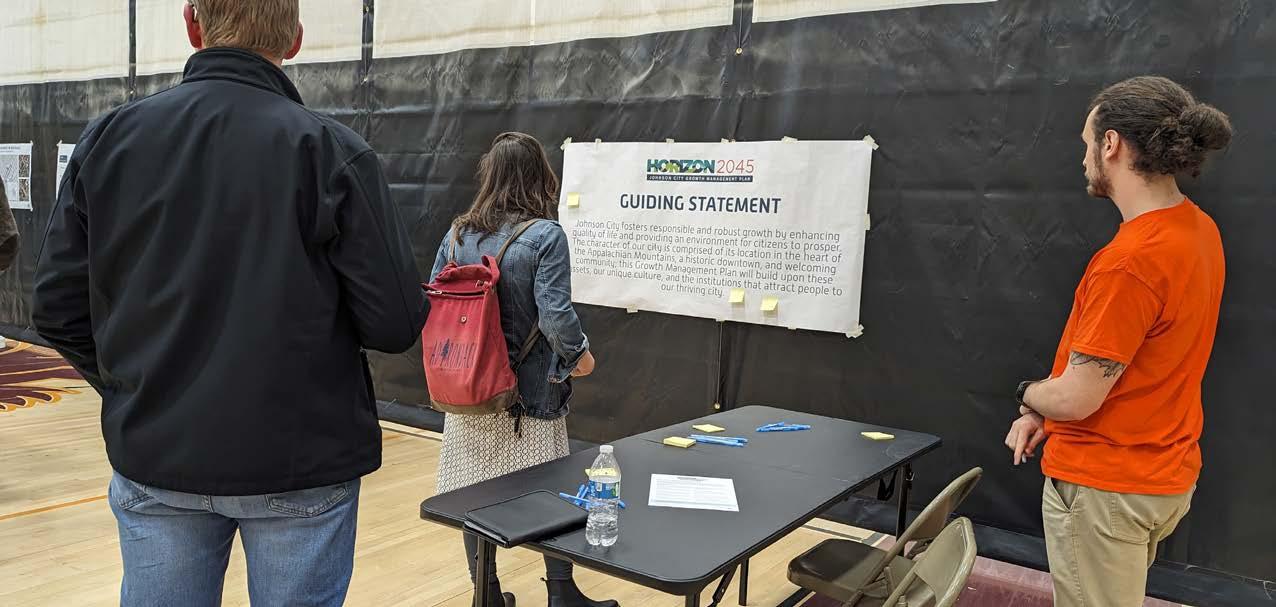
GUIDING STATEMENT REVEAL | Attendees had a chance to weigh in on the Horizon 2045 Growth Management Plan guiding statement.
I’m happy to see the focus on Downtown, outdoor recreation, and responsible growth. I would like to see a focus on equity in housing, transportation, and other future development.
Prioritize the existing citizens + businesses while making room for others to join our great City.
PLANNING THEME PRIORITIES | Attendees ranked a series of eight planning themes on a worksheet.
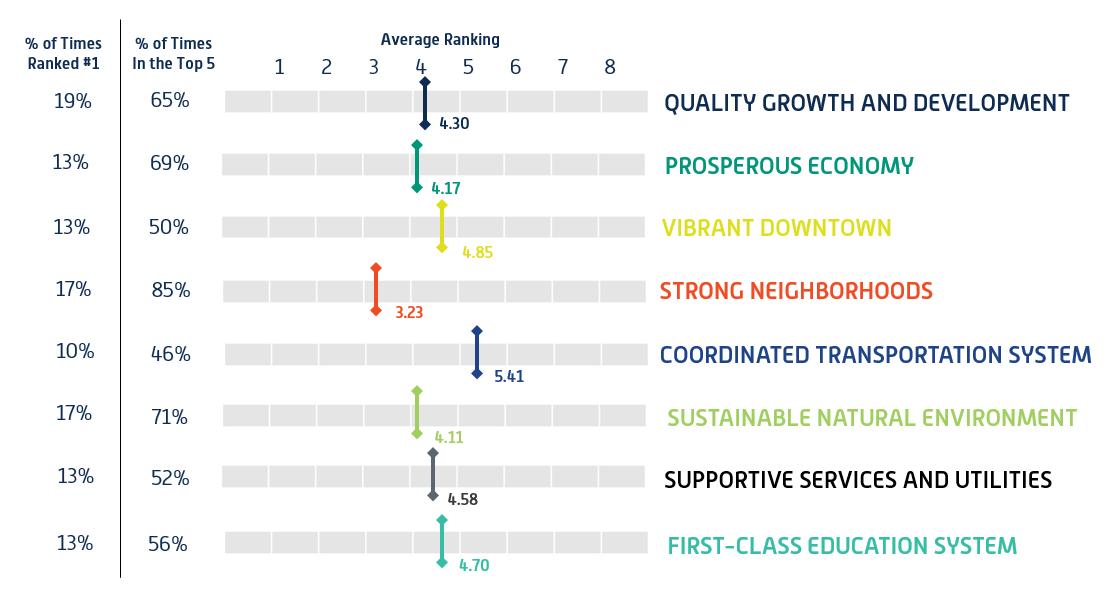
The planning themes were based on the planning principles the public and the Advisory Committee prioritized as part of Phase 1 of engagement. The amended list shown here was developed in coordination with the Advisory Committee, the Planning Commission, and Johnson City planning staff. Based on feedback from the Advisory Committee, First Class Education was added as a planning principle.
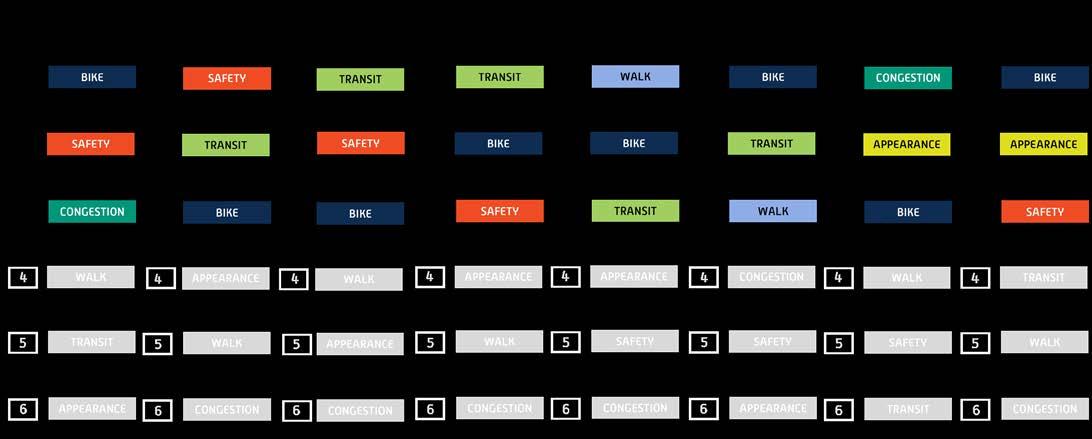
REPRESENTATIVE STREET SEGMENTS | Attendees viewed existing conditions boards for eight representative street segments. On worksheets, they selected their top three concerns for each segment, out of safety, congestion, appearance, walk, bike, and transit.
DEFINING ACTIVITY CENTERS | Attendees reviewed descriptions of three activity centers — Regional, Employment, and Neighborhood — then indicated where and how much of each they would like to see.
How much Regional Activity Center development would you like to see?

How much Employment Activity Center development would you like to see?
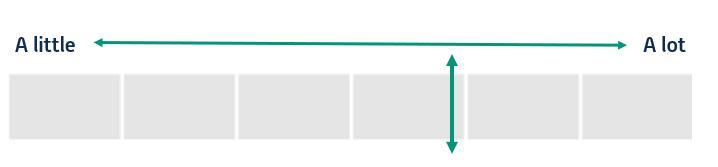
How much Neighborhood Activity Center development would you like to see?

GROWTH OPTIONS | Participants were asked to review three growth options and provide feedback about each. They then voted on which option was preferred.
Directs the majority of growth to areas of Johnson City that are already urbanized, most notably the Downtown and immediate surrounding areas.
Historic foundation buildings and streets
Walkability, small businesses, green space, lighting
Not enough reliable transit
Fast-track process for infill development
Availability of housing near destinations Greater shopping and entertainment options
Directs growth along Johnson City’s major roadway corridors that have the ability to move people and goods, today and in the future. What I Like
Preservation of agricultural land
Rezone areas around corridors for denser development
Develops corridors for more affordable housing Fast-track process for infill development
Corridors connect distinct places More sidewalks, bike paths/lanes and lighting
Directs growth throughout Johnson City, with new development focused in multiple activity centers that offer a variety of scales and land uses.
Allows growth in areas where clusters already exist Balance with attention to Downtown Encourages neighborhood-level
The second phase of engagement for the Johnson City Growth Management Plan refined the community’s priorities and explored future growth options through pop-up events, online engagement series, and an interactive workshop with collaborative activities. The reveal of the draft guiding statement highlighted the community’s desire for responsible growth that balances enhancing quality of life with preserving the City’s unique character, including its history, culture, and agricultural roots. Building on the insights gathered in Phase 1, this phase provided more detailed input that helped guide the development of the plan.
Residents want growth that is intentional and well-managed. Many supported development that enhances existing neighborhoods and Downtown while being mindful of infrastructure and environmental impacts.
The community’s response toward the draft guiding statement included a focus on equity in housing and transportation, prioritizing existing residents and businesses while welcoming new growth.
There was strong feedback around enhancing local employment opportunities, supporting small businesses, and attracting new industries to create a more resilient economy.
Connectivity was a major point of discussion, with a strong interest in improving road safety, expanding pedestrian and bike infrastructure, and ensuring that future development aligns with efficient transportation networks.
Residents showed interest in directing growth to urbanized areas like Downtown, emphasizing the importance of smart, infill development and improved transportation options.
The third phase of engagement for Horizon 2045 focused on refining the Future Land Use Map and gathering valuable insights into how residents envision Johnson City’s future, focusing on land use. This phase aimed to build on the foundation set in previous phases by exploring how specific areas of Johnson City could evolve, identifying preferred land use types, and prioritizing key strategies for development. Engagement activities included online engagement, a community workshop, an Advisory Committee meeting, and a joint work session, ensuring that the planning process continued to be guided by community voices and expert input.
• Digital Engagement Series #4 – November 18, 2024-January 6, 2025
• Future Land Use Strategies Public Workshop – December 11, 2024
• Joint Work Session #3 – June 5, 2025
Phase 3 engagement provided valuable insights into how residents envision Johnson City’s future and focusing on land use. Participants reviewed and shared feedback on the draft Future Land Use Map, offering input on the balance of residential, commercial, and mixed-use development across the City. They identified areas for growth, highlighted transportation and connectivity improvements, and considered the appropriateness of the placetypes.
This phase also gathered community input on implementation strategies, including promoting quality growth, enhancing public services, supporting diverse housing options, and fostering a vibrant Downtown. The following section presents key findings from this engagement.
DRAFT FUTURE LAND USE MAP | Survey participants were asked to rank the balance of the placetypes on the Future Land Use Map (FLUM). In addition, participants ranked different elements in select geographic areas and could provide additional feedback on the draft FLUM and the placetypes.
Q1 | Do you think we’ve struck the right balance between residential and non-residential placetypes shown on the draft Future Land Use Map? Note: Average responses is noted on scale.
Q2 | Why or why not?
Mixed-use areas that run into residential should be carefully planned [so] that the use areas do not over encompass the connected residential.
While we do need more housing availability in Johnson City, there should be more non-residential availability. Both for work and recreation.
There needs to be more high density residential to help create more affordable housing.
Gray already struggles with traffic. If you add this much more residential, we’ll need a lot more intersections on Suncrest Drive.
Q3 | Are there any areas on the Future Land Use Map where you believe more industrial or employment flex placetypes should be considered? If so, where and why?
Maximize areas in the “rural residential” types between “neighborhood residential” types. That would allow for closer worker proximity to new jobs.
Boones Creek Rd, there is lots of place for business industry that would give people more job opportunities.
More employment flex between Boones Creek and Gray to accommodate the growing population and increased housing costs in Johnson City.
I think having more flex placetypes will help give better work, transit, recreation, and shopping opportunities for residents.
Q4 | Does the draft Future Land Use Map support connectivity between destinations? Where do you see opportunities for improvement?
I think either increasing regional transit options or having more flex types will help with connectivity.
Suncrest Drive needs more intersections with lights to help with traffic flow, especially around rush hour.
The areas surrounding Downtown need to be high density residential and there needs to be more public transit
As far as connectivity goes, it all seems well to me, further densifying the core, would be ideal. Maybe creating transit- oriented development too.
Employment Flex – Maintain and encourage growth of light industrial uses
Neighborhood Mixed-Use – Focus on moderate density land use patterns supported by multifamily development
Industrial – Locate and/or buffer heavy industry to minimize offsite impacts
Q1 | How much change should be encouraged for the revitalization along South Roan? Note: the average score is shown on the scale below with the vertical line capped with arrows.
Q2 | How important is it for the corridor to transition industrial land to other uses, such as commercial, housing, or mixeduse development? Note: the average score is shown on the scale below with the vertical line capped with arrows.
Q3 | How important is it for the corridor to attract businesses and create new job opportunities? Note: the average score is shown on the scale below with the vertical line capped with arrows.
Compact Residential – Maintain unique character of established neighborhoods while increasing diversification
Downtown Connected – Draw attention to the transition between the Downtown Core and surrounding areas
Downtown Core – Foster a sustainable Downtown with a mix of residential, retail, and office uses
Special District – Features unique places and spaces likely to have their own master plans now or in the future
Q1 | Do you feel the boundary of the Downtown Core placetype is appropriately sized? Note: the average score is shown on the scale below with the vertical line capped with arrows.
Needs to be Smaller
Q2 | Do you feel the boundary of the Downtown Connected placetype is appropriately sized? Note: the average score is shown on the scale below with the vertical line capped with arrows.
Needs to be Larger
Needs to be Larger
Q3 | How important is it to improve pedestrian connections between the Downtown Core and Downtown Connected placetypes? Note: the average score is shown on the scale below with the vertical line capped with arrows.
Q4 | How important is it to prioritize additional public open space within the Downtown Core and Downtown Connected placetypes in the future? Note: the average score is shown on the scale below with the vertical line capped with arrows.
Neighborhood Mixed-Use – Focus on moderate density land use patterns supported by multifamily development
Special District – Features unique places and spaces likely to have their own master plans now or in the future
Commercial Corridor – Encourage more intense development near intersections while enhancing look and functionality of corridors
Neighborhood Residential – Enhance existing lowerdensity neighborhoods with multimodal connectivity and community amenities
Q1 | How much should the corridor focus on attracting businesses and creating new job opportunities?
Note: the average score is shown on the scale below with the vertical line capped with arrows.
Q2 | Do you support growth in commercial and mixed-use land along Bristol Highway?
Note: the average score is shown on the scale below with the vertical line capped with arrows.
Employment Flex – Maintain and encourage growth of light industrial uses
Regional Mixed-Use – Blend of residential, retail/ service, and office uses
Commercial Corridor – Encourage more intense development near intersections while enhancing look and functionality of corridors
Neighborhood Residential – Enhance existing lowerdensity neighborhoods with multimodal connectivity and community amenities
Rural Residential – Maintain existing rural character; encourage conservation of the natural landscape
Q1 | Do you feel the boundary of regional mixed-use placetype in this area is appropriately sized?
Note: the average score is shown on the scale below with the vertical line capped with arrows.
Q2 | How important is it to incorporate a mix of housing types into this area in the future?
Note: the average score is shown on the scale below with the vertical line capped with arrows.
Q3 | How important is it for this area to include opportunities for jobs in the future?
Note: the average score is shown on the scale below with the vertical line capped with arrows.
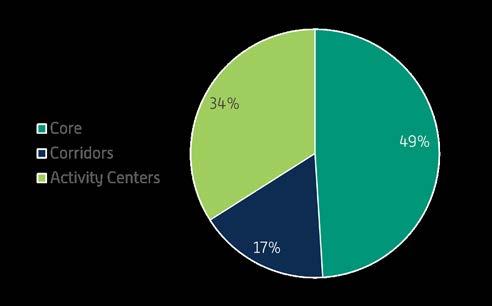
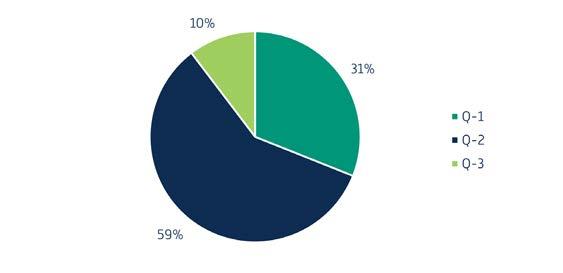
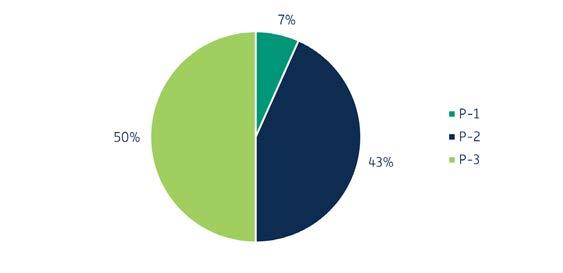
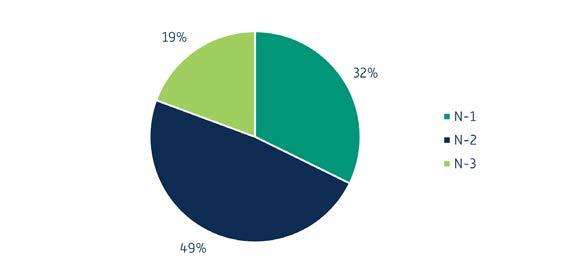
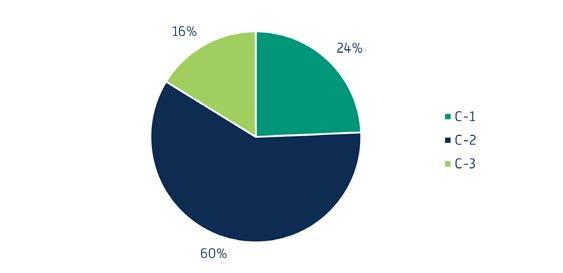
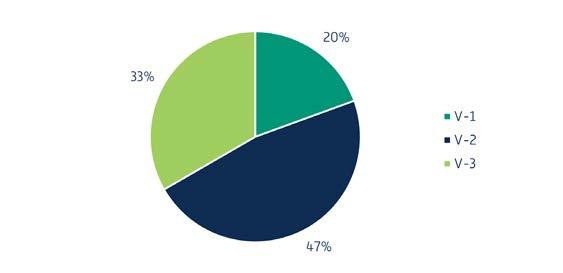
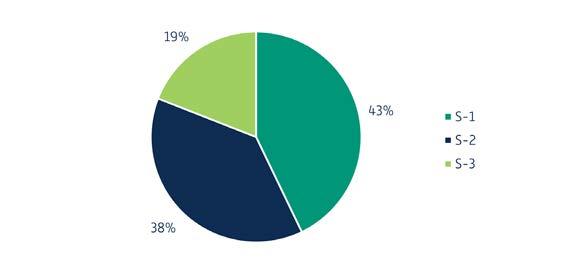
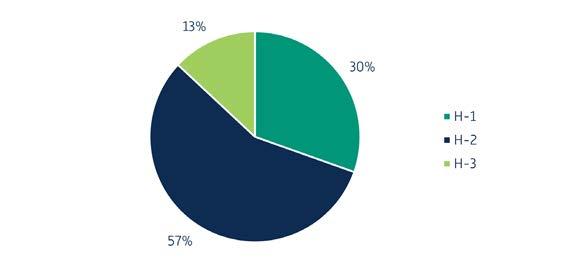
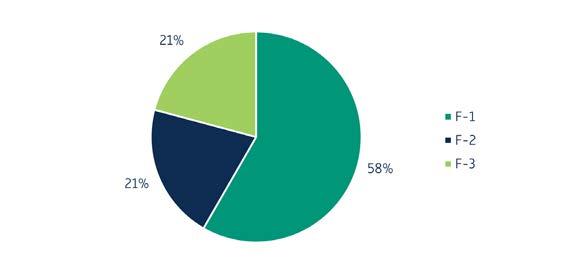
IMPLEMENTATION STRATEGIES | Attendees reviewed a sample of high-level strategies for the eight planning themes and used dots to vote for the strategies they felt were the most important. Note: Attendees could place more than one dot, so the pie charts below show what percentage of the total number of dots each strategy received.
Q-1 | Promote innovative, high-quality, and compact development that discourages urban sprawl.
Q-2 | Encourage the concept of mixed-use development to create diverse, equitable, and attractive neighborhoods.
Q-3 | Promote the expansion of commercial and industrial areas to encourage growth and development of the City’s tax base.
P-1 | Diversify the economy and broaden the tax base.
P-2 | Improve and protect the natural and built environment as assets that attract economic development opportunities and enhance Johnson City’s quality of life.
P-3 | Enhance employment opportunities for young adults that offer higher quality jobs and a greater range of careers.
N-1 | Facilitate the private construction of housing supply with a focus on creating housing for a wide range of incomes.
N-2 | Maintain and improve existing neighborhoods as desirable places to live.
N-3 | Preserve, protect, and enhance existing historic housing, including structures and sites.
C-1 | Monitor traffic volumes, levels of service, safety, and land platting on an ongoing basis to anticipate needed improvements to the local transportation system.
C-2 | Create a network of bikeways and greenways capable of supporting multiple users for transportation and recreation purposes.
C-3 | Provide a sidewalk network that supports pedestrian access to all parts of the City and meets current ADA standards.
V-1 | Create a physical setting that is comfortable, convenient, visually interesting, and secure.
V-2 | Encourage the renovation and rehabilitation of existing buildings and storefronts.
V-3 | Support shared parking to maximize parking arrangements, increase parking supply near key Downtown destinations, and expand access to pedestrian networks.
S-1 | Ensure the provision and maintenance of community facilities and services necessary to meet the needs and interests of residents.
S-2 | Give priority to new developments that can be served by public utilities already in place.
S-3 | Continually strive for the greatest equity, effectiveness, and efficiency in the delivery of first responder services.
H-1 | Protect priority agricultural assets as important components of Johnson City’s quality of life and economic base.
H-2 | Provide recreation facilities and programming that will meet the needs of the City’s residents.
H-3 | Improve the City of Johnson City’s Parks and Recreation system through the construction or acquisition of new facilities at appropriate locations.
F-1 | Provide new, properly located, high-quality educational facilities that serve as community centers and support the desired land use pattern in Johnson City.
F-2 | Provide adequate school capacity for present and future enrollment; coordinate these efforts between the City and Johnson City Schools.
F-3 | Continue to provide equitable provision of educational facilities and services, while strategically locating new schools to promote infill development and discourage sprawl.
The third phase of community engagement reinforced Johnson City’s commitment to thoughtful, balanced growth and provided clear direction on land use priorities. Feedback from this phase highlighted several key themes that helped shape the Future Land Use Map and implementation strategies.
Participants supported revitalizing in South Roan Street through mixed-use and commercial development while maintaining the character of established neighborhoods. There was a strong interest in expanding housing diversity, particularly in Gray, and encouraging job creation in strategic locations.
Feedback emphasized the need for improved pedestrian access, particularly in Downtown, along with preserving open spaces and enhancing infrastructure. Balanced development along corridors like Bristol Highway was also highlighted as essential for supporting both commercial needs and neighborhood connections.
Expanding the local economy through diverse industries, supporting local businesses, and creating employment opportunities, especially for young adults, were key community priorities.
Enhancing transportation networks with more bikeways, greenways, and sidewalks, along with maintaining highquality public services and strategically expanding educational facilities, was seen as essential for Johnson City’s future growth.
Residents continued to express a desire to maintain Johnson City’s unique identity by preserving historic neighborhoods, enhancing Downtown’s vibrancy, and protecting natural resources.

The development of Horizon 2045 highlighted the importance of strategic planning to guide Johnson City’s future growth. Through thoughtful community engagement, residents emphasized the need to balance growth across households, businesses, and employment opportunities while protecting the City’s character. The dialogue also reflected a commitment to creating meaningful, positive change that extends well beyond 2045. Establishing a clear guiding statement and focused planning themes provides a strong foundation for this process. This section outlines the community’s early involvement and how their input shaped the foundation of Horizon 2045.
The guiding statement for the Horizon 2045 Plan was developed through a collaborative and inclusive process, ensuring it reflects the community’s shared vision for the future. At the core of this effort was the formation of an Advisory Committee, carefully composed of diverse representatives from across Johnson City, including residents, business owners, organizational leaders, and advocates. The Advisory Committee was engaged throughout the planning process, offering feedback, and acting as a link between the project team and the broader community. Through community workshops, surveys, digital engagement series, and stakeholder meetings, the voices of residents were amplified, ensuring the plan is rooted in the priorities and aspirations of those who live, work, and play in Johnson City. In addition, collaboration with the Planning Commission provided essential guidance to align the plan with the City’s broader development goals and regulatory framework.
The guiding statement captures the outcomes of these efforts, embodying the shared vision for Johnson City’s future. It serves as the foundation for all subsequent themes and strategies within the Growth Management Plan, ensuring that growth is not only well-managed but also reflective of what makes Johnson City unique.
By 2045, Johnson City continues to be a regional leader in Northeast Tennessee by being a vibrant, welcoming, and connected community. We celebrate the people, places, and traditions that make our community unique and memorable by supporting strong neighborhoods, maintaining an attractive and dynamic Downtown, providing premier public services and amenities, and investing in the local economy. The Horizon 2045: Johnson City Growth Management Plan helps our community to grow in a way that is collaborative and desirable for all.
The planning themes for the Horizon 2045 Plan were developed through a collaborative and iterative process that prioritized inclusivity and community input. These themes serve as the foundation of the plan, reflecting the core priorities and aspirations of Johnson City’s residents, stakeholders, and leaders. The process began with an initial set of potential themes to capture the diverse elements essential to the City’s future growth and development. The Advisory Committee and Planning Commission helped review and refine these options, providing valuable insight into how the themes aligned with the unique needs and characteristics of Johnson City. Their diverse perspectives helped ensure that the proposed themes resonated with various facets of the community. Public feedback was integrated into the process offering residents the opportunity to voice their preferences, priorities, and concerns. Through this iterative process, eight final themes emerged.


• Attract growth that is manageable and desirable
• Distribute development in alignment with public services
• Contribute to the community’s quality of life
• Maintain cohesive and people-oriented neighborhoods
• Provide housing options in a variety of locations, types, and price points
• Maintain a vibrant local economy
• Support diversity across job sectors
• Encourage revitalization of commercial centers

• Maintain the unique character of Downtown
• Support Downtown’s viability as an economic anchor
• Market Downtown as an unmatched community amenity


• Enhance the existing transportation system for all users
• Focus on safety and efficiency
• Connect Johnson City to the greater region
• Respect the heritage of Johnson City to bolster quality of life
• Support community health and an effective healthcare system
• Preserve the natural environment
• Provide high-quality public services that are fiscally sound
• Protect the safety and security of all citizens
• Match the pace and distribution of growth to the availability to serve
• Honor a first-class education system for students of all ages
• Support an evolving and connected ETSU campus
• Distribute education services evenly based on growth and development
The eight planning themes serve as the organizational structure for the Horizon 2045 Plan’s actionable strategies and implementation framework. Each theme reflects a key element of Johnson City’s vision for the future, ensuring that the plan is comprehensive and interconnected.
To translate these themes into meaningful action, they were used to build a policy framework that provides the foundation for decision-making and sets clear objectives and strategies for achieving the guiding statement. These objectives, policies, and actions are further refined in an action table, which identifies specific initiatives, responsibilities, and timelines to ensure accountability and progress.
Chapters 4 through 11 of this Plan are organized around the eight planning themes with a chapter dedicated to each theme. Together, they provide a cohesive and actionable strategy for guiding Johnson City’s growth in a way that is intentional, balanced, and aligned with community priorities. The organization of the themes is partially based on feedback from the Advisory Committee, the Planning Commission, the City Commission, and the community. By organizing the Plan in this way, Horizon 2045 ensures that every aspect of growth and development is addressed with clarity and purpose, creating a framework that is not only forward-looking but also deeply rooted in the values and aspirations of Johnson City’s residents.
The highest priority actions are denoted with this target icon, chosen because they were the actions most often cited as priorities by the public, City Staff, Advisory Board, Planning and City Commissions during the Horizon 2045 engagement process.
This framework element guides Johnson City’s intentional and coordinated growth in alignment with its long-term vision. The strategies emphasize growth and development patterns that support quality of life, economic vitality, and environmental stewardship. Future decisions will reflect the community’s values and priorities by balancing responsible growth with the preservation of Johnson City’s unique character. This chapter features numerous visual aids and maps to illustrate key components such as the future land use strategy, conceptual growth framework, and placetype descriptions. These graphics provide context for understanding how growth will be guided across the City.
The future land use strategy guides growth and development in Johnson City by providing a foundation for decision-making. The strategy helps property owners, developers, and other stakeholders understand how the City plans to accommodate growth while preserving its distinct character and supporting its long-term vision. It addresses three key questions:
Johnson City’s land use strategy was informed by input from residents, business owners, and community leaders, who helped inform the guiding statement and planning themes and give shape to the conceptual growth strategy. The Future Land Use Map provides a clear picture of how growth can align with Johnson City’s vision for the future, ensuring that land use decisions support community priorities and long-term goals.
GUIDING STATEMENT + PLANNING THEMES
COMMUNITY CHARACTERISTICS REPORT
How should we grow? Where should we grow?
what form should we grow?
COMMUNITY CHARACTERISTICS REPORT
Existing and projected conditions in Johnson City
A statement and set of themes to guide the vision of Horizon 2045
GUIDING STATEMENT + PLANNING THEMES
1 3 2
CONCEPTUAL GROWTH STRATEGY
4
PLACETYPES + FUTURE LAND USE MAP
The building blocks and roadmap for growth in Johnson City
PLACETYPES + FUTURE LAND USE MAP
CONCEPTUAL GROWTH STRATEGY
A more illustrative representation of areas ripe for growth in Johnson City
The conceptual growth strategy serves as the first glimpse of how Johnson City’s approach toward land use can fulfill the intent of the guiding statement and planning themes.
Map Legend Descriptions
Protect natural areas and agricultural lands. These rural, undeveloped, or agricultural areas of Johnson City should be protected from development. They provide land for the agricultural industry, as well as important natural amenities that make Johnson City unique.
Enhance neighborhood character. These areas of stabilized neighborhoods should have focused investment to maintain, preserve, and enhance the existing character. New development should be allowed at the same scale and intensity of what is there today to protect neighborhood integrity.
Grow new neighborhoods and employment opportunities. New growth should be focused in these mostly undeveloped areas, which offer accessibility to roadways, utilities, and/or services, and proximity to existing neighborhoods and commercial centers. These areas should also accommodate new parks, community facilities, and retail services.
Stabilize and revitalize neighborhoods. These areas host existing neighborhoods that are older and may be starting to experience decline. Investments should maintain the existing densities and intensities while encouraging investments that increase the overall success of the area.
Invest in the urban core. This central core of Johnson City includes the historic Downtown, a truly unique amenity within the community, as well as the surrounding historic neighborhoods. Future development should be focused on infill and redevelopment/revitalization opportunities and target higher densities and intensities.
Place renewed focus on strategic growth corridors. These corridors present opportunities to focus growth while making investments in multimodal design. They should allow for a mix of land uses that are accessible to vehicles, bikers, and walkers. Corridors include:
• West Market Street
• Knob Creek Extension (Future)
• Boones Creek Road
• Bristol Highway
• Kingsport Highway
• Suncrest Drive/Bobby Hicks Highway
Emphasize institutional nodes. This important area is home to some of Johnson City’s major economic anchors: ETSU, the VA Medical Center, and the Johnson City Medical Center. Development in this node should support the anchors and be complemented with community amenities.
Activate regional centers. Regional Centers have a mix of land uses that attract visitors from throughout Johnson City and beyond. They are often located along major roadways and/or transit corridors and can include a wide array of land uses with a focus on integration.
A. Downtown Johnson City is the heart of the community. It is characterized by dense development that offers opportunities to live, work, and play in an urban environment. It is a cultural center for Johnson City that brings together people from all walks of life.
B. The area that surrounds the intersections of I-26 and Bristol Highway and I-26 and North Roan Street hosts important services for the community, including shopping, dining and healthcare. From the Mall at Johnson City to Franklin Woods Community Hospital, this area supports the daily needs of residents, employees, and visitors.
C. Boones Creek can become a major economic driver for Johnson City. The presence of the Regional Retail and Tourism Development District can incentivize this area into becoming a new regional destination that hosts residential and commercial uses.
D. Gray is an unincorporated area of Washington County that has a clearly established identity grounded in development surrounding the Gray Station rail depot. This area has attracted new residential and commercial development, but today is more modest in scale than in the other regional nodes.
Celebrate neighborhood centers. Neighborhood Centers serve nearby residential areas with a mix of smaller-scale retail, dining, and entertainment options. They can be in urban, suburban, and rural settings but the scale must be appropriate to the surroundings.
The Conceptual Growth Strategy Map reflects current development trends as well as public feedback received from community members, stakeholders, City staff, the Advisory Committee, the Planning Commission, and City Commission. It was an important first step to determining how Johnson City’s approach to land use can fulfill the intent of the guiding statement and planning themes.

Protect natural areas and agricultural lands
Enhance neighborhood character
Grow new neighborhoods and employment opportunities
Stabilize and revitalize neighborhoods
Invest in the urban core
Strategic Growth Corridors
Emphasize institutional nodes
Regional Center
Neighborhood Center
Bodies of Water

The Future Land Use Map provides a detailed framework for understanding Johnson City’s vision for the mix and distribution of land uses across the community. This map is built using a series of land use classifications that illustrate how different areas of the City are intended to evolve over time. It serves as a guide for City staff, elected officials, property owners, and developers when making decisions about growth and development.
While the map offers long-term direction for land use planning, it does not change a property’s existing zoning designation. Zoning regulations are implemented through the City’s zoning ordinance and govern the specific uses and development standards for individual parcels. As Johnson City continues to grow, updates to the zoning ordinance and zoning map may be necessary to align with the vision reflected in the Future Land Use Map.
Placetype boundaries are meant as guidance for decision makers. Properties located on the boundary edges should be reviewed for context and appropriate designation on a case-by-case basis.
The Future Land Use Map assigns a land use classification to each parcel within the study area, providing general guidance for future development and redevelopment decisions. In some areas, the map reflects existing land use patterns the community values and wishes to maintain. In others, it signals opportunities for change, encouraging new uses or development approaches to better align with the City’s vision for the future.
The pages that follow describe each land use classification in greater detail, including an overview of its intent, characteristics, and the types of development it supports. Slider scale bars are included to illustrate the relative balance of different land uses and highlight key characteristics associated with each classification. These classifications are intended as a flexible and an illustrative tool to guide planning efforts rather than a rigid set of rules. A summary table provides a consolidated view of these classifications to support future decision-making.
to
Dense
Leans to More Dense Leans NonResidential Multifamily
Leans to More Dense Leans NonResidential Multifamily Smaller
Neutral Formal Leans to More Dense Leans Residential Leans Multifamily
Neutral Leans to Formal Neutral Leans Residential Leans SingleFamily Leans to Larger
Leans to AutoFocused Leans to Natural Less Dense Residential Single-Family Larger
Auto-Focused Natural Leans to More Dense NonResidential Multifamily
Leans to AutoFocused Leans to Formal NonResidential Leans to Larger Leans to AutoFocused Leans to Natural NonResidential
Auto-Focused Leans to Natural Leans to Natural
• Continue to foster a thriving Downtown atmosphere that serves as a destination for residents and visitors.
• Create a sustainable Downtown ecosystem with a mix of residential, retail, and offices.
• Encourage the use of vacant buildings and underutilized sites.
• Foster a thriving and diverse storefront economy that activates streets.
• Create a safe and efficient urban transportation network that encourages walking and biking.
• Draw attention to the transition between the Downtown Core and surrounding areas.
• Respect the character of existing residential neighborhoods by matching the established size and scale.
• Support small-scale, locally serving commercial, office, and service uses that integrate with established nearby residential uses.
• Create design cues that indicate a gradual arrival to the Downtown Core with development that orients to the street, less emphasis on parking lots, more architectural detail, and an emphasis on the pedestrian experience.
• Improve connectivity between the Downtown Core and surrounding neighborhoods.
• Blend residential, retail/service, and office uses to create vibrant, livable areas throughout the City.
• Identify locations well-positioned for growth and redevelopment with a focus on higher density and intensity development patterns that align with the availability of infrastructure.
• Create a design and scale that encourages active living with a connected network of walkable streets and paths.
• Formal public spaces are important to provide amenities for residents and employees.
Appropriate
Appropriate
• Blend residential, retail/service, and office uses to create vibrant, livable areas throughout the City.
• Identify locations well-positioned for growth and redevelopment with a focus on moderate density and intensity land use patterns supported by multifamily development.
• Create a design and scale that encourages active living with a connected network of walkable streets and paths, particularly to and from surrounding residential neighborhoods.

Appropriate
Appropriate
• Maintain the unique character of established neighborhoods while supporting appropriate diversification of housing type and increased density.
• Distinguish between multifamily types and density through the zoning ordinance, with more intense development near commercial centers or major corridors.
• Encourage urban design that is pedestrian-friendly, well-connected and integrated with neighborhoods and community amenities.
Appropriate
Appropriate
• Enhance existing lower-density neighborhoods with improved connectivity for multimodal options to and from community amenities.
• Encourage new residential development that features mixture of housing variety including size, price, and design.
• Promote innovative neighborhood design to limit land consumption and create publicly accessible open spaces.
• Limit large-scale subdivisions to maintain the existing rural character.
• Encourage the conservation of the natural landscape especially along surrounding environmentally sensitive areas.
• Minimize environmental impact through cluster development that preserves open space within development areas.
• Create permanent open spaces or conservation areas over time.
• Enhance the look and functionality of corridors while still supporting the commercial needs of the City.
• Encourage multimodal connectivity to surrounding mixed-use areas.
• Create more intense development near key intersections.
• Limit traditional big box development as part of new construction while encouraging the redevelopment of existing big box developments.
• Cultivate local businesses.

• Maintain existing light industrial activities and ensure these uses do not conflict with nearby non-industrial sites (particularly residential uses).
• Encourage the growth of light industrial uses that have limited off-site impact and heavy vehicle activity.
• Preserve light industrial land uses whenever possible. However, properties on the edge of other districts or in areas where land uses are quickly changing could be considered for a new use.
• Provide areas for automobile-oriented service uses and/or non-retail commercial and office uses such as self storage.


• Locate and/or buffer heavy industry uses to minimize offsite impacts to non-industrial uses.
• Identify specific locations with the appropriate infrastructure and buffers for large-scale industrial activity.
• Preserve industrial land for designated uses whenever possible. However, properties on the edge of other districts or in areas where land uses are quickly changing could be considered for a new use.
• Accommodate the ingress and egress of heavy vehicle that support on-site industrial operations.
Appropriate
Appropriate

• Features unique places and uses within the study area that are likely to have their own master plan now or in the future (e.g., ETSU, the Veterans Affairs Hospital).
• Highlights regional parks identified in the Parks and Recreation Master Plan (e.g., Buffalo Mountain, Tannery Knobs, Rocky Mount, Tipton-Haynes, Keefauver Farm, and Winged Deer Park).
Policy Q1.1: Align de velopment with Johnson City’s vision and long-term growth strategies.
• Q1.1.1: Evaluate the Horizon 2045 Growth Management Plan every five years and prepare a thorough update every 10 years.
• Q1.1.2: Utilize the Future Land Use Map (FLUM) to guide the location, type, and scale of development.
• Q1.1.3: Review the FLUM on an annual basis to ensure consistency with market dynamics and recent planning initiatives.
• Q1.1.4: Update the City’s zoning ordinance, subdivision regulations, and other applicable land development regulations into a unified development ordinance to modernize local development standards and codify the Future Land Use Map.
• Q1.1.5: Maintain regular meetings with the Growth Management Committee to support collaboration between City Departments.
• Q1.1.6: Develop a fiscal impact model to evaluate proposals for development and redevelopment so that the costs and benefits to the community can be considered during decision making.
Policy Q1.2: Maintain the character of existing neighborhoods while accommodating gro wth in appropriate locations and densities to ensure compatibility.
• Q1.2.1: Prepare focused master planning studies for areas of Johnson City that are undergoing substantial change or have increased growth pressures.
• Q1.2.2: Establish guidelines to ensure new developments are compatible with surrounding areas.
• Q1.2.3: Encourage the redevelopment of underutilized sites by aligning incentives with the preservation of community character and identity.
Policy Q1.3: F oster public-private partnerships to support desirable growth.
• Q1.3.1: Work with development interests (developers, builders, real estate professionals, etc.) to inform them about Horizon 2045 in general, highlighting the Placetype concept and the new opportunities for development in Johnson City.
• Q1.3.2: Partner with developers to integrate affordable housing, green spaces, and community amenities into new developments.
• Q1.3.3: Collaborate with local businesses and institutions to identify opportunities support job creation.

Policy Q2.1: Continue to coordinate infrastructure and service deliv ery with growth areas.
• Q2.1.1: Formalize a process that considers the current utility master plan in rezoning and annexation approvals to ensure new development is aligned with infrastructure capacity.
• Q2.1.2: Develop an infrastructure assessment tool to evaluate the readiness of areas for new development based on the existing infrastructure network.
• Q2.1.3: Continue to coordinate the annexation process to carefully consider the availability of community infrastructure and services.
• Q2.1.4: Establish methods to guide development or incentivize development in areas identified as ready for growth.
• Q2.1.5: Ensure interdepartmental collaboration to develop a prioritization plan for infrastructure investments in high-growth areas.
Policy Q2.2: Optimiz e the use of existing infrastructure reduce costs of environmental impacts.
• Q2.2.1: Encourage growth in areas already served by public utilities, transportation networks, and schools.
• Q2.2.2: Continue to update the utility master plan every 15 to 20 years to reflect relevant growth trends.
• Q2.2.3: Continue to work with surrounding jurisdictions to plan for shared services near jurisdictional boundaries.
• Q2.2.4: Engage with community stakeholders to identify and prioritize infill site opportunities.
Objective Q3. Use the built environment to contribute to the community’s quality of life.
Policy Q3.1: Ensure new de velopments enhance livability and promote public health.
• Q3.1.1: Encourage the inclusion of parks, trails, and other recreational amenities in development plans.
• Q3.1.2: Promote walkable and bike-friendly design in residential and mixed-use areas.
• Q3.1.3: Ensure City-led sidewalk projects align with this plan to complete priority connections, while updating zoning regulations to support sidewalk continuity in appropriate areas.
Policy Q3.2: Support responsible gro wth that meets the needs of all residents.
• Q3.2.1: Evaluate and update zoning to allow for a variety of housing types, including affordable, supportive, and workforce housing.
• Q3.2.2: Continue to identify areas that are underserved in housing options, transportation or utility infrastructure, or other amenities, and prioritize investments that address those disparities.
Policy Q3.3: Protect and enhance natural and cultural resources as part of de velopment.
• Q3.3.1: Explore new guidelines for preserving open space, waterways, and scenic views in new projects.
• Q3.3.2: Partner with local organizations to restore and maintain environmental assets.
Strong neighborhoods are the building blocks of a vibrant, thriving community. This chapter explores how Johnson City can enhance and support its neighborhoods by fostering housing options that meet the diverse needs of residents while also preserving the character and identity of the City’s unique neighborhoods. Building on an understanding of existing housing conditions, this framework presents strategies to encourage welcoming, livable, and adaptable neighborhoods for generations to come.
Analyzing the housing supply and market conditions in Johnson City helps align policy with future land use decisions and future housing needs. The analysis of existing housing conditions in the Study Area are compared to the City of Johnson City and the Johnson MSA. This snapshot of housing presents data from a variety of sources including the US Census, American Community Survey 5-Year Estimates, and Washington County.
The Preliminary Housing Needs Assessment was developed in 2022 by Bowen National Research and an updated version was published in 2025. The goal of the Housing Needs Assessments is to understand the current housing stock and projected changes that will influence future housing needs. The assessment provides a comprehensive analysis of demographic, employment, and housing projections, offering valuable insights to help guide local policies and priorities. As the city continues to grow, these findings serve as a foundation for understanding the challenges and opportunities related to housing supply, affordability, and accessibility.
Key Findings and Considerations:
The assessment revealed several critical takeaways that highlight the importance of proactive planning to address evolving housing needs:
• Based on current trends and average lot sizes, the City is projected to need approximately 520 acres of residentially zoned land by 2027 to support future growth. Strategically planning and designating land for residential uses will be essential to meeting this demand.
• In 2022 the Housing Needs Assessment predicted that Johnson City had a gap of 4,859 units. In 2025, when the study was updated, that housing gap grew to 5,557 units. It can be concluded that without significant consideration/action from local government that this gap will continue to widen.
• In 2022 the Housing Needs Assessment showed 20.9% of renters in Johnson City as severely cost burdened meaning that they are spending more than 50% of their income on rent and utilities. In 2025 that percentage grew by 1.4% and stated that 22.3% of Johnson City renters are severely cost burdened.
• Occupancy rates for rental housing was 99% or above in both the 2022 and 2025 study. Expanding the availability of rental options, especially those affordable to moderate-income households, will help address the City’s low vacancy rates and increasing rental demand.
• From the 2022 study to the 2025 study the median increase in rental properties was 24%-35%. Showing an annual rent increase of 12%-17.5%
• Housing affordability remains a significant concern, particularly for low- to moderate-income families. The City is encouraged to continue offering incentives for developers to build affordable units and consider strategies such as reduced building fees to stimulate development that supports these income groups.
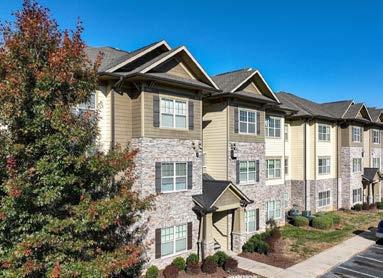
Housing in the study area, which includes the area within the Urban Growth Boundary (UGB), is mostly single-family detached homes, comprising nearly 60% of all units. Multifamily units comprise more than 30% of units in the Study Area, driven, in part, by a large student population at ETSU who choose to live throughout the community, not just on campus.
HOUSING UNIT BY TYPE, 2023
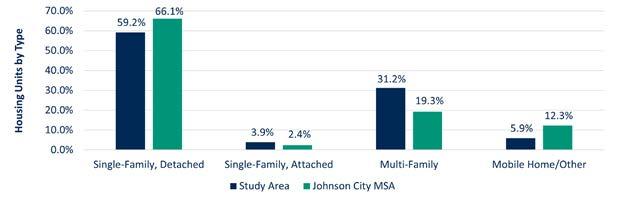
Source: US Census; Kimley-Horn
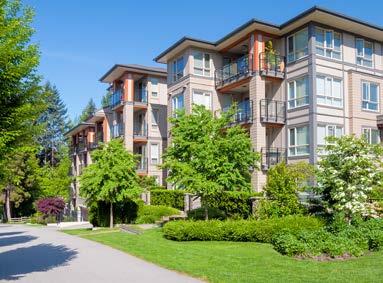
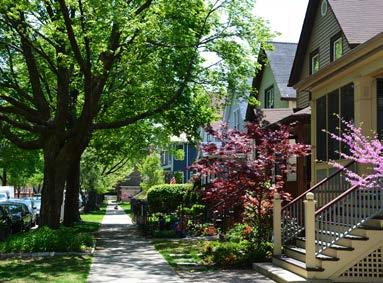
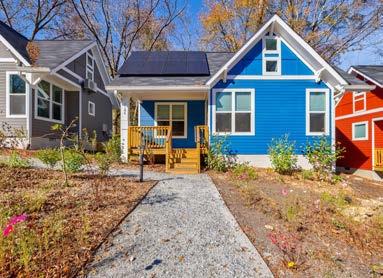
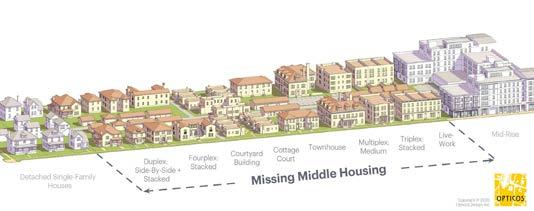
Missing Middle Housing, a term coined by Daniel Parolek of Opticos Design, refers to multifamily housing types that fall between single-family homes and larger apartment complexes. These housing types, such as duplexes, triplexes, quadplexes, townhomes, and small-scale multifamily developments, are designed to blend seamlessly into residential neighborhoods while providing more diverse and attainable housing options. Historically, Missing Middle Housing was a common part of many neighborhoods, but these housing types have become less prevalent over time despite growing demand. In Johnson City, like many communities across the country, the majority of the housing stock consists of single-family homes. This concentration of one housing type limits options for residents at different life stages and income levels, contributing to affordability challenges and reduced neighborhood diversity.
The demand for Missing Middle Housing is particularly strong among younger professionals seeking walkable, amenityrich environments and older adults looking to downsize without leaving familiar communities. Neighborhoods near Downtown Johnson City, as well as other established areas with existing infrastructure and services, present key opportunities for introducing Missing Middle Housing through infill development. As more residents prioritize smaller homes in convenient, pedestrian-friendly locations over larger homes with longer commutes, Missing Middle Housing can provide the types of living environments that align with these lifestyle preferences.
By continuing to explore policies that support these types of developments, such as accessory dwelling units (ADUs), townhome clusters, and small multifamily buildings, Johnson City can diversify its housing supply while maintaining neighborhood character. Incremental density through Missing Middle Housing provides a way to add more homes gradually, blending seamlessly into neighborhoods without overwhelming their character. Promoting these options will allow more residents to live, work, and enjoy the community while supporting the City’s long-term growth goals.
The number of housing units in the Study Area has increased at a faster rate (8.8%) when compared to Johnson City or the larger MSA. While new housing has been added in the Study Area, it has not kept pace with the overall demand, as housing units are growing at a slower pace than both population (13.2%) and household growth (11.6%). Ensuring a balanced housing supply will be important to meeting future demand and providing a variety of housing options that support Johnson City’s growing population.
The map showcases property values of acreage in the Study Area zoned for single-family housing. Housing in the Study Area tends to be less expensive farther from Johnson City’s Downtown and in areas outside the City limits. Housing located near the lake is also priced higher than housing located away from the lakefront.
RESIDENTIAL PROPERTY VALUES MAP
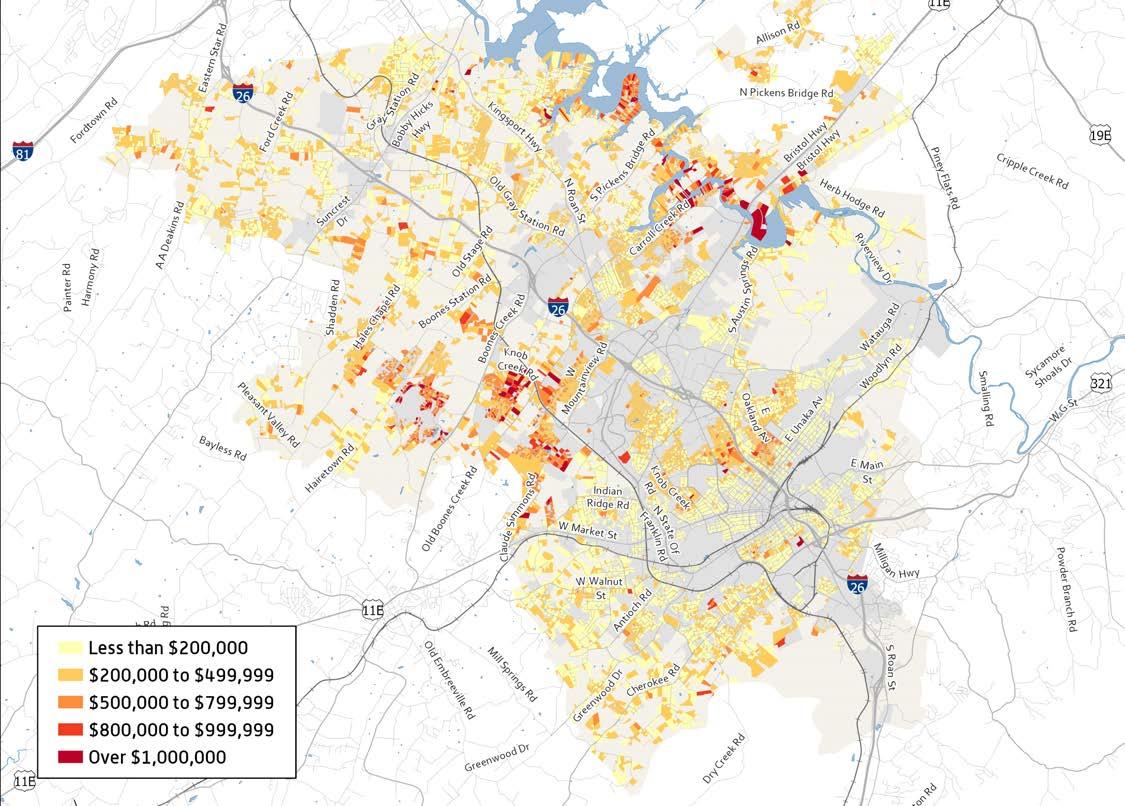
The cost of housing in Johnson City has surged in recent years, although market conditions are beginning to stabilize. According to data from the Northeast Tennessee Association of Realtors and the Federal Reserve Bank of St. Louis, the median listing price in the Johnson City MSA increased from $199,425 in 2019 to $346,250 in 2025, a 74% increase. This sharp rise in home prices is largely driven by pandemic-era population influx and construction cost pressures, which has placed homeownership increasingly out of reach for many households. A household income of over $120,000 is needed to afford a typical home in the City.
Rental costs have also increased, rising by approximately 50% since 2020, while vacancy rates remain among the lowest in East Tennessee. According to the 2025 Housing Needs Assessment, 42% of renters in Johnson City are costburdened, spending more than 30% of their income on housing, and 22.3% are severely cost-burdened, spending over 50%. Among homeowners, 16.1% are cost-burdened and 7.6% are severely cost-burdened. Johnson City’s five-year housing gap, identifies a projected need for 3,087 additional for-sale units and 2,470 rental units by 2025. The most significant gaps exist in moderate-income for-sale housing (priced between $179,734 and $301,200) with a shortfall of over 1,680 units, and extremely to very low-income rental housing, with over 1,000 units needed.
These challenges are particularly acute for ALICE (Asset Limited, Income Constrained, Employed) households, which include residents who earn above the federal poverty level but struggle to cover basic living expenses. In Washington County, ALICE households make up a 40% of the workforce, meaning a single financial setback, such as a medical emergency or job loss, could affect their current living situation. Addressing affordability will require a multifaceted approach. Zoning reforms that allow for accessory dwelling units (ADUs), duplexes, and small multifamily developments can increase housing supply, while mixed-use zoning and reduced lot size requirements can support more compact, cost-effective development. Density bonuses, tax abatements, and expedited permitting can further incentivize private-sector investment in affordable housing. Rehabilitation grants and tax incentives can help landlords maintain lower rents, while land banking strategies can reserve sites for future affordable housing. As property values continue to rise, proactive solutions will be essential to ensure that housing remains accessible for residents across all income levels. A coordinated effort between the public and private sectors will be key to balancing growth with long-term affordability.
The average household size in the Study Area closely aligns with Johnson City and the broader MSA. While household sizes remain relatively stable across geographies, declines in household sizes reflect a broader regional and national trend toward smaller household compositions. Providing a range of housing options that accommodate shifting household dynamics is important to consider as household sizes decline.
Source: US Census; Kimley-Horn AVERAGE HOUSEHOLD SIZE, 2023
Study Area Johnson City
The Study Area has a higher share of houses built after 1990 (42.1%), compared to the MSA (39.9%) and Johnson City (38.2%). The median year built in Johnson City is 1980, slightly older than the Study Area (1984) and the MSA (1982). New housing production has slowed in recent years, considering less than 1% of the housing stock in the Study Area, City and MSA has been built since 2020.
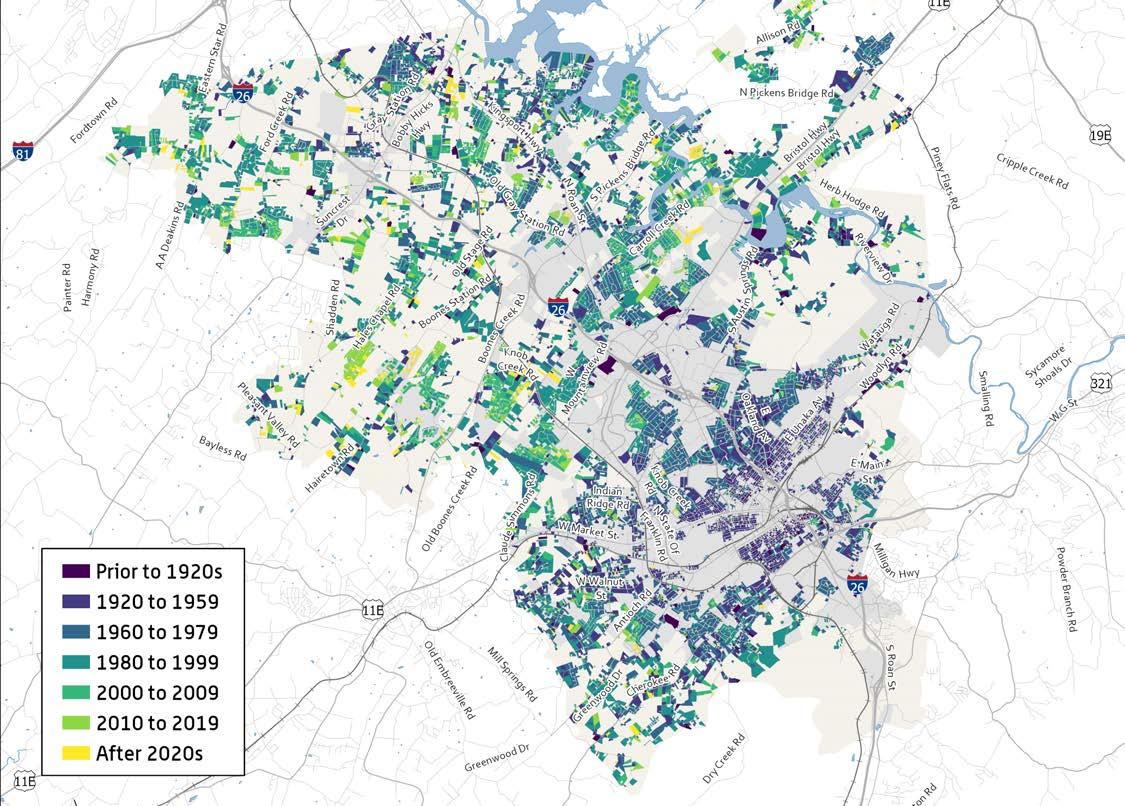
Source: US Census; Kimley-Horn
From 2010 to 2023, the vacancy rate in the Study Area decreased 2.4% — alluding to a lessening availability of housing. While owner-occupied housing has remained relatively stable, renter-occupied units have grown, reflecting shifts in housing preferences. It will be important to ensure a balanced mix of owner- and renter-occupied housing to accommodate evolving housing needs.
OCCUPANCY
From 2010 to 2023, the vacancy rate in the Study Area decreased 2.4% — alluding to a lessening availability of housing.
Policy N1.1: Maintain, protect, and revitalize City neighborhoods and residential areas.
• N1.1.1: Support the creation of active neighborhood organizations.
• N1.1.2: Continue to inventory infrastructure needs in older neighborhoods and create a plan for prioritizing necessary improvements.
• N1.1.3: Seek opportunities for beautification in older neighborhoods.
Policy N1.2: Develop and implement neighborhood plans to formalize strategies to stabilize and improve neighborhoods, for ultimate adoption by the City Commission.
• N1.2.1: Create a Housing and Neighborhood Coordinator position for the City of Johnson City to tie together strategic efforts in the Planning and Development and Economic Development Departments.
• N1.2.2: Establish a Neighborhood Task Force to engage a diverse group of stakeholders to implement the Strong Neighborhoods objectives and strategies of Horizon 2045.
• N1.2.3: Create a list of neighborhoods for which strategy plans should be prioritized.
• N1.2.4: Develop plans in partnership with the community, including neighborhood organizations, business owners, and other interested stakeholders.
Policy N1.3: Promote the rehabilitation of deteriorating or substandard residential properties.
• N1.3.1: Identify areas of dilapidated housing and substandard residential properties and target code enforcement and home rehabilitation/reconstruction programs in those areas.
• N1.3.2: Create a diverse toolkit of incentives for housing rehabilitation, reuse of vacant units, and replacement of demolished units through collaboration with and support of the Housing and Community Development advisory board.
• N1.3.3: Leverage Community Development Block Grant funds to assist private citizens in the rehabilitation of their properties.
• N1.3.4: Explore code officer stratification and other personnel measures to ensure adequate enforcement coverage.
Policy N1.4: Encourage the preservation of Johnson City’s historic residential structures and sites and protect the character of existing historic neighborhoods through zoning regulations and historic guidelines enforcement.
• N1.4.1: Create a comprehensive inventory of historic residential structures and sites.
• N1.4.2: Review historic district boundaries every five years. Consider creating new districts based on the inventory of historic residential structures and sites.
• N1.4.3: Protect historic and/or urban residential areas from uses and buildings which are out of character and scale with the surrounding neighborhood.
• N1.4.4: Coordinate with neighborhood organizations to ensure that historic assets in neighborhoods are protected, maintained, restored, or renovated.
Policy N1.5: Improve connectivity and walkability in residential and mixed-use areas to enhance quality of life, public safety, and public health.
• N1.5.1: Inventory residential and mixed-use areas that have connectivity and walkability challenges.
• N1.5.2: Install or maintain appropriate pedestrian and bicycle facilities, such as sidewalks, crosswalks, or bike paths, to promote active transportation.
• N1.5.3: Provide opportunities for parks and other green/open spaces, in coordination with the Parks and Recreation Master Plan, to be incorporated into or near neighborhoods.
Historic preservation safeguards Johnson City’s architectural, cultural, and scenic heritage, strengthening both the local economy and environment. The 2021-2025 Bridge Plan outlines efforts to map historic resources, collaborate with neighborhood groups, and expand Historic Districts. The City has two designated Historic Districts. The Johnson City Commercial Historic District encompasses part of Downtown, featuring historic commercial buildings dating from 1887 to 1953, with Victorian, Classical Revival, and Art Deco architecture. The Tree Streets Historic District, a diverse neighborhood of tree-lined streets and homes from the late 19th and early 20th centuries, showcases a range of historic architectural styles. Efforts to expand historic recognition continue, with several areas under consideration for future designation:
• Langston-Hankal-Armstrong
• The Avenues
• Lamont-Hamilton-Wilson Area
• Gump Addition / Llewellyn Wood
• Holston/Chilhowie/10th/11th
• Carnegie Addition
• Hillcrest
• Flourville area in the Boones Creek community
• Gilmer Park
• West Davis Park
• Knob Creek
• Oakland Gardens
• Humphries
• Buffalo Street
• Reeves/Carr House [Wheatland]
• Peter Miller Reeve [Sinking Spring]
• East Tree Street [Tweetsie Streets]
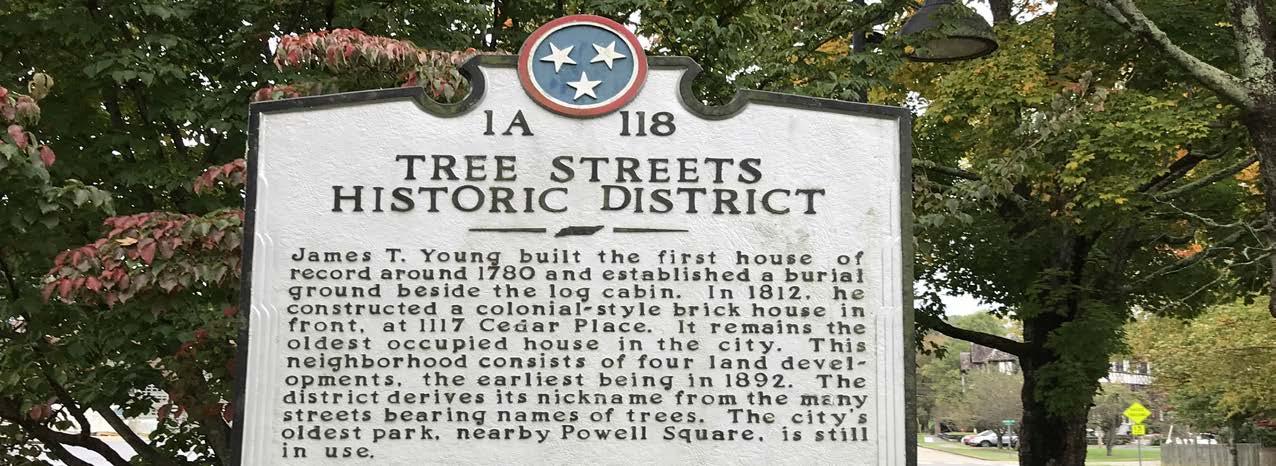
Johnson City’s core residential areas, including historic neighborhoods like the Tree Streets, reflect traditional neighborhood design (TND) principles. These neighborhoods integrate small-scale commercial and service uses within walking distance of residential areas, providing convenient access to activity and employment centers while maintaining a strong sense of community. TND prioritizes a well-connected street network that supports pedestrians, cyclists, and vehicles, improving transportation choices, emergency response times, and overall safety. Key design features include narrow front setbacks, front porches, alley-loaded parking, and buildings oriented toward the street, reinforcing neighborhood character and promoting social interaction. The incorporation of parks, schools, and civic buildings within walking distance enhances accessibility, while more narrrow streets with crosswalks and streetscaping improve pedestrian safety and traffic flow. These elements create lasting community value, offering diverse housing options that accommodate both aging populations and younger generations.
Policy N2.1: Align and coordinate goals for housing supply outlined in the 2023 Johnson City Strategic Plan, the Housing Needs Assessment (2025), and the Horizon 2045 Growth Management Plan.
• N2.1.1: Support the development of housing choices that reflects compatibility of scale and creation of place as defined in the FLUM.
• N2.1.2: Develop a Housing Action Plan that outlines a detailed strategy to address the housing needs for residents of all income levels in Johnson City.
• N2.1.3: Coordinate implementation actions with the Johnson City Housing Authority’s annual plan.
Policy N2.2: Update the City’s zoning ordinance to increase housing choices within zoning districts that offer access to goods, services, and transportation options.
• N2.2.1: Align zoning with Placetype maps to increase the variety of housing options, sizes, and densities in strategic locations.
• N2.2.2: Review zoning districts that are appropriate for accessory dwelling units (ADUs) and provide best practice examples and standard plans for structures.
• N2.2.3: Examine and implement processes to facilitate the development of small-scale residential projects such as duplexes, triplexes, and fourplexes (also known as Missing Middle Housing).
• N2.2.4: Engage housing agencies, code enforcement, building officials, developers, etc., to coordinate strategies to increase, preserve, and improve local housing options.
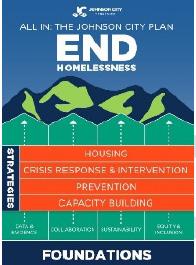
The City-Wide Strategic Plan to Reduce Homelessness (2025-2027) provides a datadriven strategy to address homelessness through housing-first policies, crosssector partnerships, and targeted interventions. Johnson City serves as a major hub for social services in the region and draws a larger share of unhoused individuals compared to surrounding areas. The City’s approach emphasizes prevention, crisis response, and long-term housing stability to ensure homelessness remains rare, brief, and non-recurring. The Strategic Plan adopts the United States Interagency Council on Homelessness (USICH) model, prioritizing permanent housing as the foundation for addressing homelessness.
The City recognizes the health risks associated with unsheltered homelessness and is working to increase noncongregate shelters, emergency housing, and transitional programs.
The strategic plan calls for stronger collaboration between landlords, housing agencies, and non-profits to mediate disputes, provide short-term financial relief, and connect tenants with case management services. Increasing access to rental counseling, legal representation for tenants facing eviction, and flexible assistance funds will help stabilize atrisk households before they experience homelessness.
Johnson City has prioritized leadership in homelessness response by hiring two full-time homeless outreach coordinators and contracting with a homeless policy strategist. These roles aim to strengthen collaboration among service providers, improve data tracking through the Homeless Management Information System (HMIS), and enhance outreach in emergency housing situations.
Johnson City is working to eliminate regulatory, financial, and systemic obstacles that prevent vulnerable populations from securing stable housing. Efforts include evaluating zoning and land-use policies to allow for more diverse housing types. The City is exploring ways to reduce financial burdens, by expanding rental assistance programs and landlord incentive initiatives.
The plan highlights the need to streamline application processes for housing programs, ensuring that residents facing homelessness, low-income renters, and individuals with disabilities can more easily access available resources.
Individuals experiencing homelessness in Johnson City face significant health disparities due to limited access to medical care, mental health services, and substance use treatment. To address these challenges, the City is working to expand street outreach programs, integrate healthcare services with housing initiatives, and increase access to behavioral health support.
Johnson City is launching community education campaigns to reduce stigma around homelessness and encourage public involvement in long-term solutions. The plan emphasizes workshops, public forums, and outreach materials that highlight the challenges faced by unhoused individuals and the effectiveness of evidence-based solutions.
Policy N2.3: Reevaluate fee structures, zoning ordinances, permitting and inspection processes, and other polices to encourage housing development that meets community goals.
• N2.3.1: Assess development costs annually to better understand gaps in delivering housing supply of different types and price points.
• N2.3.2: Prepare a comprehensive assessment to identify gaps, obstacles, and opportunities in development review and building permit processes to increase efficiency and reduce developer risk.
• N2.3.3: Assess vacant lots owned by Johnson City or faith-based organizations for appropriateness to support the increase in housing supply.
• N2.3.4: Explore ways to supplement tap fees, permit fees, and building review fees to support the construction of housing that meets community goals for supply and affordability.
• N2.3.5: Evaluate the feasibility and potential impacts of modifying parking requirements for housing units serving very low, low, and moderate-income households in areas with strong transportation and mobility options.
Policy N2.4: Establish and promote housing programs to support households with targeted needs, including very low/low-income households, the unhoused, licensed group homes/permanent supportive housing, and housing that supports aging populations.
• N2.4.1: Align housing strategies for the homeless with the Strategic Plan to Reduce Homelessness report.
• N2.4.2: Review and update the zoning ordinance to refine the location of shelters, transitional housing, independent living, assisted living, nursing home facilities, housing for special needs individuals, and other housing that meets community needs.
• N2.4.3: Coordinate with organizations that provide emergency shelter, transitional housing, and permanent supportive housing to special needs individuals and families.
• N2.4.4: Assess establishing a housing trust fund or creating a land bank to support the development of housing targeting very low, low, and moderate-income households.
• N2.4.5: Assist in obtaining financial assistance and incentives for the construction of independent living and assisted living facilities for very low, low, and moderate-income individuals and families.
• N2.4.6: Provide governmental funding to expand and maintain organizations that address the needs of the homeless.
Policy N2.5: Promote opportunities for first-time homebuyers, including existing federal and state housing programs and informational seminars.
• N2.5.1: Encourage the use of federal and state housing programs by non-profit and for-profit housing developers.
• N2.5.2: Coordinate with housing partners to conduct educational seminars for potential first-time home buyers.
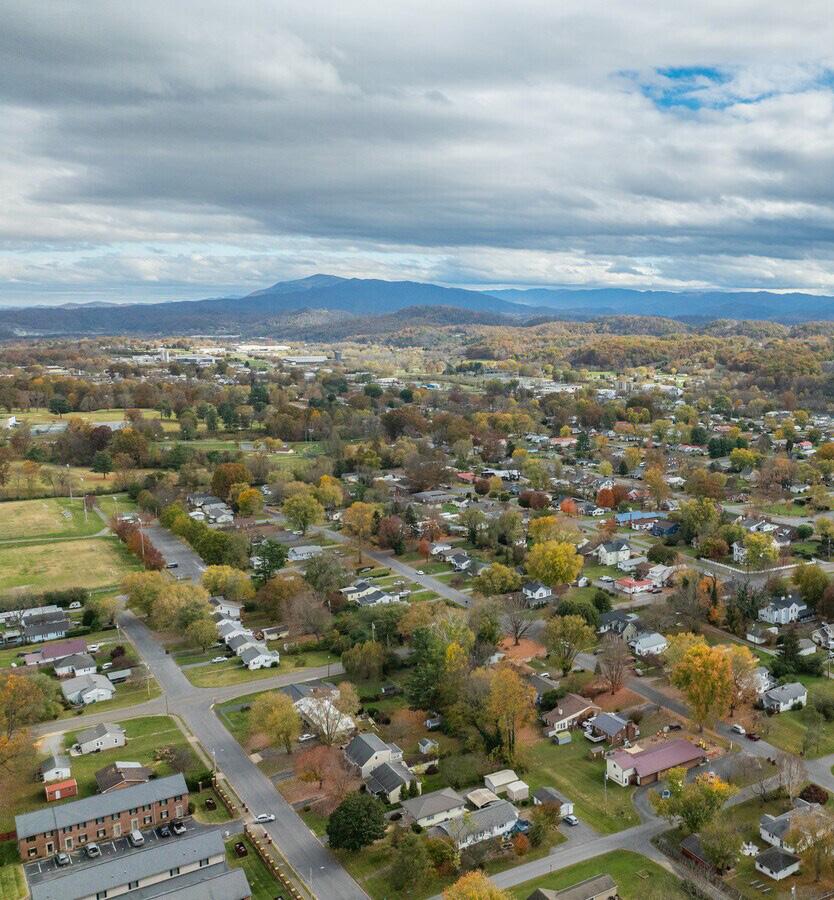
A thriving local economy is essential for the long-term success and sustainability of Johnson City. This chapter focuses on understanding the strengths and opportunities within the City’s economy and workforce. By examining current economic conditions, this framework emphasizes the importance of supporting existing businesses, fostering job creation, and building a diverse economic base. Through intentional planning and forward-thinking strategies, Johnson City can continue to grow its economy while ensuring opportunities are accessible to all residents.
Johnson City contains numerous economic nodes for commerce and employment. Understanding the City’s economic engine helps track and plan investments to drive economic growth where it makes sense. Not all economic activities are appropriate in every area, so being intentional about these activities will help Johnson City meet the needs of residents. Existing economic conditions in the Study Area are compared to the City of Johnson City and the Johnson MSA to provide a baseline of information to create a list of actionable strategies for implementation.
The median household income in Johnson City is roughly comparable to the Study Area and the larger MSA. While households earning between $50,000 and $74,999 annually make up the largest share in the Study Area and the MSA, it is important to note that 31.2% of households in the Study Area earn less than $35,000. Understanding these income dynamics helps guide efforts to support economic opportunity, business growth, and a resilient local workforce.
MEDIAN HOUSEHOLD INCOME, 2023
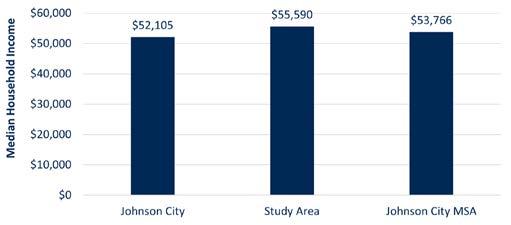
Sources: ESRI Business Analyst Online; Kimley-Horn
INCOME BY HOUSEHOLDS, 2023
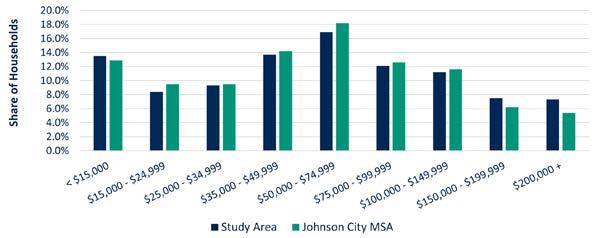
Median household income in the Study Area is expected to grow nearly 16% by 2028, compared to 15% growth in Johnson City. Income growth is only expected to hit 14.4% in the MSA. This upward trend reflects a strengthening local economy and expanding job opportunities across key industries. While income growth signals positive economic momentum, ensuring that wages keep pace with the rising cost of living will be essential to maintaining economic resilience and broadening access to opportunity.
Healthcare and Social Assistance is the largest employment sector, accounting for over 31% of jobs in the Study Area. This sector is driven by major employers like the Johnson City Medical Center, Franklin Woods Community Hospital, and the Veterans Affairs Medical Center. Other key industries include retail trade, professional and technical services, and manufacturing.
As Johnson City continues to grow, maintaining an adaptable workforce is important to sustaining economic momentum and meeting the needs of both employers and job seekers. Johnson City is part of dynamic region that is working to bring new jobs and support existing industry. Following the 2007-2009 Great Recession, the region added an average of 550 jobs per year. Consistent with national trends, the region was impacted by the onset of the COVID-19 pandemic, but experienced rapid recovery in 2021 and 2022, adding more than 5,000 new jobs back in the local economy.
EMPLOYMENT BY SECTOR, 2023 NET NEW JOBS IN JOHNSON CITY MSA PER YEAR
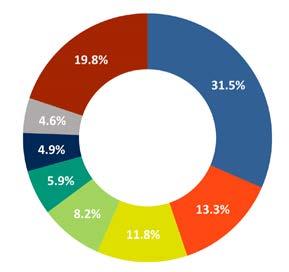
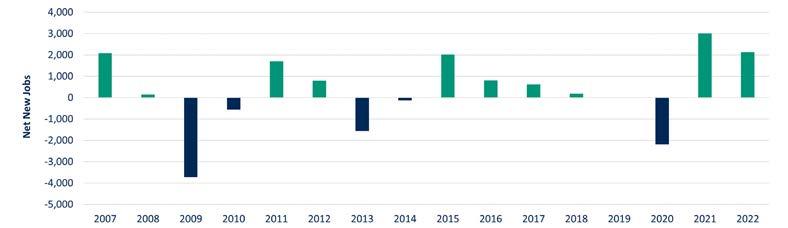
In the Study Area, 31.5% of workers are employed in the healthcare an social assistance industry.
Unemployment in the Johnson City MSA has remained relatively stable in recent years, closely mirroring state trends. While the region experienced a sharp increase in job losses during the COVID-19 pandemic, recovery efforts led to a swift rebound, bringing unemployment rates back in line with pre-pandemic levels. Maintaining this stability will require continued investment in workforce development and economic diversification to ensure job opportunities remain accessible across all sectors.
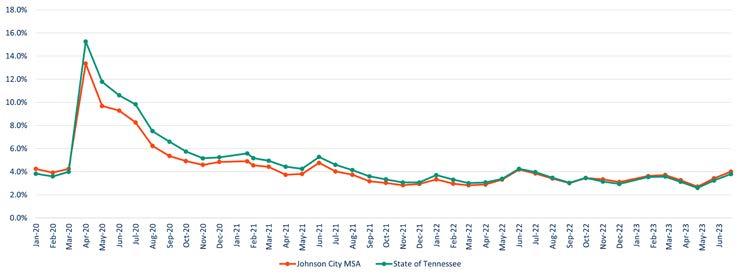
The Study Area accounts for more than 70% of the full-time jobs in the MSA. An employment forecast was prepared for the Study Area through 2045 and further detailed into 5-, 10-, 15-, and 20-years. Forecasts for the Study Area incorporate a moderate and high growth scenario to account for unknowns in a longer timeframe. The Study Area is expected to increase to between 68,100 and 74,400 jobs by 2045, or approximately an additional 10,000 to 20,000 jobs.
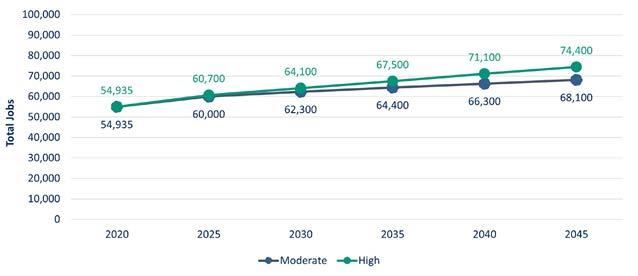
Combined, the healthcare and education sectors employ nearly 10,000 people in Washington County. According to Washington County, the major employers (healthcare, education, and otherwise) in the County include;
• Ballad Health
• East Tennessee state University
• Citi Commerce Solution
• American Water Heater Company
• James H. Quillen VA Medical Center
• Washington County School System
• City of Johnson City
• Johnson City School Systems
• AT&T Mobility

The job density map highlights concentrations of employment activity, with the highest densities primarily located along I-26 and Downtown, where major healthcare, education, and retail employers anchor the economy. The highest job densities are found around Ballad Health, East Tennessee State University, and the James H. Quillen VA Medical Center.
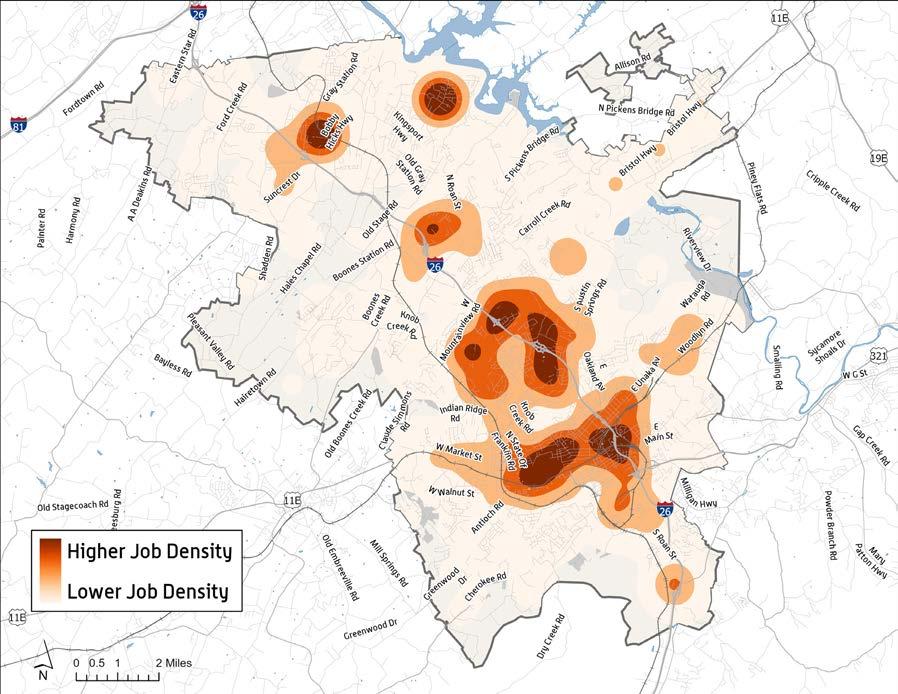
Source: LEHD On The Map
Eds and Meds refers to the education and healthcare sectors, two of the strongest economic drivers in Johnson City. East Tennessee State University (ETSU) and Ballad Health anchor these industries, providing stable jobs, attracting investment, and fueling long-term growth. The healthcare and social assistance sector alone accounts for over 31% of local employment, making it the region’s dominant industry. ETSU has invested $44 million in Integrated Health Services and is developing University Innovation Park, a future hub for research and workforce development.
Beyond job creation, these institutions lead research, workforce training, and medical innovation. Ballad Health, one of the region’s largest employers, is expanding Niswonger Children’s Hospital with a $30 million investment, strengthening Johnson City’s position as a regional healthcare hub. With increasing demand for skilled workers in healthcare, biosciences, and advanced research, expanding partnerships between ETSU, local businesses, and workforce development programs will be essential. As the City grows, investing in education and healthcare infrastructure, fostering innovation hubs, and supporting workforce retention strategies will drive long-term prosperity.
Objective P1. Maintain a vibrant local economy.
Policy P1.1. Support business investments that create economic and employment opportunities for all residents.
• P1.1.1: Develop a comprehensive Economic Development Strategic Plan to guide the City’s economic growth efforts, identify target industries, and outline implementation strategies.
• P1.1.2: Facilitate infrastructure planning and service provision to support business growth.
• P1.1.3: Establish incentive programs that align with the City’s target industries and economic development priorities.
• P1.1.4: Review publicly owned properties for their appropriateness to host economic development generating land uses.
• P1.1.5: Maintain and promote an inventory of commercial and industrial sites to attract investment and guide land use decisions.
Policy P1.2: Promote business retention and expansion to sustain and strengthen the local economy.
• P1.2.1: Regularly review and update zoning ordinances to ensure they accommodate emerging industries and evolving market trends.
• P1.2.2: Continue to provide a tracking system to monitor business retention rates.
Policy P1.3: Maintain Johnson City’s position as a regional retail and experience destination.
• P1.3.1: Identify and promote key commercial corridors and retail nodes that align with future land use plans and market demand.
• P1.3.2: Implement wayfinding and branding initiatives to enhance Johnson City’s visibility as a regional shopping and entertainment hub.
• P1.3.3: Research and act upon opportunities to develop targeted incentives and partnerships to attract experiential retail, dining, and entertainment options that align with evolving consumer preferences.
• P1.3.4: Ensure transportation and mobility plans support easy access to major retail destinations, including multimodal connectivity and parking management strategies.
• P1.3.5: Periodically assess the City’s retail market conditions to identify shifts in consumer behavior and adjust land use strategies accordingly.
• P1.3.6: Support tourism-driven businesses by collaborating with the Convention and Visitors Bureau to promote events and shopping experiences.
Johnson City’s commercial areas support the local economy by providing a mix of retail, dining, employment, and services in key locations across the City. These areas vary in scale, from regional shopping destinations like The Mall at Johnson City, which serves as the largest retail hub in Northeast Tennessee, to smaller neighborhood activity centers that cater to daily needs, such as the Food City Development on North State of Franklin. As the City grows, these hubs must continue adapting to evolving market trends, supporting a diverse mix of businesses and employment opportunities.
Beyond retail, these centers act as economic drivers and community gathering spaces, fostering local entrepreneurship and supporting workforce development. Boones Creek Development District, a designated economic growth corridor, continues to attract business investment, while mixed-use projects near Downtown Johnson City are reinforcing walkability and vibrant public spaces. However, aging commercial corridors and underutilized shopping centers present opportunities for revitalization and adaptive reuse. Encouraging redevelopment, infill projects, and public-private partnerships can help modernize these spaces making them more viable for emerging industries, entertainment, and mixeduse development. Ensuring these commercial centers remain economically competitive and accessible requires revitalization strategies, infrastructure investment, and incentives for small businesses and entrepreneurs.
Objective P2. Support a variety of job sectors to meet the needs of the community workforce.
Policy P2.1: Support entrepreneurship and innovation to foster job diversity.
• P2.1.1: Explore the creation of a maker space and co-working hubs to foster innovation and small-business development.
• P2.1.2: Promote business incubators and accelerator programs to support entrepreneurs and emerging industries.
Policy P2.2: Leverage regional partnerships to attract and retain a diverse range of employers.
• P2.2.1: Collaborate with regional economic organizations to market Johnson City as an attractive location for diverse, high-wage industries.
• P2.2.2: Work with state and federal partners to identify grant opportunities that support economic diversification.
Policy P2.3: Maintain a balanced tax base that is competitive for business investment.
• P2.3.1: Conduct a periodic review of the City’s revenue streams with peer cities to identify potential adjustments to support business growth.
• P2.3.2: Explore tax-based incentive programs, such as tax increment financing (TIF) districts, to attract and retain businesses in strategic growth areas.
Policy P2.4: Strengthen workforce development initiatives that align with current and future economic demands.
• P2.4.1: Partner with local educational institutions, including ETSU and technical colleges, to align curriculum offerings with the City’s target industries and workforce needs.
• P2.4.2: Continue to support the First Tennessee Development District to regularly evaluate employment trends and provide recommendations for policy adjustments.
• P2.4.3: Promote workforce housing and childcare initiatives to support a stable workforce by aligning workforcesupportive development with employment centers.
Retail Market Overview
The retail sector in Johnson City is an important component of the local economy and is supported by strong demand. As of early 2025, the City’s retail vacancy rate stands at a low 1.7%, significantly outperforming the five-year market average of 2.3% and the 10-year average of 3.6%. The market has absorbed approximately 14,000 square feet of new retail space over the past year. Retail rents are at $16.30 per square foot, and have grown by 3.3% year over year, surpassing the national average growth rate of 1.8%, with neighborhood centers and general retail properties seeing the most consistent increases. Currently, 34,000 square feet of retail space is under construction, signaling continued investor confidence in the local market. Johnson City’s retail landscape includes a mix of shopping centers from small neighborhood centers to a regional mall, with a total retail inventory of 11.8 million square feet. The Mall at Johnson City remains a dominant regional shopping destination, while neighborhood and strip centers continue to serve local demand.
Office Market Overview
The Johnson City office market has a 2.2% vacancy rate, which is lower than the five-year market average of 2.5% and the 10-year average of 4.0%. The past year saw 130,000 square feet of net absorption, despite no new office space being delivered. Currently, 120,000 square feet of office space is listed as available, and there is no new office construction underway. Johnson City’s office market consists of 4.6 million square feet, primarily made up of mid-tier 3-Star office properties (2.7 million square feet), followed by smaller shares of Class A (4- and 5-Star) and lower-tier 1- and 2-Star buildings. Market rents in Johnson City average $18.70 per square foot, with higher-end 4- and 5-Star spaces commanding $28.00 per square foot, mid-tier spaces averaging $20.00 per square foot, and lower-tier properties leasing for $16.30 per square foot. Over the past year, office rents grew by 2.0%, outpacing the national average growth rate of 1.1%. Demand remains driven by healthcare, education, and professional services, with leasing activity concentrated in Downtown Johnson City and key commercial corridors. While the market has limited speculative development, existing space continues to be absorbed, supporting steady rent growth and low vacancy rate.
The Johnson City industrial market has a low vacancy rate of 2.0%, outperforming the five-year market average of 2.5% and the 10-year average of 3.1%. However, the market experienced a negative absorption of 68,000 square feet over the past year, meaning more space was vacated than leased. The market also saw no new deliveries of industrial space within the past year. Currently, 190,000 square feet of industrial space is available, representing an availability rate of 1.6%. Despite strong demand, there are no new industrial projects under construction, marking a slowdown compared to the 10-year average of 11,000 square feet of annual industrial development. Johnson City’s 12 million-square-foot industrial market is primarily composed of logistics (6.7M square feet), specialized industrial (4.8M square feet), and flex space (410K square feet). Market rents average $7.00 per square foot, with logistics and specialized buildings at $6.80 per square foot and flex properties commanding $11.60 per square foot. Over the past year, rents increased by 4.1%, well above the national average growth of 2.1%.
Policy P3.1: Encourage redevelopment of underutilized and aging commercial corridors.
• P3.1.1: Identify priority areas for revitalization and adopt overlay districts to support mixed-use development.
• P3.1.2: Continue to work with regional and state economic development agencies to promote economic development opportunities for the Boones Creek Development District.
• P3.1.3: Research and facilitate grants for façade improvements and to enhance pedestrian and vehicular accessibility.
• P3.1.4: Establish financial incentives to support property owners in revitalization projects along commercial corridors.
Boones Creek Road serves as a major gateway and economic corridor for Johnson City, connecting commercial, residential, and employment centers. The Boones Creek Corridor Study outlines strategies to guide future development along Boones Creek Road (SR 354), ensuring growth aligns with regional economic and transportation priorities. The corridor has seen increased investment, driven in part by infrastructure improvements such as the diverging diamond interchange (DDI) at I-26, which enhances access and mobility for businesses and residents.
Since the study’s release, Johnson City has made significant progress in implementing key recommendations. The City, in collaboration with the Tennessee Department of Transportation (TDOT), has completed intersection improvements at E. Jackson Blvd. and Boones Creek Rd. in Jonesborough, including new turn lanes, curb and gutter installations, retaining walls, and an upgraded traffic signal system. These enhancements improve traffic flow and safety, supporting further commercial growth. In addition to infrastructure upgrades, Johnson City has pursued economic development incentives to attract new investment. In 2019, the City sought state approval for a Retail Tourism Development District in Boones Creek, allowing state sales tax revenues to help fund retail and tourism-driven projects.
• Boones Creek continues to attract new retail, dining, and mixed-use projects, expanding its role as a regional shopping and employment destination.
• The corridor is positioned to support job growth, particularly in areas near I-26 and Christian Church Road, reinforcing its role as a key employment center within Johnson City’s broader economy.
• Roadway expansions, multimodal improvements, and access management strategies are helping to sustain long-term economic growth while ensuring efficient traffic movement.
Policy P3.2: Support adaptive reuse or redevelopment of vacant or underutilized commercial properties.
• P3.2.1: Create a framework for prioritizing adaptive reuse and redevelopment of underutilized commercial and industrial properties to retain business activity in key locations.
• P3.2.2: Develop incentives for the adaptive reuse or redevelopment of underutilized commercial spaces.
• P3.2.3: Streamline permitting processes for redevelopment projects.
• P3.2.4: Encourage mixed-use developments that align with the City’s comprehensive growth strategy and Future Land Use Map.
Policy P3.3: Enhance infrastructure and public improvements to attract investment in commercial corridors and centers.
• P3.3.1: Identify key corridors for investment in streetscape enhancement.
• P3.3.2: Explore improving multimodal connectivity to commercial centers through expanded transit and pedestrian friendly infrastructure.
• P3.3.3: Ensure utilities and infrastructure upgrades align with future growth demands in commercial districts where feasible.
Policy P3.4: Foster a mix of uses within commercial centers to promote vibrancy and economic resilience.
• P3.4.1: Encourage mixed-use developments that integrate retail, office, light industrial, and residential uses.
• P3.4.2: Incentivize developments that support placemaking and community gathering spaces.
• P3.4.3: Align zoning regulations to facilitate diverse development opportunities within commercial corridors.
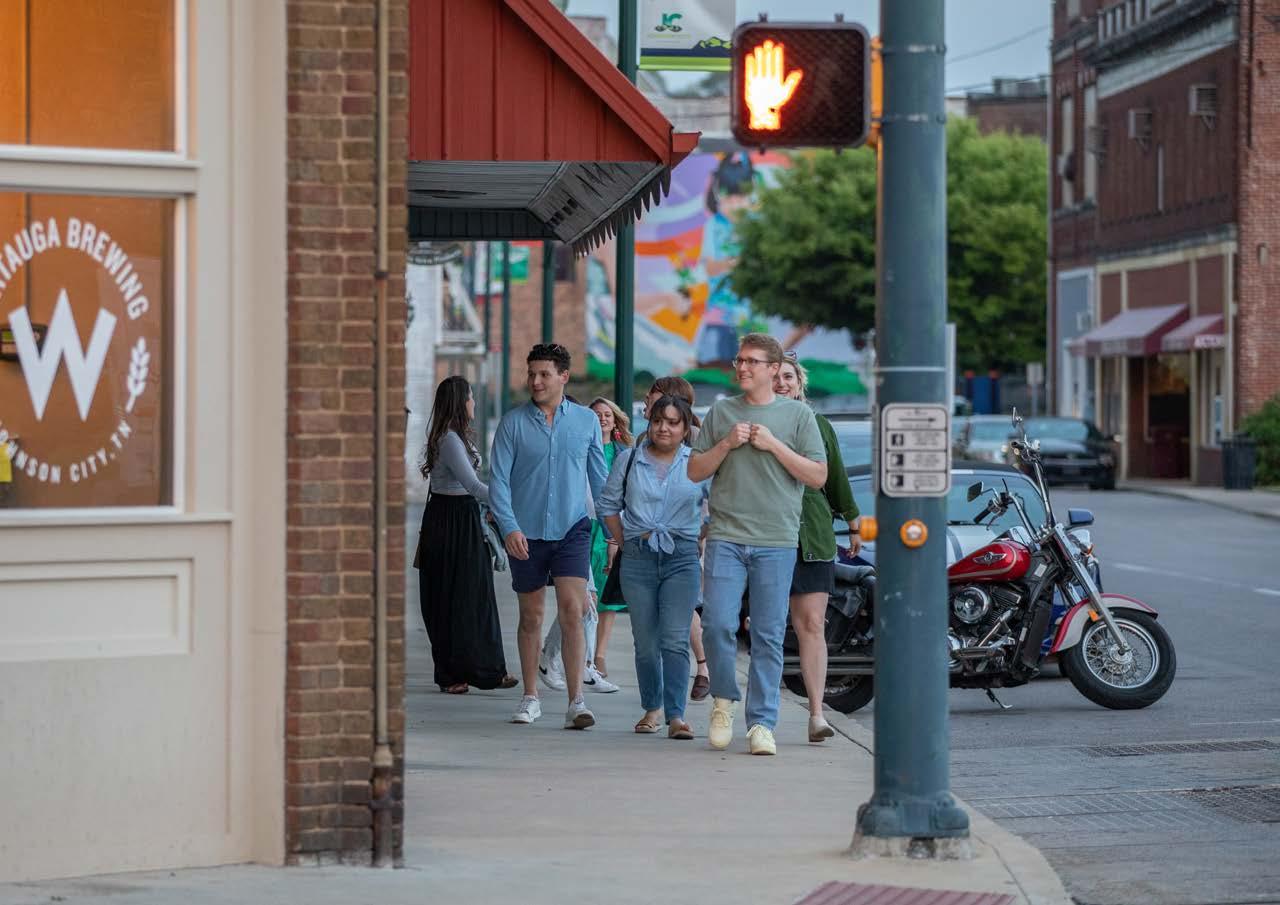
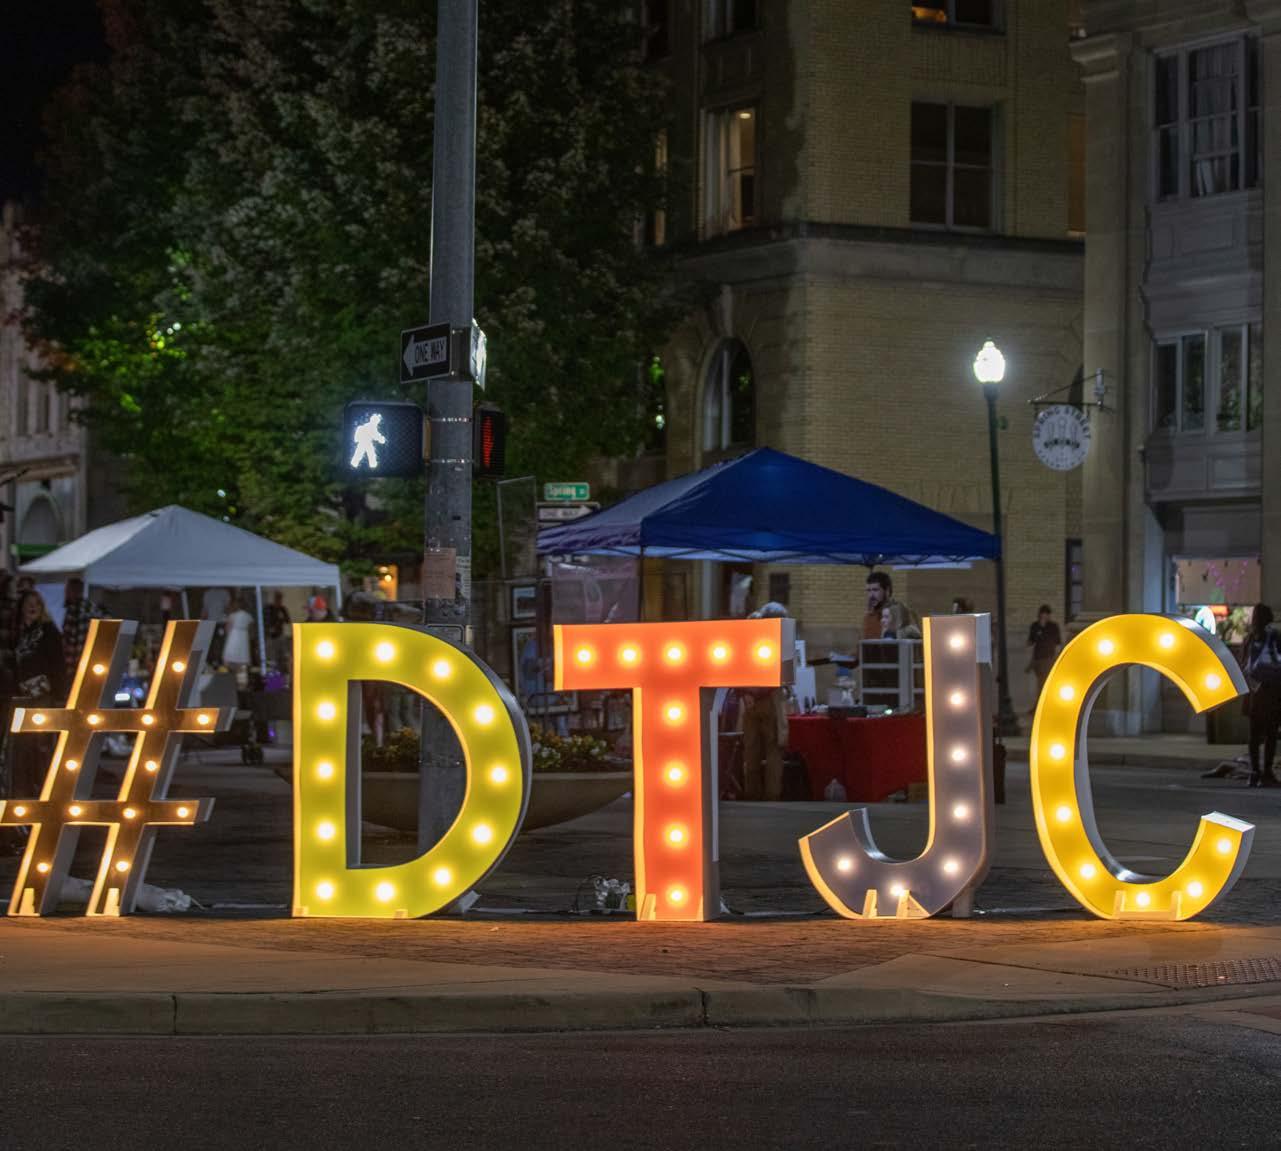
Downtown Johnson City is a central part of the City’s identity, serving as a hub for civic life, local business, culture, and community gathering. As the City continues to grow, supporting Downtown’s role as an active district can help attract investment, draw visitors, and create more opportunities for everyday community life. This chapter highlights Downtown’s strengths, along with opportunities to support redevelopment, improve access and connectivity, and reinforce Downtown’s role as a destination for public life and local business.
Downtown Johnson City helps shape how the community grows, gathers together, and experiences civic life. Through stakeholder input, public engagement, and analysis of existing plans and conditions, several consistent themes emerged: the importance of preserving Downtown’s unique character, unlocking its potential for infill and adaptive reuse, strengthening physical and social connections, and reinforcing its role as both an economic engine and cultural destination. This section outlines Downtown’s conditions, challenges, and opportunities as the City plans for its future.
Downtown Johnson City serves as the City’s civic and cultural center. Spanning more than 50 acres, Downtown is defined not just by its physical footprint, but by its role as a gathering place, employment center, and neighborhood. Downtown is managed through a combination of City staff and dedicated partners. The City’s Main Street Director works closely with community partners. The City plays an essential role in maintaining the Tennessee Main Street designation, marketing the Downtown TIF District, and implementing projects that support walkability, aesthetics, and economic vitality.
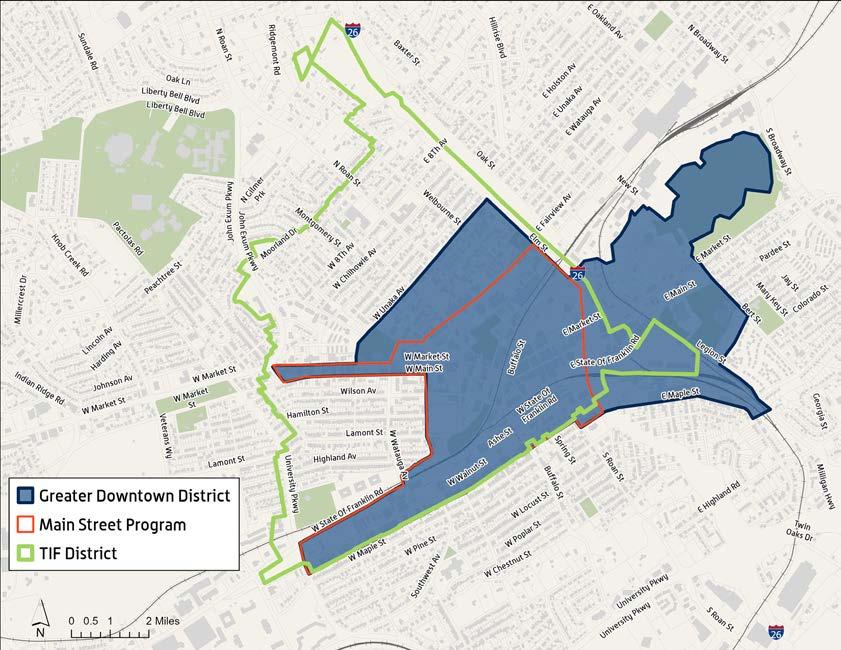
Source: Johnson City; Kimley-Horn
A major anchor within Downtown is Founders Park, the five-acre public space that exemplifies how infrastructure can double as a community amenity. Originally constructed to mitigate flooding and manage stormwater, the park now serves as a year-round venue for concerts, markets, and public art. It features an amphitheater, creek, and pavilion. Founders Park illustrates how Downtown has evolved to meet both environmental and cultural needs, and it remains a focal point of the district. Through stakeholder interviews and public engagement, Downtown emerged as a place of pride and there is strong support for preserving the district’s character while introducing new uses that enhance its vitality. Infill development, adaptive reuse, and mixed-use growth are widely seen as tools to strengthen Downtown without compromising what makes it special. Residents referred to Downtown as a shared space that belongs to the community, with a responsibility to remain accessible, welcoming, and reflective of Johnson City’s identity.
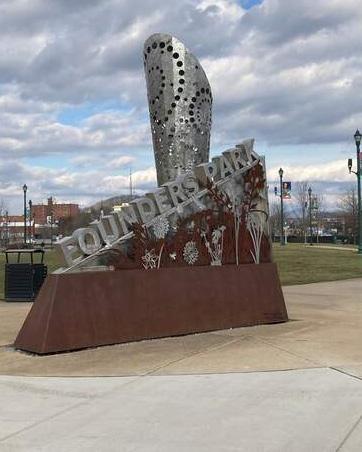
While Downtown Johnson City continues to evolve, a significant portion of its revitalization potential lies in underutilized properties, aging buildings, and vacant storefronts. Revitalization will depend on the City’s ability to support creative reuse, provide targeted incentives, and align redevelopment with the district’s character.
Many of Downtown’s older buildings hold architectural value and walkable layouts that make them ideal for reuse. Adaptive reuse not only preserves character, but it can also lower construction costs and create new space for housing, retail, and office uses. A key example is the John Sevier Center, originally a 1920s luxury hotel, now identified as a strategic redevelopment opportunity. The building’s location and size offer unique potential to re-anchor surrounding blocks. This form of growth aligns with the community’s desire to retain Downtown’s character while adapting to new needs. Supporting this kind of incremental change, through streamlined permitting or access to resources, can encourage reinvestment without altering the scale or feel of the district.
Constructed in 1924, the John Sevier Center has long been one of Downtown’s most recognizable buildings. Once a luxury hotel, the building served generations of residents and travelers before transitioning into a governmentowned residential facility. The building’s current use will come to a close by late 2025, as residents relocate to a new facility nearby. Once vacated, the City intends to transfer ownership to a developer capable of reimagining the property through sensitive rehabilitation and adaptive reuse. With over 100,000 square feet of floor area, prominent corner visibility, and a rich architectural legacy, the John Sevier Center represents a keystone opportunity for transformative reinvestment in the Downtown core. The City of Johnson City envisions a redevelopment that brings the building back into active use while contributing to Downtown’s long-term economic vitality. Potential uses include housing, hospitality, office, or mixed-use configurations, ideally paired with active ground-floor space that reinforces the pedestrian environment. Given the building’s age and condition, redevelopment is expected to require significant investment, but the City has expressed a willingness to support creative solutions and explore publicprivate partnerships. The John Sevier Center stands as a rare opportunity to blend historic preservation with future growth, signaling how Downtown can evolve while holding onto what makes it distinct.
In addition to reusing existing structures, Downtown has scattered opportunities for infill. Vacant parcels could accommodate mid-scale mixed-use development. These gaps are often overlooked but important to Downtown’s future. They provide space for added housing, storefronts, or shared community facilities while reinforcing the pedestrian environment. Infill in these areas can:
• Increase housing choice in a walkable setting
• Strengthen local business viability through greater foot traffic
• Reduce development pressure on greenfield and suburban fringe areas.
The City’s zoning and infrastructure capacity generally support infill, but future refinement may be needed to ensure compatibility with existing character and allow for flexibility in use types and building form.
Infill development is one of the most effective ways to support compact, connected growth in established areas like Downtown. By activating vacant or underutilized parcels, infill creates space for housing, small businesses, and civic amenities within walking distance of existing infrastructure and services. It can reestablish continuity between blocks, expand access to daily destinations, and support more walkable, vibrant districts while providing opportunities for development in well-located areas. More than just a land use strategy, infill is a tool for community revitalization. When implemented thoughtfully, it can activate neglected corridors, support small businesses, expand housing choices, and make efficient use of existing infrastructure, helping Downtown grow without expanding its footprint.
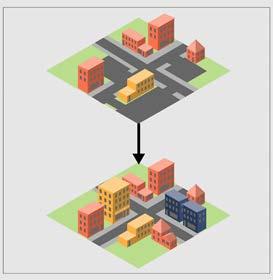
As the City evaluates how to guide and manage future development, there is a growing need to align incentives with land use goals. While tools like the TIF District have been instrumental in jumpstarting Downtown’s revitalization, future mechanisms should focus on supporting:
• Housing within Downtown’s mixed-use fabric
• Reuse of aging or vacant structures
• Projects that enhance walkability and connectivity
Encouraging infill and adaptive reuse in Downtown supports broader community goals by limiting sprawl, making efficient use of existing infrastructure, and expanding access to centrally located amenities and services. Exploring new incentive models, such as density bonuses, public-private partnerships, or infrastructure offsets, can help direct investment toward these priorities, ensuring that redevelopment serves both the physical character of Downtown and the long-term vision for Citywide growth.
Downtown Johnson City’s compact street grid, access to transit, and public infrastructure make it well suited to accommodate growth, but these assets must be reinforced through strategic investment. As new residents and businesses move into Downtown, ensuring safe and efficient access for all users will be important to maintaining the function of Downtown.
Downtown benefits from a compact street grid, but its infrastructure presents challenges. Narrow one-way streets can limit visibility and circulation. Incomplete pedestrian and bicycle networks make it difficult to navigate without a car, limiting access for residents, students, and workers alike. Stakeholders emphasized the need to address these barriers, especially in support of Downtown’s growing role as a walkable, mixed-use district. Recent improvements along West Walnut and Buffalo Streets have demonstrated the City’s commitment to Complete Streets principles. Public engagement reflects continued support for these upgrades, including safer crossings, sidewalk continuity, and better first/last-mile access.
A connected Downtown is not only easy to navigate but it also feels continuous and complete. Public feedback highlighted the importance of districts like West Walnut, the Tree Streets, and South Side. These areas contribute to Downtown’s energy but can feel disconnected due to gaps in the street grid, inactive blocks, or inconsistent public realm design. Enhancing continuity through lighting, signage, infill development, and consistent urban design elements can help bridge these areas, making Downtown feel like a unified destination rather than a series of disconnected parts. A comprehensive wayfinding system, featuring branded signage, gateway markers, and visual cues, can further support Downtown’s connectivity. These improvements not only help people navigate the district more confidently but also reinforce its identity and encourage exploration beyond the most familiar blocks.
A well-designed wayfinding system does more than guide people from point A to point B, it shapes how people experience a place. In Downtown Johnson City, existing wayfinding elements already help orient residents, visitors, and students throughout the district. As Downtown continues to grow and attract new activity, additional opportunities exist to build upon these elements in ways that enhance the experience of moving through the area. Thoughtfully placed signage, branded gateways, and clearly defined pedestrian corridors can reinforce the district’s character, encourage exploration, and provide a stronger sense of continuity from one destination to the next. When integrated with broader planning and economic development initiatives, expanded wayfinding can also strengthen walkability, support local businesses, and contribute to a more cohesive civic identity. Design features such as public art, lighting, and interactive elements can further reflect community pride and create a welcoming, memorable environment for all who visit or call Downtown home.
Downtown Johnson City continues to function as an economic anchor for the broader region. Local businesses, professional services, entertainment venues, and civic institutions all contribute to a dense mix of uses that draw residents, employees, and visitors alike. Recent trends suggest that Downtown’s small-scale retail and dining establishments are supported not only by the immediate population, but by those who commute in or travel for events. This reinforces Downtown’s potential to absorb future economic growth, particularly in industries tied to tourism, hospitality, creative services, and entrepreneurship. Stakeholders emphasized the importance of maintaining this momentum through targeted support for local businesses, investments in infrastructure, and continued visibility. Strengthening Downtown’s role as a destination also helps support surrounding neighborhoods by creating job opportunities and encouraging reinvestment in the core.
Events, performances, festivals, and informal gathering spaces all contribute to a sense of energy and belonging. Founders Park and Kings Commons continues to serve as the primary venue for cultural programming, but interest is growing in activating additional public and semi-public spaces throughout the district. These spaces, whether formal plazas or simple sidewalk extensions, support higher-density development by offering places to gather outside the home or office. They also help bridge quieter blocks, reinforce walkability, and foster a sense of place that is uniquely Johnson City. As Downtown continues to grow, strategic placemaking can help sustain this energy. Partnerships with local artists, business owners, and community organizations will be essential in identifying new opportunities for activation, particularly in areas that have seen less investment to date. Continued support for both recurring events and temporary installations can make Downtown feel dynamic and inclusive year-round.
Recurring events contribute to Downtown’s energy and help draw people into public spaces. In Johnson City, programs like the Johnson City Farmers Market and Friday After 5 demonstrate how cultural programming, food, and live performances can activate plazas, sidewalks, and green spaces in ways that feel authentic and inclusive. These experiences help strengthen walkability, support local businesses, and create a sense of shared ownership in Downtown. As the City explores new opportunities for placemaking and infill development, continued investment in recurring and flexible events will be key to ensuring public spaces remain vibrant, welcoming, and well-used throughout the year.
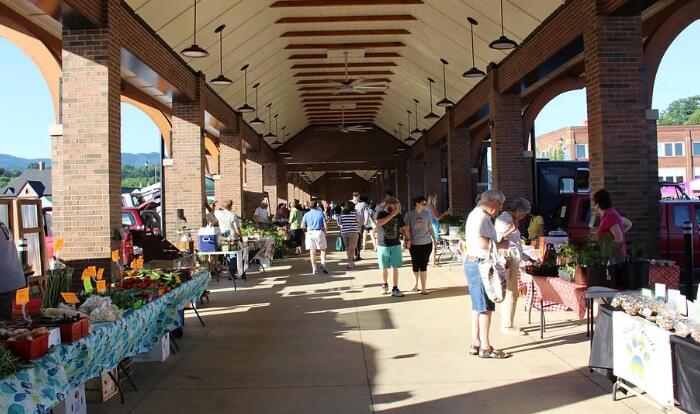
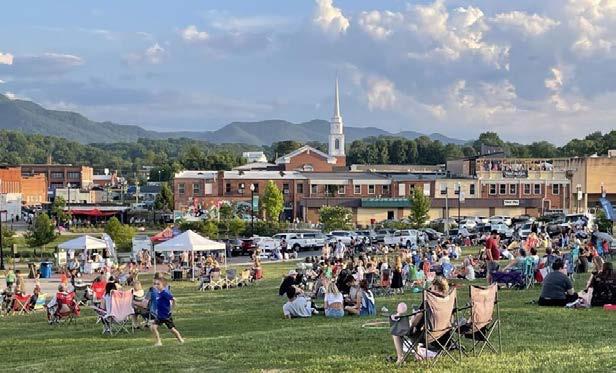
Policy D1.1: Promote a mix of uses that align with Downtown’s character and community needs.
• D1.1.1: Prepare a conceptual master plan that guides growth and development in Johnson City’s Downtown.
• D1.1.2: Review zoning code to ensure that it that allows for a blend of higher-density residential, commercial, and cultural uses, while maintaining Downtown’s identity.
• D1.1.3: Support infill development that aligns with existing character in areas where infrastructure of sufficient capacity is currently provided.
Policy D1.2: Preserve and enhance the historic and cultural assets of Downtown.
• D1.2.1: Work with the Tennessee Historical Commission to create an updated inventory of historic assets and an action plan to protect at-risk historic properties and districts.
• D1.2.2: Ensure historical preservation efforts maintain the architectural integrity and cultural significance of key buildings and sites.
Policy D1.3: Encourage adaptive reuse of underutilized buildings in Downtown.
• D1.3.1: Conduct a Downtown building inventory and assessment to identify key properties suitable for adaptive reuse and prioritize them for redevelopment efforts.
• D1.3.2: Prioritize efforts to seek public-private partnerships to renovate the John Sevier property.
• D1.3.3: Research tools that can be used to incentivize the rehabilitation of vacant and aging structures to ensure they contribute to Downtown’s character.
• D1.3.4: Encourage mixed-use redevelopment of underutilized buildings to support a balance of retail, office, and residential uses that align with Downtown’s character.
Policy D2.1: Encourage context-appropriate development that increases the economic health of Downtown.
• D2.1.1: Develop Downtown-specific design guidelines to ensure new developments complement existing architectural character and land use patterns.
• D2.1.2: Coordinate with service providers and implement strategies from the City-Wide Strategic Plan to Reduce Homelessness to improve perceptions of safety Downtown while supporting individuals experiencing homelessness.
A Business Improvement District (BID) is a public-private partnership where property owners agree to pay an additional assessment to fund enhanced services within a defined area. These services can include sidewalk cleaning, landscaping, marketing, event programming, and security. A future BID in Downtown Johnson City could provide sustainable funding to support vibrancy, cleanliness, and long-term maintenance beyond what the City alone can provide.
Policy D2.2: Support incentive programs in Downtown that offer existing and new businesses a competitive edge to flourish.
• D2.2.1: Explore new incentive programs and strategies to encourage reinvestment in Downtown properties.
• D2.2.2: Prepare a feasibility study to understand the implications of implementing a Downtown Business Improvement District (BID) to provide sustained funding for marketing, streetscape enhancements, and security.
• D2.2.3: Continue to offer façade improvement grants to help businesses upgrade their storefronts and enhance Downtown’s appeal.
• D2.2.4: Provide technical assistance to businesses navigating City processes, including permitting, grants, and site selection.
Johnson City is conducting a Downtown Parking and Circulation Study to better understand how people access and move through the district. The study will inform future decisions about parking supply, curb space, and street design, ensuring Downtown remains accessible, walkable, and business-friendly as it continues to grow.
Strengthen connectivity and mobility to improve access to and within Downtown.
• D2.3.1: Implement priority enhancements and improvements to Downtown parking in accordance with the Downtown Johnson City Parking and Circulation Study (2024-2025).
• D2.3.2: Conduct a Downtown mobility study to identify and address gaps in pedestrian, bicycle, and transit connectivity.
• D2.3.3: Enhance pedestrian safety by improving crosswalks, lighting, and traffic calming measures in key areas.
• D2.3.4: Conduct a wayfinding study to develop design guidelines for Downtown gateways, signage, and destination markets.
• D2.3.5: Research opportunities to offer shuttle service between Downtown Johnson City and ETSU.
Policy D2.4: Invest in interdepartmentally coordinated infrastructure improvements that support long-term economic sustainability and attract private investment.
• D2.4.1: Prioritize infrastructure improvements, including streetscape enhancements, and utility upgrades in Downtown revitalization areas.
• D2.4.2: Establish a capital improvement plan (CIP) focused on Downtown’s infrastructure needs.
• D2.4.3: Leverage state and federal funding opportunities to support major Downtown infrastructure projects.
• D2.4.4: Develop public-private partnerships to support infrastructure investments that attract new development and business activity.
Policy D2.5: Diversify Downtown’s economic base by attracting a mix of retail, office, entertainment, and cultural uses.
• D2.5.1: Conduct a targeted business recruitment strategy to attract diverse businesses that align with Downtown’s longterm economic goals.
• D2.5.2: Work with local arts organizations to develop cultural programming and public art installations that enhance Downtown’s appeal.
Policy D3.1: Develop a comprehensive branding and marketing strategy to promote Downtown’s unique identity.
• D3.1.1: Create a unified branding campaign that highlights the unique history, culture, and amenities of Downtown.
• D3.1.2: Conduct annual visitor perception surveys to refine marketing strategies and address areas for improvement.
Policy D3.2: Strengthen partnerships with local organizations, businesses, and institutions to amplify Downtown’s appeal.
• D3.2.1: Continue to facilitate a Downtown stakeholder committee to align efforts between business owners, property developers, and cultural institutions.
• D3.2.2: Continue to foster partnerships with the Chamber of Commerce and regional economic development organizations to support business growth and recruitment efforts.
Policy D3.3: Promote Downtown as a hub for arts, culture, and entertainment through strategic initiatives and partnerships.
• D3.3.1: Support the installation of public art projects in key Downtown locations to enhance visual interest and cultural engagement.
• D3.3.2: Partner with local arts organizations to offer rotating exhibits and pop-up events in underutilized spaces.
• D3.3.3: Encourage outdoor dining and street performances to activate Downtown public spaces.
• D3.3.4: Continue to provide financial and logistical support to local artists and cultural organizations seeking to host events in Downtown.
Policy D3.4: Collaborate with the tourism industry to position Downtown as a must-visit destination for regional and national visitors.
• D3.4.1: Work with the local Convention and Visitors Bureau to develop visitor guides and promotional materials featuring Downtown.
• D3.4.2: Utilize analytics and visitor data to identify trends and target marketing efforts to key demographics.

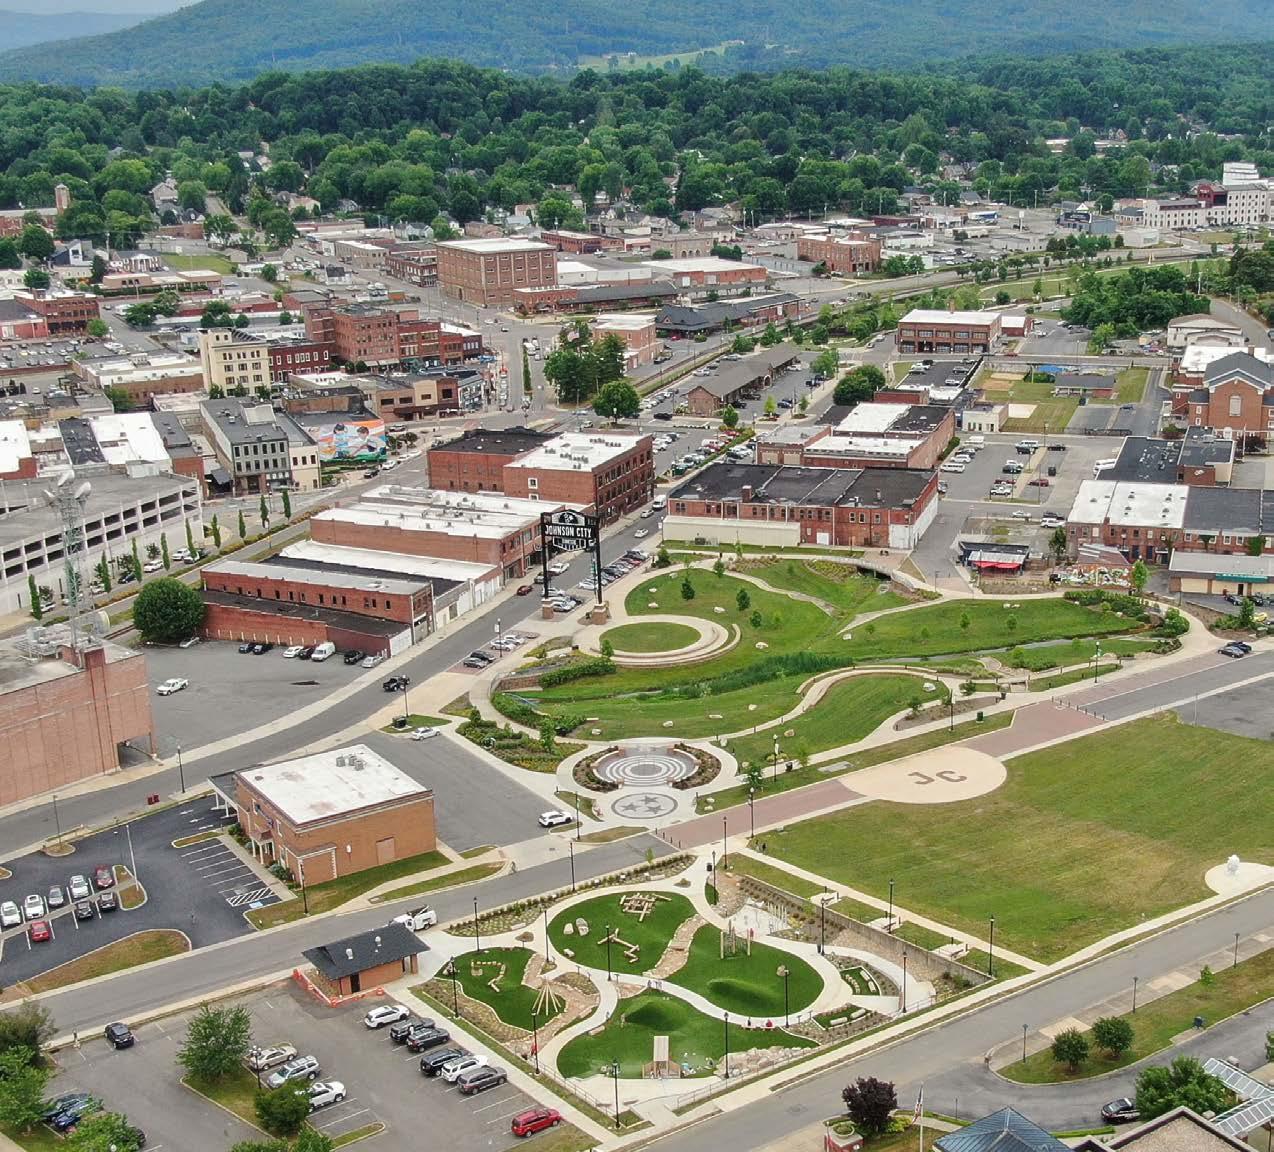
A coordinated transportation system requires a thoughtful consideration of the multitude of travel choices Johnson City residents, visitors, and workers make every day. Where are they going? How would they like to get there? What is needed to make sure they reach their destination safely, no matter what mode of transportation they are using? This planning theme explores how Johnson City can align its vision for growth and development with its goals for safe and efficient movement of goods, services, and people throughout and beyond the City. The chapter outlines how Johnson City’s transportation network currently operates, the changes it’s undergoing, and the strategies and actions the City should consider in the years and decades to come.
How people and goods move throughout Johnson City is a critical part of everyday life. Informed planning considers how land use and the transportation system influence each other. Horizon 2045 considered the unique circumstances in Johnson City to develop a context-sensitive approach to the recommendations outlined in this chapter. The following section explores the existing mobility network, considering vehicular, bicycle, and pedestrian modes of transportation.
Average annual daily traffic (AADT) reflects the average number of vehicles on a roadway each day. Ideally, traffic volumes correspond with the function and design of the roadway. For example, freeways or expressways serve long-distance travel and correspond with higher traffic volumes. By comparison, local neighborhood streets serve short-distance travel and correspond with lower traffic volumes. The AADT helps identify areas and corridors where demand is high. In 2023, several corridors in the Study Area carry more than 15,000 vehicles per day (vpd), including Bristol Highway and I-26.
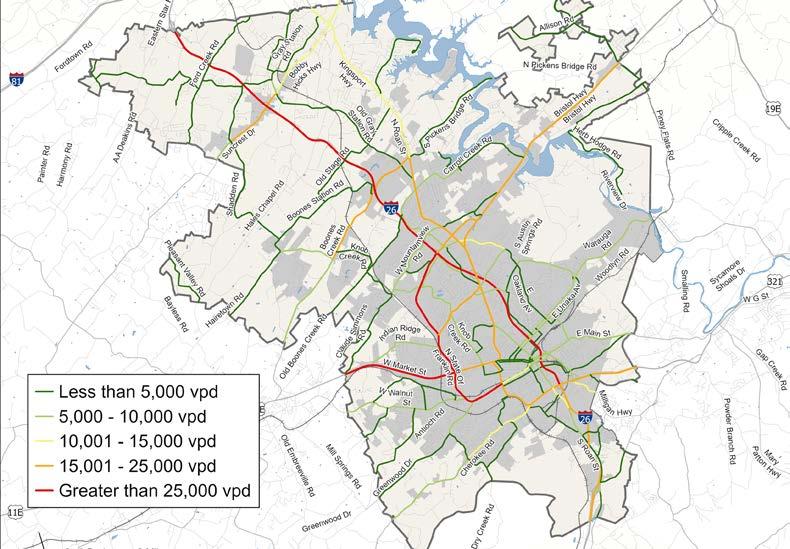
Source: Kimley-Horn; TDOT
The Tennessee Department of Transportation (TDOT) owns and maintains many of the roadways in Johnson City, including many of the major thoroughfares that residents, visitors, and travelers use to move within and through the City. These include West Market Street, North State of Franklin Road, and Route 11E (John Exum Parkway). Multiple local roads also fall under TDOT’s jurisdiction, including West Main Street heading into Downtown and Boones Creek Road. Improvements to these roadways require coordination between the City and TDOT — such as requests to alter speed limits, multimodal enhancements, signal upgrades, and more.
TDOT-owned roadways receive a functional classification, indicating their status in the overall roadway network. These classifications are based on the roadway capacity — the number of cars a roadway can reasonably carry each day:
• Interstate | High-speed, multi-lane, controlled-access highway part of a network that makes up a national highway system that traverses the United States
• Freeway and Expressway | High-speed, multi-lane, controlled-access highway not part of the interstate system
• Principal Arterial | Roadway carrying a large portion of the traffic into and out of an area, usually multi-lane and highspeed, sometimes with limited access
• Minor Arterial | Roadway accommodating medium-length trips between cities or towns
• Major Collector | Roadway providing access between local roads and arterials
• Minor Collector | Local roads connecting neighborhoods to one another and to arterials
A metropolitan planning organization (MPO) is a regional transportation policymaking organization. Federal law requires the formation of an MPO when an urbanized area is populated by 50,000 or more people. The JCMTPO was formed in 1982, and has coordinated the regional transportation planning concerns of the jurisdictions of Johnson City; Bluff City; Elizabethton; Jonesborough; a portion of Unicoi; and portions of Washington, Carter, and Sullivan Counties (JCMPO.org). The JCMTPO is responsible for a variety of important planning documents that affect how transportation functions in Johnson City, including the Metropolitan Transportation Plan (MTP), the Transportation Improvement Program (TIP), and the Unified Planning Work Program (UPWP).
The Johnson City MTPO 2050 MTP is a federally required planning document the MTPO completed as part of the federal government’s request for a new MTP every five years. The 2050 MTP outlines the region’s transportation investments over the next 25 years and the region’s vision for transportation. It outlines key transportation needs and establishes goals, objectives, and performance measures.
• Meet and exceed the 10 federal planning factors outlined in the Fixing America’s Surface Transportation (FAST) Act
• Meet and exceed the Tennessee Department of Transportation (TDOT) goals and objectives from the 25-Year Long Range Transportation Plan (LRTP)
• Improve safety and security throughout the JCMTPO area transportation system
• Mitigate traffic congestion along major routes in the JCMTPO area
• Promote economic growth and livability by enhancing the JCMTPO area transportation system
• Enhance regional access to and from the JCMTPO area
The JCMTPO 2023–2026 Transportation Improvement Program identifies state-funded projects throughout the JCMTPO’s planning area. The JCGMP study area has several funded projects, including roadway improvements, widening projects, intersection redesigns, new traffic signals, and crosswalk improvements. The map below shows where these projects are located, and the table provides more detail about each project.
FUNDED ROADWAY PROJECTS
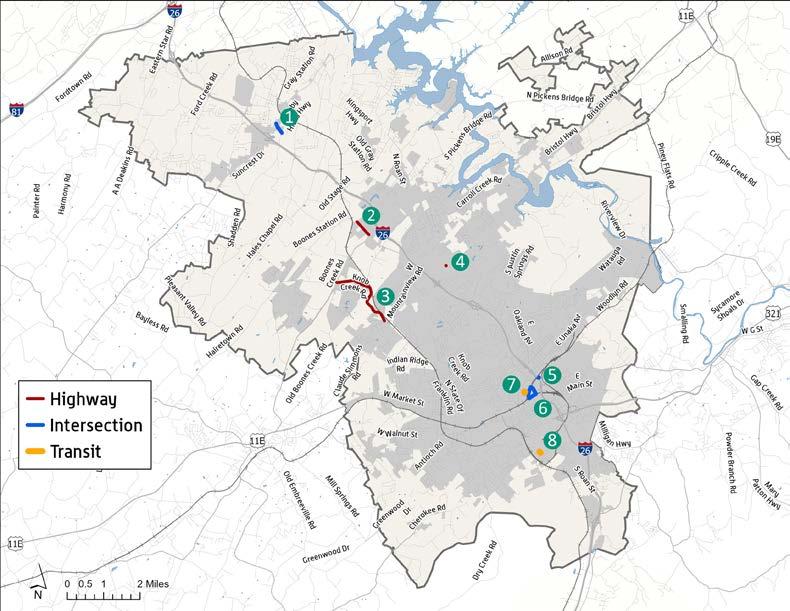
Truly comprehensive transportation networks are multimodal in design, supporting active modes, such as walking and biking, and complimented by a public transportation, or transit, system. The map to the right shows the existing and planned active transportation and transit facilitates in the area. Having a connective active transportation system that is supported by nearby transit routes and stops encourages additional access to jobs, schools, healthcare, and places of recreation for Johnson City residents and visitors. Horizon 2045 will ensure the alignment of both the physical infrastructure and strategic policy needed to support a multimodal network that is safe and accessible for all users in the City.
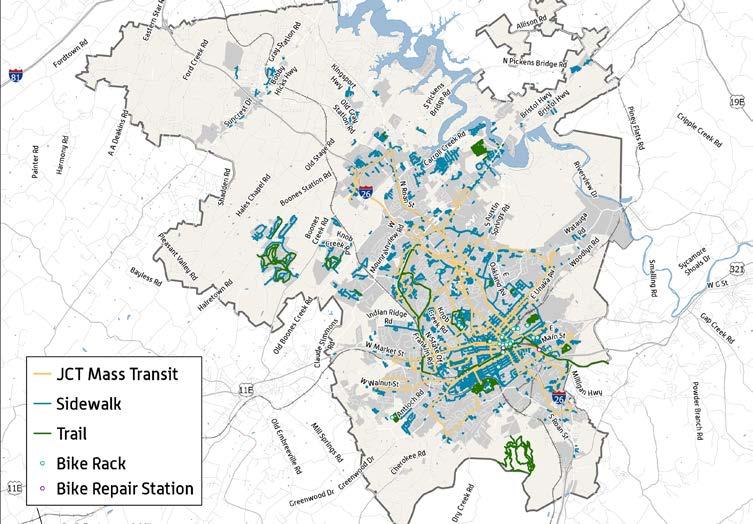
Source: Johnson City
Sidewalks play in a key role in the health of a functioning transportation system. They provide a variety of travel and recreational benefits and, if well maintained, can be used by people of all ages and abilities. Sidewalks provide important links to a variety of destinations, including businesses, medical facilities, educational opportunities, transit facilities, and parks. The provision of sidewalks within neighborhoods — single-family and multi-family — increases recreational and social opportunities, encouraging healthy lifestyles. In addition, sidewalks provide a means of travel to those who are too young or too elderly to drive; those who are unable to operate a vehicle due to physical and/or developmental limitations; and those who are unable to afford a motor vehicle. A robust sidewalk network that connects neighborhoods to shopping, healthcare, and jobs is essential. In addition, sidewalks are a key component of first-mile/last-mile connectivity, which is the idea that the transit system must be supported by multimodal travel options that allow users to travel to (the “first mile”) and from (the “last mile”) the transit stop.
According to the JCMTPO, sidewalks are commonplace within the Johnson City Urbanized Area. Sidewalks are less common in the more rural, unincorporated areas of the study area. Sidewalks were also a key topic area covered in the Transportation Element of the Bridge Plan (20212025). To make sure sidewalk improvements address the most pressing needs related to filling in
Johnson City maintains roughly 20 miles of hiking and walking trails. This is in keeping with the Parks and Recreation Department’s mission to “inspire healthy and active lifestyles and create recreational opportunities filled with people, parks, and programs.
20 MILES OF TRAILS
319 MILES OF SIDEWALKS
9 MILES OF BIKEWAYS
pedestrian infrastructure gaps, the Transportation Element outlined a process for prioritizing sidewalk projects. The process prioritized sidewalk projects around key land uses, such as schools, parks, public buildings, and high-employment zones. In addition, sidewalks near transit facilities and that complete a network segment also received points, contributing to their priority in the overall ranking.
Johnson City is home to a rich bicycling community — those who ride recreationally as well as those who travel to work and other destinations primarily by bicycle. The area’s natural topography makes it an ideal location for mountain biking, with Winged Deer Park and Tannery Knobs Mountain Bike Park being prime destinations for these users. The presence of the East Tennessee State University (ETSU) campus in the study area indicates a need to develop a robust bicycling network to meet the needs of students who prefer to bike to classes. Dedicated road rides are organized by some of the local cycling shops. The needs of existing and future bike riders in Johnson City are varied; therefore, a diversity of bicycle infrastructure needs to be considered.
Facilities for bikers are primarily located in Downtown Johnson City. According to the JCMTPO 2050 MTP, bike lanes exist on portions of Routes 354 and 381. Currently, the facilities are largely disconnected from the remainder of the multimodal network. Understanding the types of users and facilities is key to effectively incorporating the bicycling network into the overall vision for transportation in Johnson City. Therefore, the types of bicyclists in Johnson City were explored based on conversations with City staff, stakeholder groups, and members of the public. Then, the types of facilities that would meet the needs of these users and the skill level required to use them safely were determined..
There are two primary user types: utilitarian users who are making necessary trips via bicycle to specific destinations, such as work, school, grocery stores, or healthcare facilities; and recreational users who are making discretionary trips via bicycle for fun or exercise. For utilitarian users, bicycle facilities can provide important first- and last-mile connections to transit. In addition to the two user types, there are three primary skill levels: advanced cyclists who are bikers capable of comfortably and safely riding on roads with higher volumes and speeds, basic adult cyclists who have less experience biking among automobile traffic, and child cyclists who have little to no experience biking on the roadway.
Facility Type
Utilitarian Users Recreational Users Skill Level
Bike Lane X X Advanced Cyclists; Basic Adult Cyclists
Sharrow (shared lane markings) X X Advanced Cyclists; Basic Adult Cyclists
Paved Shoulder X Advanced
Signed Route X Basic and Advanced
Multiuse Path X X All Cyclists
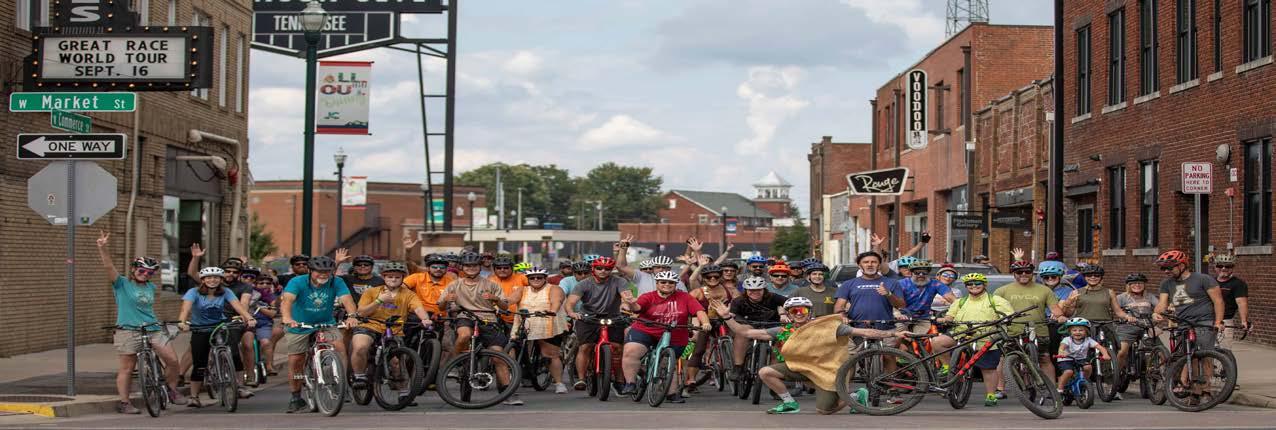
Johnson City is home to a rich body of trails and paths suitable for hiking, biking, and walking. The study area’s natural surroundings provide an abundance of opportunities to develop greenways, trails, and shared-use paths that can be enjoyed by residents and visitors alike. The following is a description of the existing and proposed greenways, trails, and paths in Johnson City.
The Buffalo Mountain City Park offers more multiple miles of total trails and loops, including the Lady Slipper Loop (0.28 mile), Fort Knob (0.70 mile), Tip Top (0.32 mile), the Noggin (1.22 miles), Tower Ridge (0.87 mile) White Rock Loop (roughly ~4.5 miles), and the Lone Oak Trail (1.75 miles). The hiking trails provide access to scenic overlooks and picnic areas.
Tweetsie
The 10-mile-long Tweetsie Trail is a rails-to-trails project — the largest in Tennessee — that runs along the former Tweetsie Railroad from Johnson City to Elizabethton. This scenic trail allows residents and visitors to enjoy biking, walking, rolling, or running in nature along mostly flat gravel surface. At the trailhead in Johnson City, trail users will find paved parking, restrooms, seating, water fountains, and a bike repair station. The trail offers additional access in other areas of the City as well as portable restrooms at various mile markers.
There is a proposed expansion of the Tweetsie Trail that aims to connect Johnson City and Jonesborough. This project, known as the First Frontier Trail, is supported by a $2.4 million allocation from the Tennessee state budget for the 2024–2025 fiscal year. The expansion is expected to promote outdoor recreation, improve pedestrian and cyclist safety, and provide a sustainable transportation alternative between the two communities.
Other Loops and Trails
• Short Loop – A 28.5 mile loop along Greenwood Road to Highway 81.
Park Paths
• Carver Park – At Carver Park, there is a 0.25-mile flat walking track. This flat, paved surface makes it an ideal walking and rolling opportunity for users of all ages and abilities.
• Civitan Park – This park features a 1.57-mile paved track connecting to Lions Park. It’s an excellent option for walkers and runners.
• Liberty Bell Complex – At the Liberty Bell Complex, a paved walking track encircles the property, offering 1.7 miles of track and a 375-meter jogging and walking surface.
• Willow Springs Park – This park features a 1.8-mile circular paved path.
• Winged Deer Park – A 0.5-mile track encircles the ballfield on the site. In addition, a 1.5-mile wooded trail is available for park visitors.
Proposed trails and greenways are described below.
Buffalo Trace Greenway
This greenway would provide connection between the Tipton-Haynes historic site in Johnson City to Buffalo Mountain Park. Future phases would connect the historic site to a state park in Elizabethton.
Carroll Creek Greenway
This proposed greenway would follow Carroll Creek Road and could eventually provide connection to Jonesborough via Old Boones Creek Road.
Transit in Johnson City is operated by the Johnson City Transit (JCT) Department. The transit system provides access to major destinations, including ETSU, the Veterans Affairs Mountain Home Campus, hospitals, retail destinations, residential neighborhoods, and government buildings. JCT runs a variety of services, including fixed-route, paratransit for those with disabilities, and on-demand call-in services. In addition, JCT offers a dedicated fixed-route shuttle for students at ETSU called BUCSHOT. JCT also provides a sub-set of its on-demand service called Job Access to low-income users outside the fixed-route operating hours and/or service area. Finally, JCT has a separate division that operates the school bus system for Johnson City Schools.
JCT’s fixed-route service features 15 routes with 60- to 90-minute headways. It operates Monday through Friday from 6:15am to 6:15pm and Saturday from 8:15am to 5:15pm. Another service, the Northeast Tennessee Regional Public Transit System (NET Trans), operates Monday through Friday from 6:00am to 6:00pm, with limited weekend service. NET Trans is a regional transit service that provides on-demand transit services outside of the JCT service area to Washington, Sullivan, Unicoi, Johnson, Hawkins, Hancock, Greene, and Carter counties.
Johnson City Urbanized Area Coordinated Public Transit-Human Services Transportation Plan
JCMTPO developed and adopted this plan in 2022. Per federal requirements, the plan outlines the transportation needs of individuals with disabilities, older adults, and low-income individuals. In addition, it outlines goals and strategies to improve transit service for these riders and position the Urbanized Area to receive funding for implementation of improvements. Key recommendations include expanding service to provide more routes to jobs, expanding on-demand service, improving fleet planning, recruiting drivers, implementing electronic fare systems, pursuing funding, hiring a mobility manager for JCT, and developing a coordinated transportation framework and mobility management program for JCT and NET Trans.
Eastern Tennessee is a strategic area for freight movement into and through Tennessee. I-26 bisects the City and is a part of the National Highway Freight Network (NHFN), according to the USDOT Federal Highway Administration (FHWA). I-26 is categorized as a non-Primary Highway Freight System (non-PHFS).
Johnson City’s history is deeply rooted in the railroad industry, and the City owes its creation to the railroad, when it served as a stop between Knoxville and Bristol as an area called Johnson’s Depot. Later, once it was chartered as Johnson City, it grew to become a hub for three rail lines. Today, the City is served by the Norfolk Southern Railroad, CSX, and the East Tennessee Railroad.
The Tri-Cities Airport (TRI) is so called because it serves the Tri-Cities area of Johnson City, TN; Kingsport, TN; and Bristol, TN-VA. TRI is located north of the study area in Blountville, TN. However, it has a great influence on the movement of people in and through Johnson City. The airport is governed by the Tri-Cities Airport Authority (TCAA), with members appointed by the surrounding jurisdictions, including Johnson City. TRI serves direct flights to Atlanta, GA; Charlotte, NC; Dallas, TX; Orlando, FL; and St. Petersburg, FL through Allegiant, American Airlines, and Delta.
The Tennessee Department of Safety and Homeland Security tracks and reports on roadway safety incidents in a searchable crash dashboard. Between 2020 and 2024, the last full year reported by the dashboard at the time of the Horizon 2045 publication, there were 69 fatalities on Washington County roadways. Of those, 33 (or 47.8%) occurred in Johnson City limits (TN Department of Safety and Homeland Security).
Fatal and serious injury crashes involve a number of contributing factors. According to the dashboard, prominent contributing factors in fatal and serious injuries include unbelted occupants, senior drivers, and pedestrians. The full breakdown is shown in the graph below.
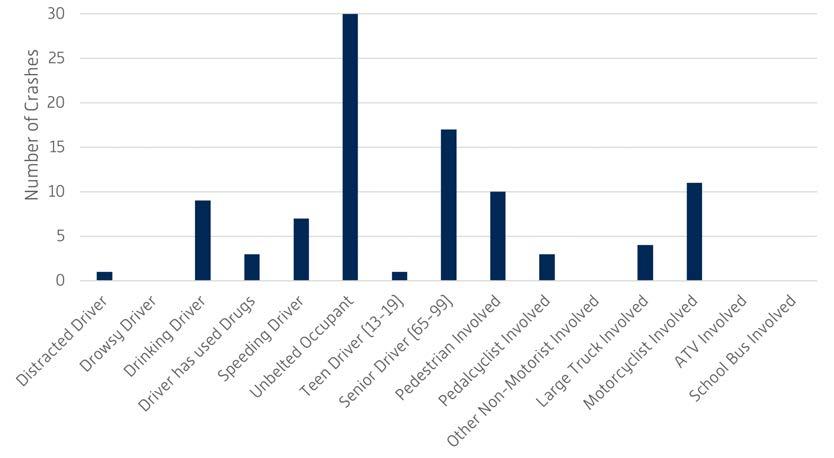
This graph suggests that safety awareness campaigns about safe driving habits, including seatbelt use, sober driving, and more, could be beneficial to improve safety in the study area.
Mapping the crash history is an important step to determining how best to address safety concerns, as crash history maps provide a visual way to represent where the majority of crashes — particularly those resulting in fatalities and serious injuries — occur. Once these “crash hotspots” are determined, the next steps are to understand what factors related to the “three Es of safety” (Engineering, Enforcement, and Education) occur in the area and what strategies can be implemented to address these issues. A crash history map, showing all crashes from 2018 to 2022, is shown to the right. The full crash history is represented as a heat map to show crash hotspots. Fatal and serious injury crashes are represented as points on the map. Crash hotspots with a particular concentration of fatal and serious injuries occur in and around Downtown, along North State of Franklin Road and I-26, and along Bobby Hicks Highway in Gray.
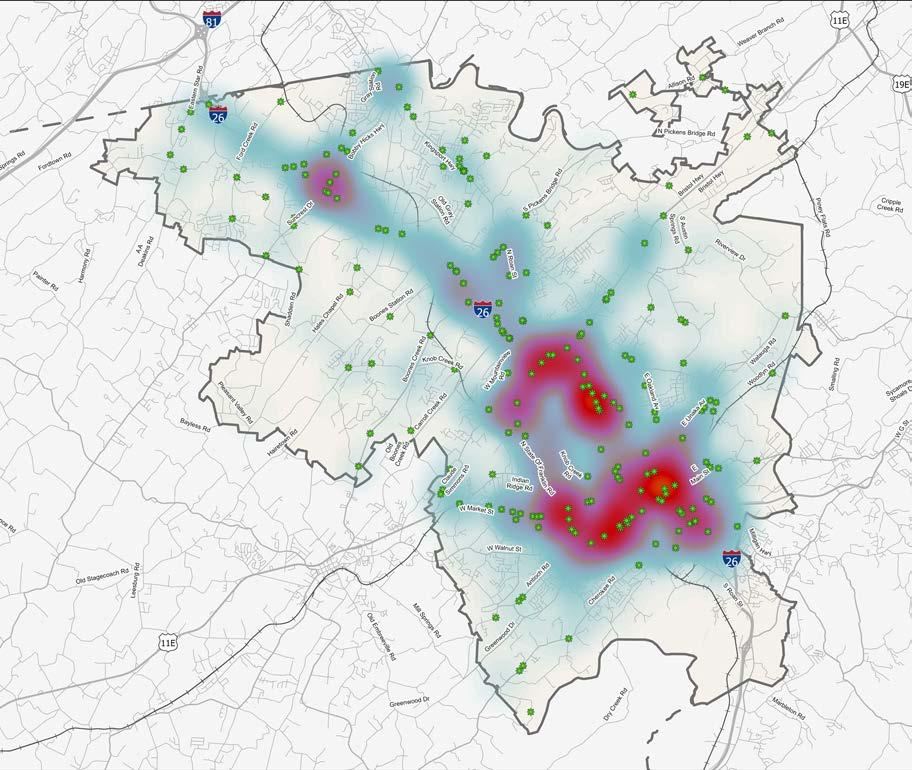
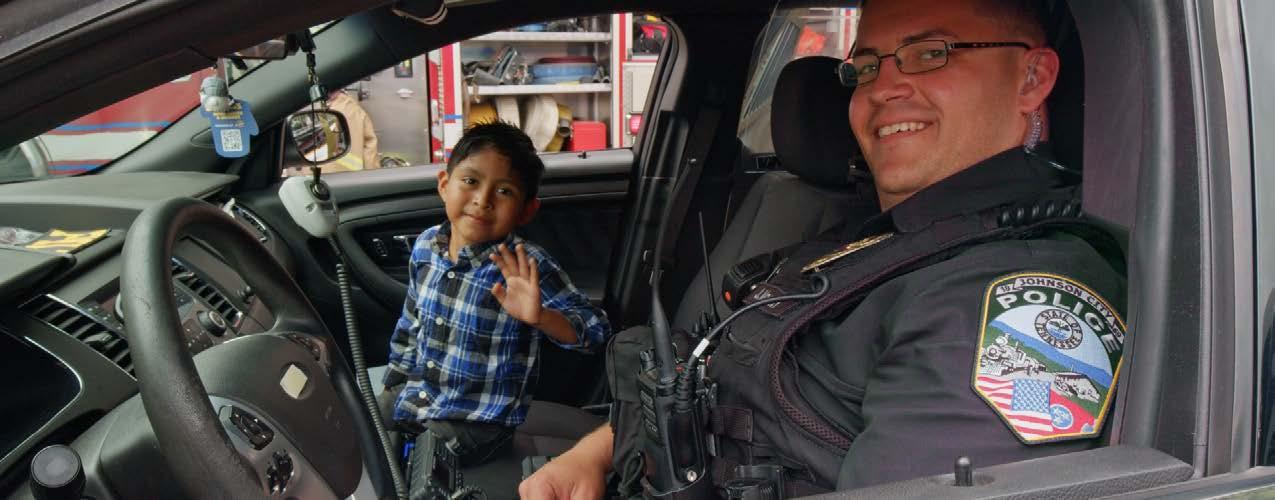
Policy T1.1. Prioritize a multimodal transportation network that supports pedestrians, cyclists, transit users, and motorists.
• T1.1.1: Identify and prioritize key corridors for multimodal enhancements based on user demand and connectivity needs.
• T1.1.2: Implement complete streets principles as applicable to enhance connectivity and ensure infrastructure accommodates all users.
• T1.1.3: Expand and improve sidewalk network to provide safe and efficient non-motorized transportation options.
• T1.1.4: Expand the City’s greenway network to connect neighborhoods with major employment centers and recreational destinations.
• T1.1.5: Conduct an annual accessibility audit of multimodal facilities to identify gaps and prioritize improvements.
• T1.1.6: Foster partnerships with regional transit agencies to enhance connectivity within and beyond Johnson City and seek additional funding sources for expanded transit routes.
Context Sensitive Design works to design roadways and other transportation projects to fit their purpose and the needs of their surrounding community. While some roadways may primarily serve to move people and goods through an area efficiently, many other streets also serve as the hearts of communities, where lower speeds, comfort and safety for pedestrians and bicyclists, and places for people to dwell are higher priorities than maximizing traffic throughput. Context Sensitive Design considers these contexts and works to design streets to best fit the needs for each specific project and community.
Policy T1.2: Ensure transportation infrastructure improvements align with future land use and development goals.
• T1.2.1: Preserve and enhance connectivity between neighborhoods, commercial centers, and employment hubs through targeted infrastructure investments.
• T1.2.2: Continue to incorporate stormwater management and green infrastructure into street and transportation improvements to enhance sustainability.
• T1.2.3: Promote mixed-use developments that integrate transportation options and reduce dependency on singleoccupancy vehicles.
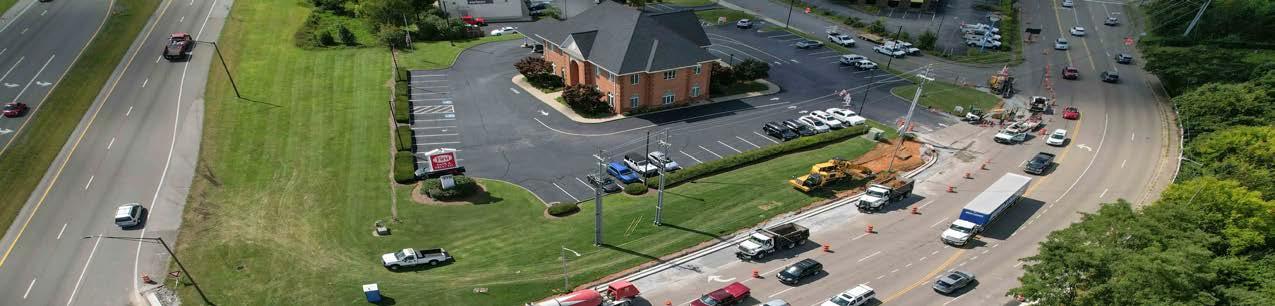
Policy T1.3: Prioritize the proper operation and maintenance of the current roadway network.
• T1.3.1: Monitor traffic volumes, level of service (LOS), safety, and land use to anticipate needed improvements to the local transportation system.
• T1.3.2: Evaluate existing roads under the authority of TDOT to determine fiscal impact and opportunity-cost of establishing local control.
Microtransit is a small-scale public transportation service that offers flexible routes and on-demand scheduling. It operates similarly to other rideshare services where the user enters their current location and desired destination within the service area into an app. The vehicle type allows for a more expanded service area than a fixed route. Typical wait times for users can be customized with the vendor and balanced with available funding.
Microtransit could be a way for Johnson City to serve less dense areas that need transportation options but where fixed-route transit service may not be viable.
Policy T2.1: Enhance safety for all road users though targeted infrastructure improvements and traffic calming measures.
• T2.1.1: Develop a Safety Action Plan.
• T2.1.2: Implement traffic calming measures in residential and commercial areas to enhance motorist, pedestrian, and cyclist safety.
• T2.1.3: Develop and maintain safe routes to schools and major community destinations, through crosswalk enhancements, improved signage, and other strategies.
• T2.1.4: Develop a corridor management plan to optimize traffic flow and access to businesses along major arterial roads.
Traffic calming incorporates physical design measures intended to reduce vehicle speeds, promote safer driver behavior, and enhance safety and comfort for pedestrians and cyclists. While signage, speed limits, and enforcement remain important, traffic calming emphasizes the use of roadway design to minimize conflicts between users and support a safer, multimodal transportation network. Examples of traffic calming measures include:
• Road diets: A reduction in width of vehicular travel lanes to reallocate space for other uses (i.e., bicycle lanes, crossing islands, turn lanes, or parking)
• Speed humps, speed tables, and raised intersections
• Horizontal shifts, chicanes, and mini roundabouts
• Closures to prevent cut-through traffic (i.e., median barriers)
More information on traffic calming strategies can be found via the Institute of Transportation Engineers: ite.org/technicalresources/traffic-calming.
Policy T2.2: Improve pedestrian and cyclist safety through design and maintenance of transportation infrastructure.
• T2.2.1: Encourage pedestrian-first design principles in areas of high foot traffic to minimize conflicts between users.
• T2.2.2: Ensure Americans with Disabilities Act (ADA) compliance for all transportation infrastructure projects to support mobility options that are available to users of all ages and abilities.
• T2.2.3: Upgrade lighting, visibility, and security features at transit stops to enhance pedestrian and cyclist safety.
• T2.2.4: Conduct regular audits of pedestrian and cyclist infrastructure to ensure it meets updated safety and accessibility regulations and policies established through state and federal regulatory agencies.
Policy T2.3: Support the integration of smart transportation technologies to improve system efficiency and user experience.
• T2.3.1: Explore technologies, such as smart signals and app-based parking solutions, and develop procedures for vetting and testing appropriate technology solutions, where applicable.
• T2.3.2: Explore partnerships to test innovative transportation technologies.
Policy T2.4: Foster a culture of safety and awareness among all transportation system users.
• T2.4.1: Launch public education campaigns focused on transportation safety, including responsible travel behaviors and awareness of vulnerable users.
• T2.4.2: Partner with schools and community organizations to promote safe travel practices for students, drivers, pedestrians, and cyclists.
• T2.4.3: Use data-driven approaches to monitor and evaluate the effectiveness of safety programs and adjust as needed.
The complete streets philosophy is built upon the idea that the roadway network should serve the needs of all travelers, and not just automobiles. Complete streets, therefore, include facilities that help drivers, bicyclists, pedestrians, and transit users get to their destinations safely and efficiently. The designs of these facilities consider the varied ages and abilities of roadway users to promote accessibility. Practically, this means the roadway contains infrastructure like sidewalks, bike paths, smart signals, and crosswalks in addition to automobile travel lanes. Not only that, but the facilities also are usable by all ages and abilities and comply with the Americans with Disabilities Act (ADA). This could include the provision of adequate curb cuts to make sidewalks and bus stops accessible to wheelchair users or audible pedestrian signals at crosswalks for the visually impaired. Complete streets offer an approach to travel that is “human-centric,” rather than “auto-centric.”
Incomplete streets are roadways that lack adequate pedestrian, bicycle, or transit facilities, even in areas where multiple modes of travel are already occurring or could be better supported. These gaps can create unsafe conditions for non-drivers and may limit access to jobs, services, and community resources for those who cannot or choose not to drive. Converting incomplete streets into complete streets can take many forms depending on the specific corridor, available space, and community priorities. Strategies may include adding sidewalks or multi-use paths, improving crossings, enhancing transit stops, or reconfiguring travel lanes where appropriate to better accommodate all users. The intent is to create a more balanced and accessible transportation system while maintaining traffic flow and safety.
Policy T3.1: Strengthen regional partnerships to coordinate transportation planning and infrastructure investments.
• T3.1.1: Align regional transportation priorities and funding strategies and advocate for state and federal funding opportunities to support regional transportation projects.
• T3.1.2: Coordinate with neighboring communities to ensure seamless transportation networks across jurisdictions.
Policy T3.2: Expand regional transit options to enhance connectivity between Johnson City and surrounding municipalities.
• T3.2.1: Evaluate the need for park-and-ride facilities in Johnson City to encourage regional commuting options.
• T3.2.2: Develop a comprehensive regional transit plan with transit hubs that connect Johnson City to major employment and residential centers.
• T3.2.3: Explore the implementation of on-demand microtransit options to serve low-density areas and improve firstmile/last-mile connectivity.
Policy T3.3: Improve access to major highways and transportation corridors to facilitate regional economic development.
• T3.3.1: Support initiatives to enhance access to the Tri-Cities Airport and other regional transportation hubs.
• T3.3.2: Collaborate with state and federal agencies to identify and prioritize projects that enhance freight mobility along regional corridors.
• T3.3.3: Encourage infrastructure investments that enhance travel reliability and reduce congestion along key highway corridors.
Policy T3.4: Promote regional connectivity through multimodal infrastructure.
• T3.4.1: Extend trail and greenway networks to connect Johnson City with nearby region and regional destinations.
• T3.4.2: Incorporate regional bikeway and greenway connection into transportation plans to facilitate seamless nonmotorized travel between regional destinations.
• T3.4.3: Develop shared-use paths that link regional transit hubs to employment centers, parks, and neighborhoods.
Policy T3.5: Plan for future regional mobility needs.
• T3.5.1: Establish a long-term vision for regional mobility that incorporates emerging technologies and travel trends.
• T3.5.2: Identify future mobility trends, such as electric vehicle infrastructure, autonomous vehicles, and shared mobility services for integration into regional plans.
• T3.5.3: Coordinate with regional agencies to conduct scenario planning that assesses long-term impacts of growth on transportation networks.
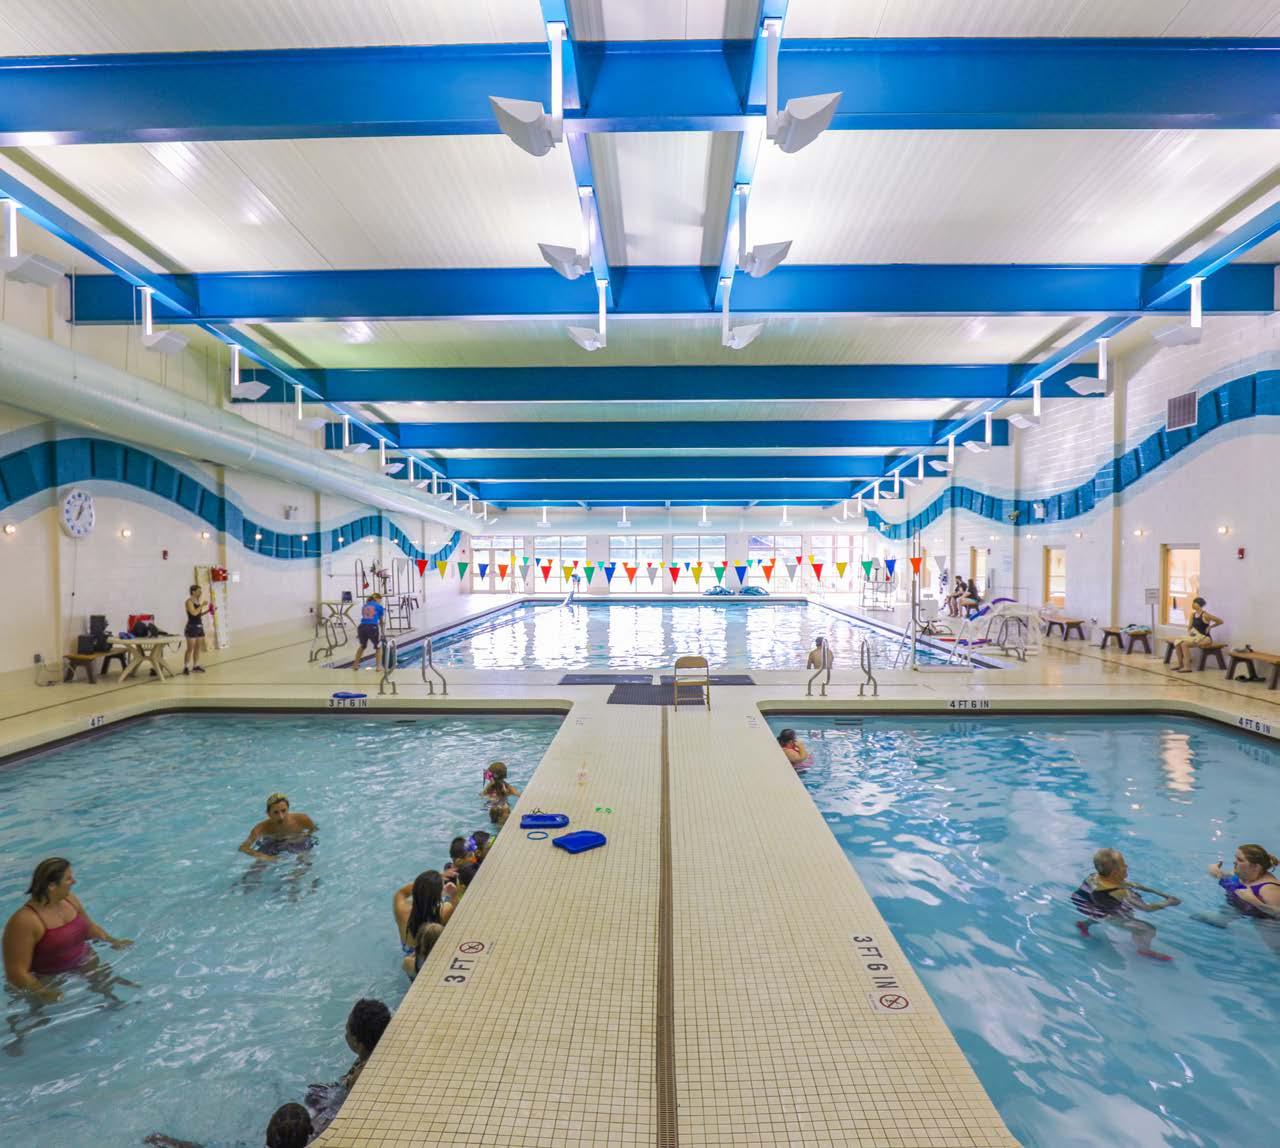
A healthy environment is built through thoughtful planning, well-maintained community infrastructure, and access to the services and amenities that support daily life. In Johnson City, residents rely on a network of civic spaces, parks, health services, and natural areas that collectively influence individual well-being and community resilience. As new developments occur, protecting and expanding these assets will be essential. This chapter explores how Johnson City’s existing facilities, landmarks, parks, and health systems contribute to a healthy and connected community and how they can continue to serve a growing and changing population.
Community infrastructure supports active lifestyles, neighborhood identity, and social connection. From public libraries and recreation centers to historic districts, trails, and health facilities, these assets contribute to both quality of life and longterm resilience. As the City continues to grow, maintaining and expanding access to these resources, particularly in growing areas, will be essential to supporting a vibrant, connected, and health-forward future.
The Study Area is home to 33 community centers, three libraries, and three museums. These spaces provide opportunities for residents of all ages to engage in educational, cultural, and recreational activities. The Johnson City Public Library, located in Downtown, serves as a key civic and learning hub for the community. Additional library locations are found near Boones Creek and Gray, expanding access to residents in the northern part of the Study Area. Community centers are more heavily concentrated in the central and southern parts of Johnson City, offering a range of programming including fitness classes, youth activities, arts and crafts, and public meetings. While the central urban core is well served by these facilities, there are fewer community assets in more rural or peripheral areas of the Study Area, including the northwestern and eastern edges. As the City grows, future investment in community infrastructure should consider how to close these gaps and expand access to health-supportive amenities.
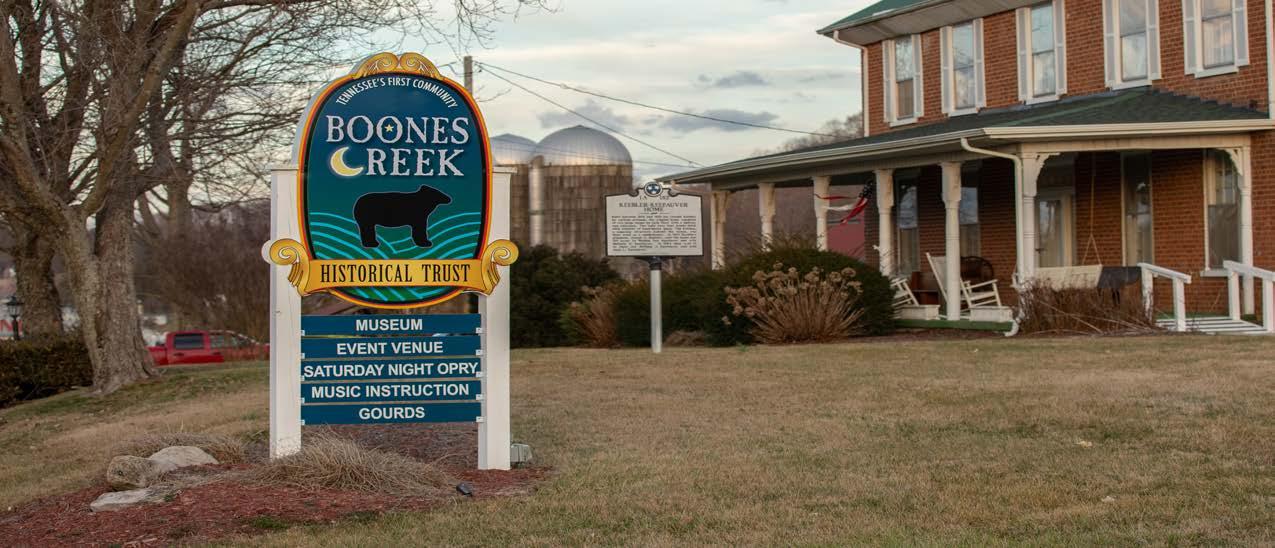
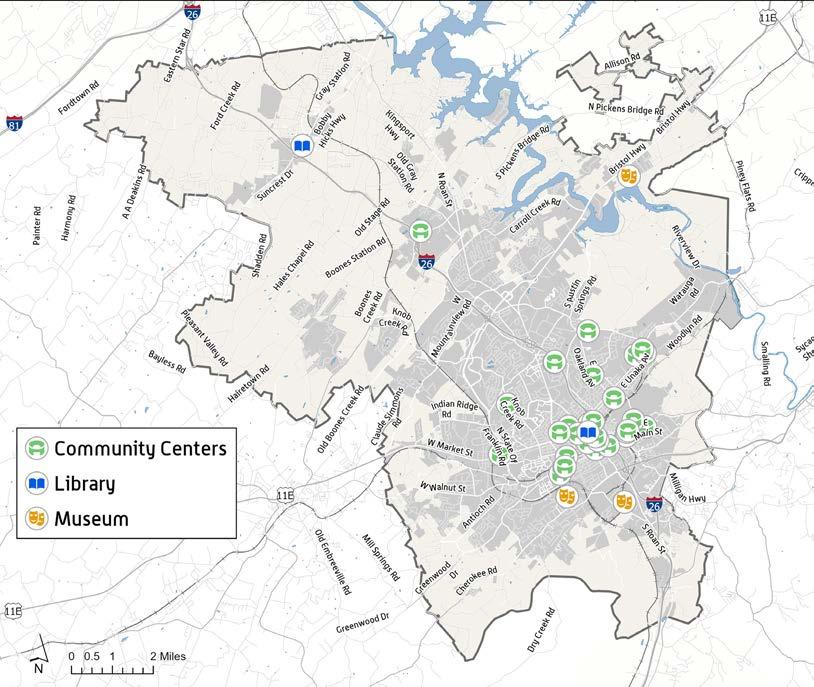
Civic and cultural facilities in Johnson City serve not only as public amenities but as everyday spaces where history, identity, and community life intersect. From the Johnson City Public Library to the Langston Centre to the Reece Museum, these institutions play a unique role in shaping how residents access learning and engage with local heritage. Museums and libraries located in walkable and accessible locations offer inclusive access to creative programming, community events, and educational exhibits. As the City grows and continues to invest in its public realm, there is an opportunity to strengthen the cultural role of everyday civic spaces. This includes integrating local heritage into park signage, public art, or facility renovations; elevating the visibility of underrepresented histories; and ensuring that museums and libraries remain dynamic and evolving institutions that meet the needs of all residents. These efforts can help position community facilities as active contributors to Johnson City’s cultural landscape and not just places where people gather but places that reinforce who the community is and what it values.
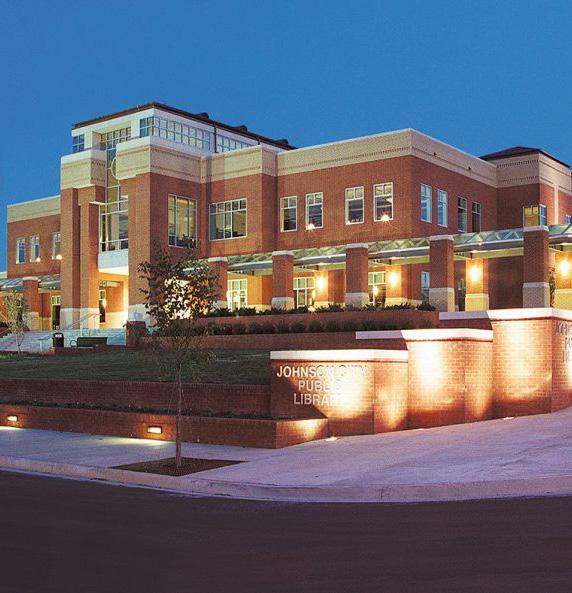
Historic landmarks and districts contribute significantly to Johnson City’s sense of place, community pride, and cultural identity. Within the Study Area, 23 designated Historic Places and four Historic Districts preserve important stories, architecture, and civic assets that reflect the City’s growth over time. Outside of the Downtown core, Historic Places are distributed throughout the City, such as the Tipton-Haynes State Historic Site, which preserves part of Tennessee’s early statehood, and the former Clinchfield Railroad Station, a symbol of Johnson City’s transportation and industrial past. These cultural assets enhance neighborhood identity, support heritage tourism, and provide opportunities for education and community events.
Source: Kimley-Horn; Johnson City
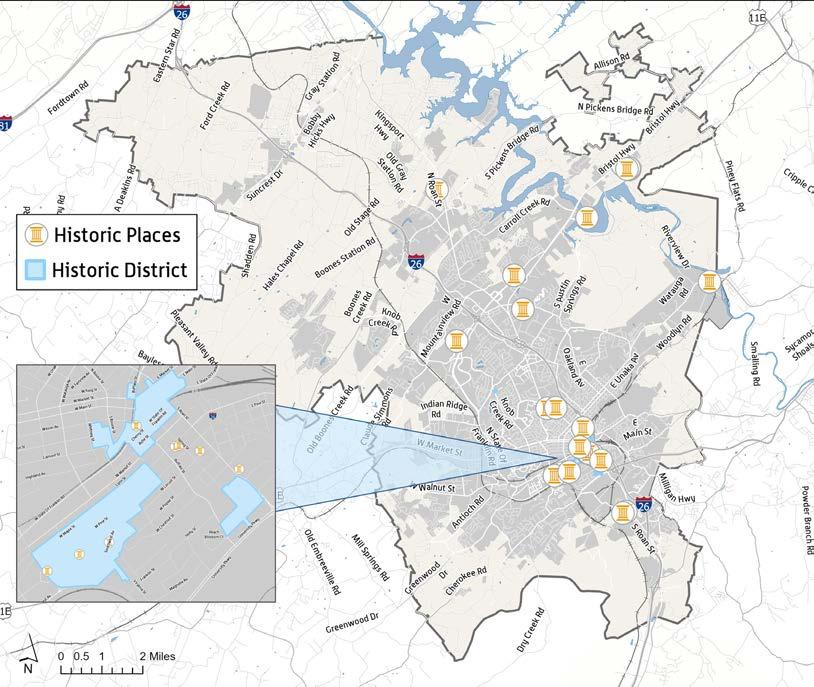
Historic districts in Johnson City reflect the architectural patterns, cultural stories, and urban layouts that define Johnson City’s evolution from a rail-connected industrial town to a modern Appalachian community. The City’s Historic Conservation Overlay District, established through the zoning ordinance, helps protect the unique character of these places by regulating exterior changes, encouraging context-sensitive development, and guiding reinvestment. While design standards vary by district, the overlay ensures that historic areas are not lost to incompatible infill, preserving both aesthetic cohesion and neighborhood identity. National Register Historic Districts within this overlay include:
• The Johnson City Commercial Historic District captures the heart of the City’s early commercial growth through preserved storefronts, warehouses, and civic buildings.
• The Tree Streets Historic District noted for its Craftsman and Colonial Revival homes, walkable street grid, and mature tree canopy.
• The Knob Creek Historic District reflects early agricultural and residential development tied to the City’s expansion beyond the Downtown Core.
These districts continue to host homes, businesses, churches, and civic uses that contribute to the daily life of the City. Their visual character and walkability often make them some of the most desirable and active areas for both residents and visitors. As Johnson City plans for future growth, its historic districts offer a model for how to balance development with long-term community character.
Johnson City’s landscape is shaped by its proximity to the Appalachian Mountains, varied topography, and abundant water resources. The Study Area includes major natural features such as Boone Lake, the Watauga River, and Buffalo Mountain, with elevations ranging from 1,260 to 3,232 feet. Key natural features, such as 100-year floodplains, wetlands, and major riparian corridors, provide ecosystem services like flood mitigation, water filtration, and habitat for native species, and serve as a natural buffer during extreme weather events. Large portions of the City’s floodplain follow major creeks and waterways, emphasizing the importance of resilient development practices and stormwater management. Wetlands, while limited in total area, contribute to biodiversity and should be preserved to support long-term environmental health.
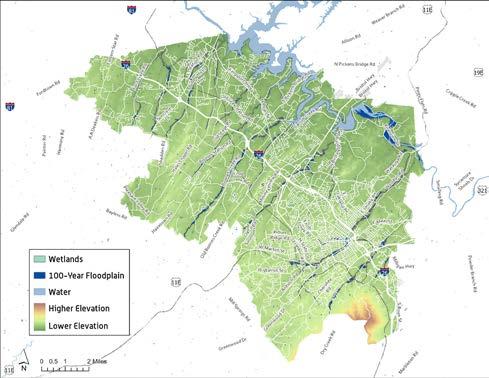
Source: Johnson City
Buffalo Mountain, one of the City’s highest elevations and a defining geographic landmark, is home to protected forestland, hiking trails, and unique plant and animal species. Preservation of this natural area enhances both ecological integrity and public access to nature. As Johnson City grows, protecting natural systems and integrating green infrastructure into urban development will be essential. Land use practices, especially near water bodies, flood-prone areas, and steep slopes, will support biodiversity, reduce risk, and preserve the natural beauty that defines the region.
Ridgeline Protection
Ridgelines are the elevated crests of hills or mountains that define the skyline. In Johnson City, they’re most visible around Buffalo Mountain and the surrounding uplands that shape the City’s scenic backdrop. Ridgelines help manage stormwater, prevent erosion, preserve habitat corridors, and contribute to Johnson City’s unique visual identity. Unregulated development along ridgelines can lead to hillside instability, degraded viewsheds, and long-term infrastructure costs. Cities protect ridgelines by limiting the height, density, and location of new development in sensitive areas. This can be achieved through:
• Steep slope regulations
• Conservation zoning or overlay districts
• Viewshed analysis and development guidelines
• Open space preservation or land acquisition
• Public education about ecological and visual impacts
By proactively protecting ridgelines, Johnson City can safeguard its natural beauty and reduce future environmental risks, while preserving the very features that make it an appealing place to live and visit.

Parks and recreation are key to building a healthy, vibrant, and connected community. The Study Area includes more than 20 parks and designated open spaces, along with five recreation facilities and four sports complexes, encompassing more than 1,300 acres of parkland throughout Johnson City. These spaces provide essential outlets for physical activity, community events, and intergenerational engagement. Most parks and recreational assets are concentrated in the central and southern portions of the City, where access is supported by a higher population density and more developed infrastructure. Major assets include Winged Deer Park, a multi-use facility offering lake access, trails, and sports fields; and the Carver Recreation Center, which provides youth programming, indoor recreation, and fitness classes. Several facilities are integrated with schools or greenway corridors, helping to promote walkability and maximize community benefit.
Johnson City’s Park system supports environmental goals as well. Natural open spaces and tree cover help manage stormwater, improve air quality, and create shaded microclimates that reduce urban heat. Parks also serve as social infrastructure, spaces where residents can gather, volunteer, or simply recharge. As the City continues to evolve, future investment should prioritize connectivity between recreational assets, support underserved areas, and maintain a focus on inclusive, accessible, and sustainable public spaces.
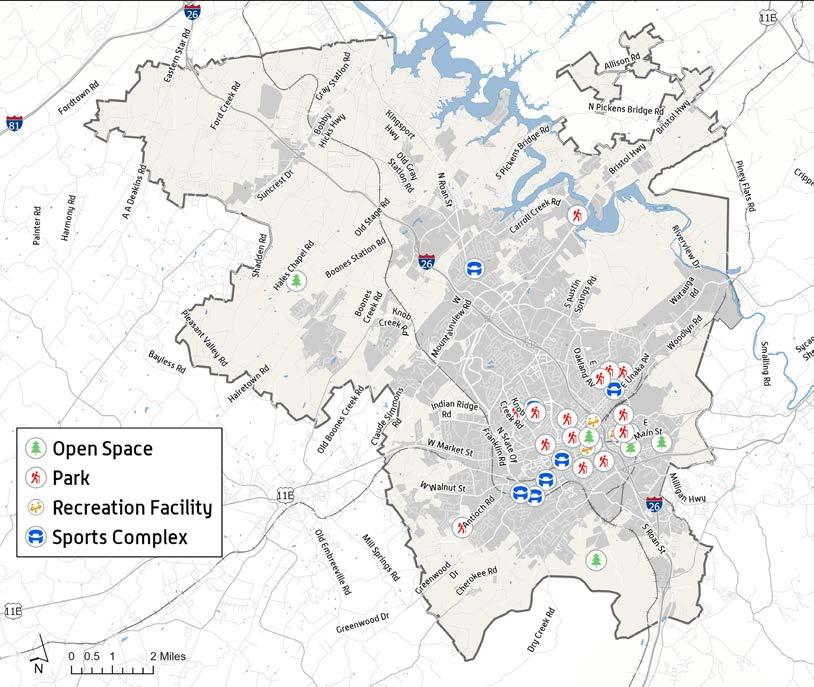
Source: Kimley-Horn; Johnson City
The Parks and Recreation Comprehensive Master Plan was adopted by the Johnson City Board of Commissioners in 2024. The plan aims to connect Johnson City through the development and stewardship of inclusive parks and programs while preserving natural resources, allowing the community to thrive on its unique recreational opportunities. As Johnson City experiences significant growth, Parks and Recreation will be a major component necessary for a successful, thriving community. The Master Plan provided takeaways on the future of Parks and Recreation in Johnson City. Based on the data collection, the plan identified the following themes and goals:
• Create trails, greenways, and bikeways that prioritize connections for all residents to parks and recreational facilities
• Establish partnerships with external stakeholders to increase overall connectivity capacities
• Improve and expand inclusive programming addressing community needs
• Prioritize accessibility and inclusivity through park and facility development and improvements
• Maintain affordability
• Ensure access for growing populations
• Ensure existing resource longevity through intentional planning
• Prioritize consistency and standards
• Support staff development and engagement
• Improve community interactions
• Create an inclusive community
As Johnson City grows, ensuring residents have access to outdoor spaces will become increasingly important. Neighborhood parks, typically 2 to 10 acres, play a key role in supporting youth sports, social gatherings, and self-directed recreation. These smaller parks maintain a strong sense of community, especially for areas not immediately served by larger regional facilities. The Parks and Recreation Master Plan identifies several areas of the City where park access is lacking. Infill development and annexation have created neighborhoods where green space is either undersized or absent altogether. Future land use planning should prioritize securing vacant parcels in these areas to fill access gaps and provide residents with recreational opportunities. Developing these lots will help preserve open space, increase property values, and support community well-being as new neighborhoods are built out.
Keefauver Park
One of Johnson City’s upcoming projects is the transformation of Keefauver Farm into a new regional park. The 55-acre farm site will feature natural trails, an adaptive play area, wildlife observation decks, and an outdoor amphitheater. The master-planned space will serve recreational needs in one of the City’s growth areas, preserve open space, provide learning opportunities for children, and enhance the City’s stormwater resilience through naturebased design.
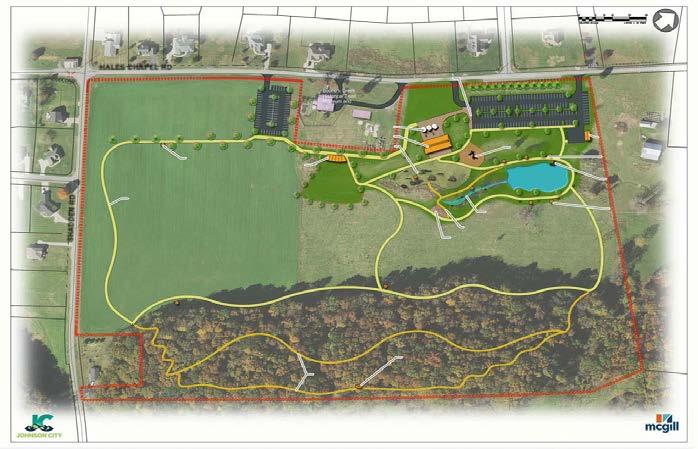
Johnson City is served by a robust regional healthcare network, yet access to consistent and affordable care remains a top concern. The 2024 Community Health Needs Assessment (CHNA) conducted by Ballad Health found that chronic disease, behavioral and mental health, and overweight/obesity were the most pressing health challenges in Washington County. Residents emphasized challenges around diet, physical activity, substance use, and access to healthcare as major barriers to improving personal well-being. As the population grows, so does the demand for preventive care, outpatient services, and healthcare facilities that are accessible across different parts of the City. Addressing these needs will require a mix of community-based services, wellness programming, and land use strategies that support healthier lifestyles.
In 2024, Ballad Health conducted a Community Health Needs Assessment for the Johnson City Medical Center. The objective of this assessment is to improve the health of the region by focusing on access and quality of healthcare and population health measures to address the region’s health disparities and access challenges. The assessment provides insights into the health conditions and disparities for the population of the Johnson City Medical Center’s service area.
Key Findings and Considerations:
• Chronic disease was the number one health priority in the region, primarily a result of diabetes, heart disease, and cancer.
• Behavioral and mental health was the second top health priority. 39% of adults in Washington County suffer from either mental health or substance use conditions. The top three root causes were drug and alcohol use, access to quality healthcare, and income/poverty.
• Chronic disease, behavioral and mental health, obesity and overweight were the top three health priorities in the region, particularly in Washington County
• The third priority was overweight and obesity, affecting 25.5% of the population of Washington County. The three primary root causes were access to diet/nutrition/exercise, income/poverty, and access to quality healthcare.
• By prioritizing these three health issues, interventions and resource allocation can be utilized to improve health outcomes
Planning for a healthy community goes beyond health care delivery, it involves how neighborhoods are designed, how people move through the City, and where services are located. As Johnson City continues to grow, it will be important to ensure new developments incorporate access to medical care, recreation, and healthy food. Mixed-use centers that integrate clinics or urgent care facilities with residential or commercial uses can help bring services closer to residents and reduce travel time for basic care. At the same time, healthcare partners will need to consider future capacity, particularly, for emergency services, behavioral health, and community-based care. Coordination between the City and healthcare providers can help ensure land is available for future facilities and that key services gaps are being addressed proactively.
Residents share a strong interest in services that promote long-term health, this includes health education, mental wellness resources, and recreation programming that encourages physical activity. Community facilities, parks and trails play a key role in promoting active lifestyles but additional investments in youth programs, senior fitness classes, and mental health outreach have been identified as a priority. Stakeholders have emphasized the importance of placing health services where people already gather, this includes places such as schools, parks, and community centers. This approach reduces barriers to care, increases program participation, and ensures health is part of everyday life in Johnson City.
Objective H1. Respect the heritage of Johnson City to foster community pride through a strong sense of place
Policy H1.1: Support redevelopment and revitalization efforts that respect the City’s historic character.
• H1.1.1: Create a comprehensive inventory of historic landmarks, sites, and cultural assets and update periodically.
• H1.1.2: Develop and apply a methodology for prioritizing needed revitalization efforts to inventoried historic landmarks, sites, and cultural assets.
• H1.1.3: Develop guidelines that integrate historic preservation principles into redevelopment projects.
• H1.1.4: Provide incentives for adaptive reuses of historic structures to highest priority revitalization efforts.
Policy H1.2: Integrate land use planning with historic preservation.
• H1.2.1: Identify zoning and land use tools that protect historic districts and prevent incompatible uses.
Policy H1.3: Celebrate and promote Johnson City’s cultural and historic resources.
• H1.3.1: Integrate local heritage and history into park designs, interpretive signage, and events.
• H1.3.2: Develop and promote heritage trails that connect historic and cultural sites across the City.
• H1.3.3: Coordinate with the Johnson City Visitor’s Center to enhance marketing efforts to showcase Johnson City’s cultural and historic resources.
Policy H2.1: Protect natural resources and promote environmental stewardship.
• H2.1.1: Work to preserve wetlands, forests, and waterways as key recreation and environmental assets.
• H2.1.2: Implement programs to protect ridgelines and viewsheds and restore degraded natural areas.
• H2.1.3: Establish guidelines for voluntary conservation easements to protect sensitive habitats and agricultural lands.
• H2.1.4: Designate future land uses that are consistent with the preservation of natural resources.
• H2.1.5: Develop conservation zoning districts to protect habitat, natural features, and existing farmland.
• H2.1.6: Work with the City Forester to review and update the City’s landscaping requirements on a periodic basis to ensure they encourage the use of natural and drought-tolerant species.
• H2.1.7: Design and implement a public information campaign, including hard copy and online materials, to educate residents on how they can protect the natural environment.
As Johnson City expands it’s important to protect natural areas that define the City’s Character. Two tools that support this are:
Voluntary Conservation Easements is when a landowner agrees to limit future development to preserve farmland, forests, or scenic views, while still keeping private ownership. These easements can also provide tax benefits.
Conservation Zoning is zoning tool to guide development away from sensitive areas like hillsides or creeks by setting limits on density, requiring buffers, or encouraging clustered housing that preserve open space.
Both tools help manage growth responsibly, protecting watersheds, reducing flood risks, and maintaining quality of life for future generations.
Policy H2.2: Encourage sustainable practices in development and infrastructure.
• H2.2.1: Promote green building practices though incentives and awareness campaigns.
• H2.2.2: Update zoning ordinances and building codes as required to encourage low-impact development practices, such as the use of permeable pavements, bioswales, and green roofs in new developments.
• H2.2.3: Build upon environmental stewardship practices and expand initiatives as newer technologies are available.
Green building practices help lower utility costs, reduce environmental impacts, and improve indoor comfort. For Johnson City, these strategies can be scaled to fit homes, offices, schools, or public facilities.
Examples include:
• Using energy efficient windows and insulation to reduce heating and cooling needs
• Installing LED lighting and Energy Star appliances
• Choosing locally sourced or recycled materials during construction
• Planting native landscaping to reduce irrigation needs
• Installing rainwater collection barrels for outdoor watering
• Adding solar panels or battery backups for long-term savings and energy security.
Even small improvements in building design can have a big impact when applied across new neighborhoods or renovations. Encouraging builders and homeowners to adopt these practices help Johnson City grow more sustainable.

Low-impact development (and more generally, green infrastructure) is a category of systems for stormwater management that mimic natural processes to preserve water quality and benefit habitats. This approach to land development or redevelopment aims to manage stormwater as close to its sources as possible, thereby limiting runoff and the spread of pollutants. These methods help to decrease the negative environmental consequences of growth. Specific methods include:
• Bioretention facilities
• Rain gardens
• Green/vegetated rooftops
• Rain barrels
• Permeable pavement
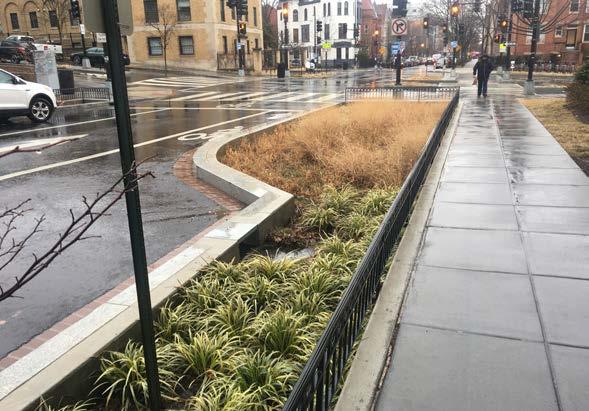
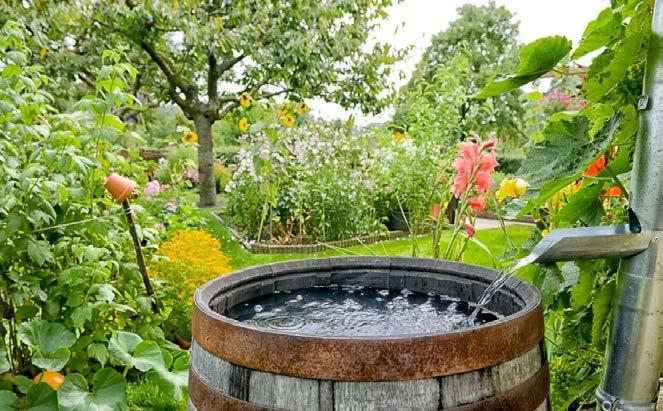
Policy H2.3: Foster public engagement in environmental initiatives.
• H2.3.1: Develop educational programs in partnership with schools to teach residents about conservation and healthy lifestyles through parks.
• H2.3.2: Develop relationships with existing community advisory boards to help educate and guide environmental policies and projects.
Policy H2.4: Support community accessibility to open space through implementation of the Parks and Recreation Master Plan.
• H2.4.1: Implement priority initiatives from the Parks and Recreation Master Plan.
• H2.4.2: Identify and pursue a mix of funding sources to provide for ongoing maintenance and future improvements to parks, trails, and open space to meet community needs as the City grows.
• H2.4.3: Assess vacant lots owned by Johnson City or faith-based organizations for appropriateness to support the increase in housing supply.
Objective H3. Support an effective healthcare system to encourage healthy and active lifestyles.
Policy H3.1: Promote access to healthcare services for all residents.
• H3.1.1: Identify and address gaps in healthcare access through partnerships with local providers and non-profit organizations.
• H3.1.2: Support the development of community health centers in underserved areas.
• H3.1.3: Continue to collaborate with Parks and Recreation to identify opportunities for health and wellness programs in park facilities.
• H3.1.4: Encourage mixed-use development that integrates residential, healthcare, and recreational facilities.
Policy H3.2: Encourage healthy lifestyles and preventative care.
• H3.2.1: Expand recreational programming and facilities to promote physical activity and wellness.
• H3.2.2: Continue to partner with healthcare organizations to offer health education programs, prioritizing communities with gaps in healthcare access.
• H3.2.3: Expand facility planning and programming for youth, families, and active adults/seniors.
• H3.2.4: Continue to offer active programming, such as fitness classes, aquatics programming, community events, or environmental education programs, to make parks more vibrant and engaging to a wide range of residents.
Policy H3.3: Improve emergency and specialized healthcare services.
• H3.3.1: Assess healthcare system capacity to meet the needs of a growing population.
• H3.3.2: Enhance coordination between healthcare providers and emergency response teams to ensure residents and users of new development can be adequately served.
• H3.3.3: Partner with the major healthcare providers to better understand and plan for possible expansion plans to support services for a growing population.

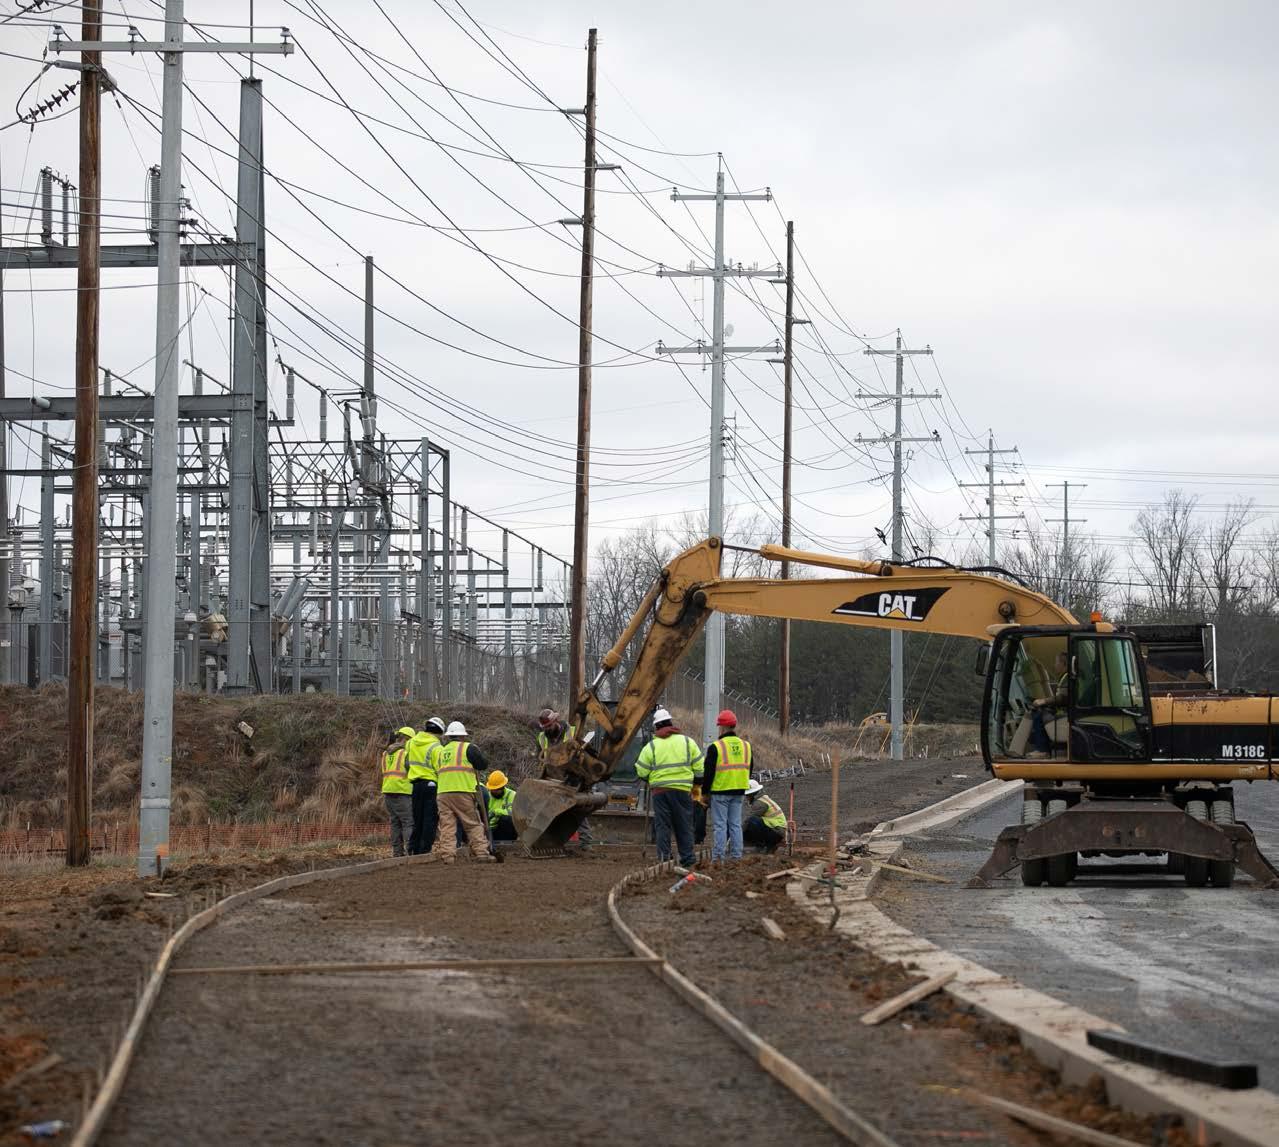
Horizon 2045 incorporates the provision of services and utilities into Johnson City’s long-term planning and anticipated future growth and development. This chapter contains an inventory and overview of the infrastructure on which Johnson City is built as well as the services the City provides to residents and businesses in the Study Area. These services and utilities give Johnson City’s neighborhoods the ability to function, increasing quality of life and benefiting the local economy.
Johnson City provides a variety of services and utilities that allow the community to function. This section describes the different types of infrastructure and services provided to residents and businesses in the Study Area.
Johnson City Water and Sewer Services operates infrastructure and provides services to the City and areas in the four surrounding counties — Washington County, Sullivan County, Unicoi County, and Carter County. According to the Department, it treats more than 10 billion gallons of water each year — 5.6 billion gallons of potable water and 5 billion gallons of wastewater. The Department serves almost 130,000 people every day, maintains a water capacity of 28 million gallons per day (MGD), and maintains a sewer capacity of 26 MGD across three treatment plants. The Department faces a variety of pressures related to growth and development in the region, notably:
• High-density units, such as multi-family residential or university-related development
• Development along the ridgeline where water service is more challenging to accommodate due to the elevation
WATER INFRASTRUCTURE MAP
The Johnson City Water and Sewer Department provides water service to residential and nonresidential uses. The system includes two water treatment plants and 947 miles of waterlines. The Department receives water from two sources — Unicoi Springs and the Watauga River — and serves the area within the Johnson City limits and various unincorporated areas within Washington, Carter, Sullivan, and Unicoi Counties.
• Sewer capacity, especially downstream
• Desire to keep rate adjustments minimal to preserve affordability for customers
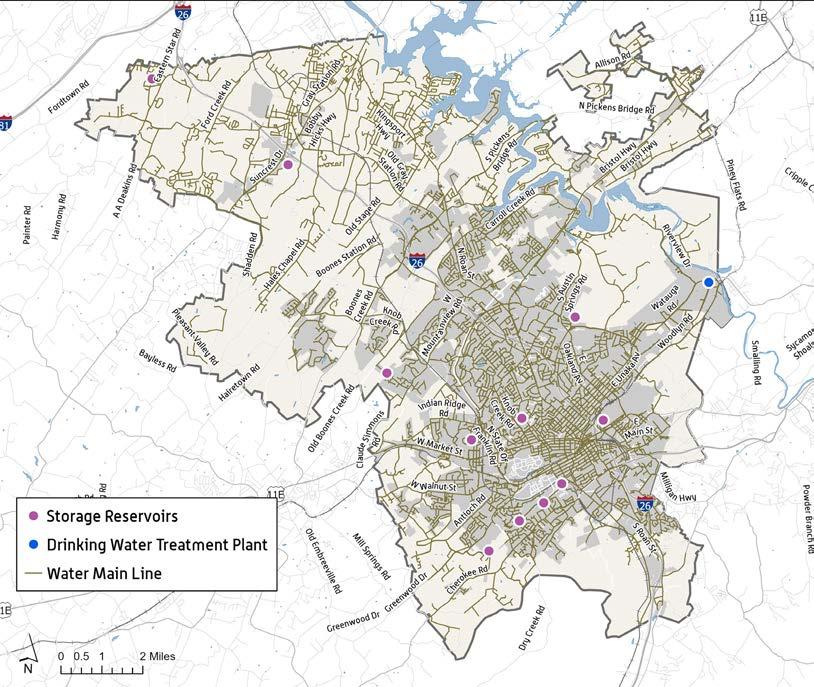
Source: Johnson City; Kimley-Horn
Like the water system, the Water and Sewer Department manages the City’s sewer system, which includes sewer lines, mains, and pump stations. The sewer system serves areas within the Johnson City limits as well as various unincorporated areas within Washington, Carter, Sullivan, and Unicoi Counties. The total system includes three wastewater treatments plants and roughly 759 miles of sewer line. The majority of the lines within the system are gravity lines, meaning they rely on gravity to move sewage through the system, to pump stations and, ultimately, to treatments plants.
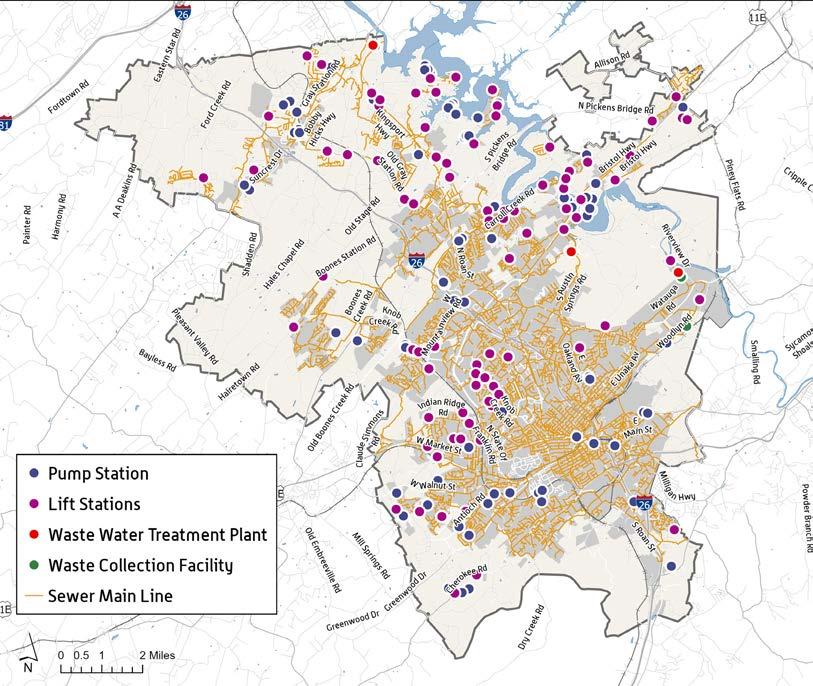
Source: Johnson City; Kimley-Horn
This award-winning utility service provider draws mainly from the Watauga River as its water source and operates five main facilities:
The Unicoi Springs Water Treatment Plant has served Johnson City for over a century. Originally constructed in 1905, it was the City’s primary water source until World War II and has since undergone several upgrades to support continued operations and meet modern treatment standards. The plant relies still on the springs (with a daily production of 4 MGD) as its water source. The facility — relocated from the original and located off Highway 107 in Unicoi — uses a variety of water treatment methods to produce its potable water, using an upgraded disinfection process implemented in 2010.
The Watauga Water Treatment Plant was added to supplement the capacity of the Unicoi Springs Water Treatment Plant when the region began to grow beyond what the original treatment plant could provide. The Watauga Water Treatment Plant was completed in 1968 and uses the Watauga River as its raw water source. The facility has undergone two upgrades since its original opening. The first occurred in 1981 and expanded the output potential from 8 MGD to 16 MGD. The next expansion occurred between 1996 and 2003 to the plant’s current 24 MGD capacity. The Watauga Water Treatment Plant boasts a variety of innovative technologies, including an automated Supervisory Control and Data Acquisition (SCADA) system that allows the Department to monitor the plant’s performance in real-time and optimize efficiency.
The Brush Creek Wastewater Treatment Plant has been in operation since 1955. It is located just off Riverview Drive in Johnson City and was one of the first municipal wastewater plants in Northeast Tennessee. The current design allows for a normal daily flow of 16 MGD of wastewater per day as well as peak flows of 25 MGD. The safe and efficient operation of this facility has earned it a series of awards, including the National Association of Clean Water Agency (NACWA) Gold Award and the Kentucky-Tennessee Water Environment Association Operational Excellence award. The plant is the primary solution to keeping water resources like Boone Lake from being overrun with unsanitary wastewater.
The Knob Creek Wastewater Treatment Plant, also located in Johnson City, has been operating since 1982. It is currently designed to treat normal daily flows of 4 MGD of wastewater and peak flows of 15 MGD. The facility was upgraded in 2010 to accommodate a safer disinfection process. Like the Brush Creek facility, the Knob Creek Wastewater Treatment Plant is also award winning — receiving the NACWA Platinum Award and a Kentucky-Tennessee Water Environment Association Operation Award.
The Regional Wastewater Treatment Plant serves an important purpose in the Boone Lake Watershed region north of Johnson City. With construction finalized in 1978, the facility provided a centralized sewage system to these residents for the first time ever. Prior to that, residents and businesses were served either through package treatment plants or septic systems. The facility currently operates to treat normal daily wastewater flows of 6 MGD and peak flows of 15 MGD. Following a recent major expansion (utilizing $24 million in local funding) allowed the facility to meet more stringent effluent limits. The plant has received the NACWA Gold Award and the Kentucky-Tennessee Water Environment Association Operational Excellence Award.
BrightRidge, a publicly owned utility company, provides electricity to all homes and businesses in Johnson City. The electrical utility was originally known as the Johnson City Power Board but has been known by its new name, BrightRidge, since 2017. The service provider operates more than 80,000 metered locations, boasts a more than 99% service reliability percentage, and has rates lower than most other cities in the US. It also serves more than 83,000 customers in Washington, Sullivan, Carter, and Greene Counties.
The utility dates back more than 100 years to its founding in 1888 and remained in private ownership under a variety of names and operators through the 1940s. The Tennessee Valley Authority (TVA) acquired the utility (then called the East Tennessee Light and Power Company) in 1945 and, later that year, signed a contract with Johnson City to become the sole provider of electricity in this area. The charter was updated in 2017 to modernize the utility’s operations; however, BrightRidge remains a not-for-profit, local power company. As such, the utility publishes detailed annual reports each year outlining audited financial statements. According to the 2024 annual report, BrightRidge is the tenth largest (out of 153) of TVA’s local power companies.
Beginning in 2018, the electrical utility began a highspeed internet division called BrightRidge Broadband. The service currently provides internet, voice, and video services to a service area that includes Johnson City, Jonesborough, Kingsport, Washington County, and parts of Sullivan, Carter, and Greene Counties. As of July 2024, the broadband arm served more than 16,000 customers in the area through a combination of fiber-optic and wireless broadband technology.
As of the date of this report’s publication, BrightRidge utilizes a grant program funded by the American Rescue Plan called the Middle-Mile grant project. Within the grant program coverage area, eligible participants can gain access to the broadband service. The availability map includes rural areas in Washington and Greene Counties, areas south of Jonesborough, and areas south of Gray.
Solid Waste Services provides garbage and recycling services to roughly 95% of residential and commercial customers in Johnson City and also serves customers in Washington County. The service includes curbside pick-up, convenience sites, and e-waste programs. The Division provides weekly household waste collection on staggering days, based on geographical location within the service area map. As of the date of this report’s publication, yellow areas of the map receive collection services on Mondays, green on Tuesdays, blue on Wednesdays, orange on Thursdays, and pink on Fridays.
In addition to traditional residential and commercial solid waste pick-up, the Division provides more specialized household hazardous waste and miscellaneous item disposal. Items include furniture, appliances, tires, batteries, cooking oil, electronic waste (e-waste), fluorescent bulbs, medications, and paint.
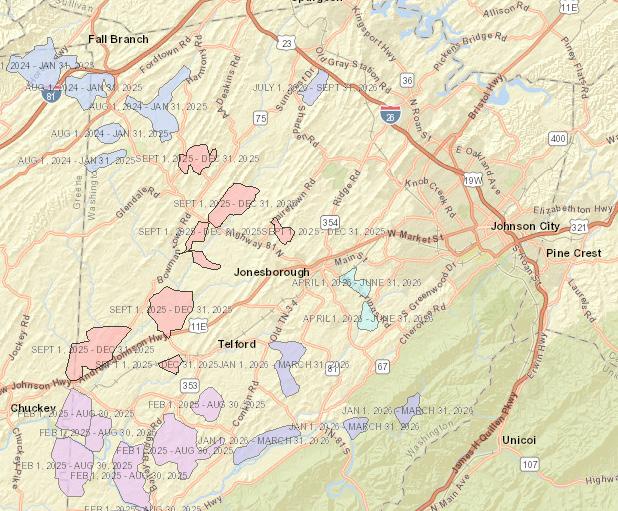
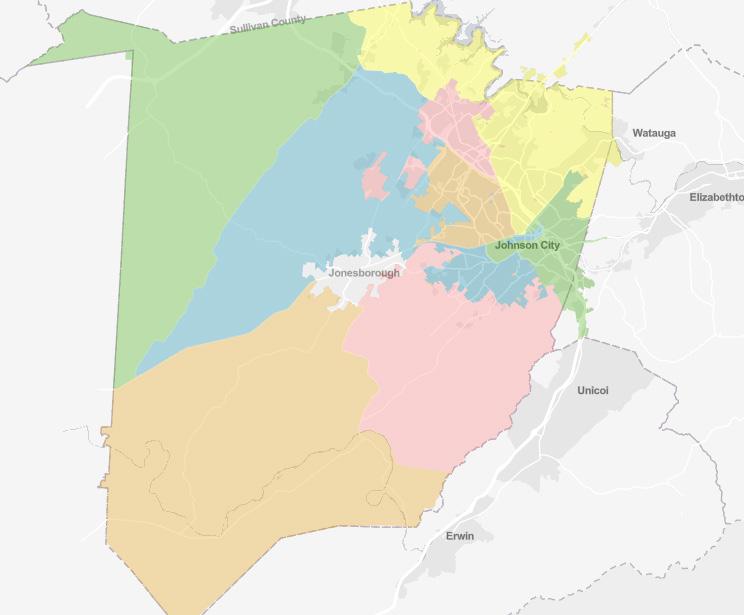
The City’s voluntary recycling program has been in operation since 1989, resulting in more than 130,000 tons of materials recycled in the City since that time. The curbside service will accept a variety of recyclable items, including type 1 or 2 plastics, glass, cardboard, paper, and aluminum. In addition to the curbside service, drop-off locations located throughout the City provide recycling receptacles at most parks and athletic fields.
Police, fire, and emergency services promote the safety of residents. The Study Area is home to police, fire, and EMS stations and medical facilities.
The public services that promote public safety include police, fire, and emergency services. These maps show where the police, fire, and EMS stations are located throughout the Study Area, in relation to the hospital and medical facilities.
POLICE/MEDICAL MAP
Source: Kimley-Horn; Johnson City, 2024
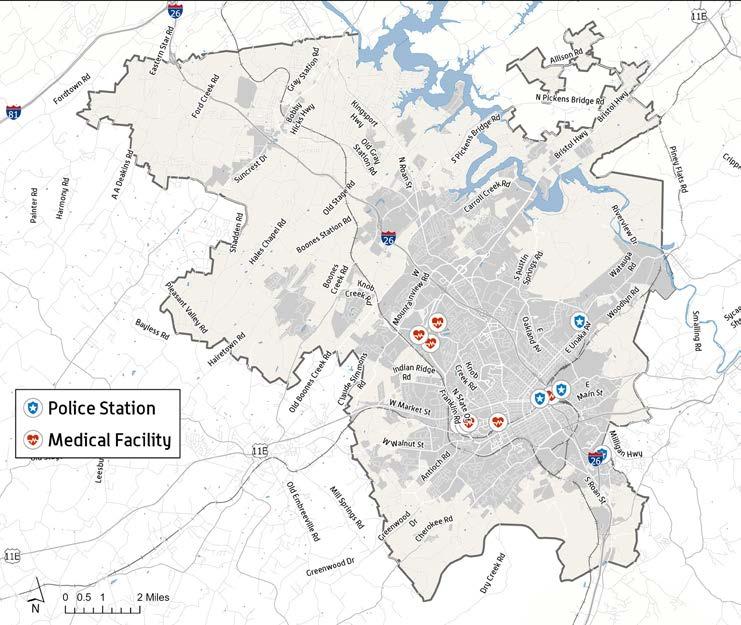
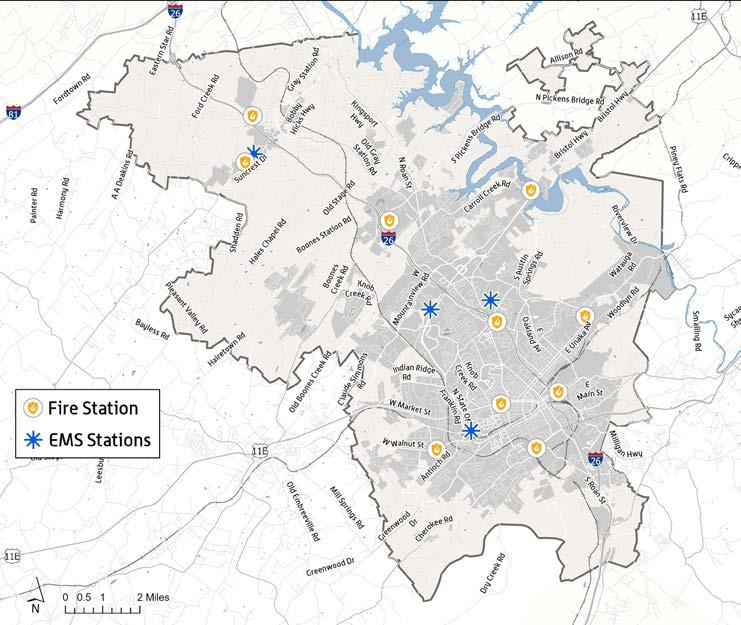
FIRE AND EMS MAP
Source: Kimley-Horn; Johnson City, 2024
As of the date of this report’s publication, the Johnson City Police Department staffs 175 sworn officers and 18 civilian employees who serve in record-keeping, administrative, and support roles. The Department has maintained accreditation through the Commission on Accreditation for Law Enforcement Agencies since 1993 and through the Tennessee Law Enforcement Accreditation Program since 2011. The Department is headed by a Chief of Police and a Deputy Chief and broken into a variety of divisions:
• Operations Division (investigators, uniformed officers, and civilian personnel), which includes a variety of patrol and nonpatrol platoons, specialized units (K9 Unit, Special Weapons and Tactics Unit, Explosives/Ordinance Disposal Unit, Bicycle Patrol, Crisis/Hostage Negotiations Unit), and Criminal Investigations, which includes the Special Victims and the Special Investigations Units.
• Administrative Division (uniformed and civilian personnel)
• Office of Professional Standards (uniformed and civilian personnel)
• Internal Investigations Unit (investigative personnel)
• Family Justice Center (civilian personnel)
In addition to criminal investigation, active patrolling, and traffic enforcement, the Department engages in a variety of programs intended to improve community safety and quality of life.
The Junior Police Academy is designed to engage area youth who have an interest in law enforcement, with a key age range of 14-18 years old. As part of the program, officers show participants police procedures and policies, showcase what the police academy experience is like, and educate them on the role of police in society. This is a one-time, 24-hour program.
Public Safety Cadets is an ongoing youth engagement program geared for teenagers and young adults between the ages of 14 and 20. Participants learn key procedural skills helpful in the law enforcement profession.
The School Resource Officer Program began in the mid-1990s. It is possible through a partnership with the Police Department and the Johnson City School System. The officer is embedded into daily life in the school and, in addition to carrying out law enforcement duties, also acts as an educator and counselor for students.
Shop with a Cop is an annual charity program hosted by the Police Department. The program selects elementary-school aged children and provides Christmas gifts, food, and winter clothing to the children and their families.

The Johnson City Fire Department (JCFD) is a career department dedicated to protecting over 74,000 residents, 14,000 East Tennessee State University (ETSU) students, and all visitors and commuters within the Johnson City area. The team of 138 fulltime staff includes 123 all-hazards providers specializing in fire suppression, HazMat, and medical first response. These dedicated professionals work 24-hour shifts across nine fire stations, operating a robust fleet that includes nine pumpers, three ladder trucks, and two district chief command vehicles.
The JCFD stands out as one of only two fire departments in Tennessee to hold both international accreditation and an Insurance Service Office (ISO) Fire Rating of One, reflecting our commitment to excellence.
In 2024, the JCFD responded to a department record-setting 10,426 emergency calls across a service area of over 40 square miles. The majority of these incidents, roughly 6,000 calls, were for Rescue and EMS services, while another 620 calls addressed Fire or HazMat emergencies. The remaining responses primarily involved false alarms and public service requests. This significant increase in call volume highlights the challenges posed by Johnson City’s population growth. To meet these evolving demands, the JCFD is proactively addressing future needs. The JCFD is currently constructing a state-of-the-art training facility to ensure our members are fully prepared for tomorrow’s challenges. Additionally, the department recognizes the need for a tenth fire station in the city’s northwest corridor to maintain the highest level of service for all residents.
The Fire Department’s emergency medical services are staffed by a highly trained combination of paramedics, EMTs, and first responders. Beyond medical calls, the JCFD also deploys two specialized teams—HazMat and Technical Rescue—to manage diverse and complex incidents.
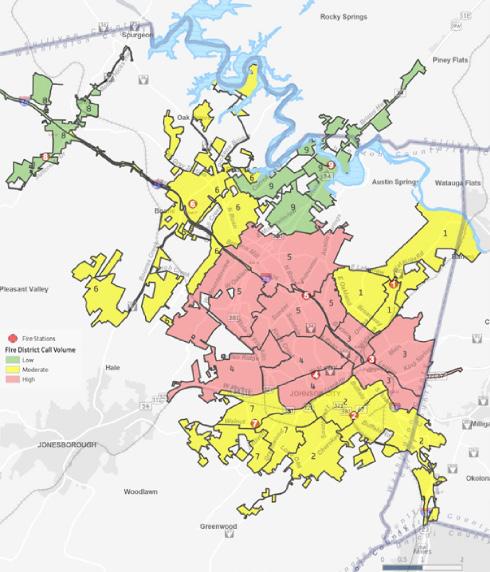
Objective S1. Provide high-quality public infrastructure that are fiscally sound.
Policy S1.1: Regularly evaluate public infrastructure efficiency and effectiveness.
• S1.1.1: Conduct performance audits of key public services every five years.
• S1.1.2: Continue to provide a public service dashboard to track performance metrics and share outcomes with the community.
• S1.1.3: Maintain the Stormwater Maintenance Policy to ensure incorporation of state regulations and, to the extent possible, ease the burden of Homeowner Associations (HOA) maintenance.
Policy S1.2: Ensure the fiscal sustainability of public infrastructure investments.
• S1.2.1: Continue to utilize long-term financial plans for utility services to ensure expansion, maintenance, and operations effort match the rate of growth subject to approved funding.
• S1.2.2: Identify possible grant opportunities to support major utility upgrades or expansions.
• S1.2.3: Review and revise rate structure for water and sewer, solid waste, and storm water services to adequately fund improvements, including asset rehabilitation and regulatory compliance.
• S1.2.4: Develop a fiscal impact model to assist development review by determining the costs and benefits for public services and capital investments for proposed projects.
Public Facilities and Services Element
The Public Facilities and Services Plan was developed as part of the 2020 Comprehensive Plan and was approved by the Regional Planning Commission. It identifies existing and proposed locations and types of water and sewer utilities, cultural facilities, libraries, police stations, and other related facilities needed to maintain and grow well as a City.
Key Takeaways
• Continue maintaining and providing new facilities and services to meet the community’s needs and interests
• Plan and provide public facilities and services cost effectively, consistently with current development, and in anticipation of potential community issues
• Encourage regional cooperation and full use of the existing and available systems
• Safeguard nature
• Provide high-quality water supply and wastewater treatment
• Maintain and replace water and sewer lines, as needed
• Ensure adequate distribution and provide safety and accessibility to all facilities and services
• Provide fully accessible public facilities to all residents and visitors
Policy S1.3: Promote innovation and sustainability in public infrastructure.
• S1.3.1: Research and pilot energy efficient and cost-saving technologies in public utilities.
• S1.3.2: Continue to rehabilitate the wastewater collection system by repairing, cleaning, and replacing mains as well as monitoring problem areas.
Policy S2.1: Strengthen the emergency response and preparedness capabilities.
• S2.1.1: Continue to coordinate with surrounding counties to update the Emergency Management Plan every five years to address changing risks, vulnerabilities, and areas of need.
• S2.1.2: Promote and maintain the Citywide early warning system for weather-related and other emergencies.
• S2.1.3: Comply with and support all regional and national laws, regulations, and programs designed to protect the public from natural and manmade hazards and disasters.
Fire Station Deployment Study (2022 Update of 2018 Study)
The Fire Station Deployment Study is a 2022 update of the 2018 study and includes an overview of the Johnson City Fire Rescue service area, the current conditions of the Department’s stations, and a projection of the additional fire stations that will be needed to maintain and expand service in the future.
Key Takeaways
• Currently, several areas fall outside the recommended 1.5-mile primary coverage area of an engine company
• The study documents the need for three additional fire stations located in the northwestern portion of the service area
• One of the proposed fire stations is in an area with a railroad track boundary and a single-lane tunnel
• Additional recommendations include adopting a response time standard and adopting the most current fire code
Policy S2.2: Enhance public safety services to meet growing demands.
• S2.2.1: Assess staffing and resource needs for police, fire, and EMS Departments based on population growth projections.
• S2.2.2: Periodically evaluate the need for new police, fire, and EMS facilities to expand the first responder network and improve response time as established in existing service studies.
• S2.2.3: Continue dedication to community outreach programs, such as community policing and fire prevention initiatives and reassess programs on a periodic basis.
Policy S2.3: Promote partnerships to improve security and preparedness.
• S2.3.1: Continue to encourage cooperative water and sewer arrangements with neighboring governmental units to promote economic development and protect public health.
• S2.3.2: Establish mutual aid agreements with neighboring jurisdictions for disaster response and recovery efforts.
• S2.3.3: Partner with healthcare and emergency response services to ensure their facilities and service expansion efforts align with growth patterns.
Objective S3. Match the pace and distribution of growth to the availability of resources.
Policy S3.1: Align public service expansions with growth areas.
• S3.1.1: Conduct a periodic review of growth patterns and utility capacities to inform service expansion priorities.
• S3.1.2: Develop phased service expansion plans that are tied to the development approval process.
• S3.1.3: Ensure a formal annexation request is made for all applications seeking water and sewer services within the Urban Service Area where line extension is required.
• S3.1.4: Explore the use of development capacity fees to fund new infrastructure and services required by growth.
Policy S3.2: Ensure a balanced distribution of public services.
• S3.2.1: Continue to identify and monitor areas and prioritize investments to address service gaps.
• S3.2.2: Continue to review development proposals for their appropriateness based on water and sewer service availability.
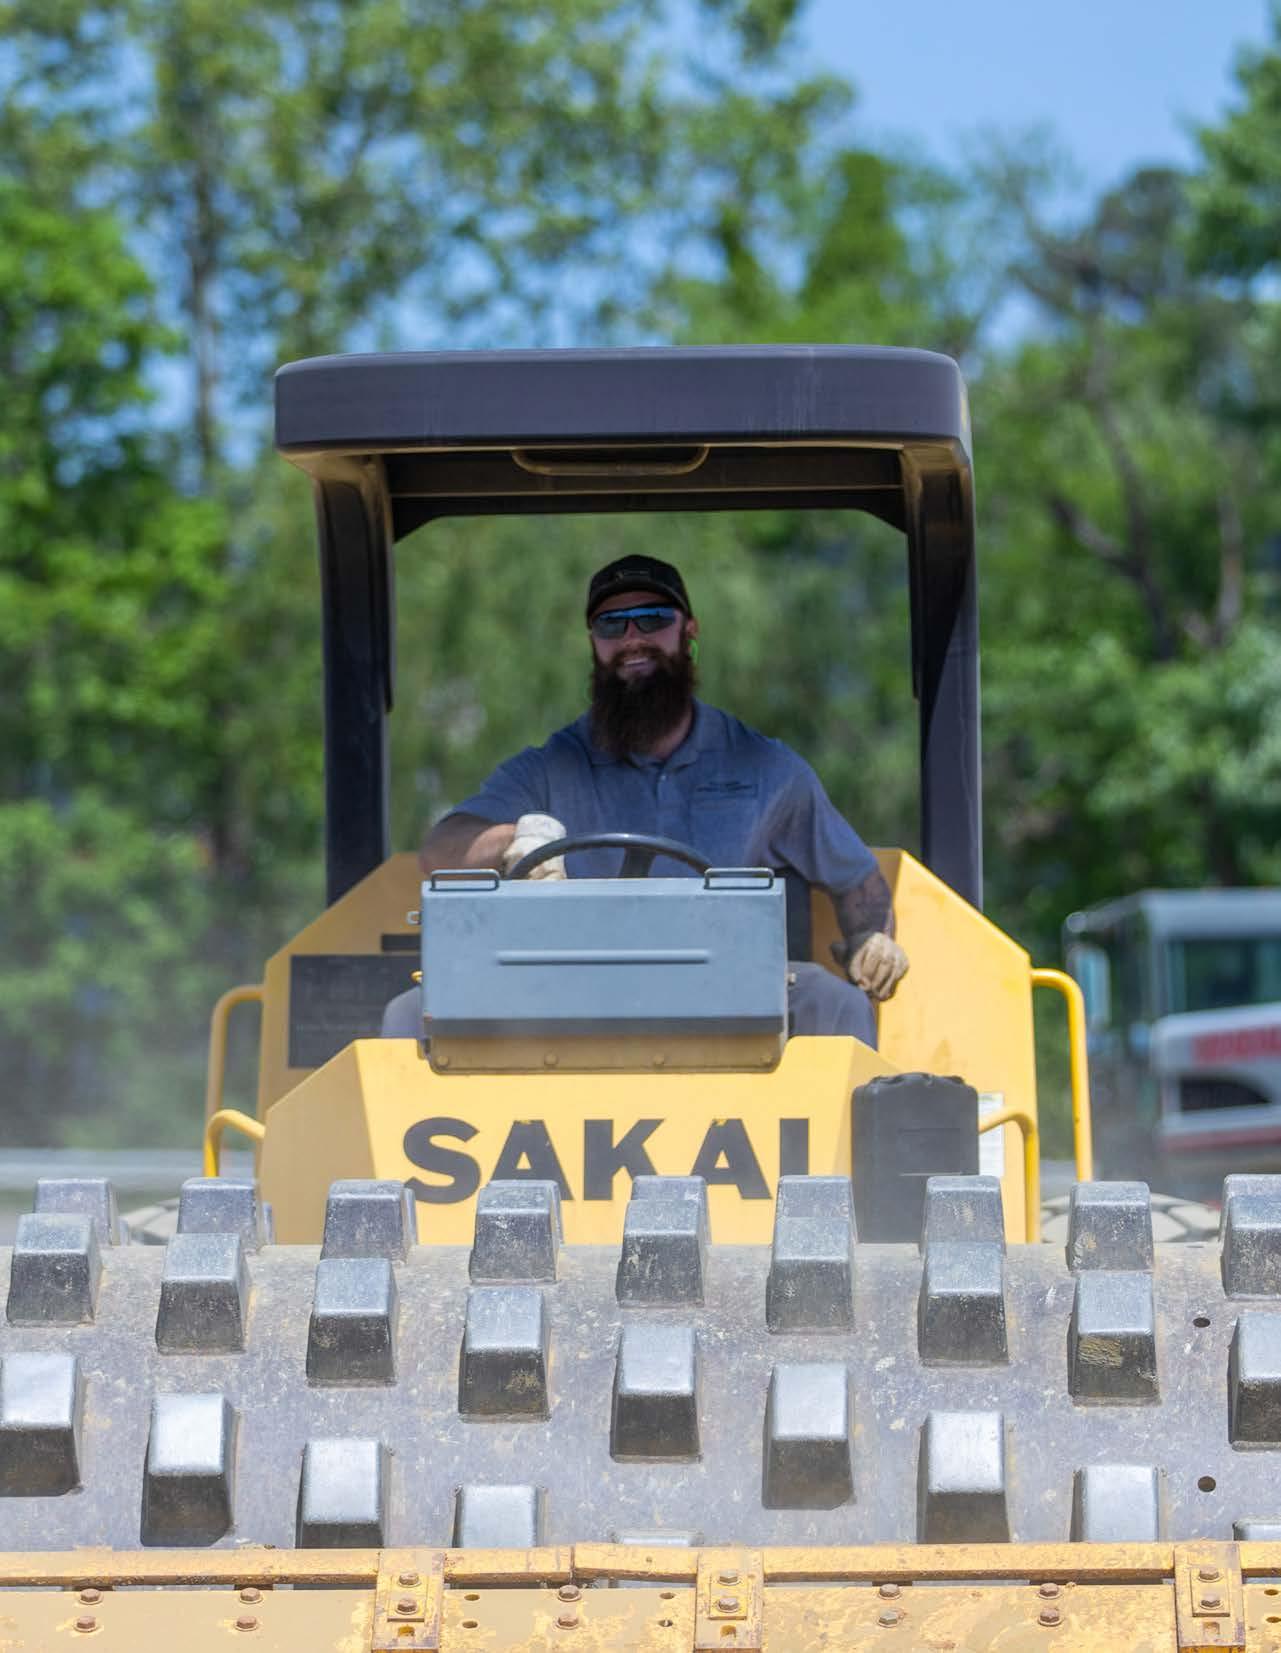

A strong education system is essential to Johnson City’s future, providing lifelong learning opportunities that support economic growth, workforce development, and community well-being. As the City continues to grow, investing in highquality learning opportunities from early childhood through higher education and workforce training is essential. This chapter highlights current education initiatives, school infrastructure planning, workforce alignment strategies, and opportunities to strengthen lifelong learning for all residents.
From early childhood programs to K-12 schools, higher education, and career training, Johnson City must continue investing in its education system to maintain its position as a regional leader. Through the Johnson City Growth Management Plan process, key themes have emerged, including the importance of aligning school capacity with residential growth, strengthening partnerships between educational institutions and employers, and expanding access to lifelong learning. This section provides an overview of strengths and opportunities for improvement across all levels of education in Johnson City.
Education plays a central role in Johnson City’s growth and development, with a range of public and private institutions serving students from early childhood through higher education. The Study Area is home to elementary, middle, and high schools, as well as colleges, universities, and specialized education facilities that contribute to workforce development and lifelong learning opportunities. The map of educational facilities highlights the distribution of schools across Johnson City, including:
• Public K-12 schools operated by Johnson City Schools (JCS) and Washington County Schools
• Private institutions offering alternative education options
• Higher education institutions
• Specialized education facilities, including vocational training centers and alternative learning program
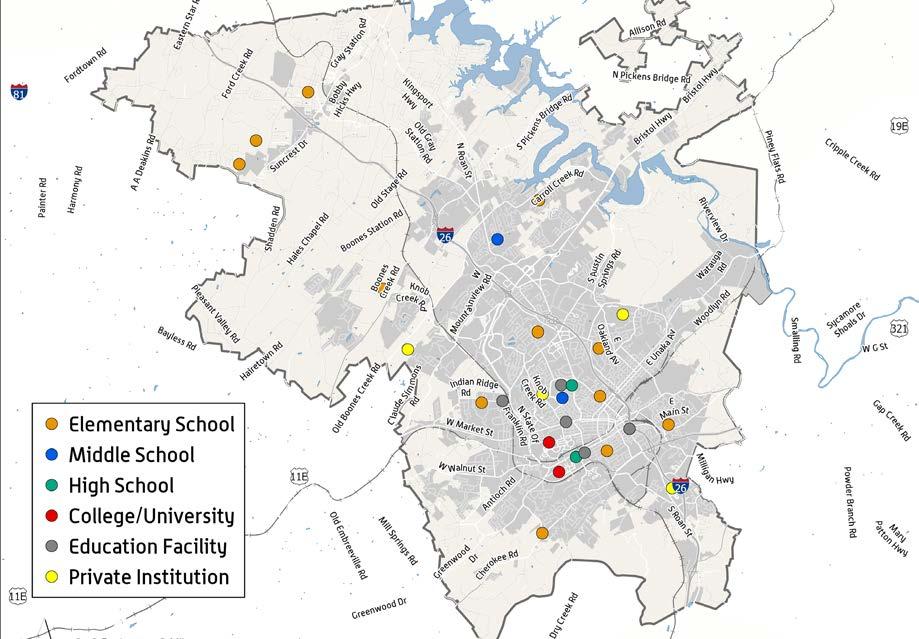
Source: Johnson City
Johnson City Schools (JCS) is a public K-12 school district serving nearly 8,000 students across eight elementary schools, two middle schools, one high school, and one alternative learning center. The district is nationally recognized for academic performance, consistently ranking among the top school systems in Tennessee. The school district is governed by a sevenmember elected Board of Education, with members serving four-year overlapping terms. The Director of Schools manages policy implementation, budgeting, curriculum development, and personnel oversight. JCS employs approximately 1,200 fulltime and part-time staff, including;
• 600 certified teaching staff
• 15 district-wide administrators, 12 principals, and 16 assistant principals
• Support Staff, such as custodians, food service workers, school nurses, instructional assistants, and maintenance personnel
The relationship between JCS and Washington County Schools is defined by distinct boundaries and a history of collaboration. Generally, students residing within the City limits of Johnson City attend JCS, while those outside the City limits are served by Washington County Schools. However, JCS offers tuition enrollment for students living outside the City limits. Tuition based enrollment is offered for specific schools, including Science Hill High School, Indian Trail Middle School, Liberty Bell Middle School, and Cherokee Elementary School.
When placed in a regional context, JCS represents a substantial portion of the school-age population in the Johnson City MSA. However, certain grade levels show slight variations in enrollment distribution between the study area and the broader metropolitan region. This graph compares the share of students enrolled by grade level between the Study Area and the MSA, providing insight into local enrollment patterns relative to regional trends. Lower shares of elementary, middle school, and high school enrollment in the Study Area compared to the MSA suggest that surrounding areas may be absorbing a higher share of K-12 students. These variations provide important context for future school planning efforts. If surrounding areas continue to absorb a greater share of younger students, capacity pressures at the elementary and middle school levels may remain stable in Johnson City Schools, while high school facilities could see increasing demand as students progress through grade levels.
POPULATION AGE 3 TO 19 YEAR BY SCHOOL ENROLLMENT
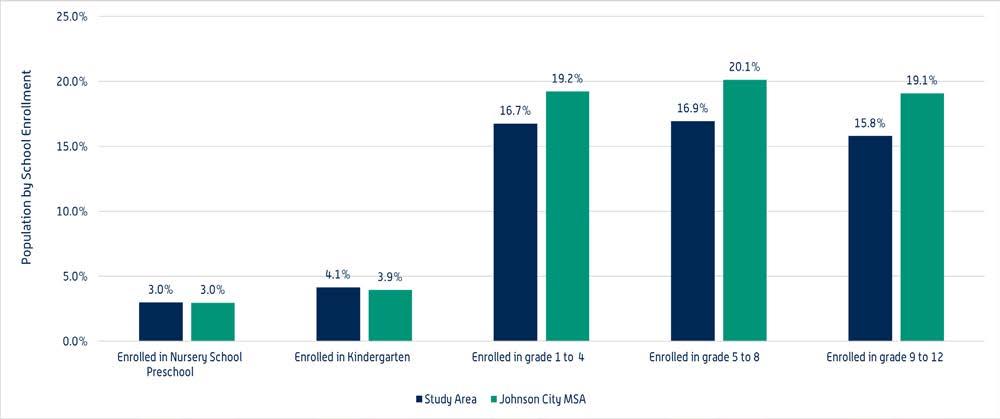
As Johnson City continues to grow, understanding enrollment trends is a key factor in determining the future needs of educational facilities. The map provided highlights public school enrollment trends by census tract within the Study Area. While many census tracts across the Study Area are experiencing increases in public school enrollment, some census tracts are seeing more significant growth than others, particularly in the central and eastern portions of the Study Area where enrollment has risen by over 30% in some areas. These high-growth areas may require future investment in school infrastructure, additional classroom capacity, or adjustments to school boundaries to accommodate demand. Conversely, the map also indicates that some census tracts have experienced declining enrollment, particularly in the western and southern portions of the Study Area. Understanding the factors contributing to these trends — whether due to demographic shifts, housing changes, or school choice patterns — can help inform strategic planning for school facilities and resource.
By aligning school planning with demographic trends, Johnson City can ensure that its education system continues to meet the needs of a growing population, maintaining accessibility and high-quality learning environments for students across the district.
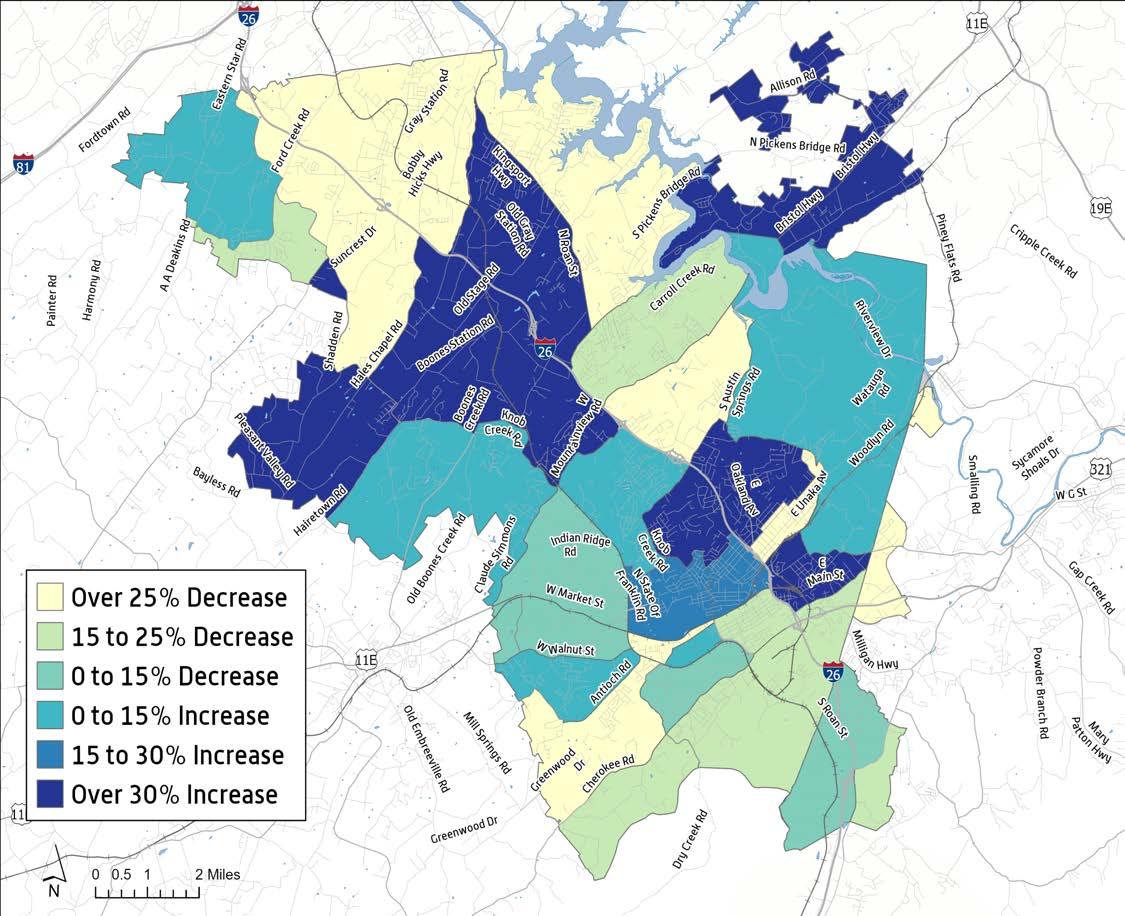
Source: American Community Survey; Kimley-Horn
Johnson City Schools operates 12 educational facilities that serve approximately 75,000 residents, providing a comprehensive educational experience designed to support both student learning and community engagement.
• Elementary Schools (8) – Serve grades PreK-5 at Cherokee, Fairmont, Lake Ridge, Mountain View, North Side, South Side, Towne Acres, and Woodland. All elementary schools offer a fee-based before-and-after school care program
• Middle Schools (2) – Indian Trail and Liberty Bell serve grades 6-8, offering expanded coursework and extracurricular activities.
• High School (1) – Science Hill High School serves grades 9-12 and provides a wide range of career-technical programs, 27 Advanced Placement (AP) courses, and virtual and alternative pathways. Science Hill is ranked the 10th best high school in Tennessee according to U.S. News and World Report.
• Alternative Learning Center (1) – Offers specialized support for students needing alternative pathways to graduation
To meet evolving educational and safety needs, Johnson City Schools has invested in modernization efforts across its campuses, with technology upgrades and enhanced school safety measures remaining a district priority. In response to facility capacity needs, Johnson City approved a 15-cent property tax increase to fund the new Towne Acres Elementary School, with construction expected to begin in Spring 2025. The district is also advancing the Science Hill High School Master Plan, which outlines long-term improvements for the City’s only public high school.
Towne Acres Elementary School, originally designed to serve 450 students, is being replaced with a new two-story facility capable of accommodating 750 students. This 67% increase in capacity reflects the district’s long-term planning efforts to address enrollment growth and classroom overcrowding. The new facility will feature expanded classroom space, modern learning environments, and enhanced technology integration, ensuring that students have access to high-quality instructional spaces that meet 21st-century educational standards. Similarly, Science Hill High School, which serves over 2,400 students, is advancing its long-term facility master plan, focusing on renovating science labs, integrating new technology, and upgrading academic spaces to support student success.
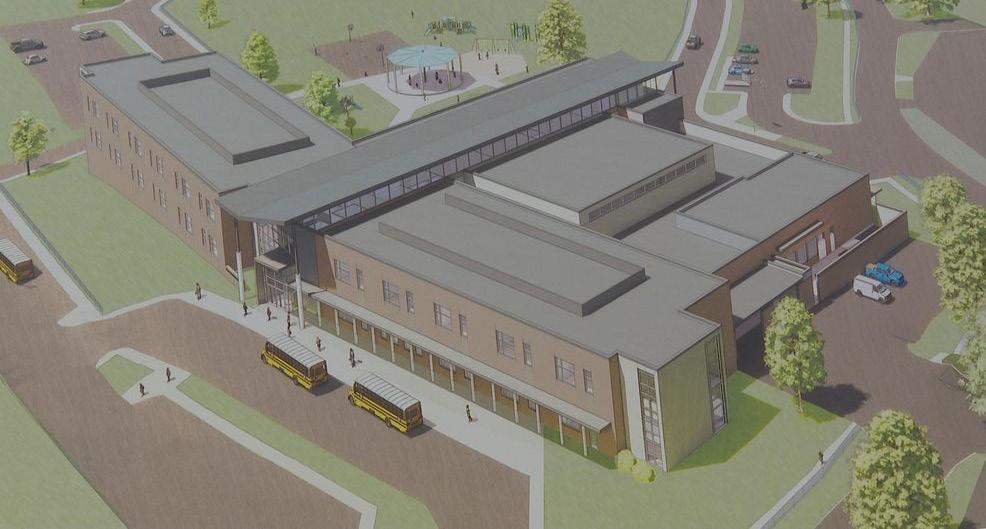
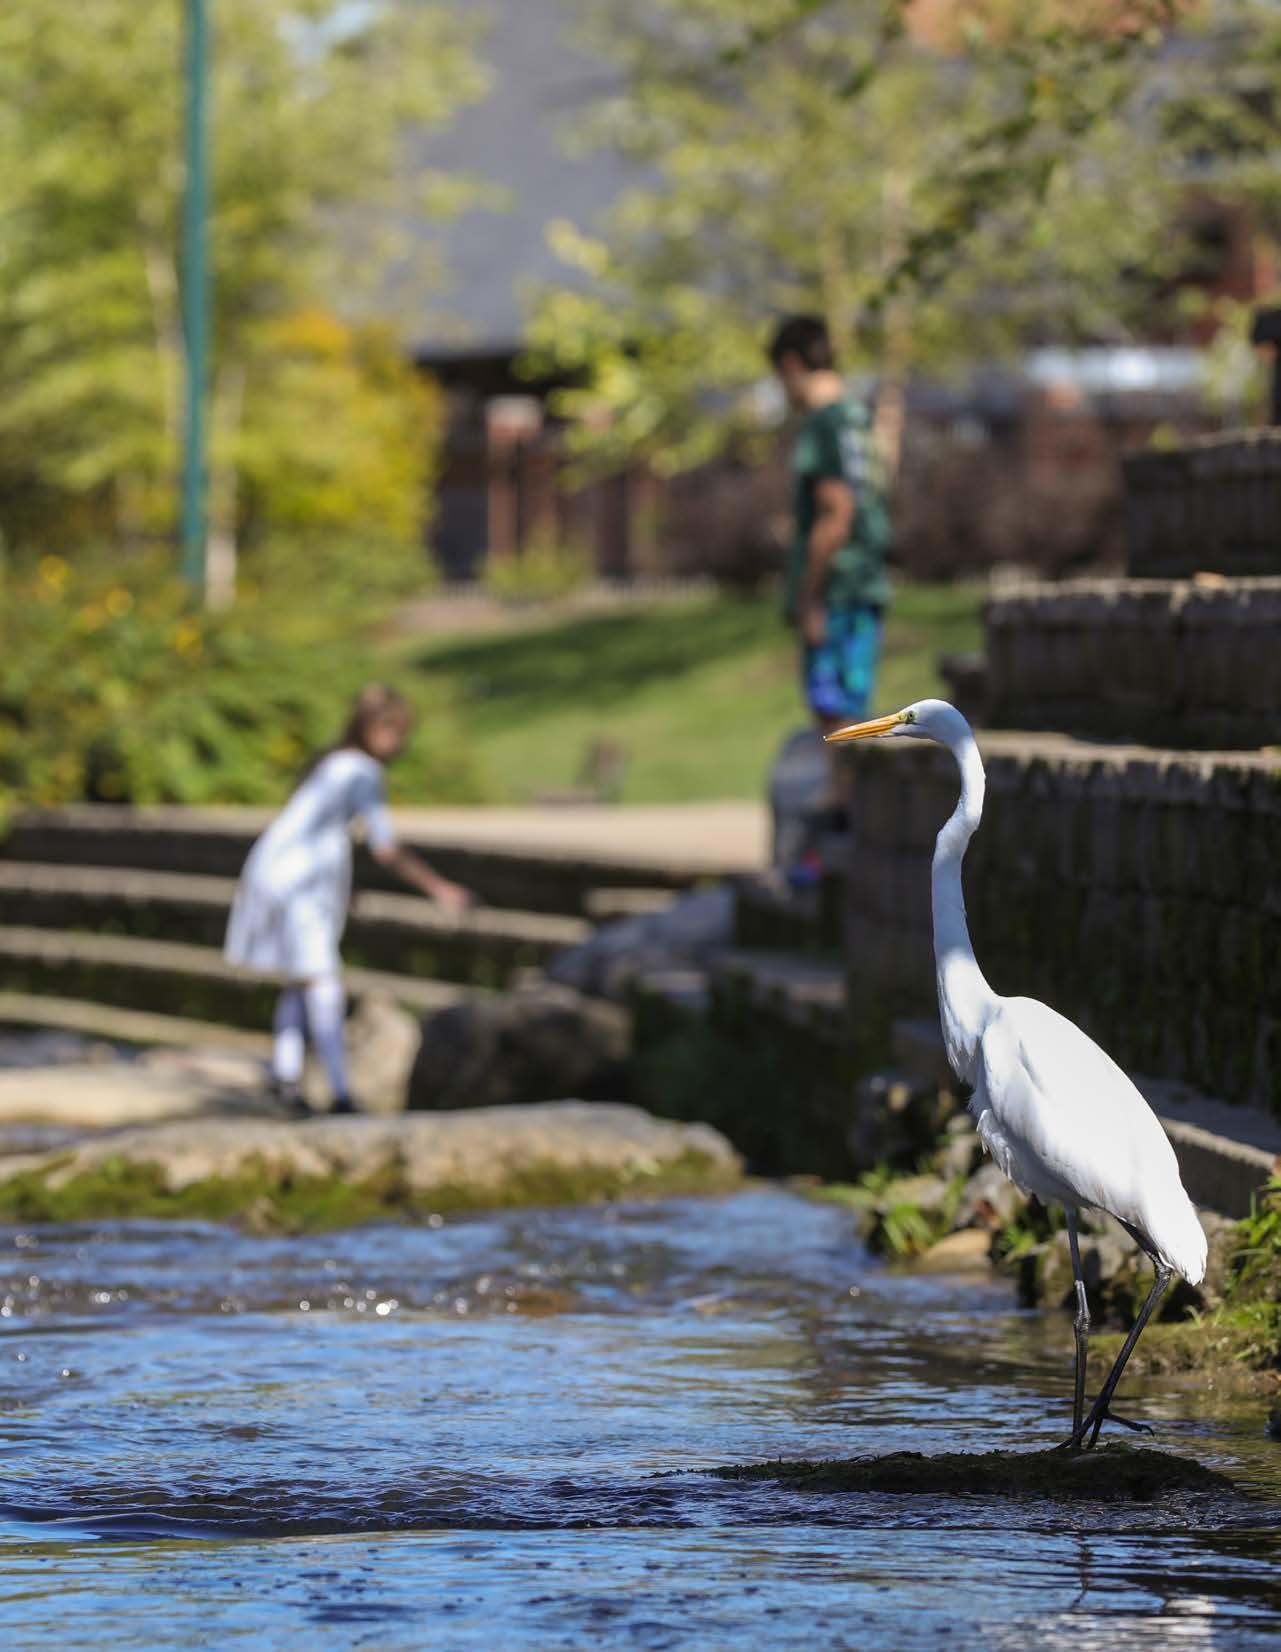
Beyond K-12 education, Johnson City benefits from a strong higher education presence, with East Tennessee State University (ETSU), Northeast State Community College, and Tennessee College of Applied Technology (TCAT). These institutions play a key role in preparing students for careers in healthcare, technology, manufacturing, and other emerging industries.
Established in 1911, ETSU is the largest higher education institution in the region, serving over 14,000 students across undergraduate, graduate, and doctoral programs. The public university is a major economic driver, supporting research, healthcare, and business innovation while shaping housing and infrastructure needs in Johnson City.
• Academic Programs: More than 160 academic programs at the bachelors, masters, and doctoral level, distributed across eleven colleges and schools.
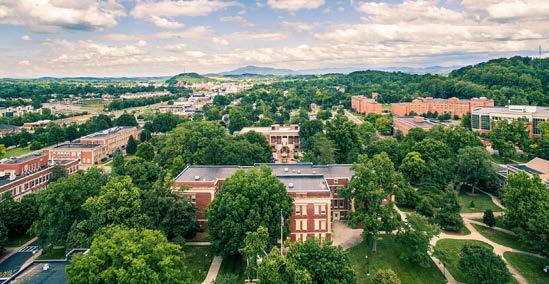
• Campus Size: The main campus spans over 350 acres, with an additional 31 acres at the Veterans Affairs campus housing the James H. Quillen College of Medicine.
• Notable Facilities: ETSU houses the James H. Quillen College of Medicine, renowned for its focus on rural medicine and primary care education, and the Bill Gatton College of Pharmacy.
• National Ranking: Business and Accounting programs rank among the top 5% worldwide; Clinical Psychology doctoral program ranks #5 nationally; Online Child Psychology program ranks #4 nationally.
Established in 1966, Northeast State Community College is a public, two-year institution serving over 5,400 students across its main campus in Blountville and multiple regional teaching sites. NeSCC plays a key role in expanding access to higher education, offering affordable degree programs, workforce training, and seamless transfer pathways to fouryear universities. The college’s multi-campus presence enhances educational opportunities while supporting regional economic and workforce development.
• Academic Programs: Offers over 130 associate degree programs and more than 30 applied science degree and technical certificate programs in various fields, including healthcare, technology, and engineering.
• Campuses: In addition to its main campus in Blountville, NeSCC operates teaching sites in Elizabethton, Gray, and Kingsport.
• Notable Facilities: The Regional Center for Advanced Manufacturing (RCAM) in Kingsport is a state-of-the-art facility providing hands-on training in advanced manufacturing technologies.
• Ranking: The college ranks among the top 20% of community colleges in the State of Tennessee.
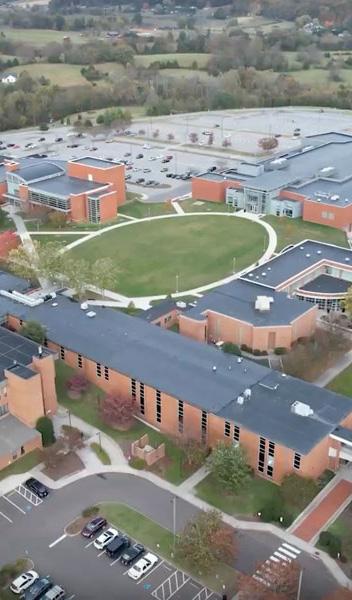
The Tennessee College of Applied Technology (TCAT) – Elizabethton Boones Creek Extension Campus opened in 2023 to expand access to technical education in Johnson City. As an extension of TCAT Elizabethton, the campus was established to meet regional workforce demands by providing specialized training in high-demand fields. In its inaugural year, the campus enrolled 125 students and recent expansions would hope to increase enrollment size to 300 students.
• Academic Programs: The Boones Creek Extension Campus offers four specialized programs: building construction technology, cosmetology, industrial electricity, and practical nursing.
• Facility Size: The 26,000-square-foot campus includes classrooms and labs designed to accommodate both adult learners and high school dual enrollment students from four area high schools: Daniel Boone, David Crockett, Science Hill, and University.
• Enrollment: The student body consists primarily of adult learners, most of whom are enrolled in the Practical Nursing program, along with high school students participating in dual enrollment through block scheduling with local high schools.
• Notable Expansions: A new facility opened in Fall 2024, adding Diesel Technology and a dedicated training center for local businesses and industries.
East Tennessee State University (ETSU) continues to expand its academic offerings, research capabilities, and physical footprint to accommodate growing student enrollment and evolving workforce needs. As the largest higher education institution in the region, ETSU’s strategic investments in campus development, housing, and research infrastructure are designed to strengthen its role as an economic and educational anchor for Johnson City and beyond.
ETSU is projecting a 31.5% increase in main campus enrollment by 2031, with on-ground full-time equivalent (FTE) students expected to rise from 6,816 in 2021 to 8,965. Total on-ground enrollment across all ETSU sites is projected to grow by 27.1%, reaching 10,545 FTE students by 2031. This growth is driven by initiatives focused on student retention, expanded dual enrollment opportunities, and targeted recruitment strategies for both in-state and out-of-state students. To support this expansion, ETSU continues to prioritize the enhancement of academic facilities and interdisciplinary research spaces. The university is actively investing in new academic buildings, including the Integrated Health Services Building, a 60,000-square-foot facility that will house clinical training spaces and interdisciplinary teaching programs in social work, family medicine, and sports medicine.
Campus/Site
With increasing enrollment, ETSU is also facing a growing demand for oncampus housing. The university has identified a 275-bed housing deficit and is implementing both short-term and long-term strategies to accommodate student needs. In the past two years alone, over 100 students have been placed in off-campus overflow housing, highlighting the need for additional residential capacity. To address this, ETSU’s Housing Master Plan outlines significant investments in residential facilities, including:
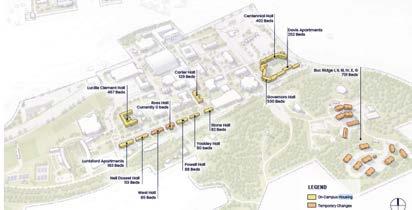
• New student housing developments to create a more connected residential community.
• Renovations to existing dormitories, including Lucille Clement Hall and Yoakley Hall, to improve student living conditions and expand capacity.
• Expansion of the Greek Village, reinforcing ETSU’s commitment to student engagement and campus life
ETSU is significantly expanding its research infrastructure to position itself as a leader in health sciences, engineering, and technology innovation. The university has set a goal to double its research activity over the next decade and aims to secure $60 million in research funding. Several major campus infrastructure projects are underway, including:
• The University Commons Expansion, enhancing pedestrian connectivity and public gathering spaces.
• The New Academic Building, a $62.5 million project set for completion in 2025, designed to house interdisciplinary programs.
• Lamb Hall and Brown Hall Renovations, improving laboratory and instructional spaces for STEM programs
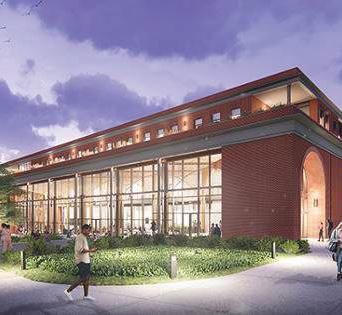
As student populations grow and workforce needs evolve, NeSCC and TCAT Boones Creek are expanding their physical footprints, modernizing infrastructure, and aligning programs with regional economic development goals. These efforts are not only enhancing educational opportunities but also driving workforce readiness in key industries such as advanced manufacturing, healthcare, and skilled trades.
NeSCC has experienced fluctuations in enrollment over recent years. In the 2022-2023 academic year, NeSCC reported a total enrollment of 5,100 students, with a full-time enrollment of 2,607 students and part-time enrollment of 2,493 students. This reflects a slight decrease from the previous academic year, where the total enrollment was 5,397 students. Despite this modest decline, NeSCC has implemented strategic initiatives to bolster enrollment, including increasing overall headcount and full-time equivalent enrollment, expanding dual enrollment programs, and developing additional courses and training offerings to respond to emerging markets and trends. The TCAT system has demonstrated notable enrollment growth. During the 2023-2024 academic year, total enrollment across all TCATs rose to 44,723 students, marking a 19% increase over the previous year. Specifically, the TCAT Elizabethton campus, which oversees the Boones Creek Extension, reported a total enrollment of 1,093 students. This upward trend aligns with the statewide increase in FTE enrollment at TCAT campuses, which has grown by 12% since the 2014 Master Plan.
To keep pace with increasing demand, NeSCC has made significant investments in technical and workforce training infrastructure. A major component of this expansion is the Technical Education Complex, a state-of-the-art facility designed
to support programs in business, information technology, and advanced manufacturing. Built in partnership with regional industries, the complex offers specialized lab spaces, high-tech equipment, and industry-aligned curriculum, ensuring that students graduate with the skills needed for high-demand careers. At TCAT Boones Creek, the completion of a 26,000-square-foot facility has allowed for the expansion of Diesel Technology, Industrial Electricity, Practical Nursing, and Cosmetology programs. The campus also houses a STEM-focused workforce training center, designed to provide customized education for area businesses while strengthening technical career pathways for high school students and adult learners alike.
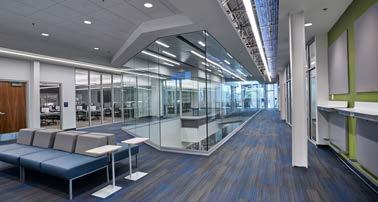
As Johnson City continues to evolve, education extends beyond traditional schooling, ensuring that residents of all ages have access to skills development, career training, and digital learning opportunities. ETSU, NeSCC, and JCS play a key role in fostering lifelong learning, while community organizations and state-funded initiatives support adult education, vocational training, and technology-driven skill-building programs.
Lifelong learning plays an essential role in economic mobility and workforce development, particularly for adults seeking career changes, professional certifications, or foundational education. NeSCC provides free pathways to high school equivalency diplomas through its Adult Education Program, ensuring that residents without a traditional diploma can still access higher education, career advancement, or military service. Additionally, NeSCC offers English as a Second Language (ESL) classes at its Blountville and Johnson City locations, addressing the needs of non-native English speakers and promoting workforce inclusion. At the university level, ETSU’s Office of Professional Development offers a range of non-credit courses, workforce training, and continuing education programs, allowing professionals and older learners to develop specialized skills. These programs support individuals looking to expand their career prospects, transition into new industries, or enhance their personal knowledge through structured, high-quality instruction. Beyond formal institutions, Johnson City Parks and Recreation provides free adult learning classes, including Excel for Beginners and Computer Basics, equipping residents with digital literacy skills crucial in modern workplaces. These initiatives ensure that education remains accessible, community-driven, and adaptable to evolving workforce demands.
As technology reshapes education and the job market, Johnson City is investing in digital learning tools, STEM education, and workforce-focused technology training. Johnson City Schools has placed an emphasis on digital learning initiatives, including Digital Learning Day, which promotes technology-integrated teaching strategies and enhances global connected learning. The district’s Instructional Technology Department works to ensure students have access to the tools and skills necessary for digital literacy, reinforcing state standards while preparing them for an increasingly technology-driven workforce.
At the higher education level, ETSU’s STEM programs continue to expand digital education opportunities. A $665,887 grant for the Integrating STEM and Literacy with Computation in Elementary Education (iSLICEE) program is helping ETSU train future educators in computational thinking, digital learning, and STEM-based instructional techniques. Community organizations are also contributing to STEM education and coding literacy. iCode Tri-Cities offers STEM programs that encourage a lifelong learning mindset, ensuring students can adapt to emerging technologies and industry changes. Additionally, Tennessee Digital Opportunity Grants, backed by a $17 million investment from the American Rescue Plan, are funding statewide digital skills training, education initiatives, and workforce development programs to expand both basic and advanced digital literacy across the state.

Policy E1.1: Align new school facilities, upgrades, and improvements with Johnson City Schools strategic Plan.
• E1.1.1: Periodically review, comparing growth patterns and updating priorities where needed.
• E1.1.2: Promote coordination between City planning and school systems planning to ensure alignment with broader growth strategies.
• E1.1.3: Support collaboration between the school system and the Planning Department to evaluate the impact of annexations on school enrollment and to comprehensively understand the impact on service and street maintenance.
Policy E1.2: Provide adequate school capacity to meet present and future enrollment needs in coordination with the City, Johnson City Schools, and county school systems.
• E1.2.1: Conduct enrollment forecasts every five years to adapt to growth trends and demographic changes.
• E1.2.2: Periodically evaluate and adjust school boundaries to balance enrollment across districts and optimize facility uses.
• E1.2.3: Proactively collaborate with ETSU and the School Board in planning expansions, renovations, or new construction.
• E1.2.4: Develop guidelines to ensure new transportation infrastructure aligns with school access and safety needs.
• E1.2.5: Incorporate school capacity considerations into annexation policies and zoning decisions for new developments.
Policy E1.3: Maintain facilities that support high-quality education and specialized programs.
• E1.3.1: Audit current program space availability and address gaps through renovations or additions.
• E1.3.2: Promote partnerships with ETSU, Northeast State, and Tennessee College of Applied Technology (TCAT-Boone Creek Extension) to access innovative teaching methods, advanced resources, and dual-enrollment opportunities.
Policy E2.1: Ensure new development and improvements alignment with the ETSU Strategic Plan.
• E2.1.1: Periodically review the ETSU Strategic Plan to ensure alignment with the City’s growth objectives.
Policy E2.2: Strengthen collaboration between ETSU, the City, and local schools to create an integrated educational ecosystem.
• E2.2.1: Expand dual-enrollment programs and teacher training initiatives with ETSU.
• E2.2.2: Develop joint-use facilities to maximize shared resources (e.g., libraries, labs, rec centers).
• E2.2.3: Coordinate transit initiatives with ETSU to enhance access for students and faculty and to increase placemaking between the campus and Downtown.
• E2.2.4: Encourage ETSU to engage with K-12 students through mentorship programs, internships, and research opportunities.
Policy E2.3: Promote lifelong learning opportunities and community engagement through ETSU programs.
• E2.3.1: Conduct feasibility studies for transit routes linking ETSU to schools and neighborhoods.
• E2.3.2: Coordinate public infrastructure projects, such as transit routes and pedestrian networks to enhance connectivity to ETSU.
Policy E2.4: Establish a formal ETSU-City Partnership Council to enhance collaboration between ETSU and the City.
• E2.4.1: Task the Planning Commission with aligning ETSU’s growth plans with City infrastructure and community engagement goals.
Policy E3.1: Strategically locate new schools to support infill development and discourage urban sprawl.
• E3.1.1: Maintain an inventory of new housing developments, their location, and the number of units that will be built to better communicate the directionality of growth to the Johnson City School System.
• E3.1.2: Identify underserved areas and future schools or learning sites.
• E3.1.3: Acquire land for future school development in alignment with the City’s comprehensive growth strategies.
• E3.1.4: Ensure that transportation plans for new developments include provisions for school bus access, pedestrian safety, and bike routes.
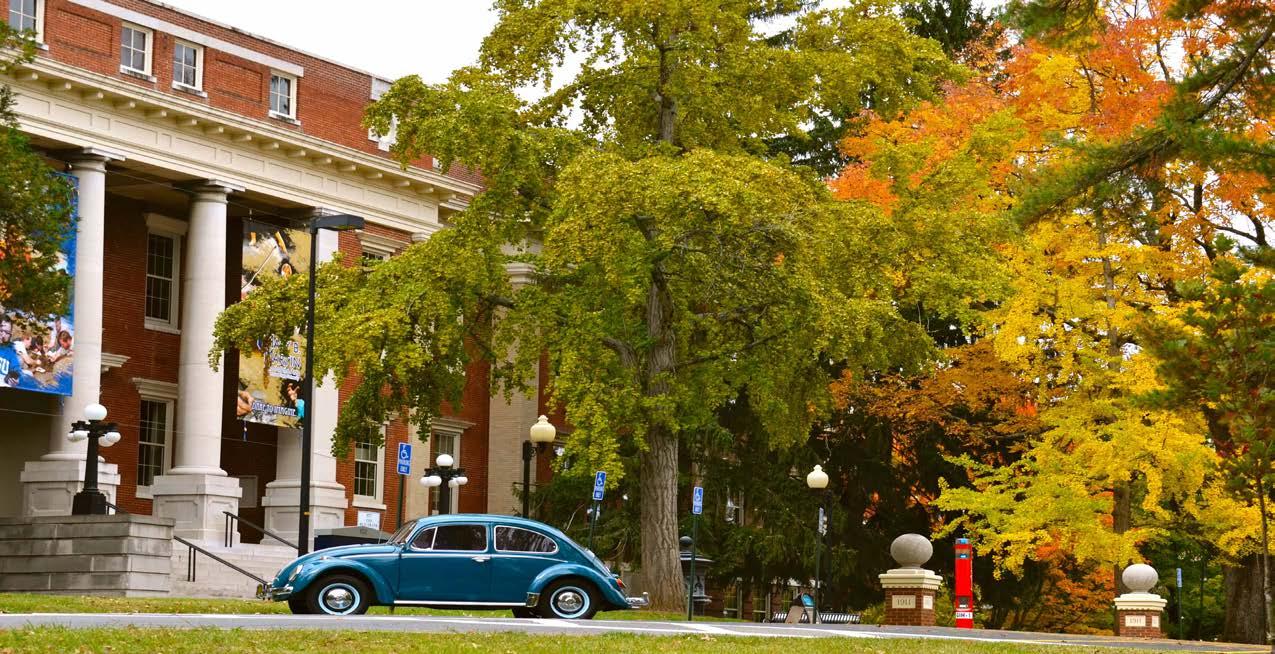
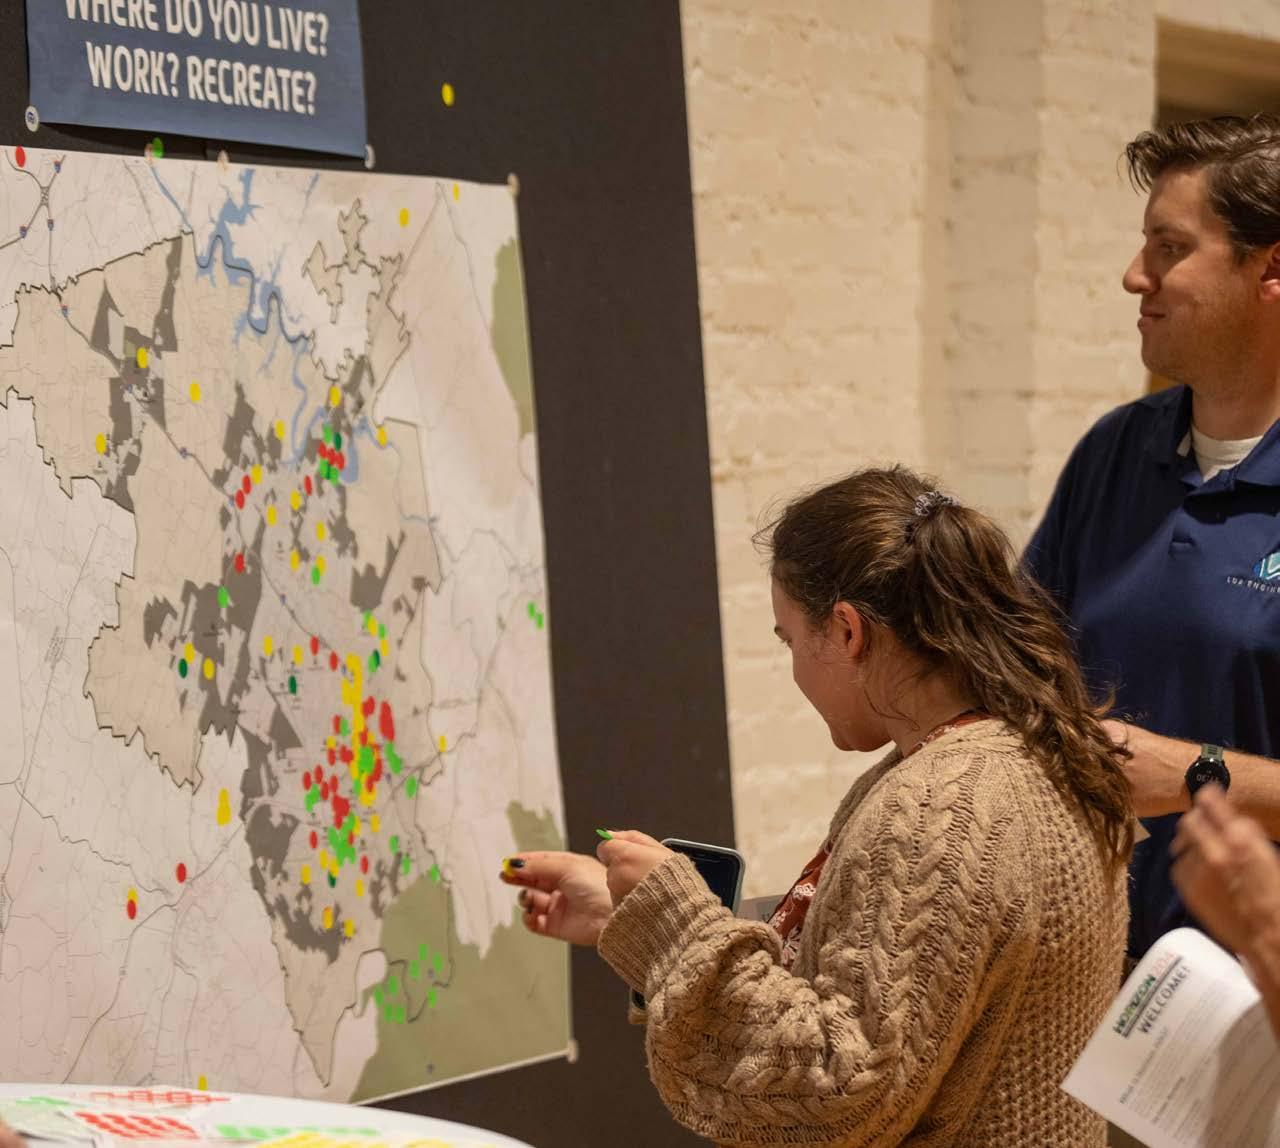
The Horizon 2045 Plan was crafted as a collaborative, community-driven document that establishes a clear vision and framework for how the City should grow, evolve, and thrive in the coming years. More than just a planning document, it is a decision-making tool designed to help guide public investment, policy development, and land use decisions across departments, committees, and community organizations. City leaders, staff, and partners should return to this Plan routinely, as both a strategic compass and a resource for action. As priorities shift and new opportunities arise, the Plan should be referenced, adjusted when necessary, and reaffirmed as a shared roadmap for Johnson City’s future. A wide range of users, including City staff, elected officials, boards and commissions, developers, residents, and regional partners, will reference this Plan to inform decisions and align efforts with Johnson City’s long-term vision. City leaders, staff, and partners should return to this Plan routinely, as both a strategic compass and a resource for action. As priorities shift and new opportunities arise, the Plan should be referenced, adjusted when necessary, and reaffirmed as a shared roadmap for Johnson City’s future.
The plans, programs, policies, and projects identified in Horizon 2045 should guide how the City prioritizes what is important to the community.
Adopting the Horizon 2045 Plan is key to achieving the community vision established during the during the public planning process. Detailed plans help refine the vision and recommendations for specific areas or functions of the City.
The success of the Horizon 2045 Plan will depend in part on the commitment of elected officials, staff, residents, and stakeholders. Recommended programs will support the City in realizing the vision and goals identified in the Plan.
Horizon 2045 includes policy recommendations for regulations to guide the decision-making process and the actions made by the City. Local polices will need to be regularly visited to address shifts in trends related to growth and development.
Horizon 2045 begins to identify future projects to shape the physical framework of the City. A more detailed list of projects with cost estimates and funding sources is necessary. An adaptable approach to investment is essential to fully leverage improvements.
The successful implementation of the actions identified in Horizon 2045 will be contingent upon various factors. Some factors are within the control of the City, such as the availability of resources, including staff time and funding. Other factors are outside of the City’s control, including market conditions. Implementation also requires a combination of efforts between the City, other public entities, and private interests, highlighting the importance of collaboration between the parties.
The implementation matrix offers a way to track progress of individual actions and the Plan as a whole, within a flexible framework that can pivot as circumstances change. The implementation matrix positions the City to achieve its future vision and goals by giving structure to the strategies and actions introduced in the policy framework. The matrix clarifies the following:
TYPE OF ACTION
Places the actions into one of four categories:
• Program / Initiative
• Policy / Regulation
• Plan / Study
• Project / Investment
Describes when effort on the actions should begin (Initiation) and whether the action is standalone or ongoing (Duration).
Initiation
• Short-Term (0-4 years)
• Mid-Term (5-10 years)
• Long-Term (10+ years)
• Underway (in progress at plan adoption) Duration
• Standalone
• Ongoing
Provides a general sense of the time and funding resources necessary for each action by indicating:
• High
• Medium
• Low RESOURCES
PRIORITY ACTIONS
Highlights the actions most often cited as priorities by the public, City Staff, Advisory Board, Planning and City Commissions during the Horizon 2045 engagement process.
Priority Action
Identifies who needs to lead or support each action.
• AD – Administration
• CC – City Commission
• CM – Communications and Marketing
• CVB – Convention and Visitors Bureau
• DS – Planning and Development Services
• ED – Economic Development
• EMA – Emergency Management Agency
• FA – Facilities
• FD – Fire Department
• JCDA – JC Development Authority
• MPO – Municipal Planning Organization
• MSC – Main Street Coordinator
• PC – Planning Commission
• PD – Police Department
• PR – Parks and Recreation
• PW – Public Works
• SCH – Schools
• TR – Transit
• WS – Water and Sewer
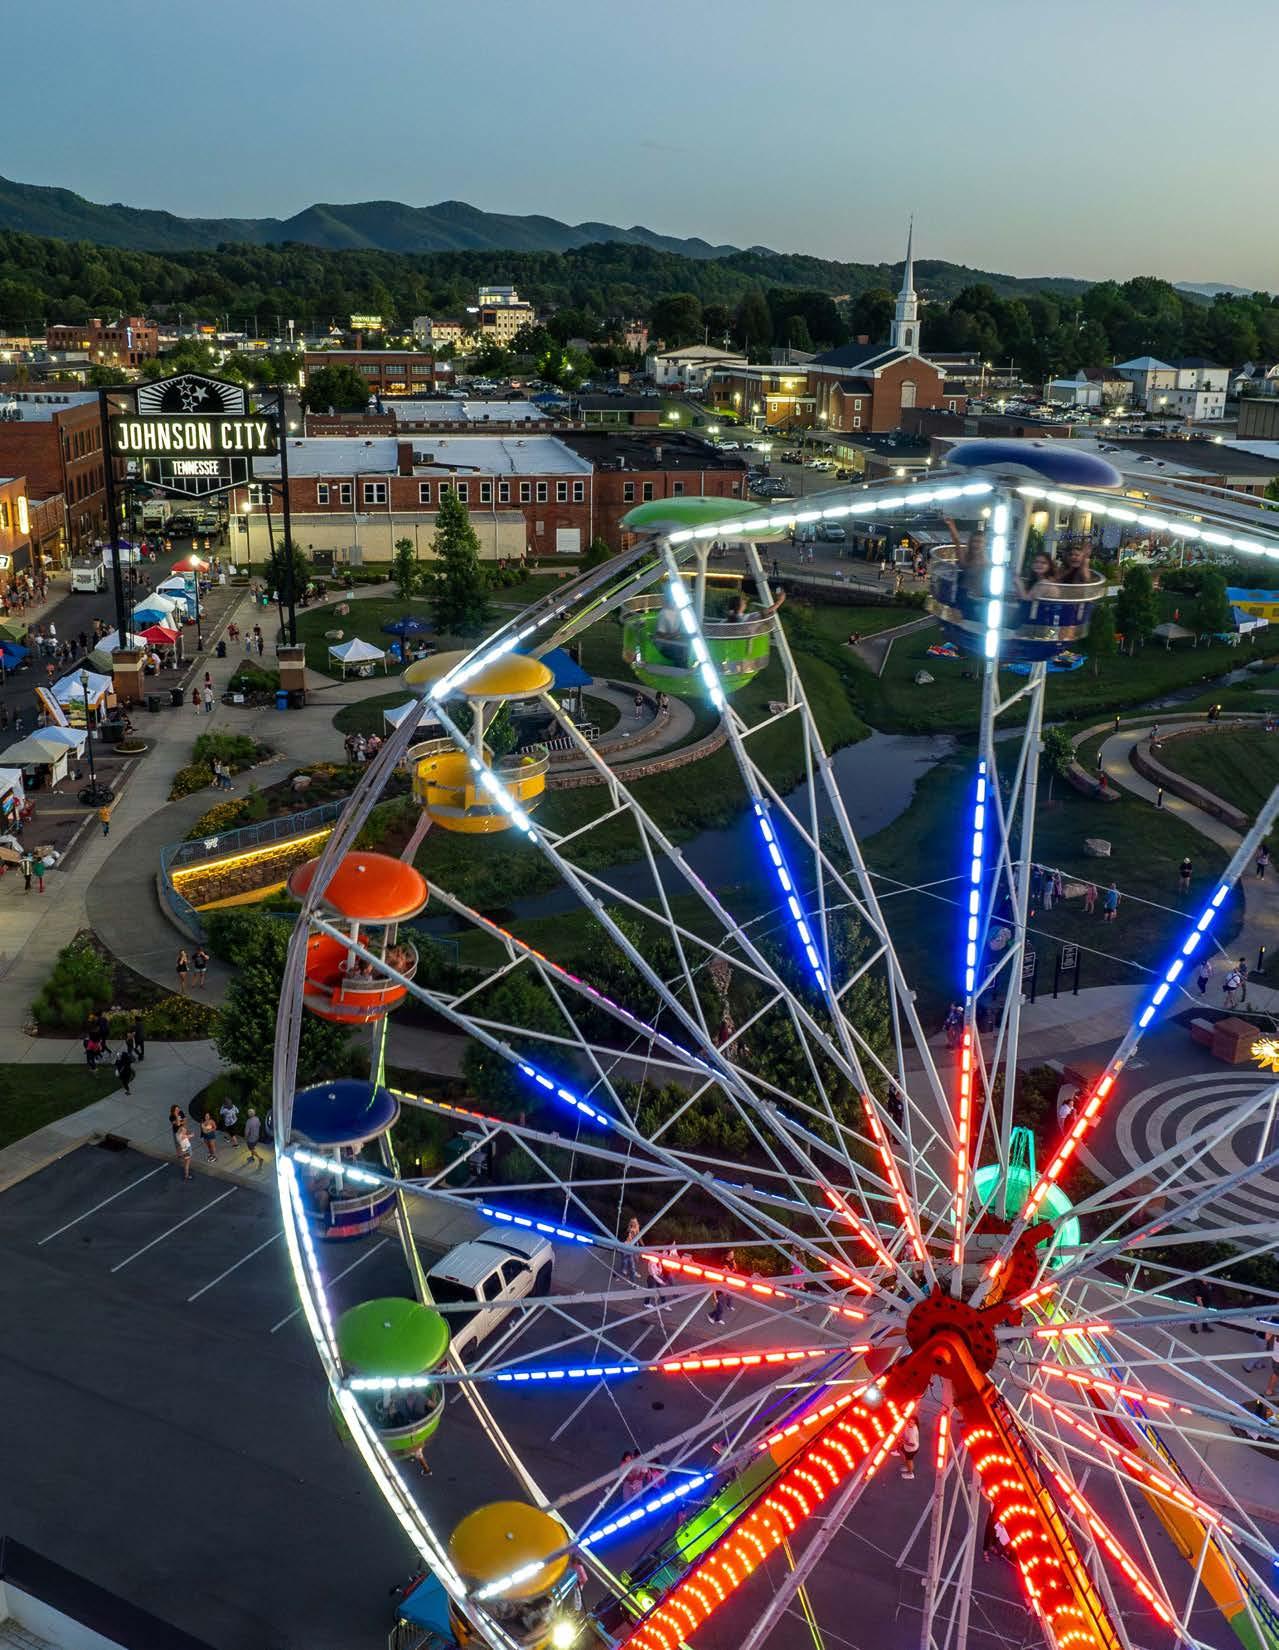
Objective Q1 Attract growth that is manageable and desirable.
Policy Q1.1 Align development with Johnson City’s vision and long-term growth strategies.
Q1.1.1
Q1.1.2
Q1.1.3
Q1.1.4
Q1.1.5
Q1.1.6
Policy Q1.2
Q1.2.1
Q1.2.2
Q1.2.3
Evaluate the Horizon 2045 Growth Management Plan every five years and prepare a thorough update every 10 years.
Utilize the Future Land Use Map (FLUM) to guide the location, type, and scale of development.
Policy / Regulation
Policy / Regulation
Review the FLUM on an annual basis to ensure consistency with current market dynamics and recent planning initiatives. Policy / Regulation
Update the City’s zoning ordinance, subdivision regulations, and other applicable land development regulations into a unified development ordinance to modernize local development standards and codify the Future Land Use Map.
Maintain regular meetings with the Growth Management Committee to support collaboration between City Departments.
Develop a fiscal impact model to evaluate proposals for development and redevelopment so that the costs and benefits to the community can be considered during decision making.
Policy / Regulation
Program / Initiative
Program / Initiative
Maintain the character of existing neighborhoods while accommodating growth in appropriate locations and densities to ensure compatibility.
Prepare focused master planning studies for areas of Johnson City that are undergoing substantial change or have increased growth pressures. Plan / Study
Establish guidelines to ensure new developments are compatible with surrounding areas. Policy / Regulation
Encourage the redevelopment of underutilized sites by aligning incentives with the preservation of community character and identity.
Policy Q1.3 Foster public-private partnerships to support desirable growth.
Q1.3.1
Q1.3.2
Work with development interests (developers, builders, real estate professionals, etc.) to inform them about Horizon 2045 in general, highlighting the Placetype concept and the new opportunities for development in Johnson City.
Partner with developers to integrate affordable housing, green spaces, and community amenities into new developments.
Program / Initiative
Program / Initiative
Program / Initiative
(10+ years)
(0-4 years)
(0-4 years)
(5-10 years)
(0-4 years)
(10+ years)
(5-10 years)
(5-10 years)
(0-4 years)
(5-10 years)
Q1.3.3
Collaborate with local businesses and institutions to identify opportunities support job creation.
Objective Q2 Distribute development in alignment with public services.
Policy Q2.1
Q2.1.1
Q2.1.2
Q2.1.3
Q2.1.4
Q2.1.5
Policy Q2.2
Q2.2.1
Q2.2.2
Q2.2.3
Q2.2.4
Continue to coordinate infrastructure and service delivery with growth areas.
Formalize a process that considers the current utility master plan in rezoning and annexation approvals to ensure new development is aligned with infrastructure capacity.
Develop an infrastructure assessment tool to evaluate the readiness of areas for new development based on the existing infrastructure network.
Program / Initiative
Program / Initiative
Program / Initiative
Continue to coordinate the annexation process to carefully consider the availability of community infrastructure and services. Policy / Regulation
Establish methods to guide development or incentivize development in areas identified as ready for growth. Policy / Regulation
Ensure interdepartmental collaboration to develop a prioritization plan for infrastructure investments in high-growth areas.
Program / Initiative
Optimize the use of existing infrastructure to reduce costs and environmental impacts.
Encourage growth in areas already served by public utilities, transportation networks, and schools. Policy / Regulation
Continue to update the utility master plan every 15 to 20 years to reflect relevant growth trends. Plan / Study
Continue to work with surrounding jurisdictions to plan for shared services near jurisdictional boundaries. Program / Initiative
Engage with community stakeholders to identify and prioritize infill site opportunities. Program / Initiative
Objective Q3 Use the built environment to contribute to the community’s quality of life.
Policy Q3.1
Q3.1.1
Q3.1.2
Ensure new developments enhance livability and promote public health.
Encourage the inclusion of parks, trails, and other recreational amenities in development plans.
Program / Initiative
Promote walkable and bike-friendly design in residential and mixed-use areas. Program / Initiative
years)
years)
Q3.1.3
Ensure City-led sidewalk projects align with this plan to complete priority connections, while updating zoning regulations to support sidewalk continuity in appropriate areas. Policy / Regulation
Policy Q3.2 Support responsible growth that meets the needs of all residents.
Q3.2.1
Q3.2.2
Policy Q3.3
Q3.3.1
Q3.3.2
Evaluate and update zoning to allow for a variety of housing types, including affordable, supportive, and workforce housing. Policy / Regulation
Continue to identify areas that are underserved in housing options, transportation or utility infrastructure, or other amenities, and prioritize investments that address those disparities. Plan / Study
Protect and enhance natural and cultural resources as part of development.
Explore new guidelines for preserving open space, waterways, and scenic views in new projects.
Partner with local organizations to restore and maintain environmental assets.
Objective N1 Maintain cohesive and people-oriented neighborhoods.
Policy N1.1
Maintain, protect, and revitalize City neighborhoods and residential areas.
N1.1.1 Support the creation of active neighborhood organizations.
N1.1.2
/ Regulation
Program / Initiative
Program / Initiative
Continue to inventory infrastructure needs in older neighborhoods and create a plan for prioritizing necessary improvements. Plan / Study
N1.1.3 Seek opportunities for beautification in older neighborhoods. Project / Investment
Policy N1.2
N1.2.1
N1.2.2
N1.2.3
Develop and implement neighborhood plans to formalize strategies to stabilize and improve neighborhoods, for ultimate adoption by the City Commission.
Create a Housing and Neighborhood Coordinator position for the City of Johnson City to tie together strategic efforts in the Planning and Development and Economic Development Departments together. Project / Investment
Establish a Neighborhood Task Force to engage a diverse group of stakeholders to implement the Strong Neighborhoods objectives and strategies of Horizon 2045. Program / Initiative
Create a list of neighborhoods for which strategy plans should be prioritized. Plan / Study
N1.2.4
Policy N1.3
N1.3.1
N1.3.2
N1.3.3
N1.3.4
Policy N1.4
N1.4.1
N1.4.2
N1.4.3
N1.4.4
Policy N1.5
N1.5.1
N1.5.2
Develop plans in partnership with the community, including neighborhood organizations, business owners, and other interested stakeholders. Plan / Study
Promote the rehabilitation of deteriorating or substandard residential properties.
Identify areas of dilapidated housing and substandard residential properties and target code enforcement and home rehabilitation/ reconstruction programs in those areas.
Create a diverse toolkit of incentives for housing rehabilitation, reuse of vacant units, and replacement of demolished units through collaboration with and support of the Housing and Community Development advisory board.
Leverage Community Development Block Grant funds to assist private citizens in the rehabilitation of their properties.
Program / Initiative
Project / Investment
Program / Initiative
Explore code officer stratification and other personnel measures to ensure adequate enforcement coverage. Program / Initiative
Encourage the preservation of Johnson City’s historic residential structures and sites and protect the character of existing historic neighborhoods through zoning regulations and historic guidelines enforcement.
Create a comprehensive inventory of historic residential structures and sites. Plan / Study
Review historic district boundaries every five years. Consider creating new districts based on the inventory of historic residential structures and sites. Plan / Study
Protect historic and/or urban residential areas from uses and buildings which are out of character and scale with the surrounding neighborhood. Policy / Regulation
Coordinate with neighborhood organizations to ensure that historic assets in neighborhoods are protected, maintained, restored, or renovated. Program / Initiative
Improve connectivity and walkability in residential and mixed-use areas to enhance quality of life, public safety, and public health.
Inventory residential and mixed-use areas that have connectivity and walkability challenges. Plan / Study
Install or maintain appropriate pedestrian and bicycle facilities, such as sidewalks, crosswalks, or bike paths, to promote active transportation.
Project / Investment
years)
(0-4 years)
(5-10 years)
years)
years)
years)
years)
N1.5.3
Objective N2
Policy N2.1
N2.1.1
N2.1.2
N2.1.3
Policy N2.2
N2.2.1
N2.2.2
N2.2.3
N2.2.4
Policy N2.3
N2.3.1
N2.3.2
N2.3.3
Provide opportunities for parks and other green/open spaces, in coordination with the Parks and Recreation Master Plan, to be incorporated into or near neighborhoods.
Program / Initiative
Provide housing options in a variety of locations, types, and price points.
Align and coordinate goals for housing supply outlined in the 2023 Johnson City Strategic Plan, the Housing Needs Assessment (2025), and the Horizon 2045 Growth Management Plan.
Support the development of housing choices that reflects compatibility of scale and creation of place as defined in the Future Land Use Map.
Develop a Housing Action Plan that outlines a detailed strategy to address the housing needs for residents of all income levels in Johnson City.
Coordinate implementation actions with the Johnson City Housing Authority’s annual plan.
/ Regulation
/ Study
/ Regulation
Update the City’s zoning ordinance to increase housing choices within zoning districts that offer access to goods, services, and transportation options.
Align zoning with Placetype maps to increase the variety of housing options, sizes, and densities in strategic locations. Policy / Regulation
Review zoning districts that are appropriate for accessory dwelling units (ADUs) and provide best practice examples and standard plans for structures. Plan / Study
Examine and implement processes to facilitate the development of small-scale residential projects such as duplexes, triplexes, and fourplexes (also known as Missing Middle Housing).
Engage housing agencies, code enforcement, building officials, developers, etc., to coordinate strategies to increase, preserve, and improve local housing options.
Plan / Study
Program / Initiative
Reevaluate fee structures, zoning ordinances, permitting and inspection processes, and other polices to encourage housing development that meets community goals.
Assess development costs annually to better understand gaps in delivering housing supply of different types and price points.
Prepare a comprehensive assessment to identify gaps, obstacles, and opportunities in development review and building permit processes to increase efficiency and reduce developer risk.
Assess vacant lots owned by Johnson City or faith-based organizations for appropriateness to support the increase in housing supply.
Plan / Study
Plan / Study
Plan / Study
(0-4 years)
years)
years)
N2.3.4
N2.3.5
Policy N2.4
N2.4.1
N2.4.2
N2.4.3
N2.4.4
N2.4.5
N2.4.6
Policy N2.5
N2.5.1
Explore ways to supplement tap fees, permit fees, and building review fees to support the construction of housing that meets community goals for supply and affordability. Policy / Regulation
Evaluate the feasibility and potential impacts of modifying parking requirements for housing units serving very low, low, and moderateincome households in areas with strong transportation and mobility options. Policy / Regulation
Establish and promote housing programs to support households with targeted needs, including very low/low-income households, the unhoused, licensed group homes/permanent supportive housing, and housing that supports aging populations.
Align housing strategies for the homeless with the Strategic Plan to Reduce Homelessness report. Policy / Regulation
Review and update the zoning ordinance to refine the location of shelters, transitional housing, independent living, assisted living, nursing home facilities, housing for special needs individuals, and other housing that meets community needs. Plan / Study
Coordinate with organizations that provide emergency shelter, transitional housing, and permanent supportive housing to special needs individuals and families.
Assess establishing a housing trust fund or creating a land bank to support the development of housing targeting very low, low, and moderate-income households.
Assist in obtaining financial assistance and incentives for the construction of independent living and assisted living facilities for very low, low, and moderate-income individuals and families.
Provide governmental funding to expand and maintain organizations that address the needs of the homeless.
Program / Initiative
Plan / Study
Program / Initiative
Project / Investment
Promote opportunities for first-time homebuyers, including existing federal and state housing programs and informational seminars.
Encourage the use of federal and state housing programs by non-profit and for-profit housing developers.
N2.5.2 Coordinate with housing partners to conduct educational seminars for potential first-time home buyers.
Program / Initiative
Program / Initiative
(0-4 years)
(0-4 years)
(0-4 years)
(0-4 years)
(0-4 years)
(5-10 years)
years)
years)
(0-4 years)
(0-4 years)
Objective P1 Maintain a vibrant local economy.
Policy P1.1
P1.1.1
Support business investments that create economic and employment opportunities for all residents.
Develop a comprehensive Economic Development Strategic Plan to guide the City’s economic growth efforts, identify target industries, and outline implementation strategies.
P1.1.2 Facilitate infrastructure planning and service provision to support business growth.
P1.1.3
P1.1.4
P1.1.5
Plan / Study
Program / Initiative
Establish incentive programs that align with the City’s target industries and economic development priorities. Policy / Regulation
Review publicly owned properties for their appropriateness to host economic development generating land uses. Plan / Study
Maintain and promote an inventory of commercial and industrial sites to attract investment and guide land use decisions.
Project / Investment
Policy P1.2 Promote business retention and expansion to sustain and strengthen the local economy.
P1.2.1
P1.2.2
Regularly review and update zoning ordinances to ensure they accommodate emerging industries and evolving market trends.
Policy / Regulation
Continue to provide a tracking system to monitor business retention rates. Program / Initiative
Policy P1.3 Maintain Johnson City’s position as a regional retail and experience destination.
P1.3.1
Identify and promote key commercial corridors and retail nodes that align with future land use plans and market demand. Program / Initiative
P1.3.2 Implement wayfinding and branding initiatives to enhance Johnson City’s visibility as a regional shopping and entertainment hub.
P1.3.3
P1.3.4
P1.3.5
Research and act upon opportunities to develop targeted incentives and partnerships to attract experiential retail, dining, and entertainment options that align with evolving consumer preferences.
Ensure transportation and mobility plans support easy access to major retail destinations, including multimodal connectivity and parking management strategies.
Project / Investment
/ Study
/ Regulation
Periodically assess the City’s retail market conditions to identify shifts in consumer behavior and adjust land use strategies accordingly. Plan / Study
years)
(5-10 years)
(5-10 years)
(0-4 years)
years)
years)
P1.3.6
Objective P2
Policy P2.1
P2.1.1
P2.1.2
Policy P2.2
P2.2.1
P2.2.2
Policy P2.3
P2.3.1
P2.3.2
Policy P2.4
P2.4.1
P2.4.2
Support tourism-driven businesses by collaborating with the Convention and Visitors Bureau to promote events and shopping experiences.
Program / Initiative
Support a variety of job sectors to meet the needs of the community workforce.
Support entrepreneurship and innovation to foster job diversity.
Explore the creation of a maker space and co-working hubs to foster innovation and small-business development.
Promote business incubators and accelerator programs to support entrepreneurs and emerging industries.
Project / Investment
Program / Initiative
Leverage regional partnerships to attract and retain a diverse range of employers.
Collaborate with regional economic organizations to market Johnson City as an attractive location for diverse, high-wage industries.
Program / Initiative
Work with state and federal partners to identify grant opportunities that support economic diversification. Plan / Study
Maintain a balanced tax base that is competitive for business investment.
Conduct a periodic review of the City’s revenue streams with peer cities to identify potential adjustments to support business growth.
Explore tax-based incentive programs, such as tax increment financing (TIF) districts, to attract and retain businesses in strategic growth areas.
Plan / Study
Program / Initiative
Strengthen workforce development initiatives that align with current and future economic demands.
Partner with local educational institutions, including ETSU and technical colleges, to align curriculum offerings with the City’s target industries and workforce needs.
Continue to support the First Tennessee Development District to regularly evaluate employment trends and provide recommendations for policy adjustments.
Program / Initiative
P2.4.3
Program / Initiative
Promote workforce housing and childcare initiatives to support a stable workforce by aligning workforce-supportive development with employment centers. Policy / Regulation
years)
(0-4 years)
(0-4 years)
years)
Objective P3
Policy P3.1
P3.1.1
P3.1.2
P3.1.3
P3.1.4
Encourage revitalization of commercial corridors and centers.
Encourage redevelopment of underutilized and aging commercial corridors.
Identify priority areas for revitalization and adopt overlay districts to support mixed-use development.
Continue to work with regional and state economic development agencies to promote economic development opportunities for the Boones Creek Development District.
Research and facilitate grants for façade improvements and to enhance pedestrian and vehicular accessibility.
Establish financial incentives to support property owners in revitalization projects along commercial corridors.
Policy / Regulation
Program / Initiative
Project / Investment
Project / Investment
Policy P3.2 Support adaptive reuse or redevelopment of vacant or underutilized commercial properties.
P3.2.1
P3.2.2
Create a framework for prioritizing adaptive reuse and redevelopment of underutilized commercial and industrial properties to retain business activity in key locations.
Develop incentives for the adaptive reuse or redevelopment of underutilized commercial spaces.
P3.2.3 Streamline permitting processes for redevelopment projects.
P3.2.4
Policy P3.3
Encourage mixed-use developments that align with the City’s comprehensive growth strategy and Future Land Use Map.
Plan / Study
Policy / Regulation
Program / Initiative
Policy / Regulation
Enhance infrastructure and public improvements to attract investment in commercial corridors and centers.
P3.3.1 Identify key corridors for investment in streetscape enhancement.
P3.3.2
P3.3.3
Policy P3.4
P3.4.1
Explore improving multimodal connectivity to commercial centers through expanded transit and pedestrian friendly infrastructure.
Ensure utilities and infrastructure upgrades align with future growth demands in commercial districts where feasible.
Project / Investment
Project / Investment
Project / Investment
Foster a mix of uses within commercial centers to promote vibrancy and economic resilience.
Encourage mixed-use developments that integrate retail, office, light industrial, and residential uses.
Policy / Regulation
years)
(5-10 years)
P3.4.2
Incentivize developments that support placemaking and community gathering spaces. Program / Initiative
P3.4.3 Align zoning regulations to facilitate diverse development opportunities within commercial corridors. Policy / Regulation
Objective D1 Maintain the unique character of Downtown.
Policy D1.1
D1.1.1
D1.1.2
D1.1.3
Promote a mix of uses that align with Downtown’s character and community needs.
Prepare a conceptual master plan that guides growth and development in Johnson City’s Downtown.
Review zoning code to ensure that it that allows for a blend of higherdensity residential, commercial, and cultural, while maintaining Downtown’s identity.
Support infill development that aligns with existing character in areas where infrastructure of sufficient capacity is currently provided.
Policy D1.2 Preserve and enhance the historic and cultural assets of Downtown.
D1.2.1
D1.2.2
Work with the Tennessee Historical Commission to create an updated inventory of historic assets and an action plan to protect at-risk historic properties and districts.
Ensure historical preservation efforts maintain the architectural integrity and cultural significance of key buildings and sites.
Policy D1.3 Encourage adaptive reuse of underutilized buildings in Downtown.
D1.3.1
D1.3.2
D1.3.3
D1.3.4
/ Study
/ Regulation
Program / Initiative
/ Study
/ Regulation
Conduct a Downtown building inventory and assessment to identify key properties suitable for adaptive reuse and prioritize them for redevelopment efforts. Plan / Study
Prioritize efforts to seek public-private partnerships to renovate the John Sevier property. Project / Investment
Research tools that can be used to incentivize the rehabilitation of vacant and aging structures to ensure they contribute to Downtown’s character.
Encourage mixed-use redevelopment of underutilized buildings to support a balance of retail, office, and residential uses that align with Downtown’s character.
/ Study
Program / Initiative
Objective D2 Support Downtown's viability as an economic anchor
Policy D2.1
D2.1.1
D2.1.2
Policy D2.2
D2.2.1
D2.2.2
D2.2.3
D2.2.4
Policy D2.3
D2.3.1
D2.3.2
D2.3.3
D2.3.4
D2.3.5
Encourage context-appropriate development that increases the economic health of Downtown.
Develop Downtown-specific design guidelines to ensure new developments complement existing architectural character and land use patterns.
Coordinate with service providers and implement strategies from the City-Wide Strategic Plan to Reduce Homelessness to improve perceptions of safety Downtown while supporting individuals experiencing homelessness.
Policy / Regulation
Policy / Regulation
Support incentive programs in Downtown that offer existing and new businesses a competitive edge to flourish.
Explore new incentive programs and strategies to encourage reinvestment in Downtown properties.
Prepare a feasibility study to understand the implications of implementing a Downtown Business Improvement District (BID) to provide sustained funding for marketing, streetscape enhancements, and security.
Continue to offer façade improvement grants to help businesses upgrade their storefronts and enhance Downtown’s appeal.
Provide technical assistance to businesses navigating City processes, including permitting, grants, and site selection.
Policy / Regulation
Plan / Study
Program / Initiative
Program / Initiative
Strengthen connectivity and mobility to improve access to and within Downtown.
Implement priority enhancements and improvements to Downtown parking in accordance with the Downtown Johnson City Parking and Circulation Study (2024-2025).
Conduct a Downtown mobility study to identify and address gaps in pedestrian, bicycle, and transit connectivity.
Enhance pedestrian safety by improving crosswalks, lighting, and traffic calming measures in key areas.
Conduct a wayfinding study to develop design guidelines for Downtown gateways, signage, and destination markets.
Research opportunities to offer shuttle service between Downtown Johnson City and ETSU.
Project / Investment
Plan / Study
Project / Investment
Plan / Study
Program / Initiative
years)
(0-4 years)
(0-4 years)
Policy D2.4
D2.4.1
D2.4.2
D2.4.3
D2.4.4
Invest in interdepartmentally coordinated infrastructure improvements that support long-term economic sustainability and attract private investment.
Prioritize infrastructure improvements, including streetscape enhancements, and utility upgrades in Downtown revitalization areas. Project / Investment
Establish a capital improvement plan (CIP) focused on Downtown’s infrastructure needs. Plan / Study
Leverage state and federal funding opportunities to support major Downtown infrastructure projects.
Develop public-private partnerships to support infrastructure investments that attract new development and business activity.
/ Initiative
/ Initiative Policy D2.5
Diversify Downtown’s economic base by attracting a mix of retail, office, entertainment, and cultural uses.
D2.5.1
D2.5.2
D3.1
D3.1.1
D3.1.2
Policy D3.2
D3.2.1
D3.2.2
Policy D3.3
D3.3.1
Conduct a targeted business recruitment strategy to attract diverse businesses that align with Downtown’s long-term economic goals. Program / Initiative
Work with local arts organizations to develop cultural programming and public art installations that enhance Downtown’s appeal. Program / Initiative
Develop a comprehensive branding and marketing strategy to promote Downtown's unique identity.
Create a unified branding campaign that highlights the unique history, culture, and amenities of Downtown. Program / Initiative
Conduct annual visitor perception surveys to refine marketing strategies and address areas for improvement. Plan / Study
Strengthen partnerships with local organizations, businesses, and institutions to amplify Downtown's appeal.
Continue to facilitate a Downtown stakeholder committee to align efforts between business owners, property developers, and cultural institutions.
Continue to foster partnerships with the Chamber of Commerce and regional economic development organizations to support business growth and recruitment efforts.
/ Initiative
/ Initiative
Promote Downtown as a hub for arts, culture, and entertainment through strategic initiatives and partnerships.
Support the installation of public art projects in key Downtown locations to enhance visual interest and cultural engagement. Project / Investment
(0-4 years)
(5-10 years)
(5-10 years)
(5-10 years)
years)
years)
years)
D3.3.2
D3.3.3
D3.3.4
Policy D3.4
D3.4.1
D3.4.2
Partner with local arts organizations to offer rotating exhibits and popup events in underutilized spaces. Program / Initiative
Encourage outdoor dining and street performances to activate Downtown public spaces. Program / Initiative
Continue to provide financial and logistical support to local artists and cultural organizations seeking to host events in Downtown. Program / Initiative
Collaborate with the tourism industry to position Downtown as a must-visit destination for regional and national visitors.
Work with the local Convention and Visitors Bureau to develop visitor guides and promotional materials featuring Downtown.
Utilize analytics and visitor data to identify trends and target marketing efforts to key demographics.
Objective T1 Enhance the existing transportation system
Policy T1.1
T1.1.1
T1.1.2
T1.1.3
T1.1.4
T1.1.5
T1.1.6
Policy T1.2
T1.2.1
/ Initiative
/ Study
Prioritize a multimodal transportation network that supports pedestrians, cyclists, transit users, and motorists.
Identify and prioritize key corridors for multimodal enhancements based on user demand and connectivity needs. Plan / Study
Implement complete streets principles as applicable to enhance connectivity and ensure infrastructure accommodates all users.
/ Regulation
Expand and improve sidewalk network to provide safe and efficient nonmotorized transportation options. Project / Investment
Expand the City’s greenway network to connect neighborhoods with major employment centers and recreational destinations. Project / Investment
Conduct an annual accessibility audit of multimodal facilities to identify gaps and prioritize improvements.
/ Study
Foster partnerships with regional transit agencies to enhance connectivity within and beyond Johnson City and seek additional funding sources for expanded transit routes. Program / Initiative
Ensure transportation infrastructure improvements align with future land use and development goals.
Preserve and enhance connectivity between neighborhoods, commercial centers, and employment hubs through targeted infrastructure investments. Project / Investment
T1.2.2
T1.2.3
Policy T1.3
T1.3.1
T1.3.2
Continue to incorporate stormwater management and green infrastructure into street and transportation improvements to enhance sustainability. Project / Investment
Promote mixed-use developments that integrate transportation options and reduce dependency on single-occupancy vehicles. Program / Initiative
Prioritize the proper operation and maintenance of the current roadway network.
Monitor traffic volumes, level of service (LOS), safety, and land use to anticipate needed improvements to the local transportation system.
Evaluate existing roads under the authority of TDOT to determine fiscal impact and opportunity-cost of establishing local control.
Policy T2.1
T2.1.1
T2.1.2
T2.1.3
T2.1.4
Policy T2.2
T2.2.1
T2.2.2
T2.2.3
T2.2.4
/ Regulation
Enhance safety for all road users though targeted infrastructure improvements and traffic calming measures.
Develop a Safety Action Plan. Plan / Study
Implement traffic calming measures in residential and commercial areas to enhance motorist, pedestrian, and cyclist safety.
Project / Investment
Develop and maintain safe routes to schools and major community destinations, through crosswalk enhancements, improved signage, and other strategies. Project / Investment
Develop a corridor management plan to optimize traffic flow and access to businesses along major arterial roads. Program / Initiative
Improve pedestrian and cyclist safety through design and maintenance of transportation infrastructure.
Encourage pedestrian-first design principles in areas of high foot traffic to minimize conflicts between users.
Program / Initiative
Ensure Americans with Disabilities Act (ADA) compliance for all transportation infrastructure projects to support mobility options that are available to users of all ages and abilities. Project / Investment
Upgrade lighting, visibility, and security features at transit stops to enhance pedestrian and cyclist safety. Project / Investment
Conduct regular audits of pedestrian and cyclist infrastructure to ensure it meets updated safety and accessibility regulations and policies established through state and federal regulatory agencies.
Project / Investment
Policy T2.3
T2.3.1
T2.3.2
Policy T2.4
T2.4.1
T2.4.2
T2.4.3
Support the integration of smart transportation technologies to improve system efficiency and user experience.
Explore technologies, such as smart signals and app-based parking solutions, and develop procedures for vetting and testing appropriate technology solutions, where applicable. Program / Initiative
Explore partnerships to test innovative transportation technologies. Program / Initiative
Foster a culture of safety and awareness among all transportation system users.
Launch public education campaigns focused on transportation safety, including responsible travel behaviors and awareness of vulnerable users. Program / Initiative
Partner with schools and community organizations to promote safe travel practices for students, drivers, pedestrians, and cyclists.
Use data-driven approaches to monitor and evaluate the effectiveness of safety programs and adjust as needed.
Objective T3 Connect Johnson City to the greater region.
Policy T3.1
T3.1.1
T3.1.2
Policy T3.2
T3.2.1
T3.2.2
T3.2.3
/ Initiative
/ Study
Strengthen regional partnerships to coordinate transportation planning and infrastructure investments.
Align regional transportation priorities and funding strategies and advocate for state and federal funding opportunities to support regional transportation projects.
Coordinate with neighboring communities to ensure seamless transportation networks across jurisdictions.
/ Initiative
/ Initiative
Expand regional transit options to enhance connectivity between Johnson City and surrounding municipalities.
Evaluate the need for park-and-ride facilities in Johnson City to encourage regional commuting options.
Develop a comprehensive regional transit plan with transit hubs that connect Johnson City to major employment and residential centers.
Explore the implementation of on-demand microtransit options to serve low-density areas and improve first-mile/last-mile connectivity.
/ Study
/ Study
/ Study
(5-10 years)
(5-10 years)
(0-4 years)
(0-4 years)
Policy T3.3
T3.3.1
T3.3.2
T3.3.3
Policy T3.4
T3.4.1
T3.4.2
T3.4.3
Improve access to major highways and transportation corridors to facilitate regional economic development.
Support initiatives to enhance access to the Tri-Cities Airport and other regional transportation hubs.
Collaborate with state and federal agencies to identify and prioritize projects that enhance freight mobility along regional corridors.
Encourage infrastructure investments that enhance travel reliability and reduce congestion along key highway corridors.
Promote regional connectivity through multimodal infrastructure.
Extend trail and greenway networks to connect Johnson City with nearby region and regional destinations.
Incorporate regional bikeway and greenway connection into transportation plans to facilitate seamless non-motorized travel between regional destinations.
Develop shared-use paths that link regional transit hubs to employment centers, parks, and neighborhoods.
Policy T3.5 Plan for future regional mobility needs.
T3.5.1
T3.5.2
T3.5.3
Objective H1
Policy H1.1
H1.1.1
H1.1.2
Establish a long-term vision for regional mobility that incorporates emerging technologies and travel trends.
Identify future mobility trends, such as electric vehicle infrastructure, autonomous vehicles, and shared mobility services for integration into regional plans.
Coordinate with regional agencies to conduct scenario planning that assesses long-term impacts of growth on transportation networks.
Program / Initiative
Project / Investment
Project / Investment
Project / Investment
Plan / Study
Project / Investment
Program / Initiative
Plan / Study
Plan / Study
Respect the heritage of Johnson City to foster community pride through a strong sense of place
Support redevelopment and revitalization efforts that respect the City's historic character.
Create a comprehensive inventory of historic landmarks, sites, and cultural assets and update periodically.
Develop and apply a methodology for prioritizing needed revitalization efforts to inventoried historic landmarks, sites, and cultural assets.
Plan / Study
Plan / Study
(5-10 years)
(10+ years)
(10+ years)
(10+ years)
H1.1.3
H1.1.4
Policy H1.2
H1.2.1
Develop guidelines that integrate historic preservation principles into redevelopment projects.
Provide incentives for adaptive reuses of historic structures to highest priority revitalization efforts.
Integrate land use planning with historic preservation.
Identify zoning and land use tools that protect historic districts and prevent incompatible uses.
Policy H1.3 Celebrate and promote Johnson City's cultural and historic resources.
H1.3.1
H1.3.2
H1.3.3
Integrate local heritage and history into park designs, interpretive signage, and events.
Develop and promote heritage trails that connect historic and cultural sites across the City.
Coordinate with the Johnson City Visitor’s Center to enhance marketing efforts to showcase Johnson City’s cultural and historic resources.
Policy / Regulation
Program / Initiative
Policy / Regulation
Program / Initiative
Project / Investment
Program / Initiative
Objective H2 Preserve the natural environment to improve community health and quality of life.
Policy H2.1
H2.1.1
H2.1.2
H2.1.3
Protect natural resources and promote environmental stewardship.
Work to preserve wetlands, forests, and waterways as key recreation and environmental assets.
Implement programs to protect ridgelines and viewsheds and restore degraded natural areas.
Program / Initiative
Program / Initiative
Establish guidelines for voluntary conservation easements to protect sensitive habitats and agricultural lands. Policy / Regulation
H2.1.4 Designate future land uses that are consistent with the preservation of natural resources. Policy / Regulation
H2.1.5
H2.1.6
H2.1.7
Develop conservation zoning districts to protect habitat, natural features, and existing farmland.
Work with the City Forester to review and update the City’s landscaping requirements on a periodic basis to ensure they encourage the use of natural and drought-tolerant species.
Design and implement a public information campaign, including hard copy and online materials, to educate residents on how they can protect the natural environment.
Policy / Regulation
Policy / Regulation
Program / Initiative
(5-10 years)
(10+ years)
Policy H2.2
H2.2.1
H2.2.2
H2.2.3
Encourage sustainable practices in development and infrastructure
Promote green building practices though incentives and awareness campaigns. Program / Initiative
Update zoning ordinances and building codes as required to encourage low-impact development practices, such as the use of permeable pavements, bioswales, and green roofs in new developments.
/ Regulation
Build upon environmental stewardship practices and expand initiatives as newer technologies are available. Program / Initiative
Policy H2.3 Foster public engagement in environmental initiatives.
H2.3.1
H2.3.2
Policy H2.4
H2.4.1
H2.4.2
H2.4.3
Develop educational programs in partnership with schools to teach residents about conservation and healthy lifestyles through parks. Program / Initiative
Develop relationships with existing community advisory boards to help educate and guide environmental policies and projects. Program / Initiative
Support community accessibility to open space through implementation of Parks and Recreation Master Plan.
Implement priority initiatives from the Parks and Recreation Master Plan.
Program / Initiative
Identify and pursue a mix of funding sources to provide for ongoing maintenance and future improvements to parks, trails, and open space to meet community needs as the City grows. Program / Initiative
Assess vacant lots owned by Johnson City or faith-based organizations for appropriateness to support the increase in housing supply. Plan / Study
H3.1
H3.1.1
H3.1.2
H3.1.3
H3.1.4
Identify and address gaps in healthcare access through partnerships with local providers and non-profit organizations. Program / Initiative
Support the development of community health centers in underserved areas.
/ Initiative
Continue to collaborate with Parks and Recreation to identify opportunities for health and wellness programs in park facilities. Program / Initiative
Encourage mixed-use development that integrates residential, healthcare, and recreational facilities. Policy / Regulation
(0-4 years)
(5-10 years)
(10+ years)
(0-4 years)
(0-4 years)
(5-10 years)
Policy H3.2 Encourage healthy lifestyles and preventative care.
H3.2.1
H3.2.2
H3.2.3
H3.2.4
Expand recreational programming and facilities to promote physical activity and wellness.
Continue to partner with healthcare organizations to offer health education programs, prioritizing communities with gaps in healthcare access.
Expand facility planning and programming for youth, families, and active adults/seniors.
Continue to offer active programming, such as fitness classes, aquatics programming, community events, or environmental education programs, to make parks more vibrant and engaging to a wide range of residents.
Policy H3.3 Improve emergency and specialized healthcare services.
H3.3.1
H3.3.2
H3.3.3
Program / Initiative
Program / Initiative
Program / Initiative
Program / Initiative
Assess healthcare system capacity to meet the needs of a growing population. Plan / Study
Enhance coordination between healthcare providers and emergency response teams to ensure residents and users of new development can be adequately served.
Partner with the major healthcare providers to better understand and plan for possible expansion plans to support services for a growing population.
S1.1 Regularly evaluate public infrastructure efficiency and effectiveness
Program / Initiative
Program / Initiative
S1.1.1 Conduct performance audits of key public services every five years. Plan / Study
S1.1.2 Continue to provide a public service dashboard to track performance metrics and share outcomes with the community. Program / Initiative
S1.1.3
Maintain the Stormwater Maintenance Policy to ensure incorporation of state regulations and, to the extent possible, ease the burden of Homeowner Associations (HOA) maintenance.
Policy S1.2 Ensure the fiscal sustainability of public infrastructure investments.
S1.2.1
S1.2.2
S1.2.3
S1.2.4
Continue to utilize long-term financial plans for utility services to ensure expansion, maintenance, and operations effort match the rate of growth subject to approved funding.
Identify possible grant opportunities to support major utility upgrades or expansions.
Review and revise rate structure for water and sewer, solid waste, and storm water services to adequately fund improvements, including asset rehabilitation and regulatory compliance.
Develop a fiscal impact model to assist development review by determining the costs and benefits for public services and capital investments for proposed projects.
Policy S1.3 Promote innovation and sustainability in public infrastructure.
S1.3.1
S1.3.2
Research and pilot energy efficient and cost-saving technologies in public utilities.
Continue to rehabilitate the wastewater collection system by repairing, cleaning, and replacing mains as well as monitoring problem areas.
Policy S2.1 Strengthen the emergency response and preparedness capabilities.
S2.1.1
S2.1.2
S2.1.3
Continue to coordinate with surrounding counties to update the Emergency Management Plan every five years to address changing risks, vulnerabilities, and areas of need.
Promote and maintain the Citywide early warning system for weatherrelated and other emergencies.
Comply with and support all regional and national laws, regulations, and programs designed to protect the public from natural and man-made hazards and disasters.
Policy S2.2 Enhance public safety services to meet growing demands.
S2.2.1
Assess staffing and resource needs for police, fire, and EMS Departments based on population growth projections.
Program / Initiative
Plan / Study
Program / Initiative
Policy / Regulation
Project / Investment
Project / Investment
Project / Investment
Plan / Study
Project / Investment
Policy / Regulation
Plan / Study
S2.2.2
S2.2.3
Periodically evaluate the need for new police, fire, and EMS facilities to expand the first responder network and improve response time as established in existing service studies.
/ Study
Continue dedication to community outreach programs, such as community policing and fire prevention initiatives and reassess programs on a periodic basis. Program / Initiative
Policy S2.3 Promote partnerships to improve security and preparedness.
S2.3.1
S2.3.2
Continue to encourage cooperative water and sewer arrangements with neighboring governmental units to promote economic development and protect public health.
Establish mutual aid agreements with neighboring jurisdictions for disaster response and recovery efforts.
/ Regulation
/ Regulation
S2.3.3 Partner with healthcare and emergency response services to ensure their facilities and service expansion efforts align with growth patterns. Program / Initiative
Objective S3 Match the pace and distribution of growth to the availability of services.
Policy S3.1 Align public service expansions with growth areas.
S3.1.1
S3.1.2
S3.1.3
S3.1.4
Conduct a periodic review of growth patterns and utility capacities to inform service expansion priorities.
Develop phased service expansion plans that are tied to the development approval process.
Ensure a formal annexation request is made for all applications seeking water and sewer services within the Urban Service Area where line extension is required.
Explore the use of development capacity fees to fund new infrastructure and services required by growth.
Policy S3.2 Ensure a balanced distribution of public services.
S3.2.1
S3.2.2
Continue to identify and monitor areas and prioritize investments to address service gaps.
Continue to review development proposals for their appropriateness based on water and sewer service availability.
/ Study
/ Study
/ Regulation
/ Regulation
/ Initiative
/ Regulation
Objective E1 Honor a first-class education system for students of all ages
Policy E1.1 Align new school facilities, upgrades, and improvements with Johnson City Schools strategic Plan.
E1.1.1
E1.1.2
E1.1.3
Policy E1.2
E1.2.1
E1.2.2
E1.2.3
E1.2.4
Periodically review, comparing growth patterns and updating priorities where needed. Plan / Study
Promote coordination between City planning and school systems planning to ensure alignment with broader growth strategies.
Support collaboration between the school system and the Planning Department to evaluate the impact of annexations on school enrollment and to comprehensively understand the impact on service and street maintenance.
Program / Initiative
Program / Initiative
Provide adequate school capacity to meet present and future enrollment needs in coordination with the City, Johnson City Schools, and county school systems.
Conduct enrollment forecasts every five years to adapt to growth trends and demographic changes.
Periodically evaluate and adjust school boundaries to balance enrollment across districts and optimize facility uses.
Proactively collaborate with ETSU and the School Board in planning expansions, renovations, or new construction.
Plan / Study
Plan / Study
Program / Initiative
Develop guidelines to ensure new transportation infrastructure aligns with school access and safety needs. Policy / Regulation
E1.2.5 Incorporate school capacity considerations into annexation policies and zoning decisions for new developments. Policy / Regulation
Policy E1.3 Maintain facilities that support high-quality education and specialized programs.
E1.3.1
E1.3.2
Audit current program space availability and address gaps through renovations or additions. Plan / Study
Promote partnerships with ETSU, Northeast State, and Tennessee College of Applied Technology (TCAT-Boone Creek Extension) to access innovative teaching methods, advanced resources, and dual-enrollment opportunities.
Objective E2 Support an evolving and connected ETSU Campus
Program / Initiative
Policy E2.1 Ensure new development and improvements alignment with the ETSU Strategic Plan.
(0-4 years)
(0-4 years)
(0-4 years)
(5-10 years)
(5-10 years)
(5-10 years)
years)
years)
years)
years)
E2.1.1
Policy E2.2
E2.2.1
E2.2.2
E2.2.3
E2.2.4
Policy E2.3
E2.3.1
E2.3.2
Policy E2.4
E2.4.1
Policy E3.1
E3.1.1
Periodically review the ETSU Strategic Plan to ensure alignment with the City’s growth objectives. Plan / Study
Strengthen collaboration between ETSU, the City, and local schools to create an integrated educational ecosystem.
Expand dual-enrollment programs and teacher training initiatives with ETSU.
Develop joint-use facilities to maximize shared resources (e.g., libraries, labs, rec centers).
Coordinate transit initiatives with ETSU to enhance access for students and faculty and to increase placemaking between the campus and Downtown.
Encourage ETSU to engage with K-12 students through mentorship programs, internships, and research opportunities.
Program / Initiative
Project / Investment
Project / Investment
Program / Initiative
Promote lifelong learning opportunities and community engagement through ETSU programs.
Conduct feasibility studies for transit routes linking ETSU to schools and neighborhoods.
Coordinate public infrastructure projects, such as transit routes and pedestrian networks to enhance connectivity to ETSU.
Plan / Study
Project / Investment
Establish a formal ETSU-City Partnership Council to enhance collaboration between ETSU and the City.
Task the Planning Commission with aligning ETSU’s growth plans with City infrastructure and community engagement goals.
Program / Initiative
Strategically locate new schools to support infill development and discourage urban sprawl.
Maintain an inventory of new housing developments, their location, and the number of units that will be built to better communicate the directionality of growth to the Johnson City School System. Plan / Study
E3.1.2 Identify underserved areas and future schools or learning sites. Plan / Study
E3.1.3
E3.1.4
Acquire land for future school development in alignment with the City’s comprehensive growth strategies. Project / Investment
Ensure that transportation plans for new developments include provisions for school bus access, pedestrian safety, and bike routes. Policy / Regulation
years)
(10+ years)
years)
The Horizon 2045 Plan is not a static document, it is a living roadmap meant to adapt alongside the community it serves. Implementation will require steady leadership, flexible thinking, and strategic investments. The following steps offer guidance for activating the Plan after adoption:
Celebrate the Plan as a Community Achievement. Horizon 2045 reflects the input, aspirations, and hard work of Johnson City’s residents and leaders. The City should take time to mark its adoption and promote it as a shared vision for the future. Keep the Plan in Sight and in Practice. Every department, board, and partner should keep the Plan at the forefront of their work. It should be consulted in key decisions and highlighted in budget planning, grant applications, and strategic conversations.
Allocate the Resources to Succeed. From grant writing and staff capacity to public-private partnerships, implementation will require intentional investment. The City must prioritize resources for the highest-impact actions and build capacity where needed.
Monitor Progress and Adjust as Needed. The City should revisit the Plan on a regular basis, tracking progress, and refine the path forward. At minimum, a formal review should occur regularly and updates to the Plan should be anticipated to respond to emerging conditions and changing circumstances.
Champion the Vision Over Time. The City’s leadership, both current and future, must commit to carrying this vision forward. Sustained momentum will depend on a culture of collaboration, innovation, and responsiveness.
Adopting Horizon 2045 is the first step in shaping the City’s future. The Implementation Matrix serves as an outline to a clear path forward for each strategy and action identified throughout the Plan. Several of these actions will support or result in updates to Johnson City’s zoning ordinance, regulations, or capital planning priorities. Aligning these tools with the Plan will ensure consistency between policy and practice.
Horizon 2045 offers a long-range framework for future growth and development in and around Johnson City. Economic, environmental, demographic, and regulatory conditions are constantly evolving; therefore, the Plan must remain a living document. It should be referenced frequently, monitored regularly, and updated as needed to reflect emerging opportunities and community priorities. The City should conduct a review of the Plan every 3 to 5 years, with a more comprehensive update every 7 to 10 years. Regular maintenance of this document is essential to ensure the Plan remains relevant and effective in guiding decision-making and growth management. Through consistent monitoring, community engagement, and leadership commitment, the Horizon 2045 Plan can serve as a dependable guide for years to come.

As Johnson City continues to change and thrive, the Horizon 2045 plan will continue the path forward for growth, development, and investment in the City. The plan provides a blueprint for land use decisions and is an important step in reassessing the rules and regulations expressed in the City’s zoning. Horizon 2045 rests firmly on a foundation built from the significant contribution of time, energy, and ideas from residents, business owners, visitors, staff, and elected officials as well as past planning efforts. This foundation is expressed in a guiding statement and eight planning themes that provide a framework to understand Johnson City’s community characteristics and help the City respond to future trends in a thoughtful way. As the City continues to progress through 2045 and beyond, we can look to the guiding statement and planning themes in this plan to help guide Johnson City’s future.