
K animozhi D | P u P 21165 Master’s in Urban Planning | UERP Studio M’22 | CEPT University Ranchharda - Ranchoddpura TP Scheme F acilitating D evelo P ment in a P eri - urban n o D e

Studio: UP4001 - Urban Expansion and Regeneration Planning Studio
Tutor: Prof Utkarsh Patel
Guidance: Prof Jignesh Mehta, Shikha Patel
“
Majority of the cities in India are growing rapidly due to rapid urbanization. Though many of them prepare macro level plans (Development Plans and Master Plans) to manage future growth, these plans provide only focus on overall zoning, trunk network and broad framework for development. These plans, however, remain unimplemented without careful micro-level planning in both green field and brown field areas. This Studio focused on developing core competencies in preparing micro level plans for both, greenfield (TPS) and brownfield (LAP) areas, which go beyond conventional approaches, and integrate multi-disciplinary aspects resulting in high quality environment.
I am grateful for the opportunity of being part of this studio which helped me understand the fundamental concepts of working of micro level planning in cities. I would like to sincerely thank our mentor, Prof Jignesh Mehta, tutor for the studio, Prof Utkarsh Patel and teaching associate Ms Shikha Patel for being a guiding light in this entire journey giving timely feedback and being available for discussions whenever needed. Their valuable insights have helped me improve myself in this domain. Besides this, I would like to extend my gratitude to other tutors and TAs of the program who have provided us with timely inputs and feedbacks throughout the journey. Last but not the least, I would like to thank my peers who have helped a lot in understanding new concepts, discussions and supporting each other throughout this journey.
Work contribution: Symbology for Author Group of 4
l ocal P lan - P utrajaya , malaysia

“


Vision of the Local Plan of Putrajaya is “to develop a Federal Government Administrative Center of Malaysia”

Detailed Scheme Layout of Local Plan 7,8,9,10


The objective of this exercise is to understand the area development model in context of the overall urban planning regime, statutory framework, development regulations, financial models and to critically review the same.
Area Development Model - Putrajaya
Levels of Planning in Malaysia
Local Plan Area - 7.68 sq km.

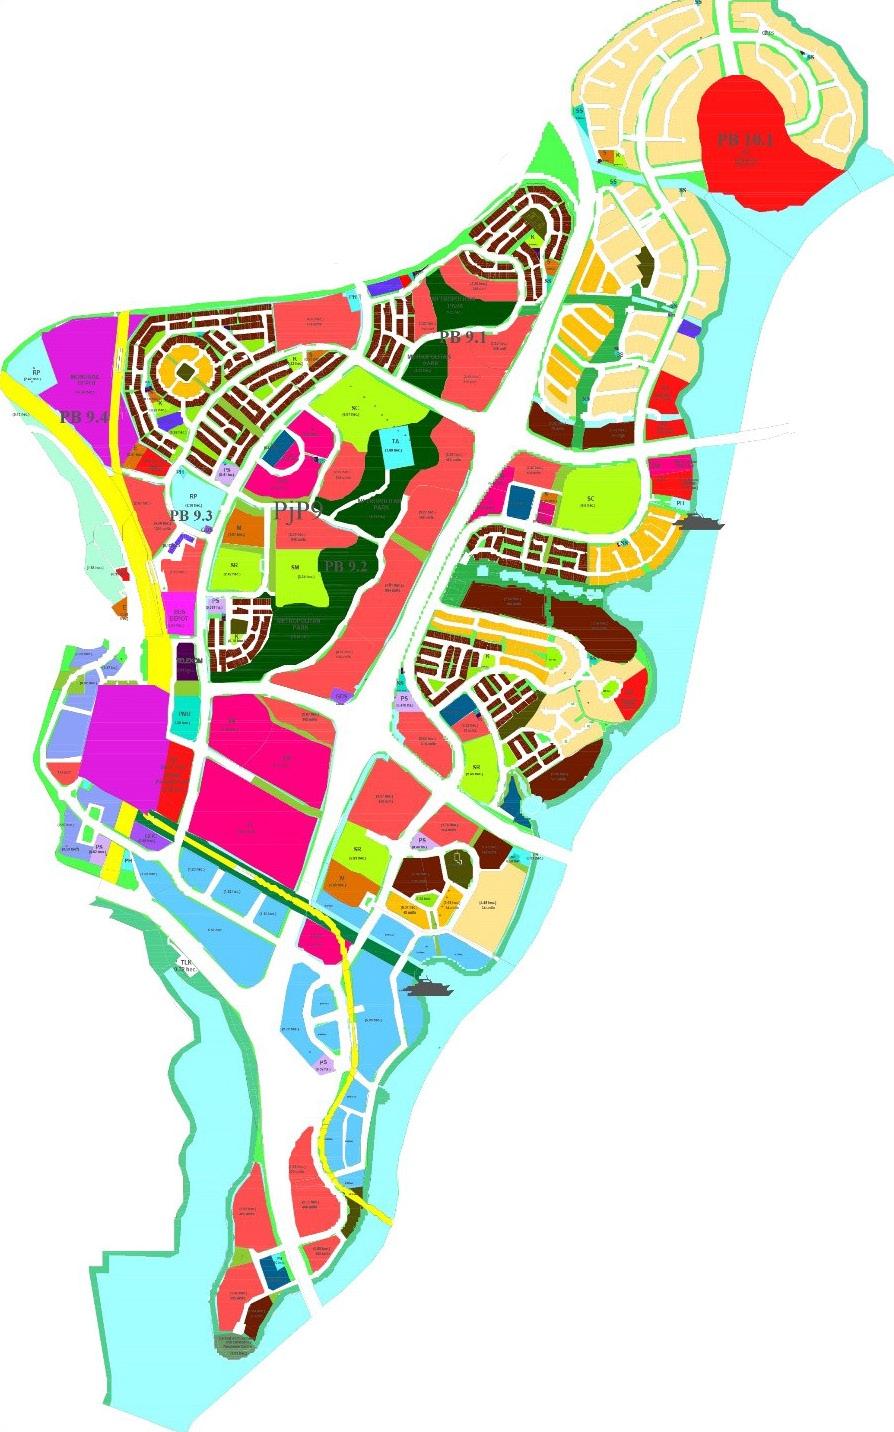
Master Plan Area - 49 sq km.
State Structure Plan Area - 750 sq km.


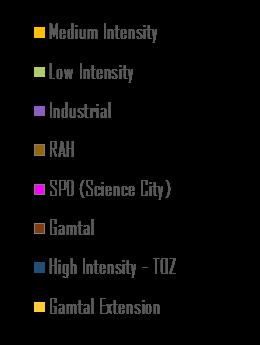
National Physical Plan Area - 3,29,847 sq km. 40 % Open spaces 70:30

Public:Private 13 % Affordable Housing

Duration Activities
National Physical Plan
Provide General Direction for physical/spatial planning and development and use and conservation of land in the country
State Structure Plan
1995 1996
Explains policies and strategies for development sector such as land use, socio economic, environment etc
Approved by the cabinet as the federal administrative center of Malaysia Master plan was based on Garden and Intelligent city concepts and first construction began after 1996
Legal Provisions Institutions involved
A1129 of Act 172 Federal Government
Section 8 12 of Act 172 State Planning Committee(SPC)
Section 6(A) of Act 172
Discussions on Local Plans
Feedback form the public on objectives, aims and area to be proposed in the plan
6 months
District Local Plan
Preparation of Proposed maps and written statement in accordance with policies and proposed state structural plan
Section 12 of Act 172
Perbadanan Putrajaya (Corporation)
Assessment rates
Licenses and permits Rentals Parking charges, planning fees, compounds, fines and interests.

1 month 6 months
Local public exhibition and enquiry of the proposed plan
Approving of Draft Local Plan with amendments after presenting to the SPC
Gazetting of Draft Local Plan
Adoption of local area plan is published in local newspapers
Section 13 & 14 Section 15 of Act 172
Section 16 of Act 172
Implementation of the Local Plan
Loans (from higher government / financial institution) Annual Equalization Grant
Launching Grant Development Project Grant Road Maintenance Grant Balancing Grant
Comparing local plan strategy of Putrajaya with Town Planning schme of Koba, Gandhinagar as both are planned selfsufficient capital cities with large institutions and public land, shows that the scheme areas are designed as supporting residential neighborhood for the capital in both cases, yet Gandhinagar has much more flexibility in terms of regulations and permissible uses and has good street network. The Putrajaya corporation is solely responsible for preparation, sanction and implementation of the plan whereas the state government sanctions the plan in case of Gandhinagar. Koba TP scheme is a tool for appropriation of land for development on contrary Putrajaya’s local plan is just to implement the master plan as sub-divided precincts as land is already acquired by the Government by fair market compensation.


As per the Demand analysis, Affordable housing and apartments are the predominant typologies indicating around 90%100% occupancy. Recent luxurious projects with 2 and 3 BHKs are also in greater demand. Occupancy rate of commercial units are very much lesser even in completed projects
Residential - Luxury apartments Commercial - Office & shopfronts

Rs. 56,57,33,208 Rs. 34,85,20,368 Rs. 83,92,50,000 Rs. 45,66,20,000 Rs. 60,67,20,000 48 % 31 % 56 %
To Client: Though the commercial project promises higher returns, the current occupancy rate is around 50% indicating lesser demand hence this will make the project less viable. Hence, it would be profitable for the developer to go with Scenario 1 – Residential affordable units with commercial in ground floor, considering both the market demand and profit analysis. Also, considering the low Jantri rate in the area, this area can be a potential TDR receiving zone, which the developer can utilize to make the project more viable by using additional floor space.
To AUDA: The affordable zone is not affordable for a middle class family as the unit prices are very high in the area. This mid segment housing stock could be addressed by incentivising the developers through additional FSI and also increasing the base FSI , so that the price of the units would come down due to increase in supply. Introducing changes in DCR such as Green FSI to incentivise sustainable development and dedicated mixeduse zone to promote more mixed-use development with zone specific regulations could be considered.

a hme D aba D - s tu D y a rea ( s hilaj - b ha D aj )
Ahmedabad , the largest city in Gujarat, having strategic connections to different economic centres in the country as well as the state

TP Schemes are prepared under section 48 of the ‘GUJARAT TOWN PLANNING AND URBAN DEVELOPMENT ACT, 1976’
Strengths & Opportunities
Growth magnets Kalol & Sanand
Presence of single cropped land for future urbanisation

Falls within DMIC Influence corridor
Proximity to major SIRs
Setting the context - Ahmedabad
Overall, both AMC and AUDA has prepared 359 TP schemes in Ahmedabad.

Status of TP schemes 40-41 42-49 50-67 73-82
Mehemdabad
Valid sections in GTPUDA
Declaration of Intention Draft stage

Preliminary & Final stage Valuation
Presence of Industrial Nodes


New business districts along SG highway
The study area of Shilaj-Bhadaj is located in the high potential peri urban context of AMC and AUDA and forming an epicenter along the central spine connecting to the city center.


Major job center, Santej Industrial center
Two ring roads & unali canal as initial edges


TowardsThol
34 Sq. km.
High potential land based on ESA and NA conversions
TowardsRajkot
Strengths, Issues & Opportunities

Strengths:
• Ring roads
• DFC corridor and sanand station
• Housing demand in Bopal
• Single cropped agricultural land • Employment centers
• Science city • Diverse land uses
TowardsGandhinagar
34 sq km. Masterplan area

Consists of 8 villages of AUDA
Existing TP area for contiguous growth
TowardsThaltej
Central spine Shilaj road as lower boundary
Opportunities: • Logistics zone
Influx of population from rural • Rejuvenation of green-blue • Promote NMT & Walkability • Santej & Khatraj • Opportunity for MRTS routes
Issues: • Dependency on local roads • Less accessible green spaces • Mixing of regional & local traffic • Lakes as dumping sites • No PT, IPT or NMT provisions • Lack of public amenities

Existing land use shows 71% area as vacant but zoned as agriculture and only 4% built up which are predominantly party plots and weekend homes & villas.
The master plan area has 2 canals, 2 lakes and 24 revenue ponds . Overall 28 Ha of area is under greens. Slope of the area is from north east to south west.

Rural – urban interface and strategic location

Considering development impetus of the two ring roads

Connecting major job centres

Conserving & preserving natural features
Combining all our individual concepts and considerations, the key objectives for the master plan area was derived.
As per AUDA DP 2021 the master plan area falls under 7 types of zones out of which only 30% of the land is urbansiable including major reservation for science city.


Existing street density is 1.86km/sq km which is less than the city average which is 5 km/sqkm and there is only AMTS connectivity within the site.


Also, a total of 17 TP schemes in draft & preliminary stages exists in the master plan area covering a total of 40% of the area.

Work
Live
Commute
‘Facilitating Peri-Urban Development with improved standard of living, co-existence of rural & urban activities in a social space with institutions, diverse land uses & heterogeneity of economic interest ’


c once P t - o bjectives - P ro P osals


To promote development inclusive of all demographic, social and economic groups
To enhance existing development through enhanced connectivity, access to infrastructure, economy and housing


To develop Shilaj - Bhadaj as a peri-urban node, integrating urban and rural growth
Extension of Science city road and possibility of BRTS extension increases the potential of this area to high intensity.
To ensure environmentally sustainable growth

Supports periurban transition and freight priority due to proximity to Sanand DFC station

Recent hike in land prices, presence of Gamtals and other organic settlements & recent development favors potential for low density Metro corridor and station area shows a potential for high intensity commercial development and TODness.


Proximity to Khatraj industrial area and MSMEs and manufacturing plants in Santej makes this area potential for industrial and supporting infrastructure.
Urban Character around the Gamtal area is clearly distinct and has a potential to grow into higher intensity zone.


Science city
Absence of micro planning mechanism leading to unregulated growth
Potential for high dense mixed use, commercial and office spaces.
Based on the stakeholder consultations, existing development and site visits , activity mapping was drafted which is a base skeleton for further zoning and road network proposals.
Presence of micro planning mechanism allowed for a regulated growth in both the cases


Enhance Inclusive Sustainable
Peri Urban
Enhancing the development of Shilaj - Bhadaj as an inclusive and sustainable periurban node
Peri Urban Inclusive Sustainable Enhanced Development
Augment urban rural connectivity: Connectivity, Mobility, Accessibility
Optimum utilization of land to ensure land affordability
Facilitate creation of diverse job centres
Support job centres with complementary and ancillary uses
Incentivize affordable housing
Development catering to all age groups
Safe, walkable, universally accessible streets and public realm
Equitable access to public resources
Ensure permeability along major streets through greater mixing of uses
Integrate informal activities
Eco sensitive buffers around existing lakes
Creation of hierarchy of recreational green spaces
Maintain per capita green space according to standards
Reuse wastewater through tertiary, decentralized treatment
Improve existing road network through strengthening and widening
Resolve junctions with traffic congestion
Meet social and physical infrastructure gaps
Extend MRTS and BRTS connectivity
ROAD NETWORK ZONING GDCR SPECIAL PROJECTS
A broad strategies matrix was formulated which summarises the implementation process to achieve our objectives in the master plan.
The vision of AUDA is compact development along the major transects such as radials whereas remaining area is of low intensity to phase out.
mr. a m jagani Town Planner - AUDA
On a broad level the road network was evolved taking into account some of the critical considerations such as contour and natural features and some constraints in the area such as existing settlements.


Maintain Ridge points and contiguous stream order to align our basic grid 01
Existing radials and proposals parallel to ring roads
Integrate proposed Blue – Green network and consider eco-sensitive areas

Extend existing PT network and enhancing the IPT network
Resolve & Realign Complex junctions and organic roads & consider existing builtform
Integrate Gamtal and existing TP roads
Promote walkability through suitable blocks and robust pedestrian network
Road network was proposed by integrating all existing roads and features, DP proposed roads, proposing new rings and radials & extending the radials to form Superblocks and primary road grid with an average block size of 1000m by 800 m.


Potential to extend BRTS on Krishna mandir road and MRTS on Shilaj road was identified. AMTS was further added as a feeder system to enhance connectivity.
Circulation of traffic regional & intra masterplan area freight priority corridors from DFC to Santej and Khatraj has


Master plan includes other projects such as physical infrastructure, EV charging stations, sports complex, rural haat, canalfront etc. Total appropriation of all proposals sums up to 29% including 16% for roads excluding SEWS Housing and Sale Component.


D elineation - P hasing - a nalysis
The TP schemes have been delineated on the basis of average size (2 - 4 Ha) and various other significant factors .
DP roads & master plan proposals implementation
TP Scheme Boundary Delineation
Omitting existing TP scheme areas Implement special purpose projects
Considering market pressure & existing barriers
To implement the Multi modal node development and also facilitate the BRTS corridor.
329 Ha | 1.7 Lakh
To facilitate the peri-urban development along the outer ring road and implement its special projects.
330 Ha | 1.5 Lakh
To implement the Metro rail corridor and to facilitate the TOD development in the area.
350 Ha | 0.7 Lakh
TP Scheme Phasing
To promote the development due to science city and BRTS corridor.
424 Ha | 1 Lakh
To improve the infrastructure and integrate the old settlements and realise the special project of Green district .
354 Ha | 0.9 Lakh
To facilitate the market demand and immediate development pressure in the Shilaj area.

290 Ha | 0.6 Lakh
To facilitate the growth that has already started in the area which is of utmost priority and support the development pressure along the SP Ring road .
TP Scheme - Analysis
To facilitate the implementation of 90m ring road and other important periurban projects that will serve both rural and urban areas.
I Phase II Phase III
To implement the future extension of Metro rail corridor and to facilitate the TOD development in the area.
Based on the potential to explore implementation of different projects and land use zones in peri-urban context , TP 05 was chosen to be detailed out further in the studio exercise

To facilitate the peri-urban development along the outer ring road and implement certain special projects promoting urban rural integration and inclusivity.
Implementation of road network to increase connectivity, walkability, resolve congestion points

Facilitation of development in medium intensity, low intensity and affordable residential zones
Development of canal front as a regional green integrating the urban and rural population
Zoning (R2, R3, RAH)
NA conversions
Specified block sizes
Summary of Master plan proposals
Eco-sensitive buffers
Regional connectivity
Layers of Analysis
PT & NMT infrastructure
Central public node

Government land holdings
Current Land Use Plot area
Land Value
Topography
Residential Mix Commercial Mix
(Estimated through demand-supply method)
1.5 Lakh 20000
21% of Land parcels are under NA plots.
8% of the land is government land predominantly Gram panchayats and Sardar Sarovar Narmada Corporation.
Predominantly agricultural zoned with vacant plots and remaining with farmhouses and party plots.
Majority of the plots >1000 sq m
Average Jantri rate 2400 Rs/sq m
Average slope is 1:67 North east to South west
These plot level analysis identifies parcels that are non-deductible and that can generate large deductions to facilitate provision of large scale infrastructure.
a PP ro P riation - r econstitution


The appropriation principles have been derived from our 4 key concepts of the masterplan vision and URDPFI guidelines and other standards have been referred for the location & scale.


Roads Total Gross Appropriation
Non-Deductable Land Parcels Gauchar Panjarpole Water bodies R2 plots <200 sqm =


Reservations & Appropriations 59.53 Ha 113.34 Ha 113.34 Ha
3.36 Ha 16.8 Ha 13.45 Ha 20.20 Ha

% 1 % 5 % 34 % 35 % 4 % 6 %
Crematorium R3 plots <1000 sqm Net appropriation % is comparatively lesser than conventional practice in AUDA(40%) and as mentioned in GTPUDA(50%) . In this scheme, there is an increase in appropriation for greens and decrease in appropriation of SEWS Housing .
13 Ha
Total Net Appropriation
Non Deductible Area Gross TP Area - 336.3 Ha Net TP Area - 323.2 Ha


SEWS Housing Greens Physical & Social Amenities Sale Component To ensure self-financing mechanism , the cost of infrastructure is balanced by the sale of reserved plots considered using inflated jantri rates.
Area as per zone


Minimum Plot size to be maintained.Block sizes derived based on Master Plan concept.
Provide FP in Buildable zone.
Access via road should be provided to all plots. Walkable blocks of 250 x 250 m

Zone 1

Road
Zone 2
L:B ratio to be maintained 1:2. Attempt should be made to provide rectangular plots.

L-shaped or irregular-shaped FPs are not to be provided.
Reconstitution - Initial survey & base map preparation
Base Survey Map Original Plot Map
Ranchhodpura
For FP falling in 2 zones, division and appropriation to be done proportionately.
All FPs to be provided on the location of OPs.
Ranchhodpura
Existing buildings should be conserved while reconstituting and their access points should not blocked
Mock Owner’s Meeting - 04.11.2022
A mock owners meeting was conducted to r eview and highlight issues in the first draft of reconstitution . Different stakeholders have different concerns.

Land Owner
Villages : Ranchhodpura & Ranchharda
Survey data : Village panchayat, 7/12 (anyROR)
Total survey plots : 571
Survey Numbers which were spatially adjacent and has same owner & tenure and in same village have been combined and given single O.P. number
Total original plots : 538
State & Local Govt. Developer NGO workers
Location of FP Adherence to Act Sale component & DCRs
SEWS housing & greens
r
econstitution - v isualization
Final Reconstitution Special Projects
Category Area (Ha) % Area
Final Plots 17219.72 51.2
Roads 68.24 20.3
Sale for Commercial 11.7 3.5
Sale for Residential 8.8 2.6
Parks/Gardens 16.3 4.9
Social & Physical Amenities 13.3 4.0
SEWS Housing 4.53 1.4
Water Bodies 40.6 12.1

Total final plots : 628
Reservations have been consolidated to create a public node around which l arge scale public amenities are concentrated to create a vibrant continuous public realm. Maximising potential through equitable access from c ommercial sale component and SEWS housing .


Canal Front acts as a community level green forming a vibrant and permeable interface between urban and rural


v aluation & c osting
Valuation
Redistribution & Valuation statement
Value of the plot in its inherent state
OP value= OP area x OP rate
OP Rate : Escalated Jantri ( 6% annual inflation)
Value of the reconstituted plot in undeveloped state
SF value= FP area x SF rate
SF Rate : OP rate(FP over OP) weighted avg. of OP rate (displaced FPs)


Reconstituted plot value in developed state
FP value= FP area x FP rate
Infrastructure costing

(The Rates have been taken from the stakeholder consultation with AUDA officials with reference to the recent TP Scheme in Manipur DTPS-314 )
Roads - 67.07 Cr.
Transport Trunk Trunk
Street lights - 11.21 Cr.
Footpath - 30.05 Cr.
NMT infrastructure - 6.00 Cr.
Water supply - 10.18 Cr.
Sewerage - 10.18 Cr.
Storm water - 25.29 Cr.
Canal, Lakefront, Greens20.66 Cr.
AMTS stations - 0.9 Cr.
Public toilets - 19.5 Cr.
Drinking water kiosks - 0.4 Cr.
FP Rate : (SF rate + Scheme rate) x Increment Factors 0.7 Cr.
Compensation is calculated as the amount to be paid to the landowner for the land appropriated by the authority & Increment is the amount to be paid by the landowner for the development they are getting from the authority. Here the FP value is increasing more than twice the OP value.
Compensation cost
(Expenses shown in Col. 11 of Form F)
224 Cr.
Total infrastructure cost
5 Cr.
Misc. costs
(Cost of legal proceedings, publications, salaries etc.)

324 Cr. 553 Cr.
Total Scheme cost
(For total developable area including saleable plots)


Scheme Rate per sqm

Analysis for fixing increments
2.7 times 2.2 times 2.4 times 2.7 times
1.0 x Developability 25% Location & Proximity 10% Right of Way 20% Approach 20%
(maximum of the 3 methods)
Bridges/subways School, community hall, crematorium
Lower than minimum plot size / irregular shape / irregular proportion Proximity to SEWS Fire & police station
Developable 9m 1 sided R3 - 0.3 12m 2 sided R2 - 1.8 18 - 36m 3 sided RAH - 2.7 36 - 40m 4 sided
AMTS/NMT lanes/ Neighbourhood green Social amenities (community hall, market etc)
Analysis of Unali TPS Jantri rate NA v/s A Market Rate Analysis 2.7 x
Saleable plots Greens, canal, lakefront
Increment Factors - Cases
Highest Increment2.7
The plot 177/1 has the highest increment due to proximity to canal front, higher ROW abutting road and three sided access.
Lowest Increment1.0
Plot 215, which is non-developable (small plot size), adjacent to SEWS Housing, abutting 9m road has the lowest increment factor.


Scenario 2 Scenario 1
Incremental Method
FP Rate : (SF rate + Scheme rate) x Increment Factors
Total Increment 1644 Cr. Contribution 33% 543 Cr.
Scheme Cost
Non - Incremental Method
FP Rate : (SF rate + Scheme rate)
Total Increment 676 Cr. Contribution 50% 338 Cr.
Net Cost of Scheme to the appropriate authority 10.27 Cr. Net Cost of Scheme to the appropriate authority 215.2 Cr.
If increment factors are not considered then the authority would end up spending about 20 times the cost (even after 50% contribution) in case of incremental method which makes this method more equitable for plot owners and less burden to the authority. - Abstract sheet for all the Finance of the TP scheme Form G
FORM G (Rule 21)
1 Expenses under the provision of infrastructure under section 40(3) (b), (c), (d), (f), (g) and (h) 224 Cr. 2 Other expenses of Authority
3 Expenses shown in the redistribution and valuation statement (Total of column 11 of Form F) 324 Cr.
4 Cost of publication number section 41(2) and under section 42(1) or (2) Rules 16 to 18 5 Cr.
5 Compensation for affected construction under section 49(2), Legal Expenses under section 77(1) (e) and compensation under section 82
6 Cost of demarcation, salaries of town planning officer and board of appeal and staff and other expenses under section 61(2)
(A) Total (Cost of Scheme) u/s 77, GTPUDA 552.9 Cr.
7 Total of increments (Total of column 12 of F form) 1645 Cr.
(B) Proportion of increment to be contributed by each holder (section 79) (33% of total of Column 13 of F form) 542.7 Cr.
Net cost of scheme to the appropriate authority = (A) (B) 10.27 Cr.
NOTE: THE NET COST OF THE SCHEME TO THE AUTHORITY IS PROPOSED TO BE MET BY SALE OF FINAL PLOTS ALLOTTED TO THE AUTHORITY FOR SALE FOR RESIDENTIAL OR COMMERCIAL USE IN THE SCHEME.
TP Scheme - Revenue Mechanism
Contribution of the land owner towards the total cost is decided based on the net expense to the authority making sure that the authority doesn’t receive any profit from the scheme.
• Premium FSI
• Betterment Charges
• Sale of Reserved Plots
• Advertisement Charges
• Parking Fees
• Lease & Rents
• Private-Public partnership
• CSR funds
• State level Projects
• Jal Jeevan mission
• Grants from other bodies (NHAI, Sardar sarovar etc.)
221 Cr. 324 Cr. 909 Cr.
Betterment charges
Contribution paid : 33% of Total Increment
Premium FSI Sale of plots
Purchasable FSI: Medium Intensity: 0.6, RAH: 0.9
Total Area of sale plots: 20.2 Ha Market value: Rs. 45000/sqm
• Banks
• Municipal Bonds
• Multi-Lateral Financial Institutions
• Land Mortages

assuming a full built scenario has been calculated and the remaining funds will be sourced from other partnerships
Development Scenario ( 50% development by 10th year +15% premium sold) & 7 years for laying infrastructure - Based on market study
Phase I (0-2 years) Phase II (2-5 years) Phase III (5-7 years)

Capital funding : Up to 40% of total cost as loans 90 Cr. + Corpus Funds +
Government Grants (Jal Jeevan Mission, Swatch Bharat Mission) &
Mortgage of land 10% of sale component (Borrowings up to 50% of the market value of the property)
45.45 Cr
Total funding raised for development under Phase 1 135.45 Cr.
Surplus post Phase 1 : (135.45 52.4) 83.05 Cr. +
Government Grants (Jal Jeevan Mission, Swatch Bharat Mission) &
Betterment charges (5%) 11 Cr. &
Sale of premium FSI (1%) 3.24 Cr. +
Mortgage of land 5% of sale component 22.7 Cr.
Total funding raised for development under Phase 2: 119.99 Cr.
Total expense
Surplus post Phase 2: (119.99 107.11) 12.88 Cr. +
Betterment charges (30%) 63 Cr
Sale of premium FSI (5%) 16 Cr.
Total funding raised for development under for Phase 3: 91.88 Cr.
The funds for each of the phase has been adjusted either through grants and loans or through self finance models and the surplus is passed on to the next phase. Final surplus can be used to repay the loans along with the profits from the saleable plots
T P Scheme mechanism is increases the revenue of the authority and acts as a temporary asset builder. Increases development in a phased manner.
T P Scheme mechanism increases the land value of the owners giving them developable plots with all the amenities nearby with minimal betterment charge.
TP scheme is an effective tool as a micro planning mechanism as it is fair, inclusive and transparent also equitable when compared to land acquistion.
t eam W or K s ta K ehol D er e x P osure

Stakeholders from various institutions and backgrounds have been consulted constantly throughout the process for an efficient and reliable inputs related to the market demand.
One of the best learning from team work is to know to derive each person’s skills and put that into use to form the best possible outcomes. Learning new softwares from peers and exchange of knowledge was key.
T P Scheme mechanism provides city and regional infrastructure while controlling urban sprawl and provides sustainable development by preserving natural resources.
s el F F inancing t ool
It is an effective fiscal tool for value capture and the nature of being it self financing model makes it more feasible and might suit most of the cities. Infrastructure preceding development is also crucial for its success.
T P Scheme mechanism is a tool to prepare and implement a detailed plan for a smaller area under the development authority in such a way that it remains consistent with the provisions of the overall development plan prepared for the urban area..
l earning F rom e x P erts
Apart from the studio process, there were insightful learning sessions from different guests throughout the module and individual exercises that is helpful in instilling our unique expertise.
P

Starting from macro planning in DP studio to exploring micro planning mechanisms in this studio closed this loop. Analysis of existing situation, regional level and also starting with master plan proposals before deriving TP scheme proposals makes the process much more robust.
u er P s tu D io m ’ 22 | c e P t u niversity