HOME MATTERS 2021 SECTION THREE:
Challenges for Renters Over 70% of Florida’s low-income renter households are cost-burdened, and 45% of low-income renters are severely cost-burdened 29. As Section 2 demonstrates, severe cost-burden is especially widespread among very low-income renter households (those with incomes between 30% and 50% AMI). Moreover, the share of renters between 30% and 80% AMI that are severely cost-burdened has increased dramatically since 2005 (see Table 1). This section dives into further detail about specific factors that drive high housing cost burdens among low-income renters.
Mismatch Between Rents and Wages As Table 4 shows, jobs with low wages and low to medium skill levels are prevalent in Florida. To determine the wages needed to afford rental housing in different regions, the National Low-Income Housing Coalition (NLIHC) calculates a “housing wage”—the minimum hourly wage required to afford housing at Fair Market Rent (FMR). A metro area’s FMR, calculated annually by HUD, is usually equal to the 40th percentile of combined rent and utility costs for all units with a given number of bedrooms — somewhat less expensive than a medianpriced unit. Figure 7 compares median wages for common occupations to the “housing wage” for the 1-bedroom and 2-bedroom FMRs in the Tampa-St. PetersburgClearwater metropolitan area, the Deltona-Daytona Beach-Ormond Beach metropolitan areas, and the Ocala metropolitan division. For cashiers, waitresses, janitors, and other low-wage workers that support the economy and quality of life in these regions, paying for rental housing can be a struggle. Only in Ocala do any of the ten occupations shown have a median wage sufficient to afford even a 1-bedroom apartment. Nowhere can the median wage for these common occupations pay for a two-bedroom unit without being cost-burdened. Of the three metro areas, the mismatch between rents and wages is most pronounced in the Tampa Bay area, where, even with overall higher wages, some median wages 12
THE FLORIDA HOUSING COALITION | FLHOUSING.ORG
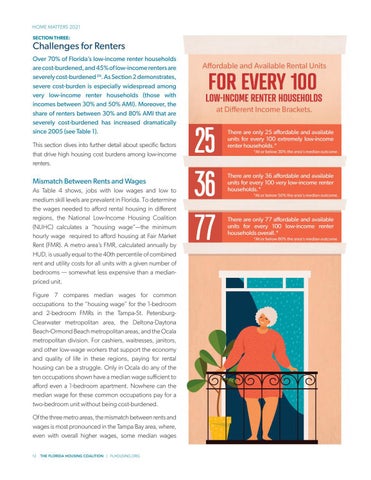
25 36 77
There are only 25 affordable and available units for every 100 extremely low-income renter households.*
*At or below 30% the area's median outcome.
There are only 36 affordable and available very low income renter units for every 100 very low-income households.*
*At or below 50% the area's median outcome.
There are only 77 affordable and available units for every 100 low-income renter households overall.*
*At or below 80% the area's median outcome.


