4 minute read
Tight Markets for Low-Income Buyers


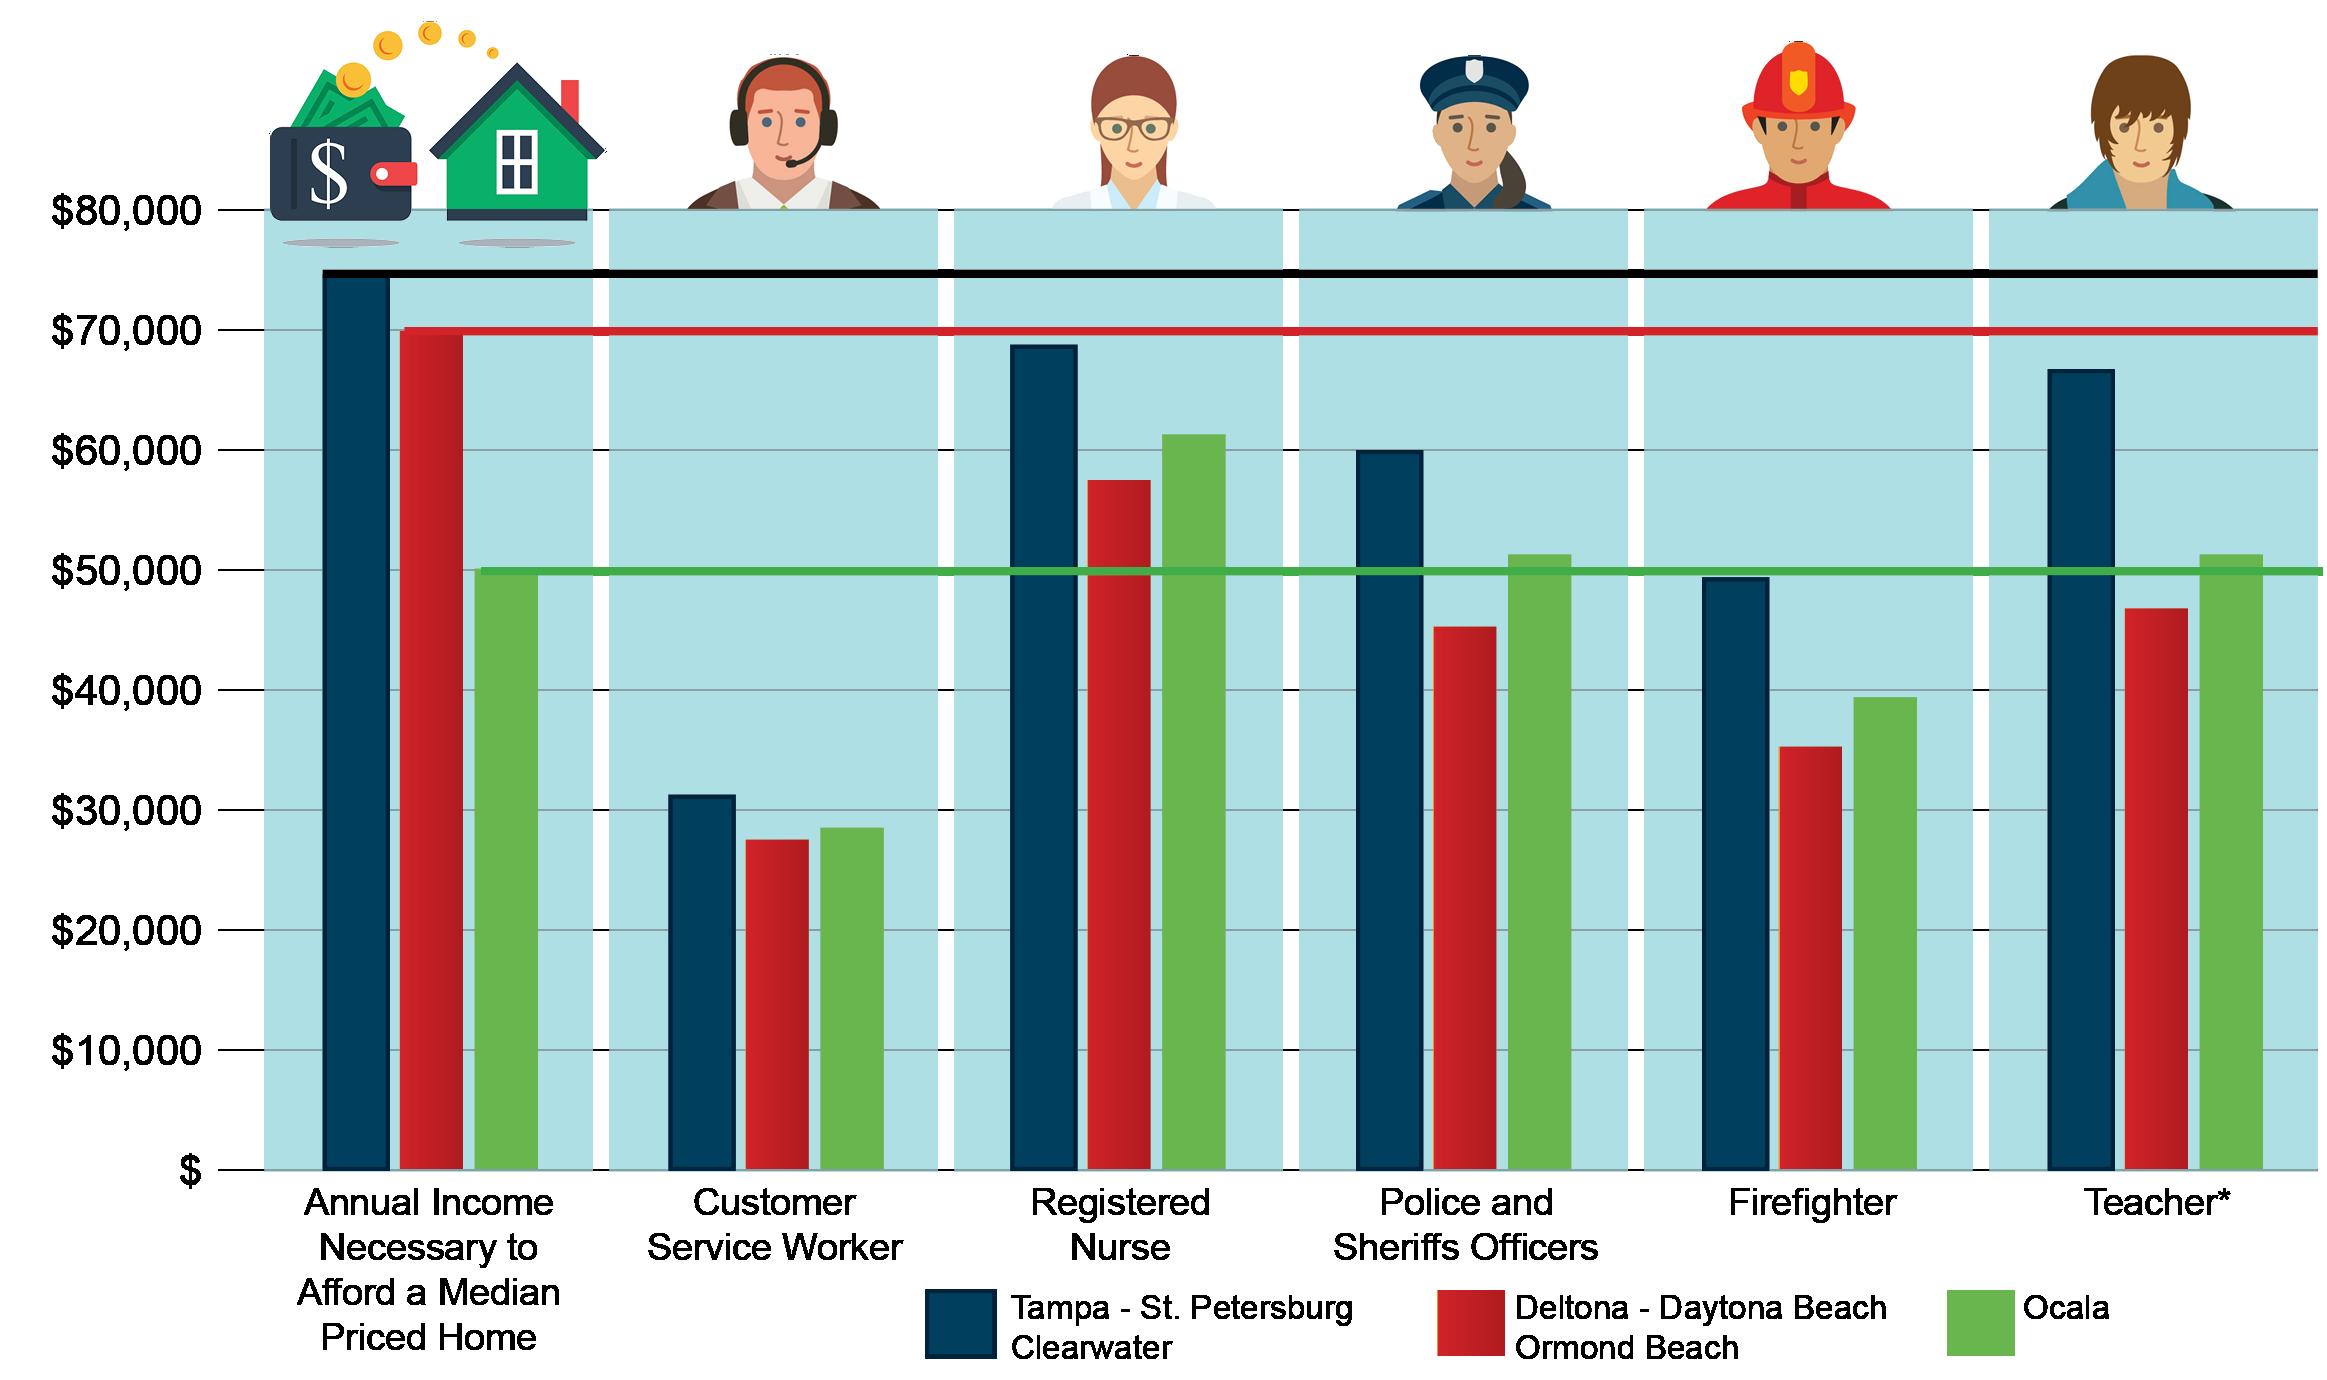
Ownership Costs Exceed Wages for Many Occupations
Even in metro areas with relatively low home sale prices, homeownership can be out of reach for many workers that provide essential services, including police officers, firefighters, and nurses. For Figure 7, we calculated the minimum annual income needed to afford a median-priced home in the Tampa-St. Petersburg-Clearwater metropolitan area, the Deltona-Daytona Beach-Ormond Beach metropolitan area, and the Ocala metropolitan division. Only in Ocala is the median income for any of these common, essential occupations high enough to afford a median-priced home. Even in Ocala, firefighters and customer service representatives still make far below the $50,536 necessary to afford a median-priced home without being cost-burdened.
Advertisement
Notably, essential service workers do not always earn higher wages in markets with higher housing costs. For example, customer representatives, police officers, and firefighters in Deltona-Daytona Beach-Ormond Beach make close to the same amount as similar workers in Ocala, even though their housing costs are dramatically higher. Many homebuyer households have two earners who pool incomes to make mortgage payments. However, homeowners are subject to the same income fluctuations as renters resulting from job loss, illness, and other factors. For each of the three markets shown in Figure 9, almost all occupations have a median income that falls far short of the income needed to buy a median-priced home, leaving these workers vulnerable to foreclosure if the homeowner or another earner in the household loses income. For example, if a firefighter and a spouse with a similar income bought a median-priced home in the Tampa Bay area, they would be over $20,000 short of the annual income needed to afford the home if one spouse lost his or her job.
Rising Home Prices
Freddie Mac’s House Price Index, published since 1994 and now indexed to December 2000, presents the appreciation of homes by state using a “repeat transaction” methodology. This measures the appreciation of homes in Florida by comparing the price of a home over two or more transactions: essentially, the index measures how much a home sold for
Income Necessary to Afford a Median Home and the Median Incomes of Essential Workers
The assumptions for calculating "housing wages" for median-priced homes were as follows: 1) 30-year fixed rate mortgage at 4.5% interest, 2) FHA-insured with a 3.5% down payment, 3) Front-end ratio of 28% back-end ratio of 43%, 4) All other household debt service is 15% of annual income, 5) Assessed value is 85% of the purchae price, 6) Homestead exemption is $50,000, 7) Mill levy is $19 and, 8) Property insurance is 0.5% of the purchase price annually Additionally, we assume that the homebuyer works 40 hours per week, 50 weeks per year.
Figure 10. Median Income of Selected Occupations Compared to the Income Needed to Afford a Median Priced Home (2019 Q3)
(Source: DEO 2018, National Association of Home Builders 2019.)
compared to the previous time(s) it was sold. Because the home is the same, this allows an easy assessment of how quickly already built homes are appreciating without relying on expensive assessments and in a way that does not factor in newly built homes until they have been sold twice.
Since 2012, home prices in Florida have grown steadily. While growth over the last eight years has been slower than the frenzied build-up that preceded the 2008 Great Recession, it has also gone on far longer. Because of this, home prices are at an all-time high in Florida. Homes peaked at 2.21 times their December 2000 value in 2006, before dropping between 2007 and 2011. Now, homes in Florida are selling for almost 2.5 times their value in 2000. While the COVID-19 pandemic has sent renters scrambling and forced homeowners into forbearance, it has done nothing to slow home prices, which have continued their pre-COVID-19 trend.
Racial Disparities in Homeownership and Housing Instability
In 2020, Black and Hispanic households increasingly bore the burden of COVID-related housing instability that illuminated and exacerbated existing racial housing disparities. According to public opinion polling by Opportunity Starts at Home, 72% of African Americans and 76% of Hispanics expressed concern that they will lose their housing during the pandemic without additional assistance. These concerns come on the heels of a decade in which Black Americans continued to trail whites in overall
homeownership rates. This lack of ownership coupled with the increasing cost of housing has resulted in significant challenges for Black and Hispanic households in Florida: 44% of Blacks and 43% of Hispanics are cost-burdened, compared to 26% of whites. This cost-burdened figure increases to more than half of Blacks and Hispanics when looking solely at renters. This lack of affordable housing exacerbates existing segregation. Due to a legacy of discrimination, black families and families of color have lower net wealth and incomes than white families. The lower net wealth creates large differences in purchasing power, which, in concert with policies and practices in both the public and private sectors, often results in housing for low-income households being sited in areas that perpetuate racial residential segregation. Private-sector discrimination was a direct consequence of a partnership between the federal government and local bankers and real estate brokers and contributed significantly to our residential segregation patterns today. Federal housing policy gave official sanction to discriminatory real estate sales and bank lending practices through the practice of redlining. Through the Home Owners’ Loan Corporation, the Federal Home Loan Bank Board developed Residential Security Maps and Surveys used by brokers and lenders to determine eligibility for mortgages and home loans. The maps divided and ranked areas in American cities from A to D, with corresponding colors, considering factors such as building conditions, amenities and infrastructure, and— most importantly—the neighborhoods’ racial, ethnic, and
Freddie Mac House Price Index
Figure 11. Freddie Mac's House Price Index between 2000 and October 2020

(Source: Freddie Mac)