
Annual report 2022

Reliable and trustworthy
Long-term relationships between customers, Jotun and colleagues
Commitment to Jotun’s values, strategies, policies and decisions
Help and support others
Display trust and empathy
Appraise and judge fairly
Protect internal and external environment

Value differences in people
Be honest and fair
Build diverse teams across culture and gender
Follow laws and regulations
Treat others the way they expect to be treated

glance
Jotun at a
The Jotun Group is a matrix organisation with sales of Decorative Paints and Marine, Protective and Powder Coatings organised into six regions. The company has 40 production facilities in 23 countries, with 67 companies in 46 countries, and is represented in more than 100 countries worldwide.
100 + Countries
DECORATIVE PAINTS 38 %

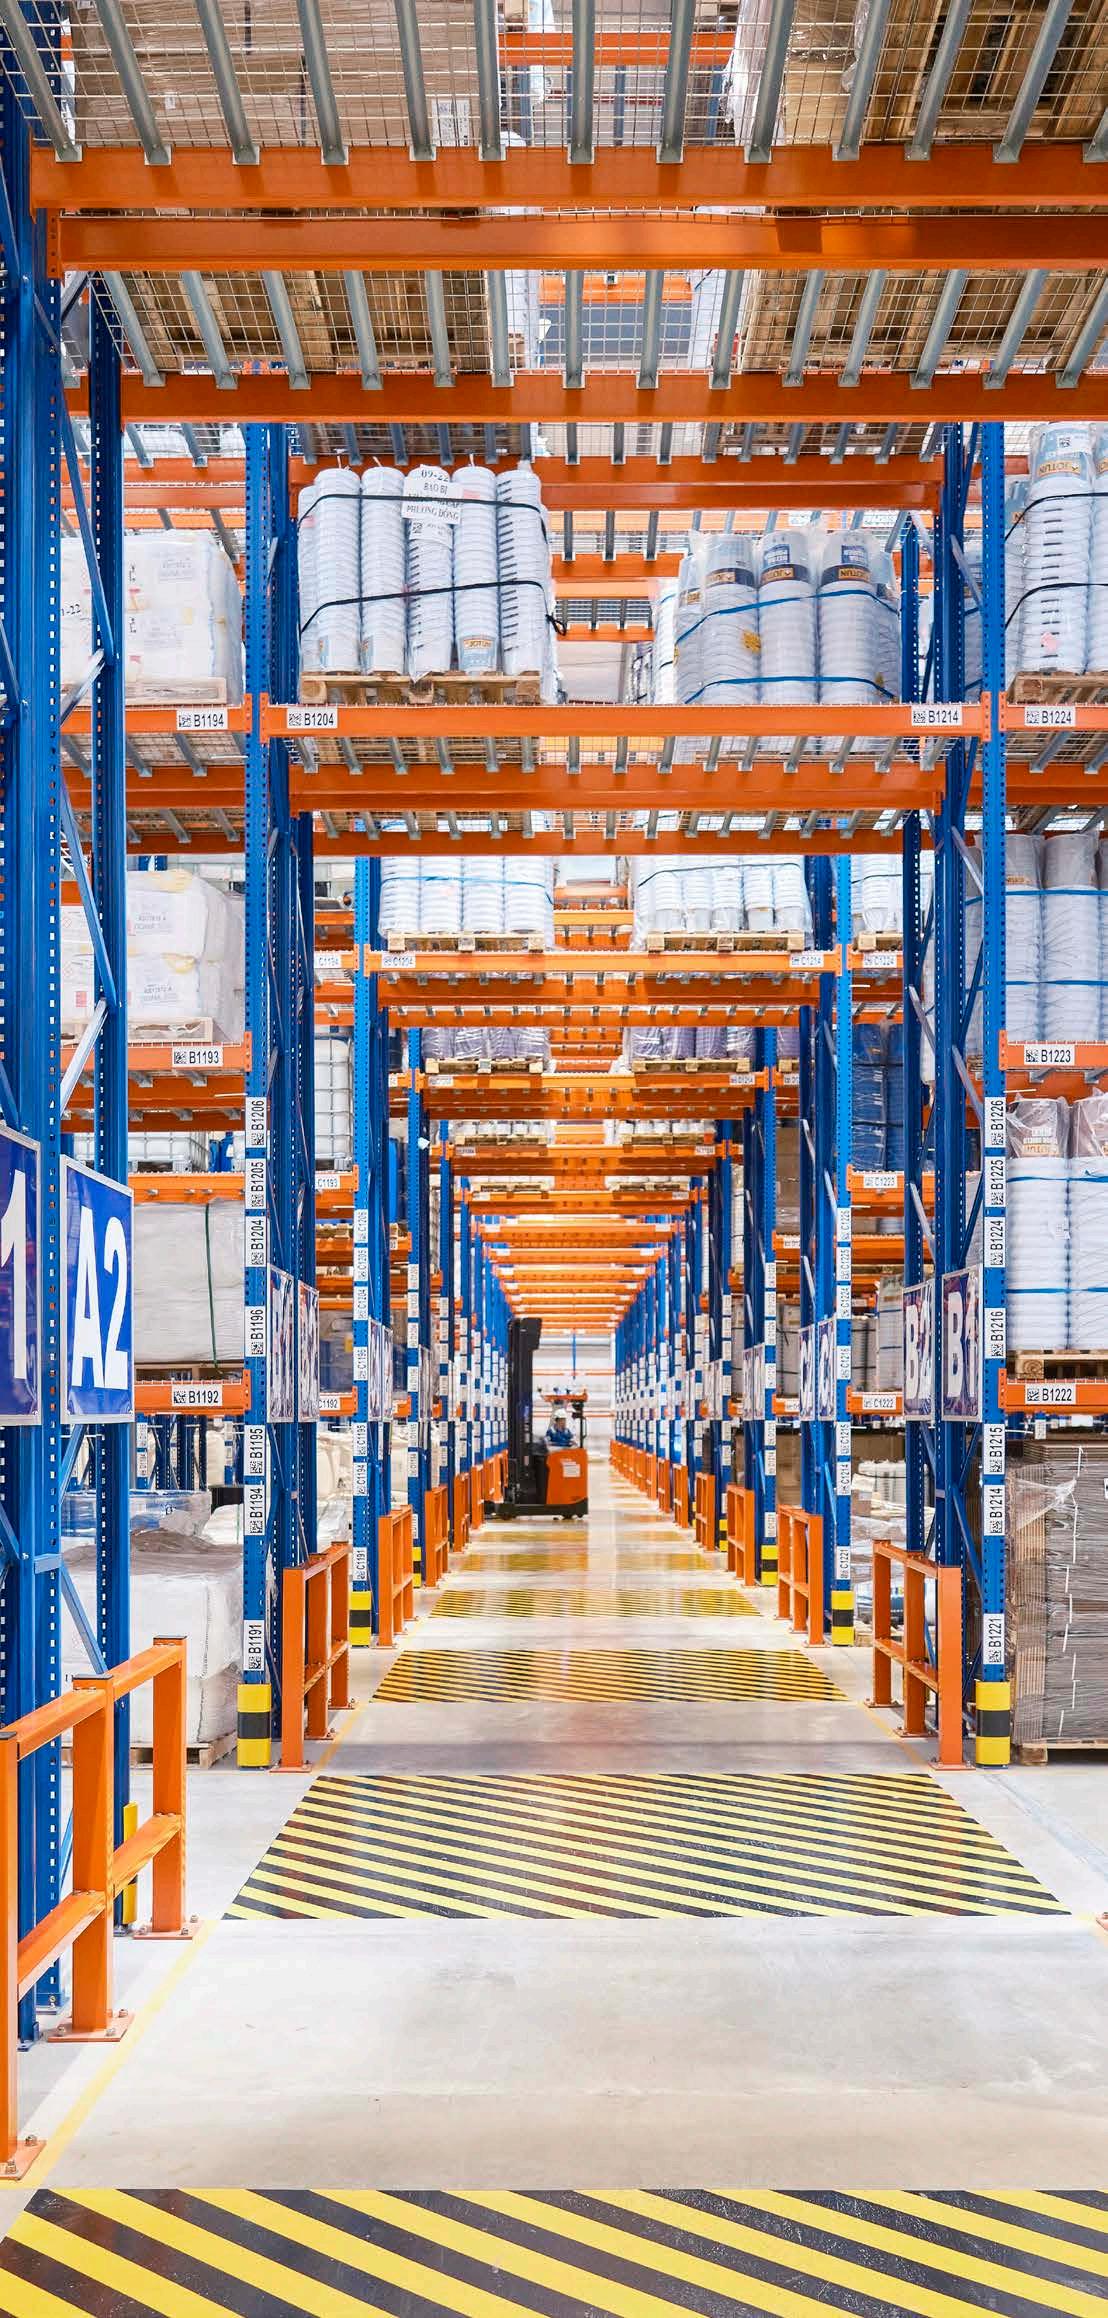
Jotun Decorative is a leading paint supplier to commercial buildings, public buildings and homes, serving both professionals and home owners, directly and through a substantial network of Jotun Multicolor centres.

3 8 % Total sales* per segment
POWDER COATINGS 8 %
Jotun Powder Coatings is a leading supplier to companies active in industries related to building components, general industries, pipelines, appliances and furniture.

27% %72 %8
PROTECTIVE COATINGS 27 %
Jotun is a leading supplier of high quality protective coatings for onand offshore oil and gas facilities, power generation, renewable energy and infrastructure projects, including intumescent coatings, topcoats, high temperature coatings and stateof-the-art, proven anticorrosion protection products.

MARINE COATINGS
27 %
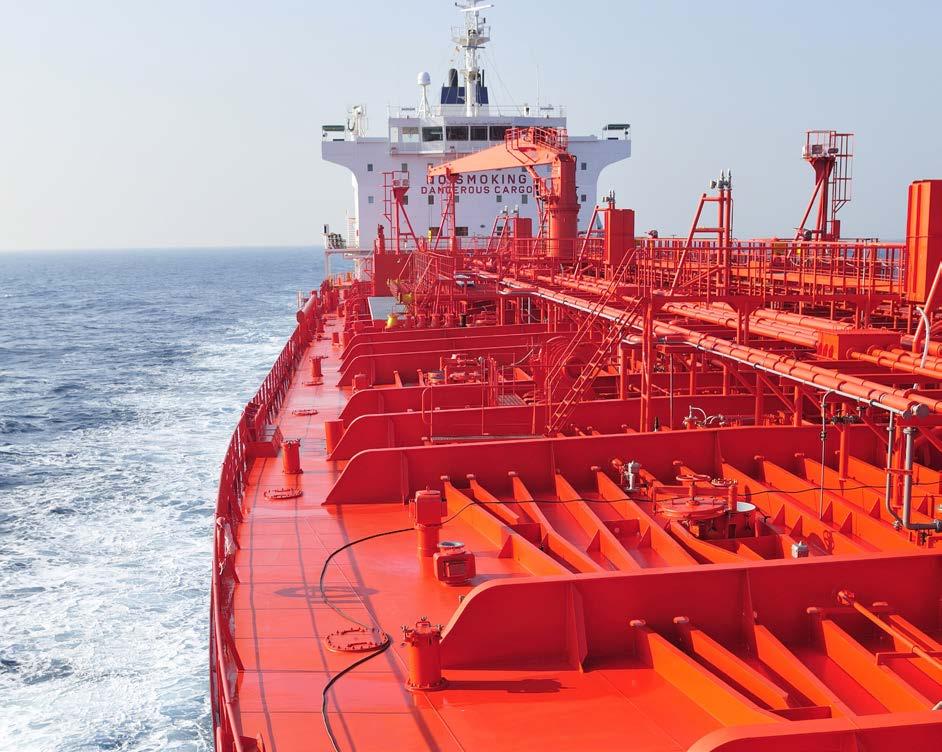
Jotun is the market leader in marine coatings, delivering high performance hull performance solutions, and high quality coatings for newbuilds, drydockings, onboard maintenance, cargo tanks and cargo holds to the global shipping industry. Jotun also supplies premium coatings to mega yachts and leisure yachts.
Jotun’s business principles are grounded in the company’s four values (Loyalty, Care, Respect and Boldness), which are linked to Jotun’s ESG performance. As a leading global provider of quality, long-lasting paints and coatings, Jotun can contribute to the environment and society by building on a long and proud history of taking care of people and the environment.
1972: Jotun establishes an internal environmental protection committee to study styrene vaporisation.
1983: Jotun launches Lady, a long-lasting, high quality waterborne interior paint.


1926: Odd Gleditsch Sr. establishes Jotun A/S with the purchase of the Jotun Kemiske Fabrik A/S (Jotun Chemical Factory).
1939: Jotun establishes a pension fund for employees.
1940-1945: Despite challenging market conditions during World War II, the company retains all staff at Jotun’s factory in Sandefjord. When the factory was idle due to lack of raw materials, Gleditsch offers work on his farm at full pay.


1962: Jotun establishes its first local production outside Norway, in Tripoli, Libya.


1968: Jotun partners with Norwegian entrepreneur Gunnar Myhre to pioneer the development of solventfree powder coatings.
1976: Jotun launches the industry’s first automated, computerised in-shop tinting machine, hence reducing waste and the transportation of finished goods.
1980s: Jotun establishes relationship with Red Cross Norway and the Red Cross Red Crescent Movement. Over the years, Jotun has provided support for victims of natural disasters, diseases and conflicts.

1992: Jotun enters a joint research project with the Norwegian energy giant Statoil (Equinor) to develop its first product Life Cycle Assessment to document the environmental impact of long-lasting coating systems throughout the lifetime of offshore assets.

1996: Jotun contributes to a pilot project to develop ISO 14001, a standard related to environmental management issued by the International Standards Organisation.
1998: Jotun establishes a Global Health, Safety and Environmental (HSE) Standard.
2000: Jotun launches SeaQuantum, a selfpolishing TBT-free antifouling.
2010: Jotun establishes Jotun GreenSteps to improve the environmental footprint.
2015: Jotun launches Green Buildings Solutions, which makes it easier to design, specify and protect “green buildings”.
2020: Jotun launches Jotacote Universal S120, the industry’s first solvent free, single coat universal primer.
2022: Jotun introduces the Penguin CARE programme to provide support for employees raising families or caring for unwell or aging relatives.
2011: Jotun launches Hull Performance Solutions (HPS) to improve hull performance and thereby reduce fuel costs and greenhouse gas emissions.
2008: Jotun launches SENS, an interior decorative paint developed in response to consumer health concerns.

2009: Jotun launches Jotashield Extreme, a heat reflective exterior paint and Cool Shades (2010), a heat-reflective powder coating for architectural elements.

2015: Jotun sponsors its first mine detection dog in cooperation with the NGO Norwegian People’s Aid, to clear landmines and other remnants of war in former conflict zones.

2020: Jotun introduces revolutionary Hull Skating Solutions (HSS), which provides an always-clean hull for the most challenging operations. A clean hull significantly reduces fuel costs, greenhouse gas emissions and the spread of invasive species.
2014: Jotun introduces the I Care programme, an internal campaign to raise HSEQ awareness to improve worker safety and reduce the risk of fires and spills.


2014: Jotun launches Lady Balance to the Scandinavian market which offers a beautiful matt finish with minimal odour, certified by Eurofins Indoor Air Comfort Gold.
2019: Jotun launches Fenomastic Wonderwall Life in the Middle East region. The first UL GreenGuard Gold certified paint product in the region. A longlasting interior paint that has ultra-low VOC, a barely detectable odour and improves indoor air quality with its formaldehyde abatement technology.

2022: Jotun launches HullKeeper as a unique programme enabling optimised hull performance, regardless of the applied coating.
2022: Jotun sets clear and ambitious goals to reduce the total carbon footprint by 50 per cent and achieve 70 per cent of the company’s energy needs from renewable sources by 2030.
2022: Jotun Performance Coatings launches a sustainability roadmap as a structured approach to prove and scientifically document the impact of Jotun products and solutions throughout the lifetime of assets.

2022: Jotun commits to increasing female representation in managerial positions to 30 per cent worldwide and to 40 per cent at Jotun’s headquarters by 2030.
2022: Jotun launches Majestic Sense, a premium low-odour interior paint in South East Asia. Majestic Sense includes Clean Air Technology, an independently tested innovation which can neutralise more than 90 per cent of formaldehyde emissions. Majestic Sense has been listed as a “Sensitive Choice ® product by the National Asthma Council Australia.
In a year characterised by market uncertainties, Jotun’s strong performance is a credit to the quality of the organisation and the company’s history of timely investments in people and assets.
Supply chain disruptions caused by the war in Ukraine, combined with markets still affected by the pandemic, caused high prices for transportation, energy and raw materials, which had a negative impact on Jotun’s profits. Nevertheless, Jotun managed to record steady increases in earnings and sales volume, helping the company to achieve another year of profitable growth. The Board acknowledges the extraordinary efforts of Jotun’s personnel, many of whom worked under challenging circumstances, for their contributions to another successful year.
Jotun’s decisive action to manage prices early in the year to help offset rising raw material costs and the skilful management of challenges in local markets played a critical role in Jotun’s growth in 2022. However, the foundation of Jotun’s success has been built over decades through timely investments in our workforce and production capacity. For example, Jotun’s bold decision to build factories in emerging markets in the 1960s, 1970s and 1980s helped the company establish itself in some high-growth markets at an early stage. Today, Jotun is a leading regional player in South East Asia, the Middle East, Eastern Europe (Türkiye), Scandinavia and, in some segments, North East Asia. Likewise, Jotun’s longterm investments in recruiting and competence
development have not only helped the company retain skilled workers but have also created a strong leadership pipeline.
This investment strategy continues today. Over the past five years, Jotun has financed projects to increase our Research & Development capabilities and production capacity, including three factories completed this year (Qatar, Pakistan and Bangladesh). The Board also approved a framework agreement with Emerson, a global provider of industrial automation software and technology, to standardise processes in Jotun’s factories, worldwide. To attract and retain skilled personnel, Jotun has invested in innovative e-learning tools and introduced new policies that provide enhanced social benefits for employees.

As a global company, Jotun remains sensitive to market trends and will take appropriate action to defend profitability. However, as a privately controlled company, Jotun has the luxury of taking a long-term perspective. The Board recognises that decisions taken today may not pay off immediately, but remains confident that the company‘s core strategy.

Jotun has embarked on an ambitious sustainability journey during which we will evaluate the value chain, up and down, in search of opportunities to improve our impact on the environment and the societies in which we operate.
CHAIRMAN OF THE BOARD
Odd Gleditsch d.y.
Board of Directors, from left: Jannicke Nilsson, Per Kristian Aagaard, Terje Andersen, Odd Gleditsch d.y. (Chairman), Nicolai A. Eger, Camilla Hagen Sørli, Bjørg Engevik Nilsen and Einar Abrahamsen.In 2022, Jotun posted record sales and earnings, despite shocks to the global economy. The company’s strong performance in a year characterised by rising inflation, high raw materials prices and increased costs related to the transportation and production of paints and coatings is a credit to Jotun’s ability to react quickly to changing circumstances. While the war in Ukraine forced the sale of Jotun’s company in Russia, The Board notes that the company celebrated the opening of three new factories (Qatar, Pakistan, Bangladesh) and R&D centre in Dubai. The Board remains committed to Jotun’s long-term strategy and will continue to evaluate further investments in support of Jotun’s growth ambitions.
Jotun’s business activities include the development, production, marketing and sale of paints and coatings systems and related products and services for the treatment, protection and beautification of surfaces.
Jotun is a global company made up of 67 companies in 46 countries, including 40 production facilities. The company extends its reach to other countries through a network of subsidiaries, joint ventures, associated companies, sales offices and distributors. The parent company, Jotun A/S, is headquartered in Sandefjord, Norway. Of the Group’s operating revenue, approximately 10 per cent is related to its activities in Norway, while 90 per cent is related to the rest of the global network.
Jotun’s business is organised into six regions: West Europe and Scandinavia (WESCA), East Europe and Central Asia (EECA), Middle East, India and Africa (MEIA), North East Asia (NEA), South East Asia and Pacific (SEAP) and Americas (AM).
Jotun’s product and service offerings are organised into two units: Decorative Paints and Performance Coatings.
Jotun supplies interior and exterior decorative paints to commercial real estate projects, public infrastructure projects (such as airports, stadiums, hospitals, housing developments, etc.) and homeowners, either directly or indirectly through the company’s global network of dealers.
Jotun is the market leader in marine coatings, delivering high performance hull performance solutions, and high quality coatings for newbuilds, drydockings, onboard maintenance, cargo tanks and cargo holds to the global shipping industry. Jotun also supplies premium coatings to mega yachts and leisure yachts.
Jotun is a leading supplier of high quality protective coatings for on- and offshore oil and gas facilities, power generation, renewable energy and infrastructure projects, including intumescent coatings, topcoats, high temperature coatings and state-of-the-art, proven anticorrosion protection products.
Jotun Powder Coatings is a leading supplier of powder coatings to companies active in industries related to building components, general industries, pipelines, appliances and furniture.
In 2022, the Jotun Group recorded total operating revenue of NOK 27 858 million, which is an increase of 22 per cent compared to 2021 (NOK 22 809 million). Excluding positive currency translation effects, mainly due to a weaker Norwegian krone, underlying revenue growth was 21 per cent.
While Jotun achieved record sales and earnings, the war in Ukraine, combined with the lingering effects of the pandemic, kept transportation
costs and raw material prices high, impacting Jotun’s gross margins. Nevertheless, Jotun recorded strong sales growth in the Decorative Paints segment and the Marine and Protective Coatings segments. Earnings in the Powder Coatings segment did not meet expectations, but the segment did record positive sales growth despite the closure of Jotun’s business in Russia, previously an important market for Jotun.
The Group achieved an operating profit of NOK 3 737 million in 2022 compared to NOK 3 138 million in 2021. Growth in operating profits were supported by higher sales volume, price increases and measures to control operating costs.
Net financial costs increased by NOK 298 million to NOK 546 million, mainly driven by higher interest costs and currency losses. This resulted in a profit before tax of NOK 3 191 compared to NOK 2 890 million in 2021. Jotun’s activities are subject to ordinary company tax in the countries in which the Group operates, and income tax amounted to NOK 1 024 million in 2022. This led to a profit for the year of NOK 2 167 million compared to NOK 2 111 million in 2021.
The parent company, Jotun A/S, achieved a total profit for the year of NOK 1 702 million in 2022, compared to NOK 1 241 million in 2021.
Jotun A/S posted a profit for the year of NOK 1 702 million.
The Board of Directors proposes the following allocation:
Proposed dividend NOK 855 million
Transfer to equity NOK 847 million
Net cash flow from operating activities decreased by NOK 126 million to NOK 1 842 million, as higher earnings were offset by a strong increase in
working capital. The growth in operating working capital is primarily due to a significant increase in customer receivables, driven by the Group’s strong sales growth. In addition, high raw material prices led to an increase in inventory values, which also contributed to the rise in working capital.
At year-end, the Group had a positive cash position of NOK 3 312 million compared to NOK 3 388 million as of 31 December 2021.
The Group continued to invest in production capacity and R&D facilities in 2022, with total investments amounting to NOK 1 280 million compared to NOK 1 363 million in 2021. Investments have mainly been related to investments in new production facilities in Egypt and Indonesia, construction of a new regional headquarter and R&D centre in Dubai and facility upgrades in Norway. In 2022, Jotun opened new factories in Qatar, Pakistan and Bangladesh.
The net interest-bearing debt for the Group was NOK 1 690 million as of 31 December 2022, compared to NOK 1 807 million as of 31 December 2021. The decrease in net interest-bearing debt is primarily driven by a modest decrease in external debt. At year-end, Jotun A/S had NOK 1 900 million in outstanding bonds, of which NOK 600 million was short-term. In addition, Jotun A/S had NOK 272 million in bank debt outstanding, of which NOK 181 million was short-term. External borrowing in the subsidiaries is primarily short-term and through local banks.
Jotun A/S has NOK 1 915 million in long-term credit lines and NOK 600 million in short-term credit lines. This committed funding serves as a strategic reserve for financing of the Group as well as a backstop for shortterm certificate loans. At year- end, these credit lines were unused.
The Group’s equity ratio was 55 per cent at the end of the year compared to 53 per cent in 2021. The Group is in a sound financial position.
In its regular business operations, Jotun is exposed to financial risks relating to customer credit and fluctuations in raw material prices, currency exchange rates, and interest rates. Procedures and guidelines for managing these risks are established in the Jotun’s Treasury Policy. The Group primarily manages financial risks through their normal operations. For example, Jotun can increase prices, to compensate for higher raw material costs and utilise credit management systems to reduce credit risk.
In addition, Jotun A/S hedges currency risk related to net cash flows in foreign currencies using forward contracts, options, and foreign currency loans. Currency risk related to the parent company’s net investments in subsidiaries, associates, and joint ventures, is generally not hedged. Jotun’s procedures and measures are considered satisfactory in relation to the Group’s exposure to financial risks.
In accordance with section 3-3a of the Norwegian Accounting Act, the Board confirms that the Group fulfils the requirements necessary to operate as a going concern, and that the 2022 financial statements have been prepared on the basis of this assumption.
Jotun achieved good sales growth and profitability in the Decorative Paints segment in 2022, driven by an especially strong performance in the Middle East and South East Asia. Jotun also performed well in Türkiye and gained market share in the small but profitable premium market segment in China. In Europe and Scandinavia, the conflict in Ukraine contributed to rising inflation and supply chain disruptions, impacting consumer confidence and slowing growth in the project market.
In 2022, Jotun celebrated the installation of its 10 000th Jotun Multicolor machine, which took place in a shop in Hanoi, Vietnam. While Jotun will continue to expand its distribution network in all markets, the company is also focused on upgrading existing shops to create a better shopping experience for homeowners. Jotun also worked to provide enhanced support for dealers through such initiatives as the Jotun Dealer Profitability Programme and the Jotun Way, a training programme for shop staff.
Jotun’s regional R&D centres continue to play an important role in Jotun’s success in all regions. For example, Jotun launched two premium interior paints in the Middle East and South East Asia. Both are matte paints that are very low odour, easy to clean and help purifying indoor air qualities, but also include features engineered to meet local demand and climate conditions. As in years past, these product launches were supported by the launch of the Global Colour Card Collection, an annual event that helps to position Jotun as a global trendsetter in colour design.
Following a pause in industrial development in many regions last year, high-profile maintenance and construction activity resumed in 2022, resulting in double-digit sales growth for Jotun Protective Coatings. Jotun achieved excellent results in Scandinavia, West Europe and the Middle East, and performed well in South East Asia and North East Asia. The company was also encouraged by positive results derived from its global distribution network, which now exceeds 1 000 dealers worldwide.
Jotun’s ability to provide quality products, valuable specification support and excellent technical service has helped the company become a preferred supplier to a number of highly complex, large-scale infrastructure, oil and gas and energy projects. At the same time, demand for Jotun’s growing portfolio of specialised products that help to manage fire risk, avoid negative environmental impacts or potential health risks to applicators, has put the company in a strong position to compete for highprofile projects.
Jotun recognises that growing regulatory pressure on project owners and industry to decarbonise is likely to play a larger role in the company’s offering going forward. For example, growing investments in renewable energy, notably wind energy, has created fresh opportunities for Jotun. With raw material prices expected to ease in 2023, growth in this segment is expected to accelerate in the years ahead.
Following a period of uncertainty related to the pandemic over the past three years, the shipping industry made a strong recovery, driven by rising global trade volumes and high freight rates. At the same time, increasingly strict global and regional environmental regulations encouraged owners and shipmanagers to invest in high-performance hull coatings to reduce emissions.
Jotun is in a strong position to benefit from these trends. In addition to launching innovative products, Jotun continued to invest in and develop data-driven services based on the company’s extensive database on hull performance. For example, Jotun launched HullKeeper, a service that helps customers improve performance through hull monitoring, fouling risk alerts, inspections and advisory services. Other data-driven services include Jotun Hull Performance Solutions (HPS), which helps owners reduce
and verify both fuel costs and greenhouse gas emissions; Jotun Voyager, a decision support tool helping customers select the right hull coatings for individual trades and Jotun Hull Skating Solutions, a system that utilises advanced robotics (HullSkater) to achieve proactive hull cleaning.
Profitability in the Marine Coatings segment was negatively impacted by high raw materials prices, costs related supply chain disruption, and the closure of Jotun’s operations in Russia, where Jotun was a market leader. However, Jotun’s continued success in the newbuilding, drydock and seastock markets helped achieve good results, especially in China, South Korea, West Europe and Scandinavia.
Due to a series of external events, results for Jotun Powder Coatings fell short of expectations in 2022. The closure of Jotun’s business in Russia contributed to declining volumes, while high raw materials prices, especially for epoxies and polyester resins, impacted profitability. While Jotun moved quickly to implement price increases to support the business, other macro-economic factors, such as increased energy and transportation costs, rising inflation and interest rates and the lingering effects of the coronavirus pandemic in some markets conspired to slow growth. Nevertheless, Jotun increased sales in key markets notably in India, Türkiye and China.
Jotun remains committed to its long-term strategy, based on premium products, excellent technical service and a focus on innovation, especially within low-cure metallic solutions. In addition to launching two premium products for building components, Jotun’s product offering for Electric Vehicle (EV) battery packages and other components helped Jotun increase sales in China.
In Norway, Jotun completed construction of an industrial powder coatings line to develop and test low-cure powder coatings in cooperation with customers. Advances in low-cure solutions will enable customers to save on energy costs, increase efficiency and allow them to protect and beautify different substrates, including natural and engineered wood.
Headquartered in Sandefjord, Norway, Jotun’s R&D function includes a global network of regional laboratories in the UK, Türkiye Malaysia, Thailand, Dubai, India, South Korea, China and USA. These laboratories focus on regional product development, adapting or customising existing products, the testing of raw materials, quality assurance, and providing claims and verification services when required.
Jotun’s state-of-the art R&D centre in Sandefjord, Norway, is made up of offices and workstations for up to 350 chemists and support staff. The construction of a new R&D centre in Dubai was completed in 2022, and the project for building a new regional R&D centre in Malaysia will start up in 2023.
Over the past five years, Jotun chemists have increasingly focused on meeting growing demand for healthier, more environmentally responsible paints and coatings, engineered to meet new or pending regulations. For example, Jotun has developed a new water-based, solvent-free system for windmill blades, including fillers, primers, topcoats, and a new leadingedge protection. Jotun has also developed the industry’s first solvent-free steel primer to help shipyards comply with stricter limits on the use of VOCs. To help owners and real estate developers add value to buildings, Jotun has developed solvent-free steel protection products and ultra-low VOC interior paint systems, supported by the necessary documentation, to help them win points for “green building” certification.
By investing in facilities, personnel and new technologies, Jotun will be in a stronger position to support customers working to meet regulatory challenges and achieve their business objectives.
In 2020, Jotun formally declared its commitment to UN Sustainability Goals. Jotun’s sustainability strategy sets clear targets to improve the company’s environmental and social performance, supported by robust governance policies that are consistent with its core values (Loyalty, Care, Respect, Boldness). Jotun has classified sustainability into three categories: Environmental, Social and Governance (ESG).
Jotun‘s goal is to reduce the footprint of the company’s operations and develop sustainable products and solutions that help customers both comply with regulations and achieve their environmental targets. Jotun’s holistic approach seeks to minimise the environmental impact across the value chain, from sourcing raw materials and manufacturing, to distribution, and the use, reuse, and recycling of products and materials.
Since 2010, Jotun GreenSteps has served as the company’s environmental framework to track, document and improve Jotun’s environmental performance. While mainly focusing on its own operations, Jotun GreenSteps now includes activities throughout the value chain, from supplier relationships (upstream) to customer relationships (downstream) –areas where Jotun can have its greatest impact.
To implement Jotun’s approach to environmental sustainability, Jotun has developed the “The Value Chain Model”, a systematic framework that allows the company to understand and document the impact of products and solutions throughout the value chain and lifetime of the protected asset. The model covers selection of raw materials and product innovation (Input), impacts of Jotun production (Operations) and how Jotun products are used, applied, recycled and reused (Usage).
In 2022, Jotun included a new element in the The Value Chain Model; “avoided emissions”, which refers to how the use of Jotun products impact customer emissions. For example, by offering antifoulings that reduce drag on a ship’s hull or anticorrosive steel protection products that prolong the lifetime of an asset, Jotun can support customer efforts to reduce emissions related to fuel consumption or the production of replacement of steel. By documenting and sharing data on products and solutions that can contribute to avoid emissions, Jotun can support customers’ sustainability goals while also reducing downstream impacts.
To track performance, Jotun’s Value Chain Model uses environmental data gathered from multiple sources and standardised tools used to measure and share information of environmental impacts of Jotun activities.
In addition to internal tracking tools, Jotun conducts Life Cycle Assessments (LCAs) to prepare Environmental Product Declarations (EPDs) that help Jotun and its customers to make decisions that influence environmental performance. Jotun’s EPDs are independently verified by the Norwegian Institute for Sustainability Research (Norsus). By the end of 2022, Jotun had produced more than 350 EPDs. Jotun is also preparing extended EPDs, covering the whole value chain, including distribution, application, maintenance, end of life, and recycling potential.
Since 2010, Jotun has collected data from its global operations to produce an annual carbon footprint report, which covers both direct and indirect emissions. The report uses standards established by the Greenhouse Gas Protocol Initiative, allowing Jotun to measure emissions related to Jotun’s activities (scope 1, 2). With access to this standardised data, Jotun is in a better position to reduce its carbon emissions. In 2022, Jotun launched an initiative to establish a baseline and start building competence to measure scope 3 emissions.
Jotun works to ensure that products are designed and documented in line with regulations and the company’s sustainability goals. To improve performance, Jotun’s Research and Development (R&D) works closely with the purchasing function during the product development process to source and use raw materials responsibly.
Jotun identifies and works to eliminate potentially hazardous chemicals found in Jotun products within the framework of the company’s Chemical Policy, which is updated every year. Jotun’s Chemical Policy ensures that use of certain chemicals and substances that may represent a risk to health and the environment are avoided or restricted. Further, Jotun push to select raw materials with reduced environmental footprint and continues to research the use of recycled or biobased raw materials.
For more than a decade, Jotun has tracked carbon emissions, the use of solvents and waste in each of its 40 factories worldwide. Jotun has introduced a broad range of policies and systems to improve its performance over multiple categories.
Emissions from energy consumption represents Jotun’s most consequential contribution to the company’s carbon footprint. In 2022, Jotun set a target to reduce its carbon footprint from operations by 50 per cent to 2030, with the baseline established in 2017. To achieve this goal, Jotun has taken action to source more energy from renewable resources. For example, Jotun has invested in solar panels in Malaysia, Oman and Vietnam. Jotun is also seeking to reduce energy consumption through improved efficiencies. For example, in 2022, Jotun launched an initiative to reduce air compressor leakages, a significant contributor to Jotun’s emissions. In 2023, Jotun will work to optimise water cooling processes.
Jotun has developed procedures and systems to ensure that sustainability becomes a natural part of all maintenance investments or newbuilding projects. These (and other) initiatives related to carbon emissions are implemented through Jotun’s HSEQ Management System. The HSEQ Management System allows Jotun to set clear targets, communicate improvement initiatives and track results over time.
External transportation suppliers play an important role in Jotun’s supply chain logistics operations. To help lower emissions, all Jotun companies are encouraged to select sustainable and low-carbon suppliers, where available. For example, in 2022, Jotun Norway showcased the company’s first electric truck, operated by Schenker.
In 2022, Jotun recorded emissions of 91 505 tons CO2-equivalent, keeping the carbon footprint stable since 2021 despite a five per cent volume increase. The total electrical consumption in 2022 was 120 KWh per tonnes produced compared to 135 Kwh in 2021. This result is mainly due to increased use of renewable energy (24 per cent) and successful ongoing energy efficiency programmes in operations.
Jotun recognises how the company uses, reuses or recycles materials have a significant impact on its environmental performance. Many GreenSteps initiatives have been initiated to reduce, reuse and recycle waste, such as plastics, plastics and process water. For example, by purchasing raw materials in reusable Intermediate Bulk Containers (IBCs) or delivering raw materials into closed loop systems, Jotun can avoid packaging waste and the risk of spills.
Jotun works with customers and applicators to manage the efficient preparation of surfaces, application and maintenance, and provides information to consumers and professionals on how to properly handle and recycle waste. In 2022, Jotun Norway exercised its purchasing power to encourage suppliers to include “post-consumer” plastics in its decorative paint cans.
Waste generated per tonne produced was stable from 2021 to 2022, at 19.3 kg per tonne produced (19.4 in 2021).
Jotun’s approach to social issues is grounded in its corporate values (Loyalty, Care, Respect and Boldness) and the company’s Business Principles. Internally, Jotun seeks to create a safe, diverse and inclusive workplace where people can thrive. Externally Jotun aims to make a positive impact through active engagement with customers, suppliers, and with global or local organisations and charitable groups in communities where it operates.
Jotun’s ambition is to create healthy workplace environments, offer fair salaries and equal opportunities to all employee groups. This allows the company to meet existing and future business needs and helps the organisation attract, develop and retain skilled workers. In 2022, Jotun’s workforce consisted of 10 043 employees.
All Jotun employees have access to Jotun’s Human Resources Management System (HRMS). The HRMS supports HR processes in all aspects of employee lifecycle, from recruitment and performance management to training, compensation and benefits. In 2022, Jotun launched the Job Catalogue, which consists of around 500 unique job profiles describing the purpose and responsibilities of every position in Jotun. This feature provides employees access to information on what is required for the different jobs so that they can more easily visualise and pursue their career path.
Jotun recognises the importance of having a diverse and inclusive workforce. By building a culture of belonging and creating a welcoming workplace, Jotun can foster innovation and encourage collaboration. Jotun seeks to attract and develop talents across the organisation and respect and appreciate differences to create good working environments.
Jotun also seeks to attract top talents from diverse hiring pools. While Jotun recognises that managers face different challenges in local labour markets, all Jotun companies are required to make conscious efforts to ensure that their workforce mirrors the societies in which they operate. In 2022, Jotun committed to increasing female representation in managerial positions to 30 per cent worldwide (22 per cent 2022) and to 40 per cent (38 per cent 2022) at Jotun’s headquarters by 2030.
All Jotun companies are required to report on diversity initiatives twice a year. By the end of next year, all Jotun managers will have received “Inclusive Hiring” training to achieve improved inclusive recruitment and promotion processes.
Jotun measures performance through the “Diversity and Inclusion Index” in the Employee Engagement Survey, where any discrepancies can be identified and corrected. The company measures gender balance, generational representation, and ethnic and cultural diversity, expressed by national representation.
Information about Jotun’s Diversity and Inclusion initiative, status and progress, as well as a special report related to promoting equal opportunity and the prevention of discrimination in Jotun A/S (Norway), is found on https://www.jotun.com/th-en/about-jotun/sustainability/social/ diversity-in-action.
In 2022, Jotun launched the “Penguin CARE Programme”, which provides Jotun employees improved access to family support. In addition to receiving benefits mandated by local law, new mothers will receive eight additional weeks of fully paid leave, paid for by Jotun, capped at a total of 24 weeks. The policy also entitles new fathers with a minimum of 10 fully paid working days of paternity leave. It is also an internal requirement
to establish multipurpose rooms, which provide a safe space for all employees to rest, including new mothers, who are also entitled to reduced working hours if returning to work while still nursing a child. The Penguin CARE Programme also entitles employees caring for sick, injured or elderly relatives a minimum of five fully paid days per year of caregiver leave.
Jotun’s Global Mobility programmes allow Jotun to rotate and transfer employees safely, legally, and effectively between Jotun companies and countries. These programmes allow employees to gain cross-functional, cross-segment and cross-border experience. Mobility programmes include both short and long-term assignments and provide employees with the infrastructure, support and benefits, including support for the partners of employees on overseas assignments. In 2022, 175 employees were on short or long-term mobility assignments.
Jotun has organised its approach to Learning and Development into three areas: “Jotun Academy”, “People and Teams” and “Innovation and Technology”. Jotun Academy is Jotun’s primary learning platform, offering 43 offering training courses organised into 11 portfolios that touch on every aspect of Jotun’s business. To accelerate the development employees and teams, Jotun introduced new learning platforms, leadership boosters, and leadership and team development workshops.
Jotun has invested in equipment and partnered with experts to develop new tools for training and employee development, such as gamified and VR training tools. Jotun is also constructing a fully equipped media studio to facilitate the production of more content, such as training films, webinars, podcasts, and virtual tutorials.
The goal of Jotun’s HSEQ strategy is to continuously improve safety and quality performance across the company’s value chain, with a zerotolerance approach to injuries, fires and spills.
and report on standardised KPIs and subject to periodic audits from trained Jotun personnel.
In 2022 Jotun continued the focus and training within fire risk assessments, fire detection, fire segregation and fire-fighting systems. Jotun qualified more instructors in all regions to build operator competence and risk awareness. These training efforts are supported by other programmes, such as safety walks, daily meetings, short safety videos and so-called “Toolbox Talks”, where operators gather to ask questions and discuss safety issues.
Jotun has also increased investments in automation in many factories to help operators avoid workplace injuries.
Launched in 2014, the “I Care” programme is an internal campaign to raise HSEQ awareness. Each Jotun company runs three separate “I Care” projects every year. One project is developed by Group Technical, while each of the manufacturing sites launches the other two. In 2022, the Group initiated topic was fire safety.
The number of injuries resulting in an absence of one day or more per one million working hours (Lost Time Injury Rate LTIR) was 1.9 (1.4 in 2021), The LTIR for Jotun A/S was 0.0 in 2022 compared with 0.59 in 2021. Absence due to sickness for the Group in 2021 was 1.9 per cent, compared to 1.7 per cent in 2021. Absence due to sickness in Jotun A/S was 3.1 per cent in 2022 compared with 2.1 per cent in 2021.
As a part of supplier evaluations, Jotun distributes the Supplier Integrity Declaration to vendors. Jotun’s requirements to suppliers cover a broad range of topics including Human Rights, anti-corruption, child labour, the right to organise, diversity and inclusion, safe working environments, among others. For suppliers who fall short of Jotun standards but are willing to change, Jotun provides support to help them achieve compliance.
To ensure HSEQ policies are uniformly applied and followed, Jotun relies on the HSEQ Management System, which provides a structure for the organisation to manage 15 elements related to health, safety, environment and product quality management. Jotun companies are required to track
To track and verify compliance, Jotun conducts periodic audits and assessments. Some physical audits for packaging and raw materials suppliers are administered by trained Jotun personnel while others are conducted by trusted third party auditors. Board
Directors
By working closely with international partners, Jotun seeks to make a meaningful impact on the society, including organisations like the International Red Cross / Red Crescent Movement, Norwegian People’s Aid, Bellona, UN Global Compact and Transparency International and UNICEF. In 2022, Jotun made significant donations through the Norwegian Red Cross to provide relief for flood victims in Pakistan and support of Ukrainians in conflict zones.
Jotun operates in many countries around the world where the needs in the local communities may differ. All companies are required to select, support and report on local Corporate Responsibility activities. Projects include support for schools, orphanages, and programmes that provide access to basic health services and education. For example, in 2022, Jotun provided support to the Karanba project, which serves disadvantaged children and young adults in Rio de Janeiro, Brazil.
As a responsible corporate citizen, Jotun puts ethical business conduct at the heart of its operations. Standing by Jotun values and business principles allows the company to sustain a robust and effective organisation in light of evolving markets and growing competition.
Jotun conducts business operations in line with the company values (Loyalty, Care, Respect and Boldness) in the interest of customers, suppliers, employees, shareholders, the environment, and society at large. Jotun’s business principles cover the areas of ethics and integrity, community, fair trade, and free competition. They also define how the company treats employees and operates the business.
Jotun works actively against corruption. In addition to reputational damage to the Jotun brand, corruption and bribery are threats to economic development and contribute to poverty and the erosion of the rule of law. As a global company, Jotun acknowledges its responsibility to customers, suppliers, shareholders, employees and local communities to maintain its integrity and high ethical standards, as defined by Jotun values and Jotun Business Principles. Jotun’s Anti-Corruption Policy outlines the basic requirements that Jotun employees are required to follow to avoid corrupt
practices in connection with their company business activities.
Certain employees, including sales teams, purchasing staff and company management, face greater risk of exposure to potentially corrupt scenarios. They receive tailored dilemma training. To reinforce training for all employees, Jotun launched a digital anti-corruption gamified training tool in 2022.
Jotun’s “whistle-blowing” channel, available to both internal and external stakeholders, violations of Jotun’s business principles or other concerns are reported, logged, investigated and resolved. All reports are handled confidentially, and whistle-blowers are treated with respect and protected. Jotun encourages individuals to report on violations of Jotun’s Business Principles, laws or regulations.
Jotun supports international efforts, standards, declarations, and collaborations aimed at creating fair, proper and healthy business environments. Jotun’s Human Rights policy is aligned with the United Nations Guiding Principles on Human Rights and the International Labour Organisation (ILO) Declaration on Fundamental Principles and Rights at Work. The company adheres to the United Nations Global Compact (UNGC) to contribute to the goal of creating a sustainable and inclusive global economy.
Jotun’s Business Principles and values (Loyalty, Care, Respect and Boldness) provide the bedrock for the company’s governance framework. These are supported by corporate, regional and divisional bodies alongside supporting documentation, policies and leadership training, and are anchored all the way from the the top of the organisation. Guidance and training, alongside control, contribute to a compliance development based on understanding and ownership.
The hierarchy of Jotun’s governance structure is as follows: The Board of Directors, Jotun Group Management and regional and local management,
with the support of staff functions on all levels. Group policies are described in a hierarchy of steering documents and are the source of all local policies. The steering documents are open to view by all employees in the Jotun Management System, which is reviewed and updated every six months.
Jotun has extensive compliance programmes in place that pertain to all relevant business functions. This ensures that all Jotun companies are in accord with Group policies. For example, all Jotun companies must submit HSEQ performance reports for evaluation by their respective Boards. The Board is informed of the HSEQ compliance status of each company once a year.
Jotun’s extensive internal reporting systems, as well as assessments, audits and reviews, ensure the company is performing as expected. Relevant departments update these systems on an ongoing basis as new policies are instituted. For example, all Jotun companies are subject to periodic Business Reviews for which they must provide sales figures and market forecasts, as well as data pertaining to environmental impacts, competence development KPIs, HSEQ initiatives and sustainability activities. Once a year, the Board is updated on compliance status, including whistleblowing cases.
Jotun is also required to comply with the Norwegian Transparency Act, introduced in 2022. Jotun has taken steps to align its business with new requirements, including updating Jotun’s Human Rights Policy, integrating due diligence requirements into existing internal and external procedures, and established a channel for requests for information on Human Rights, https://www.jotun.com/th-en/about-jotun/sustainability/social. Jotun will publish a Human Rights report at the same site by June 30th, 2023.
Compliance is validated through certification by recognised international standards, such as Quality Management (ISO 9001), Environmental Management (ISO 14001) and Occupational Health and Safety (ISO 45001).
Jotun has established adequate directors’ and officers’ liability insurance.


While the Board was encouraged by easing raw materials prices in the second half of 2022, prices remain high. At the same time, the war in Ukraine, lingering effects of the pandemic (notably in China), ongoing supply chain disruptions and high transportation costs are likely to impact sales and profitability going forward. Nevertheless, based on the company’s ability to manage shocks to the global economy over the last three years, the Board is confident Jotun will continue to grow.
In the Marine Coatings segment, newbuilding orders are expected to rise, while growing pressure on owners and shipmanagers to manage emissions regulations will create more demand for Jotun’s premium hull coatings products and related services. In the Protective Coatings
segment, demand for Jotun’s anti-corrosive coatings and fire protection products is likely to increase, driven by construction and maintenance of oil, gas and renewable energy facilities to meet the needs of a growing world population.
In the Powder Coatings segment, rising production costs may impact volumes in some markets, while in others, high inflation may slow demand for consumer goods, such as furniture and appliances. However, thanks to Jotun’s strong portfolio of premium products and continued investments in pioneering solutions, the Board has confidence the segment will rebound after a difficult year.

While sales in the Decorative Paints segment may be impacted by consumer sensitivity to inflation and a slowdown in the project market in
some countries, the Board notes that Jotun has enjoyed uninterrupted growth in this segment for more than two decades. By continuing to drive innovation, supporting Jotun dealers, and developing effective marketing strategies for both the consumer and project markets, Jotun is confident the growth trend in Decorative Paints segment will continue in the years to come.
Finally, the Board recognises that growing pressure on customers in all segments to reduce their environmental impacts represents a strong market opportunity for Jotun. By improving the company’s performance and working with suppliers and customers to help them achieve their own sustainability goals, Jotun is in a strong position to not only contribute to a more sustainable world but continue to pursue its organic growth strategy.
Sandefjord, Norway, 14 February 2023


The Board of Directors Jotun A/S

 Morten Fon President & CEO
Other comprehensive income not to be reclassified to profit or loss in subsequent periods:
Other comprehensive income to be reclassified to profit or loss in subsequent
Jotun A/S is a limited liability company incorporated in Norway. The Group’s headquarter is in Sandefjord, Norway, and the Group including associates and joint ventures employs around 10 000 people in 46 countries.
The Group consists of the parent company Jotun A/S and its subsidiaries. The consolidated financial statements consist of the Group as well as the Group’s net interests in associates and joint ventures.
Accounting policies, estimates and judgements are incorporated into the individual notes with the exception of general information described in this section.
The consolidated financial statements are prepared based on the historical cost principle, except for financial assets and liabilities which are recognised at fair value.
The consolidated financial statements have been prepared on the basis of the going concern assumption.
The Group’s consolidated financial statements have been prepared in accordance with International Financial Reporting Standards (IFRS) and interpretations as adopted by the European Union (EU), as well as Norwegian disclosure requirements that follow from the Norwegian Accounting Act.
Debt and equity instruments in the Group are not traded in a public market. Consequently, operating segment reporting according to IFRS 8 does not apply for the Group.
The Group’s consolidated financial statements comprise Jotun A/S and companies in which Jotun A/S has a controlling interest. The financial statements of subsidiaries are fully consolidated from the date that control commences until the date that control ceases.
The financial statements of the subsidiaries are prepared for the same reporting period as Jotun A/S. All intercompany balances, income and expenses and cash flows relating to transactions between members of the Group are eliminated in full.
The Group has interests in associates and joint ventures. An associate is an entity in which the Group has significant, but not controlling
influence, with an ownership normally between 20 and 50 per cent. A joint venture is a jointly controlled entity, normally with a 50/50 ownership.
The Group’s investments in associates and joint ventures are accounted for using the equity method. Under the equity method, the Group presents its share of the companies’ results after tax on a separate line in the income statement. Share of equity is reported as investments in associates and joint ventures in the balance sheet.
The financial statements of associates and joint ventures are prepared for the same reporting period and based on the same accounting policies as for the Group.
The non-controlling interests are presented separately in the consolidated financial statements representing the minority’s share of equity and profit.
In the individual financial statements for each entity in the Group, transactions in foreign currency are initially recorded in the entity’s functional currency based on exchange rates at the date of transaction. Monetary items in foreign currency are translated into functional currency using the exchange rate applicable at the balance sheet date. Non-monetary items in foreign currency are translated into functional currency using the exchange rate applicable at the transaction date.
The Group’s presentation currency is Norwegian Krone (NOK). This is also Jotun A/S’ functional currency. Each entity in the Group determines its own functional currency, and the majority of financial statements are denominated in other currencies than NOK.
Assets and liabilities in entities with other functional currencies than NOK are translated into NOK using the exchange rate applicable at the balance sheet date. Their income statements are translated monthly at the average exchange rate for the month. Exchange rate differences are recognised in other comprehensive income. Income statements in hyperinflation economies are, however, translated at the exchange rate as of the balance sheet date.
Jotun A/S uses foreign currency options and forward currency contracts to ensure predictability in the short to medium term cash flows.
Hedge accounting in the Group is limited to hedge of net investment.
Jotun A/S finances the majority of its subsidiaries with intercompany loans in local currencies. Intercompany loans for which settlement is neither
planned nor likely to occur in the foreseeable future are accounted for as part of the net investment in foreign operations. In addition, a USD loan and a rolling currency swap serve as a hedge of net investments in foreign operations for which gains or losses related to the effective portion of the hedge are recognised in other comprehensive income.
No new IFRS standards, amendments or interpretations have been issued that have a significant impact on the consolidated financial statements for the Group.
In preparing the consolidated financial statements, Management makes various accounting estimates and assumptions that form the basis of the presentation, recognition and measurement of Jotun’s assets and liabilities.
Determining the carrying amounts of some assets and liabilities requires estimates and assumptions concerning future events. Estimates and assumptions are based on historical experience and other factors, which Management assesses to be reasonable, but which by their nature involve uncertainty and unpredictability. These assumptions may have to be revised as unexpected events or circumstances may occur.
The areas that involve a high degree of judgement and are material to the financial statements are described in more detail in the relevant notes.
New information regarding the Group’s financial position at the end of the reporting period and that becomes known after the reporting period, is recorded in the annual accounts. Events after the reporting period that do not affect the Group’s financial position at the end of the reporting period, but which will affect the Group’s financial position in the future, are disclosed if significant.
No events have taken place after the balance sheet date that would have affected the financial statements, or any assessments carried out.
This section includes notes related to the consolidated income statement.
Jotun achieved record sales and earnings in 2022, despite the many challenges imposed by the war in Ukraine, high raw material prices, the coronavirus pandemic, rising interest rates and inflation and the energy crisis in Europe.

The increase in operating revenue is driven by growth in all segments. Growth was particularly strong in Marine Coatings driven by the resurgence of newbuilding activity and a strong maintenance market. Protective Coatings also delivered good sales growth, while in Decorative Paints, strong growth the Middle East and South East Asia more than offset lower sales in Scandinavia. In Powder Coatings, sales grew more modestly driven by higher average selling prices, while volume dropped.
Operating profit increased by 19 per cent in 2022 compared to last year. The improvement is driven by price increases, volume growth, and good cost control.

27 858 Operating revenue (NOK million)
2021: 22 809
3 737 Operating profit (NOK million)
2021: 3 138
13.4 % Operating margin
2021: 13.8 %
Total operating revenue consists of revenue from the sale of paints and coatings, classified as revenue from contracts with customers, as well as other revenue, which includes royalty income from associates, joint ventures and other external partners, miscellaneous grants and refunds, and profit from sale of fixed assets.
38 % DECORATIVE PAINTS
2021: 38 % Group sales per segment
8 % POWDER COATINGS
2021: 9 %
32 % PROTECTIVE COATINGS
2021: 33 %
22 % MARINE COATINGS
20201: 20 %
Revenue from contracts with customers is recognised when control of the goods or services are transferred to the customer at an amount that reflects the consideration to which the Group expects to be entitled in exchange for those goods or services. Revenues are presented net of value added tax and discounts.
Variable considerations such as rebates, bonuses, discounts and payments to customers, are accrued for when performance obligations are met and related revenue is recognised. Variable considerations are only recognised when it is highly probable that they will not be subject to significant reversal.
The Group does not have any contracts where the period between the transfer of the goods to the customer and payment by the customer exceeds one year. Consequently, the Group does not adjust transaction prices for the time value of money.
Cost of goods sold comprises raw materials and packaging materials. The five largest raw materials categories account for more than 50 per cent of total cost of goods sold. These categories are titanium dioxide, emulsions, epoxy resins, additives and metals. Cost of conversion is reported as part of manufacturing costs as described in Note 2.3.
Payment terms are based on agreements and local business practices and are in general in the range of 30 to 90 days.
In July 2022, Jotun sold its Russian company Jotun Paints LLC, with a gain of NOK 54 million recognised as Other revenue.
Payroll expenses are the total disbursements relating to remuneration of personnel employed by the Group. These expenses comprise direct salaries and holiday pay, bonuses, pension costs and public taxes/charges relating to the employment of personnel.
Other operating expenses comprise all operating expenses that are not related to cost of goods sold, payroll expenses and capital costs such as depreciation, amortisation and impairment. The main items of other operating expenses have been grouped in the table below.
The Group has a system of annual bonuses that applies to senior management and is limited to a maximum of 20 per cent of annual basic salary. Further, all members of Group Management, including the President & CEO, are part of an annual profit-dependent bonus system limited upwards to 50 per cent of annual basic salary.
The Group’s pension plans are primarily defined contribution plans. For further information see Note 5.2. For further information regarding remuneration to the President & CEO and Board of Directors see Note 5.3.
Manufacturing costs include change in cost of conversion related to finished goods.
Research and Development consists of costs from projects in a research phase and development costs related to cancelled projects. Total Research and Development costs including payroll expenses are NOK 658 million (2021: NOK 576 million) of which NOK 37 million has been capitalised as intangible assets specified in Note 3.2.
Other consists mainly of product liability claims, losses on accounts receivable and technical service. See Note 3.5 and 3.7 for further details.

The notes in this section provide details of the assets and related liabilities that form the basis for the Group’s activities.
Operating working capital in per cent of sales increased during 2022. This is mainly explained by the strong sales growth and high raw material prices driving increases in customer receivables and inventory. With persistent focus on working capital, customer credit days have remained stable.

The increase in capital employed, beyond the rise in operating working capital, is driven by investments in new production facilities in Egypt, Qatar and Indonesia, construction of new regional headquarters and R&D facility in Dubai as well as facility upgrades in Norway.
28.7 % Operating working capital / revenue
2021: 27.4 %
16 637 Capital employed (NOK million)

2021: 14 482
1 280 Investments in intangible and fixed assets (NOK million)
2021: 1 363
The table shows investments in working capital items and invested capital. Capital employed is the total of net working capital and invested capital, which is the basis for generation of operating profit before interest and tax (EBIT). Return on capital employed (ROCE) is the ratio of EBITA to capital employed, and is used to measure the Group’s profitability and capital efficiency.
Intangible assets are non-physical assets that have either been capitalised through internal development of products (development cost), customisation of IT applications or separate acquisitions.
Intangible assets are measured at cost, net of accumulated amortisation and accumulated impairment losses.
Amortisation of intangible assets with limited economic lives are calculated on a straight-line basis over the estimated useful life. The amortisation method and period are assessed at least once a year. Changes to the amortisation method and/or period are accounted for as a change in estimate. Intangible assets with unlimited useful lives are not amortised but tested for impairment annually. The methodology for impairment testing is described in Note 3.3.
All intellectual property rights are owned by Jotun A/S. Development costs are capitalised only if the product is technically and commercially feasible and the business case demonstrates a probability for future economic benefit. Capitalised development costs mainly include internal payroll costs in addition to purchased materials and services used in the development programmes. Amortisation of assets with limited useful life begins when development is complete, and the asset is available for use.
Property, plant and equipment (PP&E) comprises various types of tangible fixed assets needed for the type of business conducted by the Group.
A major part of the amount under Construction in progress relates to the new production facilities in Egypt and Indonesia and construction of a new regional headquarter and R&D facility in Dubai.
See Note 5.4 for further information related to Right-of-Use assets.
PP&E are stated at cost less accumulated depreciation and impairment charges. Costs include expenditures that are directly attributable to the purchase of the asset, including borrowing cost of investment projects under construction.
PP&E are depreciated over estimated useful life after deduction of estimated residual value. Depreciation methods, useful lives and residual values are reassessed annually. Changes to the estimated residual value of useful life are accounted for as a change in estimate.
Costs of major maintenance activities are capitalised and depreciated over the estimated useful life. Maintenance costs which cannot be separately defined as a component of PP&E are expensed in the period in which they occur.
The Group assesses the carrying value of intangible assets and PP&E whenever events or changes in circumstances indicate that the carrying value of an asset may not be recoverable.
If the carrying value of an asset exceeds its estimated recoverable amount, an impairment loss is recognised in the income statement.
The assessment for impairment is performed for assets generating largely independent cash inflows.
The Group reverses impairment losses in the income statement if and to the extent this is substantiated by a change in the estimates used to determine the recoverable amount.
27 %
20 % LEASES
Inventories comprise the Group’s stock of raw materials used for production, finished goods and purchased goods for resale. Packaging to be used for sold goods is included. Any profit from intercompany sales has been eliminated.
Trade and other receivables are presented net of allowance for bad debt. Changes in allowance for bad debt, including realised losses, are classified as other operating expenses in the income statement, ref. Note 2.3. Bank drafts are received as payment of accounts receivable and have a maturity period of more than three months. Received bank drafts are used to pay suppliers, ref. Note 3.9.
Inventories are stated at the lower of cost and net sales value. The cost incurred in bringing each product to its present location and condition is accounted for as follows:
1) The cost of raw materials is determined using the weighted average cost method as an overall principle for the Group. This involves the computation of an average unit cost by dividing the total cost of units by the number of units.
2) The cost of finished goods includes cost of direct materials and cost of conversion such as labour and a proportion of manufacturing overhead based on normal operating capacity, and excludes any borrowing costs. Change in cost of conversion is reported as manufacturing costs, see Note 2.3.
Net sales value is the estimated selling price, less estimated costs of completion and the estimated costs necessary to make the sale. The Group’s products are sold in markets where there are limited observable market references available, requiring use of judgement in determining net sales value. Management has used its best estimate in setting net sales value for inventories. Allowances are made for inventories with a net sales value less than cost.
The change in allowance for bad debt is shown in the following table:
Accounts receivable are recognised at transaction price. The Group applies a simplified approach when accounting for expected credit losses. Therefore, the Group does not track changes in credit risk, but instead recognises a loss allowance based on lifetime expected credit losses at period end. Allowances for bad debt are based on an individual assessment of the trade receivable, considering all relevant information at the time of reporting, including historical, current and future information.
Allowances have been made for bad debt, which cover uncertain receivables to a reasonable extent. The Management continues to assess the credit risks in order to ensure the credit risk never exceeds the allowance for bad debt. For further description of credit risk, see Note 4.4.
Other current liabilities are other payables, such as unpaid government charges and taxes, unpaid wages and holiday pay and other accruals and provisions.
Provisions consist mainly of product liability claims and environmental remediation costs related to specific cases or events that have occurred before the year end, and where the costs involved are not certain, but based on best estimates.
Prepaid dividends from associates or joint ventures are recognised as current liabilities until the final approval by the General Assembly in the following year. Other accrued expenses are related to commissions, bonuses to employees and other accrued expenses.
Other provisions include obligations relating to ongoing restructuring programmes. The provision is expected to be utilised within the next year.
Product liability claims are reported as other operating expenses, ref. Note 2.3.
A provision for a liability is made when a legal or constructive obligation exists, payment is probable (more likely than not), and the liability is possible to estimate. If any of the recognition criteria are not met, the liability is considered a contingent liability and no provision shall be recorded, but instead described in Note 3.8.
Product liability claims consist of various warranty claims arising from products sold. By nature, the related amounts and timing of any outflows are difficult to predict. Assumptions used to calculate provisions for product liability claims are based on technical assessments of product failures and the related expected repair costs for each specific case. It is expected that most of these costs will be payable in the next three years, and all will have been payable within five years after the reporting date.
The Group has recorded provisions for environmental liabilities at some currently or formerly owned, leased and third-party sites throughout the world. Pre-studies and analysis of relevant areas have been undertaken to reliably estimate the provisions that have been recognised.
Jotun Group is, through its ongoing business, involved in product liability claims cases and disputes in connection with the Group’s operations. Provisions have been made to cover the expected outcome of disputes insofar as negative outcomes are likely and reliable estimates can be made. In evaluating the size of the provisions, expected insurance cover is considered separately. Jotun acknowledges the uncertainty of the disputes but believes that these cases will be resolved without significant impact on the Group’s financial position.
The Group is through its operations exposed to environmental and pollution risk. Production facilities and product storage sites have been inspected with respect to environmental conditions in the soil. For clean-up projects where implementation is probable and reliable cost estimates exist, provisions are made accordingly. Due to uncertainties inherent in the estimation process, it is possible that such estimates could be subject to change. In addition, further expenditures may arise as conditions at various sites have yet to be determined. The amount of such future costs is not determinable due to the unknown timing and extent of corrective actions which may be required.
All of Jotun’s activities are carried out in accordance with local laws and regulations, and Jotun’s Health, Safety and Environment (HSE) requirements. These laws and regulations are subject to change, and such changes may require that the company make investments and/or incurs costs to meet more stringent emission standards or to take remedial actions related to e.g., soil contamination.
As stated in Note 3.7, contingent liabilities are potential liabilities that do not meet the recognition criteria for provisions and are hence not recorded in the balance sheet. IFRS accounting standards, however, require disclosure of such information in the notes.
The Group’s contractual purchase obligations are mainly related to investments in new plants and buildings. There is a substantial investment programme ongoing in the Group. Out of the total ongoing investment programme, NOK 508 million is contractually committed capital expenditure (CAPEX) at year-end. These contractual commitments mainly relate to projects in Indonesia, Malaysia, and Qatar. For purchase of raw materials, there are no actual commitments for the Group. In general, these contracts can be terminated without significant penalties.
Jotun A/S has guarantees covering tax withholding and other guarantees for its subsidiaries. These amounted to approximately NOK 1 212 million in 2022 (2021: NOK 403 million).
A subsidiary in China, Jotun Coatings (Zhangjiagang) Co. Ltd., has used bank drafts to pay some of its suppliers. The issuing bank(s) is obligated to make unconditional payment to the supplier (or bearer) on a designated date. If unforeseen events occur and the issuing bank(s) is not able to meet its obligation, then Jotun would still hold the final obligation towards its suppliers. Unsettled bank drafts totalling NOK 659 million (2021: NOK 651 million) have been used as payment as of 31 December 2022.
This section includes notes related to Jotun’s capital structure and financial items, including financial risks.
Jotun’s capital structure and financial position strengthened during the year, mainly explained by strong earnings growth and good cash generation. The Group’s equity ratio at year-end was 55.0 per cent, well above the loan covenant requirement of minimum 25 per cent. Strong earnings growth and good cash generation lowered the Group’s leverage ratio (Net debt/ EBITDA) to 0.4, significantly below the loan covenant requirement of maximum 4.0.
With its global footprint in operations, investments and financing, Jotun is exposed to financial risks related to currency exchange rates, interest rates, raw material prices and customer credit. These risks are primarily managed through the Group companies’ normal operations and in accordance with the Group’s Treasury policy.


55.0 % Equity / asset ratio, in % 2021: 53.2 %
0.4 Net debt / EBITDA
2021: 0.5
22.5 % Return on capital employed
(NOK million)
2021: 21.7 %
The Group’s main sources of financing are from the Norwegian Bond market and bilateral bank facilities. Certificate loans are also used as a source of liquidity. The time to maturity for new loans and credit facilities is normally 3-5 years.
Bond funding in the Group has remained unchanged during 2022. The loan from Nordic Investment Bank (NIB) of USD 120 million is maintained and semi-annual instalments began in 2018.
As of 31 December 2022, there were no drawings on the committed credit facilities.
Cash deposits in banks are attributable to the Group’s cash pool arrangement and local bank accounts held by the respective subsidiaries. Only subsidiaries owned 100 per cent by the Group are participants in the cash pool. The net cash position in the Group’s cash pool per 31 December 2022 was NOK 658 million (2021: NOK 372 million).
Surplus cash in subsidiaries not participating in the cash pool is accessible through dividend distribution and/or repayment of debt to Jotun A/S.
Cash includes cash in hand and cash deposits in banks. Cash equivalents are short-term liquid investments which are convertible into a known amount of cash on short notice and have a maximum term to maturity of three months.
The Group has net financial items mainly comprising net interest expenses, foreign exchange gains and losses and fair value changes of the Group’s financial instruments related to hedging.
Foreign exchange gains and losses related to forwards, options and swaps in Jotun A/S have affected net financial items with the following amounts:
Unrealised part is reported as fair value changes financial instruments, while the realised part is reported as foreign exchange gain or loss.
Financial risks include raw material price risk, foreign currency risk, customer credit risk, interest rate risk and liquidity risk managed by the Group Treasury according to policy.
Raw material risk is the risk of fluctuating raw material prices affecting cost of goods sold, which represent more than 60 per cent of total costs. The main raw materials purchased by the Group are described in Note 2.1. Currently, the Group does not hedge this type of risk as availability of effective hedging instruments is limited. As increases in raw material prices cannot be compensated for immediately through increased product prices, profits will be negatively impacted for a period of time. The time horizon for Group-wide implementation of price increases is generally 9-12 months.
Cost of goods sold was NOK 15.9 billion in 2022 of which NOK 9 billion were costs for the top five raw materials. A ten per cent increase in commodity prices will result in an increase in cost of goods sold by NOK 1.6 billion.
The Group’s consolidated financial statements are exposed to a currency risk related to translation of local currencies to NOK. In 2022, sales and operating profit outside Norway were NOK 23.8 billion and NOK 3.5 billion respectively. A ten per cent appreciation in NOK will result in a reduction in sales of NOK 2.4 billion and operating profit of NOK 0.3 billion. Excluding currency effects, sales growth for the Group would have been 23 per cent compared to 22 per cent in reported rates. Conversely, operating profit growth would have been reduced from 19 per cent to 18 per cent.
In addition to share capital, Jotun A/S finances the majority of its subsidiaries with intercompany loans in local currencies. Intercompany loans for which settlement is neither planned nor likely to occur in the foreseeable future are accounted for as part of the net investment in foreign operations. Exchange differences are recognised initially in other comprehensive income and reclassified from equity to profit or loss on disposal of the net investment.
Jotun A/S has a USD 27.8 million loan and a rolling USD 28 million currency swap which serves as a hedge of net investment in foreign operations. Gains or losses on the hedging instrument related to the effective portion of the hedge are recognised in other comprehensive income while any gains or losses relating to the ineffective portion are recognised in the income statement.
A gain of NOK 54 million on hedge of net investments was recognised in other comprehensive income in 2022 (2021: loss NOK 15.1 million).
The management of customer credit risk related to accounts receivable and other operating receivables is handled as part of the business risk.
The Group’s credit risk is mainly related to markets with generally high Days Sales Outstanding (DSO). Customer credit risk is managed by each business unit subject to the Group’s established policy, procedures and controls.
Outstanding customer receivables are regularly monitored based on defined credit limits, and credit risk assessments are performed.
There is no significant concentration of credit risk in respect of single counterparts. Some groups of counterparts can be viewed as significant: Shipyards, shipowners, real estate developers and some larger retail chains in Scandinavia.
The need for bad debt allowances is analysed on an individual customer basis. The maximum exposure to credit risk at the reporting date is the carrying value of each ageing class of accounts receivable disclosed in Note 3.5. Customer receivables are unsecured, which means that customers are not required to post collateral.
Given the geographical distribution of customers with few large single accounts, credit risk in the Group is viewed as low and well diversified. The Group’s customers are spread across several jurisdictions and industries and operate in largely independent markets.
The Group’s exposure to the risk of changes in market interest rates relates to the Group’s long-term debt with floating interest rates. Jotun manages its interest rate risk by monitoring the impact on net profit. The Group has a relatively low leverage ratio. Consequently, the majority of the debt is with floating interest rate apart from lease liability (ref. Note 4.1).
The Group has long-term interest-bearing debt of NOK 1 772 million with floating interest rate. A three percentage point increase in interest rate will affect the financial items by NOK 53 million.
It is the Group’s policy that long-term debt and credit facilities shall have a minimum average time to maturity of two years. In addition, the target is to maintain a strategic financing reserve equivalent to five per cent of the Jotun’s operating revenue.
The Group estimates its future cash flow by forecasting. Cash flow from operations has seasonal cycles, especially due to the sales of exterior decorative paints in Scandinavia. Through the first months of the year, the Group has substantial build-up of working capital in preparation for sales during spring and summer season. This is an expected cyclical movement and is taken into account when planning the Group’s financing.
Other drivers of the liquidity development are investments in new factories and changes in the working capital in the individual companies. Jotun A/S repatriates cash through both ordinary and interim dividends based on target equity ratios for its subsidiaries.
This section includes other statutory notes not related to previous sections.
Higher earnings contributed to an increase in income tax expense in 2022. In addition, a provision for taxes in Norway related to dividends received from Saudi led to an extraordinary tax expense, negatively impacting the Group’s effective tax rate. The tax claim is disputed.
The proposed dividend represents an increase of 11 % compared to 2021 and is equivalent to 41.6 % of the Group’s profit for the year less noncontrolling interests.

1 024
Income tax expense (NOK million) 2021: 779

32.1 % Effective tax rate based on profit before tax 2021: 27 %
855.0 Proposed dividend (NOK million) 2021: 769.5
Income taxes refer to taxation of the profits of the different companies in the Group. Value added tax, property tax, custom duties and similar indirect taxes are not included in the tax expense. Income taxes are computed based on profit before tax and broken into current taxes and changes in deferred taxes. Deferred tax assets and liabilities are the result of temporary differences between financial and tax accounting.
The major components of the income tax expense are:
The difference between the Group’s nominal and effective tax rate is mainly due to non-deductible expenses, non-refundable withholding taxes on dividends and tax losses carried forward from operations without recognition of deferred tax assets. In addition, the tax expense is driven by local income tax from associates where taxes are liable by Jotun A/S as a foreign shareholder.
In the following table, reported income tax is reconciled with the calculated tax expense based on the Norwegian tax rate of 22 per cent (22 per cent in 2021). The main components are specified.
Deferred tax is generally recognised for all temporary differences. Deferred tax assets for temporary differences and tax loss carried forward are recognised to the extent that it is probable that future taxable income will be available to utilise the credits. Deferred tax liabilities comprise the Group’s tax liabilities that are payable in the future.
Tax loss carried forward relates to subsidiaries with a history of losses that may not be used to offset taxable income elsewhere in the Group. Jotun’s operations in the US, Brazil, Morocco, Spain, South Africa and the Philippines have substantial tax reducing temporary differences and tax losses carried forward that have not been recognised due to uncertainty about future taxable profit available to utilise the credits.
Current income tax assets and liabilities are measured at the amount that is expected to be paid to or recovered from the tax authorities. The current and deferred income tax is calculated based on tax rates and tax laws that have been enacted or substantively enacted, in the countries where the Group operates and generates taxable income. Management periodically evaluates positions taken in the tax returns with respect to situations in which applicable tax regulations are subject to interpretation and establishes provisions where appropriate.
Deferred tax assets and deferred tax liabilities are calculated on all differences between the book value and tax value of assets and liabilities. Deferred tax assets and deferred tax liabilities are recognised at their nominal value and classified as non-current liabilities and non-current assets in the balance sheet. Deferred tax liabilities and deferred tax assets are offset as far as possible as permitted by taxation legislation and regulations. Deferred tax assets are recognised for all unused tax losses and temporary differences to the extent that it is probable that taxable profit will be available against which losses and temporary differences can be utilised.
Uncertainties exist with respect to determining the Group’s deferred tax assets and deferred tax liabilities. Significant management judgement is required to determine the amount of deferred tax assets that can be recognised, based upon the likely timing and level of future taxable profits, together with future tax planning strategies.
Jotun’s widespread business operations expose us to several tax regimes and their interaction. Tax authorities in different jurisdictions may challenge the calculation of taxes payable from prior periods, which results in changes to income tax expense in the period of change, as well as interest and penalties. Management evaluates, among other factors, the degree of probability of an unfavourable outcome and the ability to make a reasonable estimate of the amount of loss. Unanticipated events or changes in these factors may require the Group to accrue for a matter that has not been previously accrued for because it was not considered probable.
Jotun is involved in several tax disputes with tax authorities, of which the outcomes are subject to significant uncertainties.
In 2022, Jotun A/S received a formal claim from the Norwegian tax authorities for the years 2017 and onwards related to taxation of dividends distributed from our companies in Saudi Arabia. Over the years Jotun A/S has reported the dividends from Saudi Arabia as free of tax in accordance with the Norwegian participation exemption model. The Norwegian tax authorities consider Saudi Arabia to be a low tax jurisdiction, and has consequently deemed the dividends as taxable income for Jotun A/S. The corresponding tax cost for the years 2017 – 2022 has been recognised accordingly. Jotun disagrees with the ruling and has disputed the claim.
The Group companies provide various retirement plans in accordance with local regulations and practices in the countries in which they operate.
The majority of the Group’s pension plans are defined contribution plans, whereby the company’s obligation is limited to annual contributions to the employees’ pension plans. The Group also has a few remaining defined benefit pension plans with net pension obligation.
The Group has defined benefit plans in a limited number of countries, including Norway, the UK, Greece, Türkiye, Indonesia and in certain countries in South East Asia and the Middle East. In Norway, the defined benefit schemes were replaced by defined contribution plans in 2004, and the defined benefit plan in the UK was closed for new members in 2012.
Defined benefit plans in Norway account for around 75 per cent of the Group’s net pension obligation as of 31 December 2022. In Norway, net pension obligations are primarily related to previous early retirement schemes for the Group’s senior executives. In certain countries in South East Asia and the Middle East, such as Indonesia, Thailand and Oman, there are pension schemes based on a final salary principle in accordance with local regulations. These are included in net pension obligations.
Other severance schemes comprise mainly obligations related to operating pension schemes for employees in the Norwegian companies with an annual basic salary and pension base exceeding 12 times the basic amount (G). This accounts for 80 per cent of the other severance scheme obligation.
Pension plan assets are mainly in bonds and shares. The estimated return will vary depending on the composition of the various classes of assets. Contributions to pension plan assets during 2022 are expected to be approximately NOK 6.3 million.
The pension cost related to the Group’s defined contribution plans is equal to the annual contribution made to the employee’s individual pension accounts in the accounting period. Annual contributions correspond to an agreed percentage of the employee’s salary in accordance with local pension arrangements. In Norway, the rate is five per cent of annual basic salary, limited upwards to twelve times the social security basic amount. In addition, 18.1 per cent contribution is made for annual basic salary between 7.1-12 times the social security basic amount. The pension contributions are expensed when incurred. The return on the pension funds will affect the size of the employees’ pension, and the risk of returns lies with the employees.
In the defined benefit plans, the Group companies are responsible for paying an agreed pension to the employee based on his or her final pay. Defined benefit plans are valued at the present value of accrued future pension obligations at the end of the reporting period. Pension plan assets are valued at their fair value. The capitalised net liability is the sum of the accrued pension liability minus the fair value of the associated pension fund asset.
Actuarial gains and losses are recognised in other comprehensive income. Introduction of new or changes to existing defined benefit plans that will lead to changes in pension liabilities are recognised in the income statement as they occur. Gains or losses linked to changes or terminations of pension plans are also recognised in the income statement when they arise.
Other severance schemes comprise mainly of obligations related to pension schemes for employees in the Norwegian companies with an annual basic salary exceeding 12 times the basic amount (G). In addition, minor statutory obligations to employees in a few other countries are also included. Obligations related to other severance schemes are recognised as non-current liabilities.
Defined benefit plans are calculated based on a set of selected financial and actuarial assumptions. Changes in parameters such as discount rates, future wage adjustment, etc. could have a substantial impact on the estimated pension liability. Similarly, changes in selected assumptions for the return on pension assets could affect the amount of the pension assets. The Group will not be materially affected by a reasonable expected change in key assumptions.
All assumptions are reviewed at each reporting date.
Remuneration of the President & CEO
The President & CEO is part of a pension scheme that includes a mutual opportunity to discontinue employment in whole or in part up to five years earlier than a stipulated retirement age of 67 years.
The Group has no obligation to give the President & CEO or the Chairman of the Board special remuneration upon discontinuance or change of employment or office. Should the President & CEO’s employment discontinue, his contract has a clause stipulating that a one-year “competition quarantine” may be imposed with compensation. The President & CEO has a notice period of six months.
The Group has not given any loans or guarantees to the President & CEO, the Chairman of the Board, or to any shareholders or members of Group Management, the Board of Directors or Corporate Assembly.
Shares controlled by members of the Board of Directors and the Group Management are specified in Note 5.8.
The Group has lease contracts for various assets (land, buildings, machinery and equipment and transport vehicles) used in its operations.
The Group assesses at contract inception whether a contract is, or contains, a lease. That is, if the contract includes a right to control the use of an identified asset for a period of time in exchange for a financial consideration.
The Group applies a single recognition and measurement approach for all leases. The Group recognises lease liabilities for payment obligations for leases and right-of-use assets representing the value of the right to use the underlying assets.
The Group recognises right-of-use assets at the date the underlying asset is available for use. Right-of-use assets are measured at cost, less any accumulated depreciation and impairment losses, and adjusted for any remeasurement of lease liabilities. The cost of right-of-use assets includes the amount of lease liabilities recognised, initial direct costs incurred, and lease payments made at or before the commencement date less any lease incentives received. Right-of-use assets are depreciated on a straight-line basis over the shorter of the lease term and the estimated useful lives of the assets. When assessing the life of the leases, the Group considers the non-cancellable lease term and options to extend the lease where Jotun is reasonably certain to extend. Extension options are assessed for all lease’s premises. For other assets, the life is equal to the non-cancellable lease period and extensions are not considered for these.
Right-of-use assets are also subject to impairment, using the same method as for Property, plant and equipment, see Note 3.3.
At the commencement date of the lease, the Group recognises lease liabilities measured at the present value of lease payments to be made over the lease term. The lease payments include fixed payments (including in substance fixed payments) less any lease incentives receivable, variable lease payments that depend on an index or a rate, and amounts expected to be paid under residual value guarantees. The lease payments also include the exercise price of a purchase option reasonably certain to be exercised by the Group. Variable lease payments that do not depend on an index or a rate are recognised as operating expenses in the period in which the event or condition that triggers the payment occurs.
In calculating the present value of lease payments, the Group uses its incremental borrowing rate at the lease commencement date because the interest rate implicit in the lease is not readily determinable. After the commencement date, the amount of lease liabilities is increased to reflect the accretion of interest and reduced for the lease payments made. In addition, the carrying amount of lease liabilities is remeasured if there is a modification, a change in the lease term or a change in the lease payments. The Group’s lease liabilities are included in interest-bearing debt, see Note 4.1.
The Group applies the short-term lease recognition exemption to all short-term leases, which are leases that have a lease term of 12 months or less from the commencement date. It also applies the lease of lowvalue assets recognition exemption to leases of office equipment that are considered to be low value. Lease payments on short-term leases and leases of low-value assets are recognised as expense on a straight-line basis over the lease term.
The Group has classified the principal portion of lease payments within financing activities and the interest portion within operating activities in the statement of cash flow.
The Group cannot readily determine the interest rate implicit in the lease, therefore, it uses its incremental borrowing rate (IBR) to measure lease liabilities. The IBR is the rate of interest that the Group would have to pay to borrow over a similar term, and with a similar security, the funds necessary to obtain an asset of a similar value to the right-of-use asset in a similar economic environment. The IBR therefore reflects what the Group ‘would have to pay’, which requires estimation when no observable rates are available (such as for subsidiaries that do not enter into financing transactions) or when they need to be adjusted to reflect the terms and conditions of the lease (for example, when leases are not in the subsidiary’s functional currency). The Group estimates the IBR using observable inputs (such as market interest rates) when available and is required to make certain entity-specific estimates (such as the subsidiary’s stand-alone credit rating).
Right-of-Use assets:
Total cash outflow relating to lease of Right-of-Use assets was NOK 180 million for the period. The portfolio of short-term leases does not vary significantly from year to year.
The Group has investments in associates in the Middle East and joint ventures in North East Asia, involved in production and sales of products within all the Group’s four segments. See Note 1.1 for accounting policy. See Note 5.7 to the Parent Company Financial Statements for more information.
Share of profits from JV/AC Share of
Summary of financial information for the associates and joint ventures based on 100 per cent figures:
* Subsidiaries, associates and joint ventures.
Two parties are deemed to be related if one party can influence the decisions of the other.
During 2022, goods and services were purchased and sold to various related parties in which the Group holds a 50 per cent or less equity interest. Investments in associates and joint ventures are presented in Note 5.5, shareholder and dividend information are presented in Note 5.8.
The transactions between related parties are mainly sales and purchases of finished goods. Joint expenses are distributed in accordance with agreed cost contribution arrangements.
Outstanding balances at the year-end are unsecured and there have been no guarantees provided or received for any related party receivables or payables. As of 31 December 2022, the Group has not recorded any impairment of receivables relating to amounts owed by related parties (2021: NOK 0). This assessment is undertaken each financial year by examining the financial position of the related party and the market in which the related party operates. The amount of these transactions is shown in the table below.
Details on remuneration and shares held for the Board of Directors and Group Management is described in Notes 5.3 and 5.8. Besides remuneration and shares, the Group has not identified any transactions with the Board of Directors or key management personnel during 2022.
For the list of subsidiaries included in the consolidated accounts, refer to Note 5.6 to the Parent Company Financial Statements.
The share capital in Jotun A/S as of 31 December 2022 consists of the following share classes:
Shares directly controlled by members of the Board of Directors, Corporate Assembly and Group Management and / or related parties
At the general meeting, each A-share has ten votes and each B-share has one vote. There are no changes from last year.
Ownership structure
The number of shareholders as of 31 December 2022 was 934. The largest shareholders were:
Dividend is deducted from equity and recognised as a liability after approval by the Annual General Meeting.
This note gives an overview of measurement of financial assets and liabilities and the accounting treatment of these balance sheet items. The measurement method in the tables are defined as follows:
Level 1: Recorded fair value based on quoted. unadjusted prices in active markets for identical assets and liabilities
Level 2: Recorded fair value based on valuation using observable market data. directly or indirectly. as input
Level 3: Recorded fair value based on valuation without availability of any observable market data as input
Fair value of financial instruments:
The fair value of financial instruments that are traded in active markets at each reporting date is determined by reference to quoted market prices or dealer price quotations (bid price for long positions and ask price for short positions), without any deduction for transaction costs. For financial instruments not traded in an active market, the fair value is determined using appropriate valuation techniques. Such techniques may include using recent arm’s length market transactions, reference to the current fair value of another instrument that is substantially the same, a discounted cash flow analysis or other valuation models.
The Group’s financial assets include cash and short-term deposits, trade and other receivables, loans and other receivables, quoted and unquoted financial instruments and derivative financial instruments.
Financial assets are classified at initial recognition and subsequently measured at amortised cost or fair value through profit or loss, correspondingly. The classification of financial assets at initial recognition depends on the financial asset’s contractual cash flow characteristics and the Group’s business model for managing them. Financial assets are initially measured at their fair value. However, trade receivables that do not contain a significant financing component or for which the Group has applied the practical expedient are measured at the transaction price determined under IFRS 15.
For a financial asset to be classified and measured at amortised cost, it needs to give rise to cash flows that are “Solely Payments of Principal and Interest” (SPPI) on the principal amount outstanding. This assessment is referred to as the SPPI test and is performed at an instrument level.
The Group’s business model for managing financial assets refers to how it manages its financial assets in order to generate cash flows. The business model determines whether cash flows will result from collecting contractual cash flows, selling the financial assets, or both.
The subsequent measurement of financial assets depends on their classification as follows:
Loans and receivables are non-derivative financial assets with fixed or determinable payments that are not quoted in an active market. After initial measurement, such financial assets are subsequently measured at amortised cost using the effective interest rate method (EIR), less impairment. Gains and losses are recognised in the income statement when the assets are derecognised, modified or impaired.
Financial assets at fair value through profit or loss include financial assets held for trading, financial assets designated upon initial recognition at fair value through profit or loss or financial assets mandatorily required to be measured at fair value. Financial assets are classified as held for trading if they are acquired for the purpose of selling or repurchasing in the near term. This category includes derivative financial instruments entered into by the Group that are not designated as hedging instruments in hedge relationships as defined by IFRS 9. Financial assets at fair value through profit and loss are carried in the statement of financial position at fair value with changes in fair value recognised in net financial items in the consolidated income statement.
Further disclosure relating to impairment of financial assets are also provided in Note 3.5.
The Group recognises an allowance for Expected Credit Losses (ECLs) for all debt instruments not held at fair value through profit or loss. ECLs are based on the difference between the contractual cash flows due
in accordance with the contract and all the cash flows that the Group expects to receive, discounted at an approximation of the original effective interest rate.
For trade receivables, the Group applies a simplified approach in calculating ECLs. Therefore, the Group does not track changes in credit risk, but instead recognises a loss allowance based on lifetime ECLs at each reporting date. The carrying amount of the asset is reduced using an allowance account and the amount of the loss is recognised in the income statement.
Financial liabilities are classified at initial recognition as financial liabilities at fair value through profit or loss, loans and borrowings, or as derivatives designated as hedging instruments in an effective hedge, as appropriate. All financial liabilities are recognised initially at fair value and, in the case of loans and borrowings, carried at amortised cost. This includes directly attributable transaction costs.
The measurement of financial liabilities depends on their classification as follows:
Financial liabilities at fair value through profit or loss include financial liabilities held for trading and financial liabilities designated upon initial recognition as at fair value through profit or loss. Financial liabilities are classified as held for trading if they are acquired for the purpose of selling in the near term. This category includes derivative financial instruments entered into by the Group that are not designated as hedging instruments in hedge relationships as defined by IFRS 9.
Gains or losses on liabilities held for trading are recognised in the income statement.
After initial recognition, interest-bearing loans and borrowings are subsequently measured at amortised cost using the effective interest rate method (EIR). Gains and losses are recognised in the income statement when the liabilities are derecognised as well as through the EIR amortisation process. Amortised cost is calculated by taking into account any discount or premium on acquisition and fees or costs that are an integral part of the EIR. The EIR amortisation is included in financial costs in the income statement.
Türkiye is considered a hyperinflationary economy for accounting purposes effective for 2022. This is mainly based on the fact that the cumulative inflation over three years exceeds 100 per cent. Consequently, the Group has applied IAS 29 ”Financial Reporting in Hyperinflationary Economies” from 1 January 2022 and onwards. Comparative figures are not restated.
IAS 29 requires the financial reporting of Jotun to be restated to reflect the current purchasing power at the end of the reporting period. For the income statement, all items are restated for changes in the general price index from the date of the transaction to the reporting date of 31 December, except for items related to non-monetary assets such as depreciation and consumption of inventories.
In the balance sheet, all non-monetary assets, such as property, plant and equipment and inventories, are restated to the current purchasing power as of 31 December using a general price index from the date when they were first recognised in the accounts. Monetary assets and liabilities are by their nature stated at their current purchasing power, and accordingly a gain/loss on the monetary net position from 1 January to 31 December is recognised as financial income or expense representing the gain/loss obtained from maintaining a monetary liability or asset position respectively during an inflationary period.
Hyperinflation adjustments have negatively impacted profit for the year with NOK 188 million, while a positive effect of NOK 319 million has been recognised in Other comprehensive income.
The cash flow statement is prepared to reflect cash flows during the year measured at the current purchasing power at the end of the reporting period and as such does not reflecting actual cash flows during the year.
Türkiye’s official inflation (CPI) for 2022 was 64.3 per cent.
Operating working capital revenue % = Back to contents >
The Group uses certain financial measures that are not defined in IFRS to describe the Group’s financial performance, financial position and cash flows. These financial measures may therefore be defined and calculated differently from similar measures in other companies, and thus not be comparable.
The performance measures set out below have been consistent over time and are some of the key indicators used in management reporting to monitor business performance.
The non-IFRS financial measures presented in the Annual Report are:
EBITDA: Profit before interest, income tax, depreciation and amortisation
EBITA: Profit before interest, income tax and amortisation
operating working capital x 100 Revenue from
contracts with customers
profit + amortisation of intangible assets x 100


Other comprehensive income to be reclassified to profit or loss in subsequent periods:

The financial statements for Jotun A/S have been prepared in accordance with simplified IFRS pursuant to section 3-9 of the Norwegian Accounting Act. This mainly implies that the financial statements are presented in accordance with IFRS, and the notes are presented in accordance with the requirements of the Norwegian Accounting Act. The accounting policies for the Group therefore also apply to Jotun A/S.
Line items in the notes named Jotun entities comprise subsidiaries, associates, and joint ventures.
Accounting policies estimates and judgements specific to Jotun A/S are incorporated into the individual notes.
For more information about accounting policies, see consolidated financial statement for the Group.
In preparing the company`s financial statements, Management makes various accounting estimates and assumptions that form the basis of the presentation, recognition, and measurement of the company`s assets and liabilities. See Note 1.3 to the consolidated statements.
No events have taken place after the balance sheet date that would have affected the financial statements, or any assessments carried out.
Other revenue includes among others royalty income, misc. grants and refunds and profit from sale of fixed assets.
Revenue from contracts with customers by segments
Payment terms are based on agreements and local business practices and are in general in the range of 30 to 60 days.
Jotun A/S has a system of annual bonuses that applies to senior management and is limited to a maximum of 20 per cent of annual basic salary. Further, all members of the management, including the President & CEO, are part of an annual profit-dependent bonus system limited upwards to 50 per cent of annual basic salary.
The company`s pension plans are primarily defined contribution plans. For further information, see Note 5.2.
For remuneration of President & CEO and Board of Directors, see note 5.3.
Intangible assets are non-physical assets that have either been capitalised through internal development of products (development cost), customisation of IT applications or separate acquisitions. See Note 3.2 to the consolidated financial statements for further information.
* Other consists mainly of product liability claims and losses on accounts receivable.
Property, plant and equipment comprise various types of tangible fixed assets needed. A major part of the amount reclassified from Construction in progress in 2021 relates to the upgrade of the factory in Sandefjord, Norway (ReVamp) which was finalised and taken in use in January 2022.
See Note 5.4 for Right-of-Use assets.
The change in allowance for bad debt is shown in the following table:
Ageing of accounts receivable as of 31 December was as follows:
* Allowances related to receivables from Jotun entities represent NOK 65 million (2021: NOK 39 million).
Prepaid dividends from associates or joint ventures are recognised as current liabilities until the final approval by the General Assembly in the following year. Other accrued expenses are related to commissions, bonuses to employees and other accrued expenses.
Product liability claims consist of several separate and specific guarantee claims arising from products sold. Assumptions used to calculate provisions for claims are based on technical assessments of product failures and the expected repair cost for each specific case.
In accordance with Jotun policies, claims should in principle be covered by customer-owner company. When a claim is caused by product or specification failure, costs will be reimbursed by Jotun A/S based on the prevailing royalty and CCA agreements.
Jotun A/S is through its operation exposed to environmental and pollution risk. Production facilities and product warehouse sites have been inspected regarding environmental conditions in the soil. For sites where clean-up costs are probable and reliable estimates of the costs have been made, provisions are recorded accordingly. Due to uncertainties inherent in the estimation process, it is possible that such estimates could be revised in the near term. In addition, further expenditures may arise as the full scope of conditions at some sites has yet to be determined. The related amount of potential, future costs is not determinable due to the unknown timing and extent of corrective actions which may be required. Jotun’s activities are carried out in accordance with local laws and regulations, and the Group’s HSE requirements. Changes in laws and regulations may require Jotun A/S to make investments and incur costs to meet future compliance requirements.
Jotun A/S has no significant contractual committed capital expenditures (CAPEX) at year end. For purchase of raw materials there are no actual commitments for the company. In general, these contracts can be terminated without significant penalties.
Jotun A/S has guarantees mainly covering tax withholding and other guarantees for subsidiaries. These amounted to approximately NOK 1 212 million in 2022 (2021: NOK 403 million).
The table below gives an overview of total net interest-bearing debt. Further information is given in Note 4.1 to the consolidated financial statements.
As of 31 December 2022 Jotun, A/S had NOK 2 515 million (2021: 2 000 million) of undrawn credit facilities available.
F
In July 2022, Jotun A/S sold its wholly-owned Russian subsidiary Jotun Paints LLC. A gain of NOK 39 million was recognised and reported as Other financial income.
Exchange gains and losses related to forwards and options have affected the net financial items with the following amounts:
The company’s financial risks and the management of these are in all material aspects identical to the disclosures made in Note 4.4 to the consolidated financial statements, unless otherwise stated below.
To reduce currency risk in cash flows, Jotun A/S uses currency options and forward contracts to ensure predictability in cash flows up to 16 months ahead. As of 31 December 2022, Jotun A/S has hedged 50 per cent of its next cash flow over the next 12 months.
The currency exposures related to external loans in foreign currency given to Jotun entities are disclosed in the table below.
In the following table reported income tax is reconciled with the calculated tax expense based on the Norwegian tax rate of 22 per cent. The main components are specified below.
expenses are primarily related to write-down of shares. See Note 5.6 for further information.
Jotun A/S has both defined contribution and defined benefit pension plans. The majority of the company’s pension plans are defined contribution plans, whereby the company’s obligation is limited to annual contributions to the employees’ pension plans. Costs related to the defined benefit plans account for less than five per cent of total pension costs in 2022.
The defined benefit schemes were replaced by defined contribution plans in 2004. Net pension obligations as of 31 December 2022 are primarily related to previous early retirement schemes for Jotun A/S’s senior executives.
Other severance schemes are obligations related to operating pension schemes for employees with an annual basic salary and pension base exceeding 12 times the basic amount (G).
The President & CEO is part of a pension scheme that includes a mutual opportunity to discontinue employment in whole or in part up to five years earlier than a stipulated retirement age of 67 years.
Jotun A/S has no obligation to give the President & CEO or the Chairman of the Board special remuneration upon discontinuance or change of employment or office. Should the President & CEO’s employment discontinue, his contract has a clause stipulating that a one-year “competition quarantine” may be imposed with compensation. The President & CEO has a notice period of six months.
Jotun A/S has not given any loans or guarantees to the President & CEO, the Chairman of the Board, or to any shareholders or members of Jotun A/S Management, the Board of Directors, or Corporate Assembly.
Shares controlled by members of the Board of Directors and Jotun A/S Management are specified in Note 5.8 in the consolidated financial statement.
Right-of-Use assets
Undiscounted lease liabilities and maturity of cash outflows:
classified as interest-bearing debt, see Note 4.1.
Two parties are deemed to be related if one party can influence the decisions of the other. During 2022, goods and services were purchased and sold to various related parties in which Jotun A/S holds a 100 per cent or less equity interest. Investments in subsidiaries are presented in Note 5.6, investments in associates and joint ventures are presented in Note 5.7 and shareholder and dividend information are presented in Note 5.8 to the consolidated financial statements.
The transactions between related parties are sales and purchases of finished goods, raw materials and technical services. Jotun A/S also has considerable royalty income from Jotun entities. Joint expenses are distributed in accordance with agreed cost contribution arrangements. Internal trading within the Group is carried out in accordance with arm’s length principles.
Purchases of services from the Group companies are mainly related to global and regional functions included in the cost contribution arrangement. In addition, Jotun A/S purchases research and development services from Jotun entities. Parts of the research and development costs are capitalised, see Note 3.1.
The amounts of these transactions are shown in the table below.
Intercompany balances are disclosed in the table below.
SHARES HELD DIRECTLY BY THE PARENT COMPANY
Below follows the specification of companies subject to write downs in 2022. Company (NOK million)
Jotun
assess the carrying value of investments in shares whenever events or changes in circumstances indicate that the carrying value of an investment may not be recoverable.
If the carrying value of an investment exceeds its estimated recoverable amount, an impairment loss is recognised in the income statement.
Jotun A/S reverse impairment losses in the income statement if and to the extent Jotun A/S has identified a change in estimates used to determine the recoverable amount.
Jotun A/S has sold its shares in Jotun Paints LLC, Russia. The profit is recognised in the income statement for 2022.
For further information regarding investments in associates and joint ventures, see Note 5.5 to the consolidated financial statements.
See Note 5.8 to the consolidated financial statements.
To the Annual Shareholders' Meeting of Jotun A S Opinion
We have audited the financial statements of Jotun A/S (the Company) which comprise the financial statements of the Company and the consolidated financial statements of the Company and its subsidiaries (the Group). The financial statements of the Company comprise the statement of financial position as at 31 December 2022 and the income statement, statement of comprehensive income, statement of cash flows and statement of changes in equity for the year then ended and notes to the financial statements, including a summary of significant accounting policies. The consolidated financial statements of the Group comprise the statement of financial position as at 31 December 2022 the income statement, statement of comprehensive income, statement of cash flows and statement of changes in equity for the year then ended and notes to the financial statements, including a summary of significant accounting policies.
In our opinion
• the financial statements comply with applicable legal requirements,
• the financial statements give a true and fair view of the financial position of the Company as at 31 December 2022 and its financial performance and cash flows for the year then ended n accordance with simplified application of international accounting standards according to section 3-9 of the Norwegian Accounting Act,
• the consolidated financial statements give a true and fair view of the financial position of the Group as at 31 December 2022 and its financial performance and cash flows for the year then ended in accordance with International Financial Reporting Standards as adopted by the EU.
We conducted our audit in accordance with International Standards on Auditing (ISAs). Our responsibilities under those standards are further described in the Auditor’s responsibilities for the audit of the financial statements section of our report. We are independent of the Company and the Group in accordance with the requirements of the relevant laws and regulations in Norway and the International Ethics Standards Board for Accountants’ International Code of Ethics for Professional Accountants (including International Independence Standards) (IESBA Code), and we have fulfilled our other ethical responsibilities in accordance with these requirements. We believe that the audit evidence we have obtained is sufficient and appropriate to provide a basis for our opinion.
Other information
Other information consists of the information included in the annual report other than the financial statements and our auditor’s report thereon. Management (the board of directors and the CEO) is responsible for the other information. Our opinion on the financial statements does not cover the other information, and we do not express any form of assurance conclusion thereon.
In connection with our audit of the financial statements, our responsibility is to read the other information, and, in doing so, consider whether the board of directors’ report contains the information required by applicable legal requirements and whether the other information is materially inconsistent with the financial statements or our knowledge obtained in the audit, or otherwise appears to be materially misstated. If, based on the work we have performed, we conclude that there is a material misstatement of this other information or that the information required by applicable legal requirements is not included, we are required to report that fact.
We have nothing to report in this regard, and in our opinion, the board of directors’ report is consistent with the financial statements and contains the information required by applicable legal requirements.
Management is responsible for the preparation and fair presentation of the financial statements of the Company in accordance with simplified application of international accounting standards according to section 3-9 of the Norwegian Accounting Act and of the consolidated financial statements of the Group in accordance with International Financial Reporting Standards as adopted by the EU, and for such internal control as management determines is necessary to enable the preparation of financial statements that are free from material misstatement, whether due to fraud or error.
In preparing the financial statements, management is responsible for assessing the Company’s and the Group’s ability to continue as a going concern, disclosing, as applicable, matters related to going concern and using the going concern basis of accounting unless management either intends to liquidate the Company or the Group, or to cease operations, or has no realistic alternative but to do so.
Our objectives are to obtain reasonable assurance about whether the financial statements as a whole are free from material misstatement, whether due to fraud or error, and to issue an auditor’s report that includes our opinion. Reasonable assurance is a high level of assurance, but is not a guarantee that an audit conducted in accordance with ISAs will always detect a material misstatement when it exists.
Misstatements can arise from fraud or error and are considered material if, individually or in the aggregate, they could reasonably be expected to influence the economic decisions of users taken on the basis of these financial statements.
As part of an audit in accordance with ISAs, we exercise professional judgment and maintain professional skepticism throughout the audit. We also:
• Identify and assess the risks of material misstatement of the financial statements, whether due to fraud or error, design and perform audit procedures responsive to those risks, and obtain audit evidence that is sufficient and appropriate to provide a basis for our opinion. The risk of not detecting a material misstatement resulting from fraud is higher than for one resulting from error, as fraud may involve collusion, forgery, intentional omissions, misrepresentations, or the override of internal control.
• Obtain an understanding of internal control relevant to the audit in order to design audit procedures that are appropriate in the circumstances, but not for the purpose of expressing an opinion on the effectiveness of the Company’s and the Group’s internal control.
• Evaluate the appropriateness of accounting policies used and the reasonableness of accounting estimates and related disclosures made by management.
• Conclude on the appropriateness of management’s use of the going concern basis of accounting and, based on the audit evidence obtained, whether a material uncertainty exists related to events or conditions that may cast significant doubt on the Company’s and the Group’s ability to continue as a going concern. If we conclude that a material uncertainty exists, we are required to draw attention in our auditor’s report to the related disclosures in the financial statements or, f such disclosures are inadequate, to modify our opinion. Our conclusions are based on the audit evidence obtained up to the date of our auditor’s report. However, future events or conditions may cause the Company and the Group to cease to continue as a going concern.
• Evaluate the overall presentation, structure and content of the financial statements, including the disclosures, and whether the financial statements represent the underlying transactions and events in a manner that achieves fair presentation.
• Obtain sufficient appropriate audit evidence regarding the financial information of the entities or business activities within the Group to express an opinion on the consolidated financial statements. We are responsible for the direction, supervision and performance of the group audit. We remain solely responsible for our audit opinion.
We communicate with the board of directors regarding, among other matters, the planned scope and timing of the audit and significant audit findings, including any significant deficiencies in internal control that we identify during our audit.
Oslo, 14 February 2023
ERNST & YOUNG AS
State Authorised Public Accountant (Norway)

Odd Gleditsch d.y., Chairman
Einar Abrahamsen
Terje Andersen
Nicolai A. Eger
Bjørg Engevik Nilsen
Jannicke Nilsson
Camilla Hagen Sørli
Per Kristian Aagaard
Bjørn Ekdahl, Chairman
Nils Andreas Arnesen
Terje V. Arnesen
Kornelia Eger Foyn-Bruun
Anne Cecilie Gleditsch
Bjørn Ole Gleditsch
Carl Erik Hagen
Knut Are Lohne
Thomas Ljungqvist
Siri Gilde Flenstad
Kari Lindtvedt
Jens-Erlend Thrana


Read more about Sustainability in the Jotun Group Report 2022.
Credits
The paper used to print this report has the Nordic Eco-labeling - the Swanand is also approved by the PEFC Council (Programme for the Endorsement of Forest Certifications schemes).
Copywriting: Alexander Wardwell / Blue-C AS Design: bk.no Print: bk.no