
Jonathan Hann | August 2019 | Fanshawe College Gaukel Corridor Master Plan

Capstone Report August HonoursFanshawe2019CollegeBachelor of Environmental Design & Planning Prepared by Jonathan Hann Supporting Faculty: Andrew Wilson Sara Bellaire Ben CorrineShellyWilliamEliRickMartinBillingsHealyOskirkoPaddlePolStephensonWilmink
Fanshawe College | August 2019 iii 1ContentsIntroduction 1 Project Background 1 Gaukel Street 1 2 Literature Review 3 Cities for People 3 Measuring Urban Design 4 A Pattern Language 5 Further Research 7 Literature Summary 8 3 Project Context 9 Site Context 9 Neighbourhood Context 17 Policy Context 24 4 Concept Ideation 26 Urban Design Measures 26 Site Analysis 55 Gaukel Street Alternatives 57 5 Master Plan 62 Overview 62 Gaukel Street 66 Victoria Park Entrance 70 Development Parcels 73 Urban Design Evaluation 75 6 Conclusion 77 7 References 78 List of Figures 79 List of Images 79 Appendix A 80 Urban Design Measurement Categories 80 Calculation of Results 81 Urban Design Measurement Results - Gaukel Street 82 Urban Design Measurement Results - Case Studies 83
Gaukel Corridor Master Plan | Jonathan Hanniv

Gaukel Corridor Master Plan | Jonathan Hann2 King St W GaukelSt Charles St W OntarioStS Joseph St DavidSt Halls LnKitchenerVictoriaParkCityHall Charles St Terminal Charlie West (Under Construction) DevelopmentPotentialParcel ParcelDevelopmentPotential Victoria Park ION ClockHistoricLRTTower PROJECT SITE AND SURROUNDING CONTEXT Figure 2:


Having established a research question, this section will explore the key themes related to urban design measurement and pedestrian-friendly design. The literature review will focus on three specific questions: What makes a city liveable and pedestrian friendly? How is that measured? What elements contribute the most to successful pedestrian environments? These questions will be answered by looking at three important works in the field of pedestrian level urban design, Jan Gehl’s Cities for People, Ewing & Clemente’s Measuring Urban Design, and Christopher Alexander’s A Pattern Language. The principles and measurements in these books will form the theoretical basis for this project. These ideas will also be supported by current research in the field of urban design, supporting and refining the theories and measurements for use on this project. Cities for People Cities for People (Gehl, 2010), gives a theoretical framework for transforming cities in a people-centred way. In the decades since the introduction of the automobile, city planning and design has favoured the needs of cars to the detriment of the human dimensions. Gehl laments that increased use of cars in cities has “reduced, threatened, or phased out” (2010, p. 3) the traditional role of the public realm as a meeting space. This has led to social isolation and a limiting of shared experiences. As the world’s population shifts from rural to urban living, the design of cities needs to turn its attention back to the human dimension. Gehl suggests four principles that together create an invitation to use and congregate in public spaces. By improving conditions necessary for public life, new patterns of use and activity will be generated, and the city will be given new life. Gehl’s four principles are A Lively City, A Safe City, A Sustainable City, and A Healthy City. A Lively City
A Safe City
The first principle acts as a starting point for the other three. Creating a lively city involves creating opportunities and invitations to walk, bike, and stay in public space. This is achieved through concentrating activity in a hierarchy of suitable spaces that are connected by short, logical routes. These spaces should be filled with areas for sitting and standing and be defined by what Gehl calls ‘soft edges’, which define the space but also allow for porosity and interaction between the public and private realms. The space should also be filled with details and that are meant to be experienced up close to encourage people to slow down and linger. Finally, liveliness is more than just density or quantity. The design should suggest that an area is popular and inviting through variety, complexity, and developing a critical mass of people.
As car use has grown around the world, it has consumed increasing amounts of space within the city structure, often to the detriment of pedestrians and cyclists. While cities like New York and Copenhagen have seen dramatic shifts in transportation planning in the past two decades, many cities still operate under the assumption that vehicle movement is the top Whenpriority.areas are not perceived as safe, the human response is to retreat into private, fortified spaces, such as gated communities. However, this creates places that are void of public life and further reinforces the perception that the area is unsafe. Increasing the liveliness and use of the space has the opposite effect. The presence of people indicates to others that a space is safe and adds to the safety by increasing the ‘eyes on the street’. Extending the invitation to walk through a space can be accomplished through the design of the streetscape, such a slowing down traffic or adding additional lighting, or by indicating the presence of life in the adjacent buildings. Lights
Fanshawe College | August 2019 3 2 Literature Review
“People come where people are” (Gehl, 2010, p. 65), and creating concentrations of activity will allow the edges to fill into a space and create a self-perpetuating cycle of liveliness.
Measuring Urban Design
The transportation sector is a significant consumer of energy and producer of pollution, accounting for approximately 28% of emissions in the United States (Gehl, 2010). By contrast, walking and cycling use 20 and 60 times less energy, respectively, to travel the same distance, and contribute no emissions. Pedes trians and cyclists also require far less space when travelling, with a typical bike path carrying five times the volume of a typical urban vehicle lane and one parking space fitting 10 bikes. Redesigning trans portation corridors to prioritize walking and cycling can have significant environmental impacts and can contribute to the liveliness of cities. In addition to pri ority, Gehl stresses that the quality of the journey is also important, particularly when encouraging users to utilize public transit. Designing neighbourhoods that are transit-oriented and provide easy access to transit facilities will encourage ridership. Walking and biking can also increase social sustain ability. If the user is able to access the city without a car and the public spaces are designed to be inviting, there is a greater chance for social interaction, either planned or by chance. This will also enable those of different socio-economic groups to meet their daily needs and interact with those outside of their social circles, increasing overall social cohesion.
A Sustainable City
A Healthy City
Jonathan Hann in apartment windows and ground floor units with soft, transparent edges create the impression that people are nearby and makes an area more inviting.
The current car-centered design of cities lacks nat ural opportunities to exercise as part of a daily rou tine. This is a significant factor in rising obesity levels around the world, where as much as one quarter in the UK and one third in Mexico and Saudi Arabia are considered obese. While some have taken to delib erate exercise, such as going to the gym or joining a sports team, this requires an investment in time and money that many are not able to make. The solution that Gehl proposes is to redesign the city to invite people to walk and bike as part of their daily routine. Simple initiatives such as broader side walks, shade trees, and improved street crossings re move the barriers to walking and make the choice a more attractive one. Gehl suggests starting with the shortest and most attractive routes first to build a base network and create the critical mass mentioned in previous principles.
Ewing and Clemente (2013) approach the issue of walkability and street attractiveness from a data driven perspective. Previous studies into pedestri an activity have focused on the surrounding spatial context by measuring qualities such as density or connectivity. However, these studies have failed to capture the perceptual and experiential qualities that influence pedestrian travel, both for work and leisure purposes. Measuring Urban Design (Ewing & Clemente, 2013) focuses on defining protocols that can quantify and operationalize these subjective qualities. The book introduces definitions and proto cols for five measurements: Imageability, Enclosure, Human Scale, Transparency, and Complexity. The methods are tested using block faces in New York City’s five boroughs and validated through statistical models that determine the significance of each mea surement on pedestrian activity. The block face re sults were also controlled using five spatial variables (‘D’ variables) that have been shown to affect overall pedestrian counts: development density, land use diversity, street connectivity, destination accessibility, and distance to transit. The book finishes with a field manual that outlines the measurement protocols for each of the five categories.
Imageability Similar to Gehl’s (2010) Lively City principle, image ability is seen as the net effect of the other four measurements. It is defined as the level to which a place is distinct or memorable and its ability to evoke feelings or create an impression. Streetscapes with high Imageability can improve the physical and psy chological well-being of people who frequent them.
Gaukel
4
Corridor Master Plan |
Summary Gehl’s four principles address the interconnected ness of city design and pedestrian activity. Giving pri ority to pedestrians and cyclists within the city can improve many other aspects of life, such as safety, the environment, and personal health. It is essential to establish a physical framework within city spaces that invites people to walk and bike as part of their daily routine.
One significant shortcoming of the urban design measures developed by Ewing and Clemente (2013) is the lack of consideration for the placement of el ements within the streetscape. The measurements instead rely on counts and percentages for the block face as a whole. To make up for this, the design de tails in A Pattern Language (Alexander, 1977) will be used to inform the placement, orientation, and spe cific layout of the spaces and furniture.
A Pattern Language
Complexity As an extension of human scale, complexity takes into account the visual richness of a space and the rate at which the elements are perceived. As a slow er moving form of transportation, pedestrians prefer more complex environments than drivers. Not only does this keep the brain stimulated and hold the pedestrian’s interest, it also serves to divide up the street in smaller, more easily digestible spaces and reduce the perceived distance travelled. Building sig nage acts as a significant contributor to complexity at the street level, as do other people, whose motion through the space adds additional complexity to the streetscape.
Fanshawe College | August 2019 5
Alexander’s seminal work organizes the elements that make up cities, spaces, and buildings into a se ries of 253 interrelated patterns. The patterns are presented from largest to smallest and each contain a problem statement, solution, and list of larger and smaller patterns that are essential for the success of the current pattern. By combining related patterns, the designer can construct a customized, contextu al solution and ensure that is relevant at all scales. For this specific project, 12 patterns were selected to inform the design, and are listed below in the order presented in the book.
Transparency Building on the Gehl’s (2010) Safe City principle, transparency measures the ability to perceive hu man activity beyond the edge of a public space. Ground floor windows allow sight into adjacent build ings, while numerous entrances and active uses give the perception of human activity, even if that activi ty goes unseen. Trees can have a mixed effect, with high canopies allowing longer sight lines and smaller trees blocking vision and closing off a space. While transparency is usually measured in urban design guidelines as simply the percentage of ground floor windows, it is important to incorporate the other el ements as well.
Enclosure Enclosure measures how much streets and pub lic spaces are defined by vertical elements such as buildings, walls, and trees. These vertical elements block long sight-lines and create a defined, roomlike space. Breaks in the street wall, inactive uses, and large building setbacks disrupt the sense of enclosure and can lead to dead space. At the ends of streets, closed vistas with landmark buildings can also add to the feeling of enclosure.
Human scale measures the proportion of streets cape elements relative to the size and speed of pe destrians. An abundance of street furniture, including planters, seating, lighting, and signage, break up the space in smaller rooms, while lower building heights and transparent first floor windows make sure the street isn’t overwhelmed by large blank walls. Street trees can also help to create a pedestrian scaled can opy, moderating other large elements, such as wide streets and tall buildings.
Human Scale
Implications Through the evaluation of the five measurement categories, Ewing and Clemente (2013) found that transparency was the most significant measurement in predicting pedestrian activity and was more signif icant than the spatial ‘D’ variables. Human scale was also positively related to pedestrian counts, while imageability, complexity, and enclosure were not re lated to pedestrian counts when controlling for the ‘D’ variables. The authors acknowledged that the limitations of their study may have affected the results. New York City is a unique case in North America and is over whelmingly urban with a high pedestrian modal share. The reliability of the pedestrian counts was also limited by the number of counts and lack of control for time. Despite these limitations, the book presents a compelling set of measurement tools for quantifying the perceptual qualities driving pedestri an activity and will form an essential framework for the development of this project.
In order to make streets that invite a user to stay, a path should bulge at points of interest and narrow in between. This creates a sense of enclosure within the middle and reinforces the concept of the out door room by creating positive space.
Activity in public spaces naturally forms first at the edges before spreading into and filling the centre. By creating a series of scallops or small activity pock ets along the edges, the designer can encourage the formation of small activity zones within a space. These zones will naturally grow as density and activi ty increase. Building activity zones that reach forward into the space will further contribute to the liveliness by increasing the available edge space and decreas ing the leftover centre space between zones.
Creating spaces for people to meet with others and stay comfortably for a long period of time is essen tial for Gehl’s (2010) Lively City principle. Alexander (1977) suggests accomplishing this by creating out door rooms within public spaces, partly enclosed areas adjacent to pathways and activity zones that allow visitors to slow down and interact with each other.
Pedestrian Density
Through researching public spaces around the world, Alexander (1977) has developed a simple rule of thumb to ensure the liveliness of a particular pe destrian space: allowing for 150-350 sq feet (14-29 sq m) per person. This involves estimating the ap proximate number of people that are expected to use a space at any given moment and calculating the required space. This process reduces the likelihood of creating a space that feels deserted and ensures a critical mass of people that are essential for Gehl’s vision of liveliness.
Positive Outdoor Space
Public squares are important for the public gather ing of a town, but need to be appropriately scaled so as not to feel deserted. A general width of 45-60 feet (14-18m) is suggested to maintain a feeling of comfort and high pedestrian density. This is related to pattern 123 below and also to human physiology. 70 feet (21m) is the approximate distance at which a face becomes recognizable and that a loud voice can just be heard. If the maximum distance between two points in a square is below this distance, visitors are able to interact no matter their location within the space.
Small Public Squares
Public Outdoor Room
Pedestrian Street Alexander (1977) recognizes that an important fac tor in social cohesion is the chance interactions that happen at the scale and speed of the pedestrian. In order to facilitate this, this pattern creates small pe destrian streets that capture the outdoor circulation between buildings. Heights that are approximately equal to street width are important to create a com fortable atmosphere, and frequent street crossings and building entrances will help to generate life and activity within the space.
Activity Pockets
This pattern says that outdoor spaces need to be specifically designed and not simply the leftover space between buildings. Spaces should be in the shape of a room and enclosed by boundaries, either in the form of buildings, planting, or other vertical el ements. A space that is overly negative, or open, will lack the feeling of comfort and security that a posi tive space possesses. Paths and Goals Alexander (1977) suggests that when walking, a pedestrian chooses a route that incorporates a se ries of intermediate goals, instead of a direct path from start to finish. As the current goal grows close, a subsequent goal further downstream is chosen and the path naturally flows towards it. By placing goals at natural points of interest, and then placing paths between them, the designer can create a path network that is comfortable and stimulating for the user. Alexander (1977) suggests not more than a few hundred feet between goals in order to maintain an appropriate level of interest. Path Shape
Gaukel Corridor Master Plan | Jonathan HannPromenade6 Alexander (1977) suggests the use of a promenade at the centre of the community to link major activity nodes. Having main points of attraction at opposing ends of the promenade is essential to ensure a con sistent flow of movement up and down the corridor.
Placing a feature of interest in the centre of a space will naturally draw people into the space and create a focal point. Alexander (1977) suggests placing the paths first and fitting the focal point into the space between them, resisting the urge to place the fea ture directly in the centre.
Seat Spots
Something Roughly in the Middle
Fanshawe College | August 2019 7
Tree Places
The previous literature by Gehl (2010) and Ewing & Clemente (2013) both underscored the importance of including trees in a public space. Alexander (1977) takes this a step further and suggests that trees can be used to create a wide variety of spaces and should be planted to take advantage of their specific spatial qualities. This can take the form of an umbrella (sin gle tree canopy), pair (two trees forming a gateway), grove (cluster of trees), square (surrounding and enclosing an open space), or avenue (promenade formed by double row of trees).
Contrary to Ewing & Clemente’s (2013) findings in New York City, Ameli, et al. (2015) found that image ability had an influence on pedestrian route choice in Salt Lake City. Clean, well-maintained streetscapes were preferred by pedestrians (Hahm, Yoon, & Choi, 2019) and high aesthetic value not only influenced route choice, but also increased the prevalence of walking for recreational purposes (Jung, Lee, Kim, & Lee, 2017). Human scale was also found to be significant in sub sequent studies by Ewing, et al. (2015), however if other streetscape factors and ‘D’ variables were not addressed, the presence of street furniture alone was not a guarantee of pedestrian activity. Complexity and enclosure were not found to be significant in relation to pedestrian levels (Ameli, Hamidi, Garfinkel-Castro, & Ewing, 2015), however enclosure was a significant influence on the percep tion of safety (Harvey, Aultman-Hall, Hurley, & Troy, 2015). In measuring enclosure, Harvey, et al. (2015) found that the proportion of street width to building height was more important than the actual values and that the physical presence of buildings had a greater influence on safety than the appearance and perceived socio-economic status of the surrounding neighbourhood. Greater separation between pedes trians and vehicles also led to increased safety and increased pedestrian traffic (Hahm, Yoon, & Choi, 2019). Finally, Rodriguez, et al. (2015) found that pe destrians would be willing to take a longer route to a destination in order to avoid areas that were per
The final pattern states that seating needs to be placed with regard to climate and activity in order to be inviting for users. Seating should face activity, be protected from the wind in cooler climates, and be open to the south for sun exposure during colder months. Summary These 12 patterns provide simple solutions to the specific design problems encountered when design ing a vibrant public space. Incorporating the patterns in conjunction with Gehl’s (2010) principles and Ew ing & Clemente’s (2013) measurements will ensure that the design of the Gaukel corridor is truly pedes trian friendly.
Further Research
In addition to the theory and evidence detailed above, the current research in the field of urban design has demonstrated that the design of the built environ ment will influence people’s choice and contribute to the level of pedestrian activity (Yin, 2015). The ‘D’ variables (development density, land use diversi ty, street connectivity, destination accessibility, and distance to transit) have a significant relationship to pedestrian levels (Jung, Lee, Kim, & Lee, 2017), with land use diversity, density, and distance to transit as the most significant (Ameli, Hamidi, Garfinkel-Castro, & Ewing, 2015). In addition, a greater proportion of retail on a particular block face contributes to high er pedestrian activity levels when compared with an equal proportion of residential, retail, and office uses (Ewing, Hajrasouliha, Neckerman, Purciel-Hill, & Greene, 2015). After controlling for the ‘D’ variables, streetscape de sign also has a significant influence on pedestrian activity (Ewing, Hajrasouliha, Neckerman, Purciel-Hill, & Greene, 2015). Of the five design categories test ed by Ewing & Clemente (2013), transparency was the most important, even after controlling for the presence of retail frontages (Ameli, Hamidi, Garf inkel-Castro, & Ewing, 2015). This suggests that in creased transparency can have a mitigating effect on areas of lower retail use.
Summary While each of the ‘D’ variables and urban design measures makes an important contribution to the public realm, the variables can not be improved in isolation (Ameli, Hamidi, Garfinkel-Castro, & Ewing, 2015). Projects and developments need to happen with regard to the local context and be treated as parts of a greater whole in order to see real improve ments.
Improving the pedestrian realm is the key to accom plishing the goals of all of the literature reviewed above. As Gehl (2010) suggests, it is important to cre ate lively, safe environments that extend an invita tion to participate in walking and cycling and enable people to live sustainable and healthy lives. Lively and safe environments are self-perpetuating once a critical mass of activity has been reached, but an ini tial catalyst is needed to begin the process. Street re design projects have been shown to increase pedes trian volumes, creating a more pleasant experience and encouraging people to choose that street more often and stay longer when there. A well-designed, pedestrian focused streetscape will also improve the adjacent properties, increasing the surrounding ‘D’ values by encouraging development and retail presence. A comprehensive approach to pedestri an improvements, combining streetscape elements and policy that encourages development, will create a lively, safe city that enables active transportation.
Literature Summary
Repurposing road space for people also provides health and environmental benefits, providing oppor tunities for physical activity and mitigating air pollu tion, noise, and the urban heat island effect. (Nieu wenhuijsen & Khreis, 2016)
In addition to the specific streetscape elements that affect pedestrian levels, streetscape improvement projects can be a catalyst for the improvement of the surrounding neighbourhood. Nieuwenhuijsen & Khreis (2016) found that improvements to public space can boost pedestrian activity by up to 40% and projects related to walking and cycling increased re tail sales by 30%. This was confirmed through the re design of King Street in Downtown Kitchener, which saw 13 new businesses opening, 1626 new residen tial units under way or in planning, and a tripling of the pedestrian count in the two years following the project’s completion (The Province of Ontario, 2013).
Gaukel Corridor Master Plan | Jonathan Hann8 ceived as unsafe.
While increased pedestrian activity levels are pos itive, it is also important to provide places to rest within the design of a streetscape (Hahm, Yoon, & Choi, 2019). The distance from transit stops is a sig nificant ‘D’ variable in predicting pedestrian volume, however, Hahm, et al. (2019) found that transit rid ers moved quickly between stations and adjacent districts and did not automatically linger within retail areas.
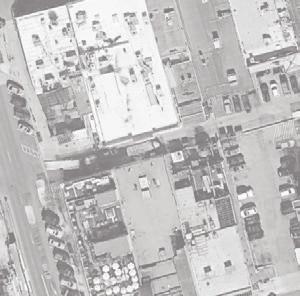
The site is surrounded by a mix of low-rise buildings and parcels with no development, including parking lots and Victoria Park. The Gaukel corridor is divided into two distinct sections, north and south of Charles St W (see Fig. 4). At its northern end, Gaukel St terminates at King St W, Kitchener City Hall, and Carl Zehr Square. The square is undergoing a planned retrofit to repair and replace infrastructure components at their end of their life cycle and to update the appearance and functionality of the space. King Street West is the central commercial street in Kitchener and Carl Zehr Square functions as its ceremonial centre. The northern block includes a mix of historic and new buildings, with a 31 storey residential tower, Charlie West, currently under construction on the north-west corner of Gaukel St and Charles St W. The majority of the buildings are built with a zero setback and contain residential, commercial, and office uses. The block is bisected by Halls Lane, a small one-way lane that provides servicing and parking access for buildings fronting on King St W and Charles St W. The southern block is characterized by large paved areas and a lack of development. The 44 Gaukel arts hub is the only building fronting onto Gaukel St along this stretch, which is dominated by the Charles Street Terminal. The southern end terminates at the entrance to Victoria Park. The entrance includes a small plaza framed by a quasi-historic wall. Beyond the plaza are gardens and a small open lawn with a number of paved paths leading to the historic City Hall clock tower and the remainder of Victoria Park.
King St W GaukelSt Charles St W OntarioStS JosephDavidStSt WaterStS QueenStS CollegeSt AveRichmond OpenInstutitionalCommercialResidentialSpaceFigure 4: EXISTING LAND USE
Gaukel Corridor Master Plan | Jonathan Hann10Existing Built Form
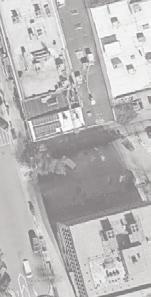
Fanshawe College | August 2019 11 Image 2: Gaukel St looking south from City Hall Image 3: Closure for Construction Image 4: Charles St Bus Terminal from Gaukel St Image 5: Victoria Park entrance and historic clock tower at Gaukel St and Joseph St Image 6: Existing parking lot at Gaukel St and Joseph St Image 7: Existing parking lot at Joseph St and David St


5:
Gaukel Street is a Local Street with a 15m right of way north of Charles St W and a 20m right of way south of Charles St W. The street has two wide vehicle lanes with no on-street parking. To the north, the sidewalk on either side is buffered by a small 1m furniture strip, consisting of trees in protective cages, historic lampposts, benches, and bike racks (see Fig. 5). Buildings front directly onto the street with no setbacks. There are two small parking lots at the intersection of Gaukel St and Halls Ln that provide parking and delivery access to the properties at the corner of Gaukel St and King St W (currently Starbucks and Pizza Pizza). The future parking garage at the Charlie West development is designed to be accessed from Halls Ln, with outbound traffic flowing towards Gaukel St. To the south, the western sidewalk is buffered by large planting beds with trees, interspersed with historic lights and benches (see Fig. 6). The building at 44 Gaukel is built with a minimal setback and frames the northern portion of the block. A landscaped strip separates the sidewalk from the existing parking lot to the south of 44 Gaukel. The eastern streetscape is compromised by the presence of the Charles Street Terminal. The bus entrance to the terminal occupies the majority of the street frontage and, while a sidewalk is provided, there is nothing to buffer pedestrians from the vehicle lanes or bus bays. There is a small plaza and fountain at the northern end of the block and a small landscaped buffer and seating area at the south. In addition, a rainbow crosswalk has been painted across Joseph St, leading into Victoria Park. Looking east at Halls Ln and Gaukel St Looking west at Halls Ln and Gaukel St
Image 9:
Gaukel Corridor Master Plan | Jonathan Hann12Existing Streetscapes & Circulation
Image 8:
Figure NORTH BLOCK


Fanshawe College | August 2019 13 Gaukel S Image 10: Looking west at Halls Ln and Gaukel St Image 11: Existing streetscaping on the south block Image 12: Street interface along bus terminal edge Image 13: Existing streetscaping on north block Figure 6: SOUTH BLOCK


Gaukel Corridor Master Plan |
Charles St W is a Regional Road with two vehicle lanes, a centre turn lane, and a single LRT track. This southbound/eastbound track is located between the eastbound vehicle lane and the sidewalk and is buffered by a small furniture strip with street lights. The Victoria Park LRT stop, located to the west of Gaukel St, is integrated with the southern sidewalk. The northern sidewalk is curb side, and generally extends to the building face.
Image 14: King St W at City Hall
Image 17: Victoria Park LRT stop
Image 15: Joseph St looking east towards Gaukel St
Joseph Street is a Major Community Collector with two lane vehicle lanes and on-street parking on alternating sides. The sidewalk is buffered by a mix of sod, planting, furniture strips with historic lighting, and on-street parking. At the entrance to Victoria Park, the sidewalk is integrated with the entrance plaza and pathways, allowing easy access to the park.
Image 16: Charles St W looking west towards Gaukel St
Jonathan Hann14 King St W was reconstructed in 2009 to provide a more pedestrian friendly streetscape. It is classified as a City Arterial and has two vehicle lanes, generous sidewalks, and flexible zones that can serve as onstreet parking, patio space, or additional sidewalk.


ContoursNon-permeable(1m) Figure ENVIRONMENTAL7: CONTEXT
There are street trees along Gaukel St and Joseph St, with tree density rates comparable to the average for the surrounding neighbourhood. The Victoria Park neighbourhood to the south is one of the oldest in the city and is filled with large, mature trees that provide significant canopy coverage. By contrast, the downtown has very few trees, particularly along Charles St W. The majority of the existing downtown trees are relatively small, either because of their age or from lack of sunlight and soil capacity stunting their growth.
Existing Topography and Vegetation
Fanshawe College | August 2019 15
The site slopes gently towards the south and west, falling approximately 5m from the north end of Gaukel St and the eastern end of the bus terminal towards the low point at Gaukel St and Joseph St (see Fig. 7). The steepest incline occurs on Gaukel St between King St and Halls Ln, falling 4m in approximately 60m. Overall, these grades do not have a significant impact on the development of the site, however the steeper grade at the north end of Gaukel will prevent the establishment of large seating areas or patios, being too steep for tables and too shallow for tiered seating.
The vast majority of the site is covered with buildings or impermeable hardscape in the form of asphalt roads, parking, and concrete sidewalks. However, the area south of Joseph St along the Victoria Park frontage represents the opposite condition, with the majority of the area being sodded or planted.


Gaukel Corridor Master Plan | Jonathan Hann16 Significant Tree Species Site Gingko biloba (Gingko) 20.2% Quercus rubra (Northern Red Oak) 15.5% Ulmus sp. (Elm) 14.3% Acer saccharinum (Silver Maple) 10.7% Acer rubrum (Soft Maple) 9.5% Total Species 17 Study Area Acer saccharum (Sugar Maple) 11.4% Acer platanoides (Norway Maple) 7.8% Thuja occidentalis (Northern White Cedar) 3.6% Gingko biloba (Gingko) 3.4% Pinus nigra (Austrian Pine) 3.4% Total Species 135 Tree Density Site Gaukel St 100-188/km Charles St W 0/km Joseph St 0-120/km Ontario St 0/km Surface Coverage Site Impermeable 76.2% • Building 5.7% • Pavement 70.5% Permeable 23.8% Image 18: Existing gardens and water feature surrounding clock tower Image 19: Main Victoria Park lawn with surrounding mature tree canopy Image 20: Impermeable surfaces along Gaukel St


Fanshawe College | August 2019 17
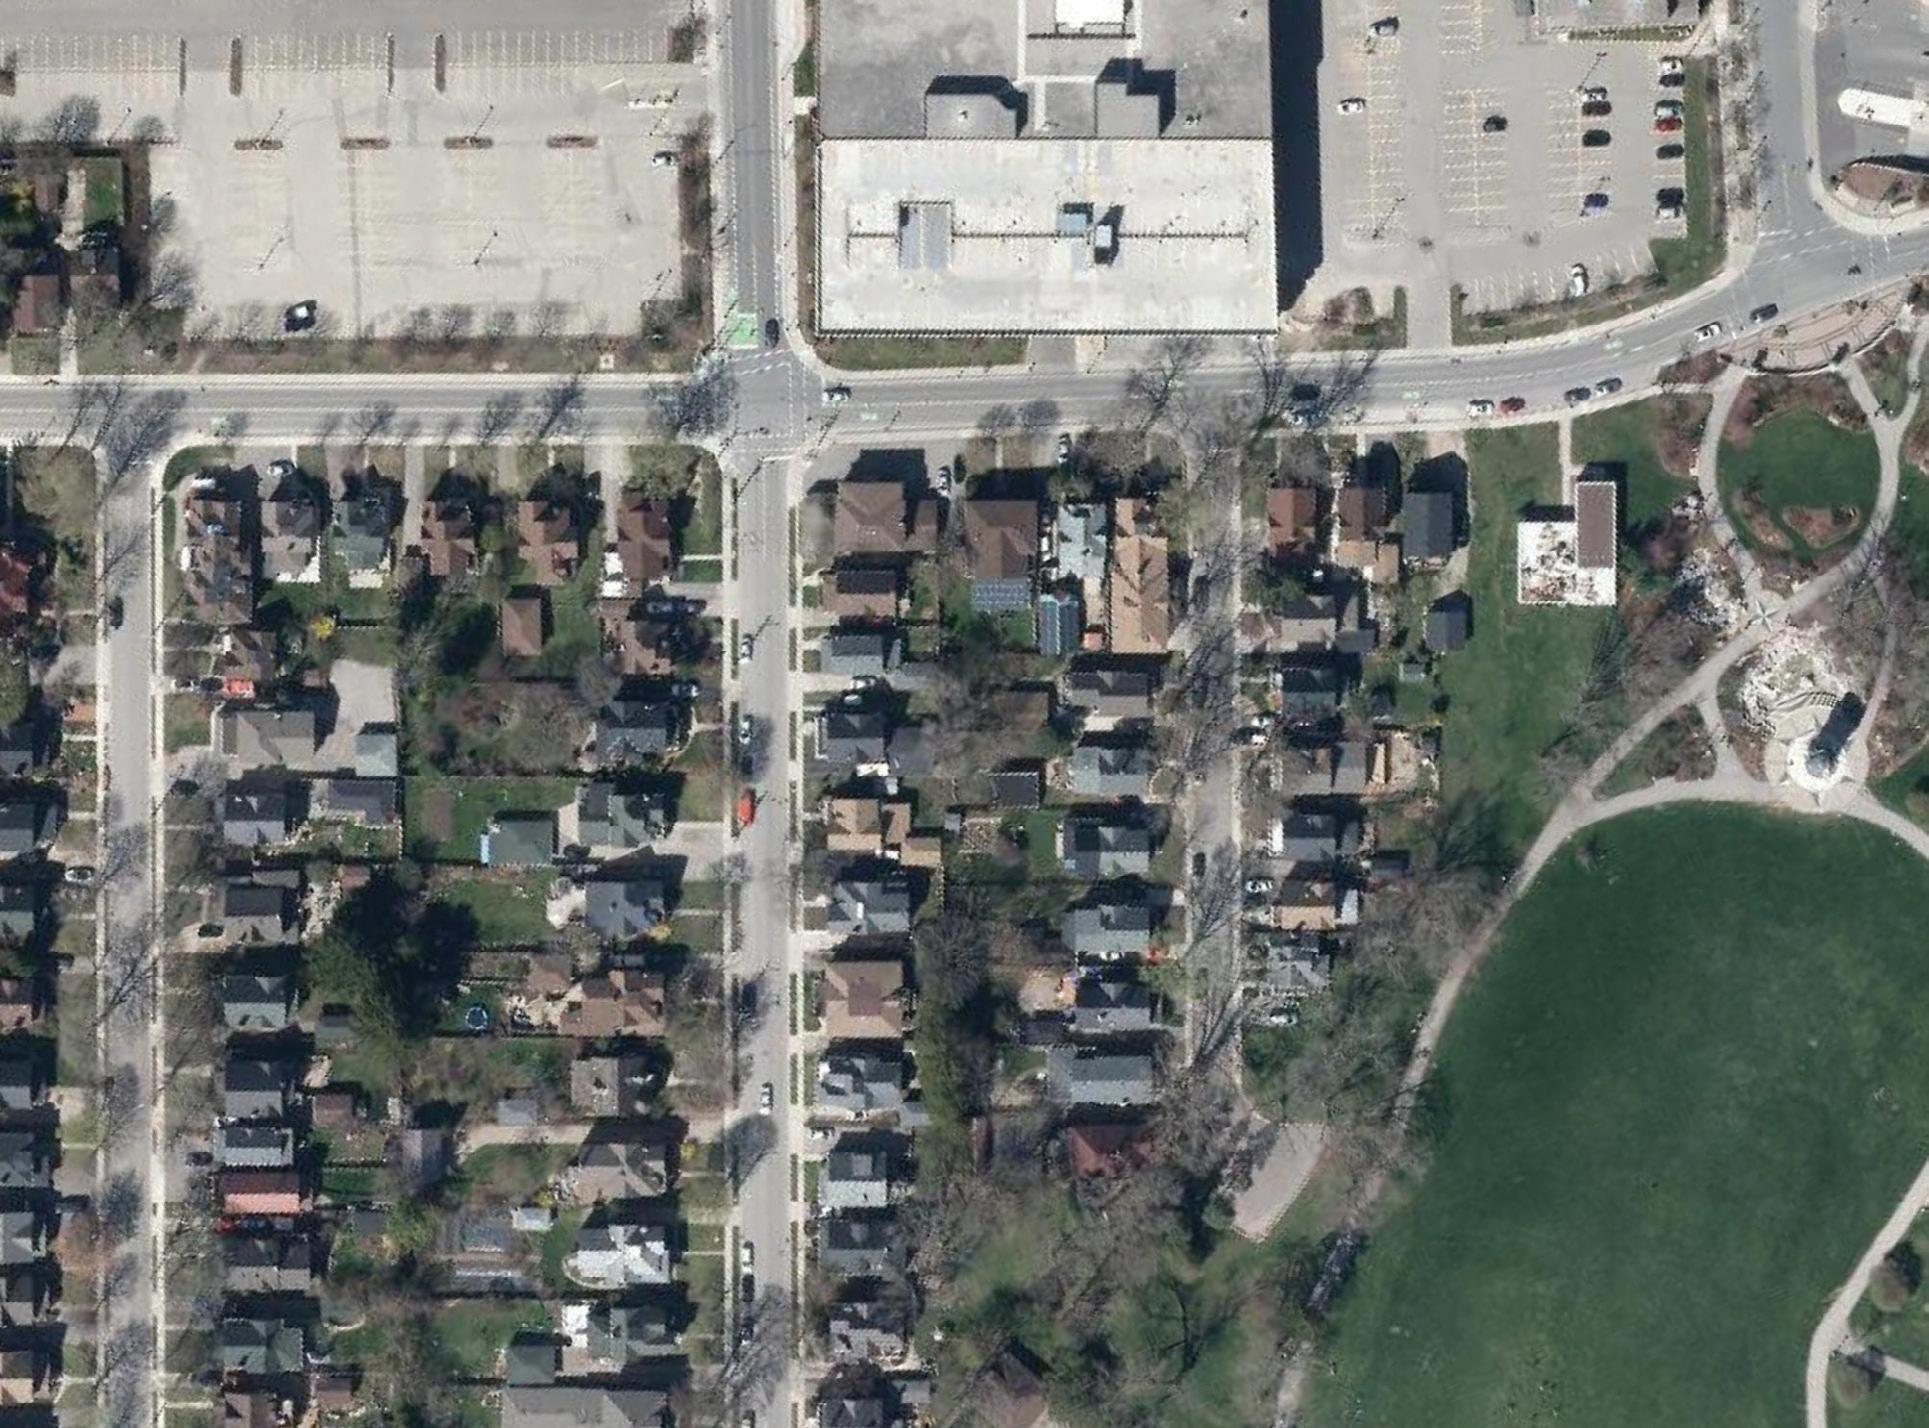
The subject site straddles the boundary between downtown Kitchener and the Victoria Park neighbourhood to the south. Downtown Kitchener is the main commercial and institutional hub in the city and includes many regional destinations such as City Hall, Victoria Park, Kitchener Market, Centre in the Square, the Central Branch of the Kitchener Public Library, and the Downtown Community Centre. King St is characterized by low to mid rise buildings with retail storefronts, while the surrounding streets have a mix of retail, office, residential, and undeveloped surface parking lots (see Fig. 8). Building heights within downtown vary from 1 to 30+ storeys, with the majority of buildings being low and mid-rise less than 8 storeys (see Fig. 9). Several recent development projects, such as the Charlie West development at 31 storeys, have added significant height to the downtown.
Residential Commercial Institutional Industrial Open Space LAND USE BUILDING HEIGHT 1-3 Storeys 4-9 Storeys 10-15 Storeys Over 15 Storeys King St W QueenStN VictoriaStS Courtland Ave E King St W QueenStN VictoriaStS Courtland Ave E Figure 8: Figure 9: Image 21: City Hall and Zehr Square Image 22: Kitchener Public Library, Main Branch
Neighbourhood Context Built Form, Land Use, Heritage


with
10). The
trees,
Central Kitchener is home to many historic the Victoria Park and City (see Fig. downtown has a mix the Walper Hotel and The Tannery standing
Centre Heritage Conservation Districts, as well as many Part IV and listed buildings
of new and historic buildings, with
The downtown quickly gives way to residential areas at its edges, primarily single detached dwellings in the Victoria Park, Cedar Hill, and City Centre neighThese areas are characterized by large historic homes with minimal setbacks mature and the occasional mid-rise or high-rise infill apartment, typical of older North American cities.
bourhoods.
and
buildings, including
out as two significant examples of historic preservation VictoriaStS HERITAGE PROPERTIES Listed Part IV Part IV & V Part V King St W QueenStNCourtland Ave E Figure 10: Image 23: Historic houses surrounding Victoria Park Image 24: Walper Hotel Image 25: Tannery technology hub
Gaukel Corridor Master Plan | Jonathan Hann18


Fanshawe College | August 2019 19 Social & Economic Central Kitchener is relatively dense for a mid-sized city, with between 75 and 205 people and jobs per hectare surrounding the subject site (see Figs. 11 & 12). Businesses in downtown are generally clustered along the King St corridor to the north of the site, with some additional concentrations along Victoria St, Ontario St, and Queen St. The study area surrounding the site is well serviced by businesses, with a mix of retail, food and beverage, service, and professional offices In recent years, there has been a significant amount of development activity, both in the residential and commercial sectors. However, even with this activity, the downtown still has relatively low residential density. There is continued interest in the redevelopment of downtown Kitchener, both from the city and from land owners, and significant intensification is expected in the coming years. POPULATION AND BUSINESS DENSITY Density (people & jobs per hectare) 0-50 51-100 101-150 Over 150 Business Retail Food & Accommodation Arts & Entertainment Other King St W QueenStN VictoriaStS Courtland Ave E POPULATION DENSITY Density (people per hectare) 0-50 51-100 101-150 Over 150 King St W QueenStN VictoriaStS Courtland Ave E Figure 11: Figure 12: Image 26: Businesses along King St Image 27: Development activity in downtown


Gaukel Corridor Master Plan | Jonathan Hann20 Downtown is also host to many events and festivals, with City Hall and Victoria Park playing a major role as host locations (see Fig. 13). Events take place throughout the year, including RibFest and BluesFest in the summer, Oktoberfest in the fall, and Christkindl Market in the winter. These events saw 585,000 attendees in 2015, with approximately half of the visitors at City Hall alone. In addition to the large festival areas at City Hall and Victoria Park, downtown has several smaller urban squares that could potentially host events, such as Francis Green, Vogelsang Green, and the Cenotaph. Overall, downtown Kitchener has a lively event culture and is well serviced by various venues and spaces. OktoberfestNight/ShiftFall Christkindl Market New Year’s OutdoorHockeytownEveSkatingWinter King Streatery Food Truck Festival Summer Lights Festival KW Multicultural Festival Canada Day Discovery Square Kultrun World Music Festival Crusin on King Street Rock and Rumble Rib & Craft Beer Fest Kitchener Blues Festival Art Market Yoga in the Park Summer Twilight Grand Prix Cinco de BikeFestMayoTri-PrideSpringDOWNTOWN EVENTS VictoriaPark SquareZehr KingStreetFlex Figure 13: Image 28: Crowds gathered at King St W and Gaukel St for Blues Fest DOWNTOWN ACTIVITY SPACES


Fanshawe College | August 2019 21
Circulation The grid structure of downtown Kitchener affords a high level of pedestrian connectivity to the study areas (see Fig. 14). The site is well connected to its surrounding neighbourhood and is not in need of structural connectivity improvements. To the south, Victoria Park boasts an extensive pathway network and a connection to the Iron Horse Trail, a major active transportation corridor that links central Kitchener with Uptown Waterloo. Apart from the Iron Horse Trail, there is limited cycling infrastructure in central Kitchener, with the majority of routes delineated by sharrows. A new Cycling & Trails Master Plan is currently underway and is expected to include improvements to the cycling network within the study area.
PUBLIC TRANSIT ION LRT iXpress GRT Local GO Train King St W QueenStN VictoriaStS Courtland Ave E TransitFutureHub ACTIVE TRANSPORTATION Bike Lane Sharrow Multi-Use Trail Sidewalk 800m Walkshed King St W QueenStN VictoriaStS Courtland Ave E Iron Horse Trail Image 29: ‘Super Sharrows’ on Joseph St Figure 14: Figure 15:
Central Kitchener is also well served by transit, with six stations on the new Ion LRT, which opened in June 2019 (see Fig. 15). The Victoria Park LRT station will serve as a significant gateway for those travelling to downtown from Waterloo, with the opposing westbound station located one block north of the site at Duke St W and Young St. The proposed new transit hub at King St W and Victoria St S will connect the local buses and the LRT to GO Transit, Via Rail, and intercity buses, and will be within walking distance of Gaukel St.

The downtown grid structure also offers many route options for vehicle traffic. The redesign of the King St corridor and addition of LRT tracks have served to reduce the through traffic on the smaller downtown streets, with the majority of through traffic handled by Victoria St and Weber St at the edges of downtown. However, there is a disconnect across downtown between the available road space and the traffic volumes. Figures 16 and 17 show the pavement width and Annual Average Daily Traffic for roads within the study area. While many streets host low amounts of vehicle traffic, there are wide streets throughout the downtown. Gaukel St in particular hosts an average of 3,900 vehicles per day, with approximately 1,100 trips made by GRT and intercity buses (Grand River Transit, 2018) (Thompson, Fate of Kitchener bus terminal up in the air, 2019), and an unknown number of related trips by taxis and private vehicles. With the closure of the transit terminal, those trips will be relocated, reducing the need for a vehicle connection along Gaukel. This is already evident given the current closure of the northern block of Gaukel St, which has not had a significant impact on traffic flow within the downtown (Thompson, Kitchener resident proposes turning Gaukel Street into a pedestrian promenade, 2019).
Gaukel Corridor Master Plan | Jonathan Hann22
PAVEMENT WIDTH 0-4m 5-8m 9-12m 13-16m Over 16m King St W QueenStN VictoriaStS Courtland Ave E TRAFFIC VOLUME Annual Average Daily Traffic 0-2,000 2,000-5,000 5,000-8,000 8,000-20,000 Over 20,000 King St W QueenStN VictoriaStS Courtland Ave E Image 30: North block of Gaukel St closed for construction Figure 16: Figure 17:


Fanshawe College | August 2019 23 Environmental In addition to Victoria Park, the study area contains several small parks and open spaces (see Fig. 18). The majority of these within the downtown are hardscaped plazas with minimal vegetation or permeable surfaces. The southern end of Victoria Park contains Victoria Park Lake, a small man-made water body that is fed and emptied by Schneider Creek. The creek runs south east through the city and empties into the Grand River. The associated flood plain extends into Victoria Park but does not impact the site. There is a significant variance in tree density within the study area from 0/linear road km within the downtown core to over 500/km within the Victoria Park neighbourhood, the highest value in the city (see Fig. 19). In general, the hardscaped areas of downtown have very few street trees, with the exception of King St, where trees were planted as part of the streetscape redesign. Gaukel St has a comparably high number of street trees for the downtown, which were also added as part of a streetscaping project in the early 2000s. While the quantity of street trees is high, many of the downtown trees are young or in poor health and do not provide a significant tree canopy and the associated feelings of enclosure. PARKS & OPEN SPACE King St W QueenStN VictoriaStS Courtland Ave E TREE DENSITY Trees/km² (within 30m of centreline) 0 1-100 101-200 201-300 Over 301 King St W QueenStN VictoriaStS Courtland Ave E Parks Other Open Space Watercourse Figure 18: Figure 19: Image 31: Victoria Park Lake Image 32: Mature tree canopy in Victoria Park neighbourhood


RD W FRANCIS ST S QUEENSTS ONTARIOSTS M HALLSLANEW COURTLANDAVEE GAUKEL ST CHARLESSTW MITCHELLST HENRYST HILDAPL HERLANAVE WATER ST S JOSEPH ST JUBILEE DR DAVIDST RICHMOND AVE DEVONST SCHNEIDER AVE STRANGE ST VCLEMENSLANE ICTORIASTS ETERST CHERRYST WALNUTST PATRICIAAVE ST ROL NDS HOMEWOOD AVE BROCK ST WESTAVE BVICTORIASTS RAMMST ARTHURPL OAKST MICHAELST THERESAST LINDENAVE HEINSAVE Victoria Park 8 V ctoria Park Lake 8 6 8 11 16 12 14 3 9 VICTORI NEIGHBO PLAN FOR MAP SECONDA 1:4 Legend Low Rise Con Low Rise Mu Low Dens ty M Medium Dens Convenience Neighbourhoo Mixed Use Co Neighbourhoo Open Space Boundary of S Spec al Policy Primary Arteri Secondary Ar Major Collecto Connector Ro Scen c Her ta 0 50 2100 5 PRINTED Deve opmen and Techn ca Se D SCLA MER Th s documen s sub ec to copyr ght and may on y be used for your pe sona non comme c a use p ovided y consult the O c a P an as app oved on May 25 1995 and subsequen Of cia P an Amendmen s as app oved by he Adopted by C y Counci May 1994 Approved by Regiona Counci May 1995 Last Rev sed June 2010 Rev sed by Amendments 31 35 36 59 83, 84 HIGHLAND RD W WOODSIDEAVE FRANCIS ST S QUEENSTS ONTARIOSTS MARTINST MBRUDERAVE ILLST HALLSLANEW MILLST COURTLANDAVEE GAUKEL ST CHARLESSTW MITCHELLST HENRYST HILDAPL WATER ST S JOSEPH ST JUBILEE DR DAVIDST RICHMOND AVE DEVONST SCHNEIDER AVE WHITNEY PL CLEMENSLANE PETERST DQUEENSTS AVIDST ROLANDST DILLST HOMEWOOD AVE BROCK ST BVICTORIASTS RAMMST ARTHURPL OAKST MICHAELST THERESAST LINDENAVE HEINSAVE Victor a Park 8 Victor a P 8 CANADIANNATIONALRAILWAY 6 8 11 16 12 14 3 9 14 1 2 3 15 VICTORIA PARK NEIGHBOURHOOD PLAN FOR LAND USE MAP 14 SECONDARY PLAN 1:4 000 Legend Low Rise Conservat on Low Rise Mult p e Residential Low Densi y Mult p e Residential Medium Dens ty Mul ip e Resident al Convenience Commerc al Neighbourhood Institutional Mixed Use Corridor Neighbourhood M xed Use Centre Open Space Boundary of Secondary P an Special Pol cy Area Pr mary Ar er a Road Secondary Arter a Road Major Col ector Road Connector Road Scenic Heritage Road 0 50 100 150 2200 5 Metres PRINTED Ju y 2010 Deve opmen and Techn ca Se v ces Depa ment P ann ng n s sub ec to copyr gh and may on y be used o you pe sona non commerc a use p ov ded you keep n act he copy gh no ce Th s documen ep esen s an OFF CE CONSOL DAT ON OF AMENDMENTS For Lega purposes an as approved on May 25 1995 and subsequen O c a P an Amendmen s as app oved by the Counc o he Reg ona Mun c pa y o Wa er oo o he On a o Mun c pa Boa d ©2010 The Corpo a on o he C ty o K chene D SCLAIMER: Th s document s subject o copyr ght and may only be used for your personal non commerc a use prov ded you keep intact he copyright notice © 2017 Some portions of th s pub icat on are produced using nformation under l cen Ministry o Natura Resources © 2005 Queen s Prin er Ontario and may not be reproduced without Perm ss on TH S IS NOT A PLAN OF SURVEY PROJECTION: UTM NAD 83 zone 17 PRINTED: MARCH 2 ! !! ! !! ! ! ! !! ! !! ! !! ! !! !! ! !! ! !! ! ! ! !!!!!!!!!!!!!!!!!!!!! ! ! ! !!!!!!!!!!!!!!!!! !! ! !! ! ! !!!!!!!!!!!! !! !!!!!!!!!!!!!!!!!!!!!!!!! !!!!!!!!!!!! !!!!! !! !! !! ! !! !! !! !! ! !! !! ! ! ! ! ! ! ! ! !!!!!!!! ! ! ! !! !!!!!!!!!!! !!!!!!!!!!!!!!!! !!! !!!BRAMMST OAKST HEINS AVE DAVIDST KINGSTW WATER STN ONTARIOSTS KING STE HALLSLANEE SCOTT ST DUKE STW AHRENSSTE OT VICTORIASTS STEWARTST VICTORIASTS SCHNEIDER AVE GAUKEL ST COURTLANDAVEE CHARLESSTW STN HALLSLANEW EBYST MADISON A YOUNG ST MAYNARDAVE ROYST WALNUTST DEVONST RICHMOND AVE ST S FRANCIS ST S VICTORIA STN KINGSTW MARKETLANE QUEENSTN MARGARETAVE FREDERICK ST LINDENAVE WELLINGTON WELL WILTONPL ONTARIOSTN JUBILEE DR MITCHELLST HALLSLANEW CLEMENSLANE GOUDIESLANE CHURCH ST EBYSTS SPETZST HENRYST JOSEPH ST MOOREAVE BREITHAUPTST QUEENSTS BENTON ST PETER ST WEBER STW WEBER STE CHERRYST PARKST THERESAST HILDAPL JOSEPHST EIT LANE BELLLANE COLLEGEST SIEGNERLANE STGEORGEST HERLANAVE MICHAELST ROLANDST WATER ST S ARTHURPL HEBELPL CHARLESSTE DUKEST E AHRENSSTW VICTORIA PARK VICTORIA PARK LAKE « 1 « 3 « 2 « 4 0 0 1 0 2 km M a p 4 LA MER Th s documen s sub ec to copyr gh and may on y be used fo you pe sona non comme c a use prov ded you keep n ac he copy gh no ce © 2017 Some po ons o h s pub ca on a e p oduced us ng n orma on unde censed use om Teranet © 1998 Reg on o Wa er oo © 2010 G and R ve Conse va on Au hor ty GRCA © 2010 and Onta o M n s ry o Natu a Resou ces © 2005 Queen s Pr n e On ar o and may no be rep oduced w thou Perm ss on TH S S NOT A PLAN OF SURVEY PROJECT ON UTM NAD 83 zone 17 PRINTED: MARCH 2017 PRODUCED BY T Depar men G S o Commun y Serv ces Depar men P ann ng Adop ed by C ty Counc June 30 2014 Approved by Regional Counc November 19 2014 Ef ect ve Date September 23 2015 Last Rev sed August 5 2016 Revised by Amendments 109 (OMB case i e PL141492) U r b a n G r o w t h C e n t r e ( D o w n t o w n ) C i t y o f K i t c h e n e r O f f i c i a l P l a n A c o m p l e t e a n d h e a l t h y K i t c h e n e r ! ! ! ! ! ! !! ! ! !! !! !! !! !! ! ! ! ! !! ! !! ! ! !!!! !!! ! ! ! ! !!!!! !! ! ! !! !! ! !! ! !! !! ! !! !! ! !! ! ! !! ! ! ! !!!!! ! !!!!!! ! !! !!!! !! !! !!BRAMMST OAKST HE NS AVE DAVIDST KINGSTW WATER STN ONTARIOSTS KING STE HALLSLANEE SCOTT ST CHARLESSTE DUKE STW AHRENSSTE QUEENSTN HERMIE PL OTTOST CLARENCEPL PEQUEGNATAVE VICTORIASTS T VICTORASTS SCHNEDER AVE GAUKEL ST COURTLANDAVEE CHARLESSTW FRANCISSTN HALLSLANEW EBYSTN MADISON AVE S KINGSTE BETZNERAVES YOUNG ST GZOWSKI LANE MAYNARDAVE ROYST IRVINST L A N C A T E R S T E DEVONST RICHMOND AVE ST S FRANC S ST S VCTORA STN WEBER ST W KINGSTW MARKETLANE MADISON AVEN QUEENSTN MARGARETAVE FREDER CK ST ELLENSTW LUELLAST L NDENAVE WELLINGTON SHANLEYST WATERLOO STWELLINGTON STN WLTONPL MA PL ONTAROSTN PEARLPL GORDON AVE FREDERICKST JUBILEE DR MITCHELLST EMMAAVE BRIARAVE LOUISAST HALLSLANEW CLEMENSLANE GOUDIESLANE CHURCH ST EBYSTS SPETZST MEHMPL HENRYST H ST MOOREAVE BREITHAUPTST QUEENSTS BENTON ST PETER ST CEDARSTN CAMERONSTS BREITHAUPT ST WEBER STW WEBER STE MANSIONST ST THERESAST HILDAPL JOSEPHST DUKE ST W HEIT LANE BELLLANE AHRENS ST W COLLEGEST SIEGNERLANE STGEORGEST VICTORA STN MICHAELST ROLANDST WATER ST S ARTHURPL HEBELPL CHARLESSTE DUKEST E AHRENSSTW VICTOR A PARK V CTOR A PARK LAKE « 1 « 3 « 2 « 4 Legend Urban Growth Centre (Downtown) Boundary Land Use Designation C ty Centre D strict C v c D str c Market D str ct Innovation District Mixed Use Spec fic Policy Area ! !! ! Boundary Area Si e 1 Mult modal Trans t Hub (Pol cy 15 D 2 65) 2 445 K ng St W (Pol cy 15 D 2 66) 3 Dav d St Queen S S/Court and Ave E (Pol cy 15 D 2 67) 4 98 100 100 1/2 AND 110 V ctoria St S and 55 Bramm St (Pol cy 15 D 2 68) °Roads Ra lway Corr dor Surface Water Land Parcel 0 1 0 2 km Note 1 This map forms part of the Off cia P an of the C ty o Ki chener and must be read n conjunc ion w th the pol c es o h s Plan HIGHLAND RD W WOODSIDEAVE FRANCIS ST S QUEENSTS ONTARIOSTS MARTINST MBRUDERAVE ILLST HALLSLANEW MILLST COURTLANDAVEE GAUKEL ST CHARLESSTW MITCHELLST HENRYST HILDAPL WATER ST S JOSEPH ST JUBILEE DR DAVIDST RICHMOND AVE DEVONST SCHNEIDER AVE WHITNEY PL CLEMENSLANE PETERST DQUEENSTS AVIDST ROLANDST DILLST HOMEWOOD AVE BROCK ST BVICTORIASTS RAMMST ARTHURPL OAKST MICHAELST THERESAST LINDENAVE HEINSAVE Victor a Park 8 Victor a Park Lake 8 CANADIANNATIONALRAILWAY 6 8 11 16 12 14 3 9 14 1 2 3 15 VICTORIA PARK NEIGHBOURHOOD PLAN FOR LAND USE MAP 14 SECONDARY PLAN 1:4 000 Legend Low Rise Conservat on Low Rise Mult p e Residential Low Densi y Mult p e Residential Medium Dens ty Mul ip e Resident al Convenience Commerc al Neighbourhood Institutional Mixed Use Corridor Neighbourhood M xed Use Centre Open Space Boundary of Secondary P an Special Pol cy Area Pr mary Ar er a Road Secondary Arter a Road Major ector Road Connector Road Scenic Heritage Road 0 50 100 150 2200 5 Metres PRINTED Ju y 2010 Deve opmen and Techn ca Se v ces Depa ment P ann ng n s sub ec to copyr gh and may on y be used o you pe sona non commerc a use p ov ded you keep n act he copy gh no ce Th s documen ep esen s an OFF CE CONSOL DAT ON OF AMENDMENTS For Lega purposes pp d M y 25 1995 d b q O P A d pp d by th C h R g M p y W h O M p B d ©2010 Th C p h C ty K h OYST TN EBER SELLLANE OLLEGEST OFFICIAL PLAN - DOWNTOWN Figure 20: E CHNEI OL OFFICIAL PLAN - VICTORIA PARK Figure 21: ZONINGFigureBY-LAW22:
Zoning By-law
supports walking and cycling as modes of transportation by providing a system of complete streets and linked open spaces. The plan seeks to remove barriers to pedestrian flow, accommodate varying degrees of mobility throughout the network, and minimize conflicts with vehicles by reducing vehicle speeds and providing appropriate buffers. Priority will be given to pedestrians, cyclists, and public transit over the circulation of private veAhicles.high standard of urban design is to be provided for building facades and streetscaping, incorporating furniture, shade, and lighting. The plan seeks to create places that are identifiable with distinct character, contributing to a sense of place among the community. Development must also be sensitive of surrounding cultural heritage resources and serve to protect and enhance the heritage of the community.
Gaukel Corridor Master Plan | Jonathan Hann24Policy Context Kitchener Official Plan
The site is split between three land use designations: City Centre District for the lands north of Joseph St, and Medium Density Multiple Residential and Open Space for the lands to the south (see Fig. 20 & 21). The City Centre District mimics the Urban Growth Centre policies, prioritizing pedestrian-oriented design and permitting all uses. Massing and density are regulated by the use of Floor Space Ratio, with a permitted FSR between 1.0 and 3.0 and no maximum height provisions. The Medium Density Multiple Residential designation allows for an FSR of 0.6 to 2.0 with a maximum height of 8 storeys and is intended for mid-rise apartment and street townhouse forms.
The site is split into two zoning categories that follow the boundaries set out in the Official Plan (see Fig. 22). The D-1 zone is the least restrictive zone within the downtown, with no maximum height requirement and a minimum façade height of 6m. The R-8 zone applies to the parcel at Joseph St and David St HIGHLAND
The site is located primarily within the Urban Growth Centre designations in the City’s Urban Structure plan. This area is the primary intensification nodes within the city, with the Urban Growth Centre planned to grow to 225 people and jobs per hectare by The2031.designation


Gaukel St is the focus of specific initiatives aimed at creating a secondary north-south spine within the downtown. The plan calls for a Gaukel St to be a promenade and gateway to Victoria Park. A shared street or woonerf is proposed to enhance the pedestrian realm and create a unique, recognizable streetscape.
Shape DTK
Fanshawe College | August 2019 25 and allows for multiple residential and street townhouses with an FSR of 0.6-2 and a maximum height of 24m.
Urban Design Manual
PARTS Central
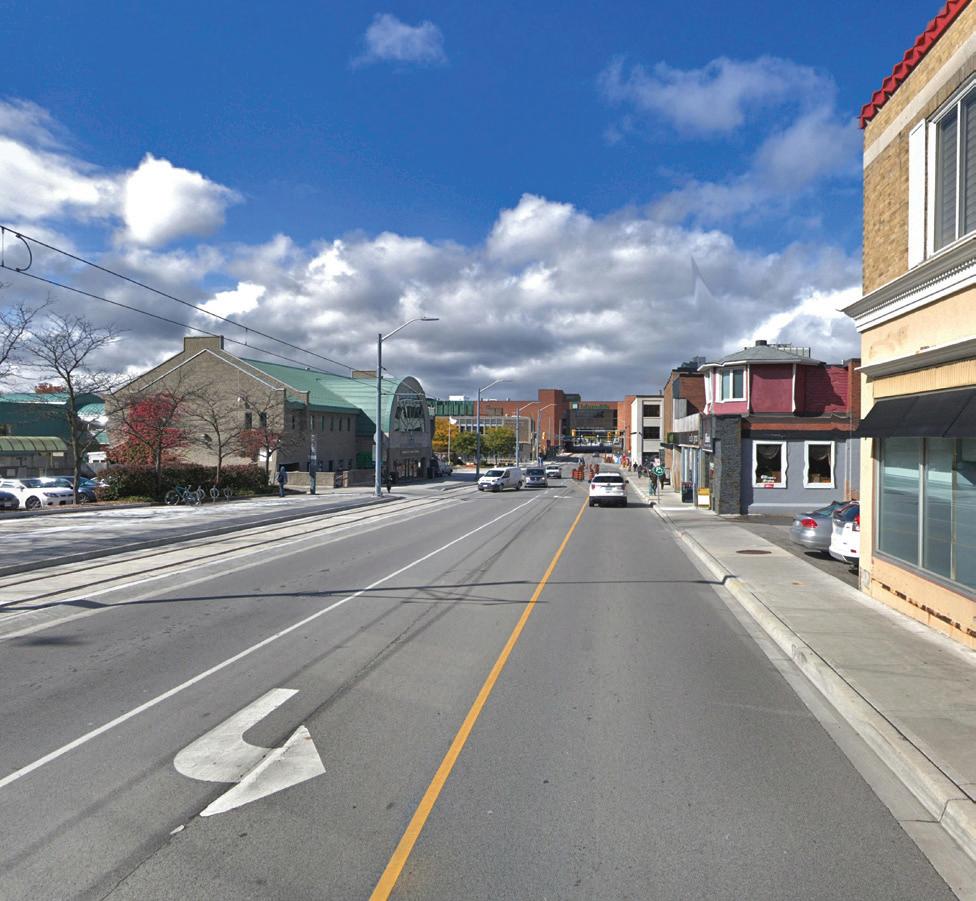
The City’s Urban Design Manual for the downtown also recognizes Gaukel St as a candidate for a shared street with a human scaled public realm. The document notes that the historic clock tower at the foot of Gaukel is a significant focal point for the downtown and Victoria Park and is an icon for the city. In addition, proposed massing for the blocks adjacent to Gaukel St is provided in the form of a rendering (see Fig. 23).
The city recently drafted an action plan for downtown Kitchener and collected input from approximately 1,500 community members. While there are no specific initiatives for the Gaukel St corridor, the feedback does give insight into the values and desires of residents. Respondents were interested in seeing more shops and services within the downtown, specifically looking for daily services and a mix of independent businesses. The survey also recognized the important of active frontages, noting that office frontages were detrimental to street life. Participants shared a desire for social experiences and vibrant outdoor spaces, with nearly 50% of responses favouring outdoor communal spaces over other urban interventions. Suggestions included the repurposing of laneways or other underutilized public spaces as inclusive places to meet friends and be active outside. Finally, the plan proposes four core values for downtown: local & unique, diverse & inclusive, gritty & authentic, and community.
The PARTS (Planning Around Rapid Transit Stations) plans guide development around LRT stations, with the PARTS Central plan covering the stops within the downtown. The policies and objectives in the PARTS Central plan are in line with the Official Plan, calling for a downtown that supports active transportation and gives priority over vehicle circulation.
Figure 23: Potential development massing along Gaukel corridor

Urban Design Measures
The Gaukel corridor and case study streets were sur veyed using the methodology outlined by Ewing & Clement (2013), which measures a streets pedestri an-friendliness based on five quantifiable categories: imageability, enclosure, human scale, transparency, and complexity. The five categories were combined into an overall score, and additional physical and de mographic characteristics were recorded for each site to inform the surrounding context. The Gaukel St survey was conducted on site in May 2019 while the case study streets were surveyed using the latest imagery available on Google Streetview and Google Earth. Details of the measurement categories and a spreadsheet of the full results can be found in Ap pendix A.
Concept Ideation
Gaukel Corridor Master Plan | Jonathan Hann26 4
Overall
In order to inform the design of Gaukel St using a data-driven approach, Ewing & Clemente’s (2013) urban design measurements were used. The mea surements were first used to survey the existing con ditions of Gaukel St to identify areas of need, which was followed by a series of case studies on 10 pe destrian friendly streets from around the world. Each case study street was inventoried based on the five categories and combined with additional informa tion surrounding demographics and physical quali ties to form key success factors. The key success fac tors from the case study streets were then used as best practices to inform the redesign of Gaukel. The proposed design will be re-evaluated in the following section to determine the level of success and inform future projects.
Method of Survey
ComplexityTransparencyHumanEnclosureImageabilityScale
The existing conditions of the Gaukel St corridor were inventoried as two independent blocks, with the north block from King St W to Charles St W, and the south block from Charles St W to Joseph St. This was done in recognition of the significant differences between the two blocks in terms of right of way width, adjacent built form, and potential for redevelTheopment.results clearly demonstrate the lack of pedestrian friendliness that current exists on Gaukel St (see Fig. 24). The measurements in all five categories are significantly below mean values of the case study streets shown on the following pages. The northern block (King to Charles) fares significantly better than the southern block, largely due to the overwhelmingly negative effect the bus terminal has on the streetscape. However, this leaves many areas for improvement, and with the large areas suitable for redevelopment, provides a blank canvas on which to create a well-designed pedestrian environment. The overall measurements for each category appear below, with detailed breakdowns for each block provided on the following pages.
Existing Conditions
Gaukel St North Gaukel St South 1.41.8 -2.20.5 0.5-1.6 0.81.4 2.00.9 -0.76.1 1.6 -0.9 -0.5 1.1 1.4 2.7Mean Enlcousre Human Scale Transparency Complexity OverallImageability Figure 24: EXISTING URBAN DESIGN MEASUREMENTS
Fanshawe College | August 2019 27
Gaukel Corridor Master Plan | Jonathan Hann28Gaukel St - NorthStudySegmentAreaFeatures • Narrow streetscape section defined by buildings with zero setbacks • Grade change from north to south provides good views of Victoria Park and the historic City Hall clock tower • Mix of commercial, residential, and office with few entrances directly to Gaukel St. Charlie West project will contribute ground floor retail and additional activty to the space Key Success Factors • Poor scores in all categories, particularly Imageability, Human Scale, and Transparency. • Lack of seating, narrow pedestrian space, few active uses, and very little signage negatively affect the space. • Relatively intact street wall (with the except of parking adjacent to Halls Ln) and building variety contribute positively to Imageability and Complexity scores • The addition of the Charlie West project will have a significant positive impact on the space, contributing active uses, street wall, and ground floor windows Kitchener, Ontario Corridor Length 200m (2 blocks) Corridor Width 15-20m Building Heights 2-3 (31) storeys Case Study Area King St W - Charles St W Study Area Length 100m Study Area Width 15m Urban Population 470,015 Density 1,746/sq km Access Restrictions Closed for construction on adjacent lot 1.8 1.4 2.0 6.1 15m Study Area 200m


Fanshawe College | August 2019 29 Gaukel N 8mZoneVehiclePedestrian2mZone Furniture1.3mZone TYPICAL SECTION Image 33: Gaukel St north block


Gaukel Corridor Master Plan | Jonathan Hann30Gaukel St - SouthStudySegmentAreaFeatures • Wide vehicle zone to accommodate bus turning movements • Planting beds and tree canopies provide shade and enclosure for western pedestrian zone • East frontage dominated by bus terminal driveway, with no buffer between sidewalk and vehicles on either side Key Success Factors • Very low scores in all categories, driven largely by lack of building frontages, active uses, and furniture, as well as long sight lines in all directions • A separate study of only the western side would likely yield positive results for Enclosure, given the 44 Gaukel building and tree canopy • The redevelopment of the bus terminal will have a substantial positive impact on the scores in all categories Kitchener, Ontario Corridor Length 200m (2 blocks) Corridor Width 15-20m Building Heights 1-2 storeys Case Study Area Charles St W - Joseph St Study Area Length 85m Study Area Width 20m Urban Population 470,015 Density 1,746/sq km Access Restrictions None 1.4 -2.2 -1.6 0.8 0.9 -0.7 20m 200m Study Area

Gaukel Corridor Master Plan | Jonathan Hann32Case Studies Streets
KitchenerSavannahCharlottesvilleHalifaxOttawaBoulderCalgaryVancouverCopenhagenBarcelona Argyle St DowntownHalifax BarcelonaLasKitchenerKingVancouverGranvilleCharlottesvilleMallStStRamblas Pearl StephenOttawaSparksBoulderStStAve Walk WCopenhagenStrøgetCalgarySaintJulian St Savannah 10 INTERNATIONAL CASE STUDY STREETS Figure 25:
The top three streets, Charlottesville’s Downtown Mall, Boulder’s Pearl St, and Copenhagen’s Strøget, have significantly different designs that contribute to their success. Strøget is a largely empty space with a small cross section. By contrast, Pearl St and the Downtown Mall are filled with furniture in the form of patio seating and planters, with large trees providing an enclosed canopy. All three streets have full street walls, high percentages of ground floor windows, and a multitude of signage that contributes to a lively, complex environment. The significant demographic difference between the three cities also leads to the conclusion that pedestrian-only spaces can work in large and small cities with the right combination of design elements.
The case study streets were chosen for their pedestrian-friendliness, high quality urban design, and recognition and success in the urban design community. The streets and surrounding cities have varying contexts, population densities, built forms, and tourism levels, but all are recognized as successful streets (see Figs. 25 & 26).
By contrast, the lower scoring streets lacked places to stop and linger (Granville St, Sparks St), incomplete street walls (King St), and ground floor windows (W Saint Julian St). Again, the range in population and density between Vancouver and Savannah highlights the fact that poorly executed design can be detrimental to pedestrian activity in any context.
The results for each case study street are detailed on the following pages, with full results in Appendix A.


Fanshawe College | August 2019 33 Argyle St DowntownHalifax SavannahWCopenhagenStrøgetCalgaryStephenOttawaSparksBoulderPearlBarcelonaLasKitchenerKingVancouverGranvilleCharlottesvilleMallStStRamblasStStAveWalkSaintJulianSt 4.00.82.23.73.72.42.52.83.92.8 0.80.81.51.41.31.51.11.41.50.9 4.33.71.72.52.12.61.72.71.62.3 2.01.81.82.11.91.92.12.12.11.9 2.02.00.81.51.41.91.01.91.91.6 10.710.712.311.16.99.011.59.011.19.4 4.02.9 1.51.2 2.54.3 2.11.9 2.01.6 10.212.3MaximumMean Enlcousre Human Scale Transparency Complexity OverallCASEImageabilitySTUDY RESULTS - URBAN DESIGN MEASURES Figure 26:
Fanshawe College | August 2019 35 Argyle P Pedestrian2.5mZone6.5mZoneVehiclewithOn-StreetParkingFrontage3mZone Furniture1mZone ZonePed.2mTYPICAL SECTION Image 35: Argyle Street, Halifax


Gaukel Corridor Master Plan | Jonathan Hann36Downtown Mall Study Area Features • Pedestrian clearways along building frontages with large central space filled with restaurant patios and retail displays • Primarily retail and restaurant frontages with some office, entertainment (theatre and museum), and civic uses (city hall). East end anchored by outdoor music pavilion • Mature trees provide full canopy and shade for patio seating Key Success Factors • Highest overall score driven by high imageability, enclosure, and human scale scores • High numbers of building identifiers, abundant street furniture with outdoor patio dining, a continuous street wall, and a high percentages of ground floor windows made significant contributions to the scores Corridor Length 650m (9 blocks) Corridor Width 20m Building Heights 2-8 storeys Case Study Area 1st N - 2nd St NE Study Area Length 60m Study Area Width 20m Urban Population 43,475 Density 1,810/sq km Access Restrictions Closed to vehicles 3.7 1.4 3.7 1.9 1.5 12.3 20m 650m Study Area


Fanshawe College | August 2019 37 Downtown MallPedestrian4.5mZone Furniture11m & Frontage Zone TYPICAL SECTION Image 36: Downtown Mall, Charlottesville


Gaukel Corridor Master Plan | Jonathan Hann38Granville St Study Area Features • Busy shopping street and transit mall in downtown Vancouver • Adjacent CF Pacific Centre, SkyTrain stations, and nearby density contribute to significant pedestrian activity, though high percentage appeared to be only passing through study area • Retail frontage counts as active but containted fewer entrances due to large store size and presence of mall. Negative effects mitigated by ground floor windows with retail displays Key Success Factors • Tied for highest enclosure and transparency scores due to full street wall, trees blocking long sight lines, and a high percentage of ground floor windows • Low imageability score driven by lack of building identifiers, few historic and nonrectangular buildings, and a lack of patio seating Corridor Length 750m (5 blocks) Corridor Width 24m Building Heights 1-25 storeys Case Study Area West Georgia StDunsmuir St Study Area Length 150m Study Area Width 24m Urban Population 2,264,823 Density 2,584/sq km Access Restrictions Transit, Delivery & Service Only 0.8 1.5 1.7 2.1 0.8 6.9 24m750mStudy Area


Fanshawe College | August 2019 39 GranvillePedestrian4.3mZone Transit7.4mZone Furniture4mZone Image 37: Granville Street, Vancouver TYPICAL SECTION


Gaukel Corridor Master Plan | Jonathan Hann40 Study Area Features • Recent streetscape design as part of ongoing revitalization efforts • Central vehicle lanes with adjacent flexible areas for on-street parking, restaurant patios, or additional sidewalk space. Zones delineated with rolled curbs, bollards, and material changes • Primarily retail and restaurant storefronts with some office uses, entertainment (theatre, museum). Anchored at centre by City Hall plaza • 2011 Gold Award for Urban Design from the Design Exchange (Province of Ontario, 2013) Key Success Factors • Average scores for all five categories. Better performance in imageability and complexity due to retail variety, smaller store frontages, and outdoor dining • Lowest overall score in enclosure due to some large building setbacks and sparse tree canopy Kitchener, Ontario Corridor Length 750m (6 blocks) Corridor Width 18-21m Building Heights 1-12 storeys Case Study Area Gaukel St - Ontario St Study Area Length 185m Study Area Width 20m Urban Population 470,015 Density 1,745/sq km Access Restrictions None - Flex Street 3.7 0.8 2.5 1.9 1.9 10.718-21m750mStudy Area


Fanshawe College | August 2019 41 King St P Pedestrian2.5mZone Zone3.4mFlex7mZoneVehicle Image 38: King St, Kitchener TYPICAL SECTION


Gaukel Corridor Master Plan | Jonathan Hann42La Ramblas Study Area Features • Iconic pedestrian street and major tourist destination in central Barcelona (Project for Public Spaces, 2010) • Wide variety of retail, restaurant, and cultural uses • Large central pedestrian promenade with retail and food vendors covered by mature tree canopy Key Success Factors • Tied for highest score in enclosure and transparency due to continuous street wall with high proportion of active uses and ground floor windows • Lower values for building colours and furniture mitigated by high pedestrian volumes, leading to average scores in human scale and complexity Corridor Length 1,400m (14 blocks) Corridor Width 33m Building Heights 3-8 storeys Case Study Area Carrer de L’HospitalCarrer del Carme Study Area Length 220m Study Area Width 33m Urban Population 4,840,000 Density 16,000/sq km Access Restrictions None 2.4 1.5 2.1 2.1 1.0 9.033m1,400m Study Area


Fanshawe College | August 2019 43 Las Ramblas PP Pedestrian3mZone Vehicle5.5mZoneFrontagePedestrian/10.5mZoneFurniture2.75mZone Image 39: La Ramblas, Barcelona TYPICAL SECTION


Gaukel Corridor Master Plan | Jonathan Hann44Pearl St Study Area Features • Short pedestrian-only space in central Boulder shopping district, anchored by central City Hall plaza • Large planting beds in alternating configurations with benches and mature trees • Retail and restaurant uses are dominant with some office and cultural uses • Named to Great Places in America by the American Planning Associaton (2015) Key Success Factors • Above average overall score with best performance in imageability and transparency due to full street wall and narrow storefronts with ground floor windows Corridor Length 455m (4 blocks) Corridor Width 24m Building Heights 1-4 storeys Case Study Area Broadway - 13th St Study Area Length 90m Study Area Width 24m Urban Population 97,385 Density 1,680/sq km Access Restrictions Closed to vehicles 4.0 0.8 2.6 2.0 2.0 11.524m455m Study Area


Fanshawe College | August 2019 45 Pearl St Frontage2mZone ZonePed.3mPedestrian4.5mZonePlanting6mBed Planting3.5mBed Image 40: Pearl Street, Boulder TYPICAL SECTION


Gaukel Corridor Master Plan | Jonathan Hann46Sparks St Study Area Features • Pedestrian-only space in central Ottawa, one block south of Parliament Hill. Used as festival space during summer months • Significant number of historic and landmark buildings, with many government offices fronting onto street. Blank office facades, internal concourses, and lower proportion of retail blamed for low pedestrian counts, particularly outside of office hours (The Ottawa Citizen, 2008) • Plans are currently being developed to revitalize Sparks St beginning in 2022 Key Success Factors • Relatively poor preformance across all categories, driven by wide building frontages, low proportion of active uses, long sight lines, and minimal street furniture. • Best performance on complexity due to a variety of building colours and the presence of outdoor dining • Criticisms underscore the importance of retail storefronts, enclosure, and appropriately sized pedestrian zones in creating the perception of activity and liveliness Corridor Length 850m (5 blocks) Corridor Width 18m Building Heights 2-29 storeys Case Study Area O’Connor StMetcalfe St Study Area Length 160m Study Area Width 18m Urban Population 989,567 Density 1,900/sq km Access Restrictions Closed to vehicles with devlivery window 2.5 1.1 1.7 1.8 1.9 9.018m850m Study Area


Fanshawe College | August 2019 47 Sparks St 9.6m ZonePedestrian Frontage3mZoneFurniture1.2mZone Image 41: Sparks Street, Ottawa TYPICAL SECTION


Gaukel Corridor Master Plan | Jonathan Hann48Stephen Ave WalkStudy Area Features • Destination shopping and entertainment street with high-end restaurant, boutique retail, and theatres • Anchored by Olympic Plaza in east and CORE Shopping Centre in West • One block from 7th Ave CTrain corridor • Vehicle access restricted between 6:00AM and 6:00PM, with deliveries allowed by permit. One way with on-street parking during evening and overnight Key Success Factors • High enclosure score as a result of continuous street wall and short sight lines • Outdoor dining and high street furniture counts contribute positively to imageability and complexity scores Calgary, Alberta Corridor Length 850m (5 blocks) Corridor Width 20m Building Heights 2-47 storeys Case Study Area 1st St SW - 2nd St SW Study Area Length 145m Study Area Width 20m Urban Population 1,237,656 Density 2,112/sq km Access Restrictions Closed to vehicles from 6AM to 6PM 32.8 1.4 2.7 2.0 1.9 10.720m850m Study Area


Gaukel Corridor Master Plan | Jonathan Hann50 Study Area Features • Central shopping area within the old city of Copenhagen • Major tourist destination, high international profile, and significant urban density contribute to very high pedestrian volumes throughout the year (Project for Public Spaces, 2010) Key Success Factors • Highest or tied for highest score in all categories except human scale. Significnant features include 100% historic buildings with a variety of shapes, full street walls that block long sight lines, high percentage of windows and 100% active uses, and a variety of building colours. • Low score in human scale is driven by low furniture counts, a lack of planting, and taller average building height (though the buildings indirectly contribute positively to enclosure). • While the corridor is largely empty of furniture, the thin profile and high levels of pedestrian activity contribute to a lively environment Corridor Length 1,100m (14 blocks) Corridor Width 9-22m Building Heights 3-6 storeys Case Study Area BadstuestrædeHyskenstræde Study Area Length 85m Study Area Width 10-12m Urban Population 777,281 Density 4,400/sq km Access Restrictions Closed to vehicles 3.9 1.5 1.6 2.1 2.0 11.1 9-22m 1,100m StudyArea


Fanshawe College | August 2019 51 StrogetFrontage1.5mZone Pedestrian8mZone Image 43: Strøget, Copenhagen TYPICAL SECTION


Gaukel Corridor Master Plan | Jonathan Hann52West Saint JulianStudySt Area Features • Short pedestrian district in historic Savannah • Large retail zones adjacent to frontages house restaurant seating, covered by awnings, with additonal seating in the centre pedestrian zone • Large trees in concrete planters provide seating through wood bench surrounds • Retail and restaurant uses, with Savannah City Market, gallery, and museum. Anchored by public squares at either end Key Success Factors • Average scores in all categories. High precentage of historic buildings, 100% street wall, active uses, and high street furniture counts contribute positively, while long sight lines, fewer ground floor windows, and homogenuous building design detract from scores. Corridor Length 130m (2 blocks) Corridor Width 22m Building Heights 2-3 storeys Case Study Area Barnard St - Jefferson St Study Area Length 85m Study Area Width 22m Urban Population 136,286 Density 510/sq km Access Restrictions Closed to vehicles 2.8 0.9 2.3 1.8 1.6 9.4 22m 130m Study Area


Fanshawe College | August 2019 53 West Saint Julian 12m PedestrianZoneFrontage5mZone Furniture2mZone Image 44: West Saint Julian St, Savannah TYPICAL SECTION


Gaukel Corridor Master Plan | Jonathan Hann54Urban Design Goals The Urban Design Measurements demonstrated that the Gaukel St corridor is significantly lacking when it comes to pedestrian-friendly design elements, with scores below the case study mean in all but one category (see Fig. 27). This leaves many areas for improvement, and goal scores were identified to inform the design of the master plan. To achieve these improved scores, the most successful design elements from the case study streets will be incorporated, as appropriate, as well as findings from the other literature summarized previously (see Fig. 28). ENCLOSURE • Full street wall with driveway and service access restricted to adjacent streets • Street trees to create vertical enclosure • Heights appropriate to street width (1:1 or 2:1) with upper floors set back IMAGEABILITY • Variety of building shapes, styles, and uses • Narrow storefronts with signage • Views to landmarks • Plazas and courtyards next to street COMPLEXITY • Variety of building colours • Narrow storefronts, material changes to create the appearance of many buildings TRANSPARENCY • Ground floor windows • Retail frontages with soft, porous edges • Full street walls with minimal breaks HUMAN SCALE • Appropriately sized spaces, 15-30m²/person • Furniture, including planters, dining tables, seating, places to linger • Ground floor windows • Upper storey setbacks to not overwhelm street Gaukel St North Gaukel St South Case Study Mean Goal 2.91.61.2 -2.20.21.2 2.50.9-1.6 0.81.11.9 0.61.81.6 5.6-1.210.2 2.0 1.0 2.0 1.6 1.5 9.0 Enlcousre Human Scale Transparency Complexity OverallImageability Figure 27: URBAN DESIGN MEASUREMENT GOALSFigure 28: KEY SUCCESS FACTORS
ParkVictoriaHall
frontages along Gaukel St will take advantage of these pedestrian flows and pro vide additional destinations and liveliness. Second ary frontages along the remaining streets can be a mix of retail, employment, and residential, with par ticular importance on maintaining transparency and the appearance of human activity within the build ings. Frontages should also be human scaled, with narrow storefronts and heights below 6 storeys to avoid overwhelming the pedestrian realm. The entrance to Victoria Park should function as a continuation of the linear promenade formed by Gaukel St. While the current gardens are well used in warmer months, the form acts as a visual and psychological barrier to the flow into the park and should be opened to provide a more seamless corri dor. Placing small activity zones at the foot of Gaukel and next to the clock tower will facilitate small events and informal gathering in areas with high pedestrian traffic. On either side, green zones will provide nat ural areas for passive recreation as well as fulfilling sustainability functions such as rain water collection and pollinator habitat. Overall, the entrance will act as a transition zone between the urban environment of downtown and the natural areas of Victoria Park.
Fanshawe College | August 2019 55 Site Analysis Figure 29 displays the structural elements guiding the development of a site concept. The Gaukel corri dor is anchored by three main focal points: City Hall, the Victoria Park LRT station, and the Victoria Park Clock Tower. These three features will draw visitors from around Waterloo Region to the Gaukel corridor and downtown and will be responsible for the sig nificant pedestrian activity. It is important that these points are clearly connected through vertical and ground plane elements and that the view corridor between City Hall and the Clock Tower is maintained and Concentratingstrengthened.retail
City LRT
DavidStSt OntarioStSGaukelSt YoungStCollegeSt Focal PedestrianVehicleIONSecondaryPrimaryDevelopmentGreenActivityPointZoneZoneParcelFrontageFrontageLRTFlowFlowFigure 29: SITE ANALYSIS DIAGRAM
JosephW
Gaukel Corridor Master Plan | Jonathan Hann56 King St W Charles St


SafetyPlanningLivelinessAmenityPlantingVehicleActivePercent Area of AchieveAbilityCorridortoGoals WorstBest
Gaukel Street Alternatives With the site framework in place, the next step was to develop and evaluate streetscape alternatives for the Gaukel corridor. Three alternatives for each of the two blocks were prepared: a standard street cross section with space provided for a frontage zone; a shared street concept similar to the one proposed by planning policy; and a full pedestrianization of the space. Alternatives were evaluated individually for each block based on the provision of space for active transportation, vehicular transportation, planted areas, and amenity (such as furniture and retail), as well the concept’s ability to improve liveliness, adhere to the current planning policy, and maintain the safety of users. Preferred concepts were chosen based on the overall performance and suitability for the particular block.
Fanshawe College | August 2019 57
Gaukel Corridor Master Plan | Jonathan Hann58Alternative 1 The first alternative maintains a two lane, two-way road throughout the entire length, with on-street parking provided on the south block (see Figs. 30 & 31). The pedestrian clearway ranges from 2.0-2.5m, with a furniture zone adjacent to the vehicle lanes providing space for trees and lighting, and a small 1.3-1.5m retail zone allows for outdoor displays and seating. Tree roots are accommodated through the use of silva cells. 15%42%25%17%40%27%0%0% P SafetyPlanningLivelinessAmenityPlantingVehicleActiveSafetyPlanningLivelinessAmenityPlantingVehicleActiveVehicle8.4mZoneZone2.5mPed. Furniture1.6mZoneSilvaFrontage1.5mZoneCells Vehicle6mZoneZonePed.2m Furniture1mZoneFrontage1.3mZone Silva Cells NORTH BLOCK SOUTHFigureBLOCK30:Figure31:


15%15%15%20% SafetyPlanningLivelinessAmenityPlantingVehicleActiveSafetyPlanningLivelinessAmenityPlantingVehicleActive20%15%30%25% Vehicle6mZoneZonePed.2m Furniture1mZoneFrontage2mZone Silva Cells PlanterStormwater Vehicle3mZoneZonePed.2m Furniture1mZoneFrontage1.5mZone Silva Cells PlanterStormwater Planting3mZone3mPlantingZone NORTH BLOCK SOUTHFigureBLOCK32:Figure33:
Fanshawe College | August 2019 59 Alternative 2
The second alternative builds on the city’s woonerf vision (see Figs. 32 & 33). The vehicle zone (one-way on the north block, two-way on the south block), would have no vertical separation from the pedestrian areas, with areas delineated by furniture (such as bollards), material changes, and a planted area with raised edge. The planting zone functions as a bioretention area, collecting stormwater runoff from the corridor. Street furniture is placed between the pedestrian and frontage zones with tree roots accommodated in silva cells below. Wider sidewalks and frontage zones with minimal delineation would create soft edges that encourage activity.


Gaukel Corridor Master Plan | Jonathan Hann60Alternative 3 The final alternative is a fully pedestrianized space with a central bioretention garden (see Figs. 34 & 35). Similar to Alternative 2, frontage and pedestrian zones would be separated by a minimal furniture zone housing trees and light standards. Wide frontage zones would allow for large patios and retail displays. The central planting zone would collect stormwater from the corridor and introduce natural areas that connect south to Victoria Park. The materials and pedestrian zones would provide a seamless connection between City Hall and Victoria Park. 30%13%40%0% SafetyPlanningLivelinessAmenityPlantingVehicleActive30% SafetyPlanningLivelinessAmenityPlantingVehicleActive 30%30%0% ZonePed.3mFrontage2.5mZone Furniture1mZone Silva Cells PlanterStormwater Planting2mZone Silva Cells PlanterStormwater ZonePed.3mFrontage3mZone Furniture1mZoneNORTHPlanting6mZoneBLOCKSOUTHBLOCKFigure34:Figure35:


For the south block, full pedestrianization is the preferred alternative (see Fig 36). This option provides the greatest amount of space for active transportation, planting, and amenity areas and will have the greatest potential to create a lively environment. The form will also integrate seamlessly into the redesigned entrance of Victoria Park. Given the undeveloped state of most of the adjacent land, as well as the current lack of vehicular entrances, eliminating vehicle traffic on the south block will have a negligible impact.
SafetyPlanningLivelinessAmenityPlantingVehicleActive 17%40%27%0% 15%42%25%0%15%15%15%20% 20%15%30%25%30%13%40%0% 30%30%30%0% North2Block31 South2Block31 Preferred Preferred Figure 36: EVALUATIONS AND PREFERRED ALTERNATIVES
Fanshawe College | August 2019 61
The preferred alternative for the North Block is the shared street concept (see Fig. 36). This alternative strikes a balance between active transportation, vehicular access, amenity space, and planted areas. Existing access to the adjacent buildings and Halls Ln is maintained through the one-way vehicle lane, while more space is provided for active transportation. The alternative also meets the project goals for liveliness, planning, and safety. The shared street concept envisioned by planning policy provides ample space for activity while the lane widths, surface materials, and lack of vertical separation creates an environment that will slow down vehicles and ensure pedestrian safety.
Preferred Alternative - North Block
Preferred Alternative - South Block
The design of the master plan is based around three key design goals: to create a seamless transition between the urban form of City Hall and Downtown Kitchener, and the natural form of Victoria Park; to use the oval of the Victoria Park lawn as the primary design form; and to strengthen the connection between City Hall and Victoria Park by maintaining the existing view corridor to and from the clock tower.
Transition from Urban to Natural Replicate Oval Form of Victoria Park Lawn Maintain View Corridor from City Hall to Clock Tower
Overview
The pedestrian nature of the corridor is enhanced by limiting vehicle circulation as much as possible. The northern block contains a single southbound lane while the southern block is reserved for active transportation only. In addition, the vehicle entrances to the development parcels are shifted away from Gaukel, utilizing Joseph St and Ontario St S.
The concept uses three sets of oval forms to create a natural connection across the corridor (see Fig. 37). The first two sets are envisioned as bioretention planters located in the centre of Gaukel Street, with the third as an open lawn connecting Gaukel to the clock tower. Two additional focal points are framed by oval shapes: a small open area at the centre of the south block and a reflecting pool extending out from the base of the clock tower. The corridor is framed by two rows of trees and by mid and high-rise mixeduse developments which create a sense of enclosure and provide activity.
Gaukel Corridor Master Plan | Jonathan Hann62 5 Master Plan
Fanshawe College | August 2019 63 King St WCharles St W Joseph St DavidSt OntarioStS GaukelSt Halls Ln Figure 37: GAUKEL CORRIDOR MASTER PLAN GardenBioretentionGardenBioretentionLawn Reflecting Pond Clock Tower Plaza VictoriaPlaza Park VehicleSouthboundLanePlaza 25st. st.12 3 st.4 st. 3 st. 4 st. 4 st. 4 st. st.21st.18 Plank PaversLRTPlatform


Material Palette A coordinated material palette will also help to link the streetscape and park entrance (see Fig. 40). The majority of the space will be constructed with plank pavers laid along the direction of the corridor. Three paving colours (sandstone, opal, and slate grey) will be mixed according to the location along the corridor, with a higher percentage of slate grey in the ‘urban’ northern areas and a higher percentage of sandstone in the ‘natural’ park areas. The transition in paving colours mimics the shift from urban to natural along the corridor and provides a neutral base to contrast the colours of the planting. The areas within the ‘oval’ forms that are not occupied by planting will be concrete with an exposed aggregate finish.
The bioretention gardens use a mixture of grasses, perennials, and small shrubs to create a natural environment within the urban streetscape (see Fig. 39). As these gardens will store and filter runoff during and after storm events, species were chosen that were tolerant of inundation and urban conditions. In addition, species are categorized by planting zone based on their typical growing environment with lowland species towards the centre and upland species on the edges (Credit Valley Conservation, 2010).
‘IvoryReticulataSyringaSilk’ ‘Musashino’Zelkovaserrata virginianaOstrya occidentalisCeltis var.triacanthosGleditsiainermis‘Skyline’ Acer ‘Jeffersred’freemaniix CalamagrostisGrasses canadensis Carex AquilegiaPerennialsbebbiicanadensis Spring Rudbeckia hirta Summer Symphyotrichum cordifolium Summer/Fall HypericumShrubs kalmianum Late Summer Potentilla fruticosa Summer Viburnum lentago Spring BIORETENTION PLANTING L M H H M H H M H MM TREE SPECIES ZoneBloom Figure 38: Figure 39: Figure 40: PLANK PAVERS Slate Grey Mix Sandstone MixBalanced Mix
The Gaukel St Corridor and Victoria Park Entrance uses a single material and planting palette to reinforce the connection between the two spaces. Three street tree species were chosen for each block based on their tolerance of urban conditions and performance in the downtown Kitchener microclimate (see Fig 38). The narrow right of way in the north block relies on smaller tree species to provide shade in the smaller space while keeping the central viewshed open, while species on the southern block are larger to take advantage of the increased right of way. Two of the species, Syringa reticulata ‘Ivory Silk’ and Acer x freemanii ‘Jeffersred’, provide seasonal interest in the form of spring flowers and fall colours respectively. A pair at the centre of each block, as well as two rows framing the park entrance lawn, create a connection along the corridor and act as small landmarks to guide visitors along the space. Trees within the streetscape will be planted within Silva Cells to provide adequate soil volume for root growth, and will be protected from compaction by tree grates.
Gaukel Corridor Master Plan | Jonathan Hann64Planting Palette


Fanshawe College | August 2019 65 Furniture Palette Street and park furniture will be from Landscape Forms’ Metro 40 collection (see Fig. 41). The modern style compliments the existing street furniture along the King St corridor, while the combination of linear and curvilinear forms embodies the master plans design theme of transitioning from urban to natural. These elements will be used along the Gaukel Street corridor and Victoria Park entrance to aid in the seamlessness of the spaces. Master Plan Breakdown In order to provide more detail on the design elements, the master plan will be broken down into three distinct sections: the Gaukel Street Corridor, the Victoria Park Entrance, and the three Development Parcels (see Figs. 42 & 43). Each section will be discussed separately on the following pages. Green Space Proposed Buildings Vehicle CirculationActiveSITECirculationELEMENTSFigure42: SITE MASTERFigureFURNITUREGaukelCorridorVictoriaParkEntranceDevelopmentParcels43:PLANZONES


The planters will be filled with native planting, as detailed in Figure 39, and will help to capture and filter stormwater run off from the surrounding corridor. The position in the centre of the street will also help to break up the space and create additional ‘edges’ along the corridor. These edges will help the space to feel full and lively as activity fills in from the edges, while the low height of the planting will ensure that the two sides are linked visually. On the northern block, the planter is surrounded by a low concrete curb and seat wall in order to offer separation between the garden and vehicle lane. On the southern block, the gardens are bordered by a concrete band, which expands to fill the centre of the corridor where the gardens begin and end. The remainder of the space will be filled with mixed plank pavers. Pedestrian, frontage, and vehicle zones will use the same material in order to allow for maximum flexibility in the use of the space and to present a unified appearance. The pavers will continue across Charles St W and Joseph St, linking the three sections into one space. A small oval-shaped activity space at the centre of the southern block will serve as an anchor for the corridor and provide an area for events and informal gatherings. A small garden with seat wall frames the western edge of the space, with a concrete band loosely enclosing the remaining sides and linking the space with the other garden spaces. The space is framed by two Autumn Blaze Maples (Acer x freemanii ‘Jeffersred’), which help link it to the larger lawn space at the Victoria Park entrance.
A single row of trees separates the pedestrian and frontage zones on each side of the corridor. On the northern block, Hop Hornbeam (Ostrya virginiana), Columnar Zelkova (Zelkova serrata ‘Musashino’), and Ivory Silk Lilac (Syringa reticulata ‘Ivory Silk’) provide a smaller canopy that fits within the tight right of way and leaves sufficient space for pedestrian flow and furniture. The southern block makes use of medium sized street trees suited to the urban condition, with Common Hackberry (Celtis occidentalis), Skyline Honeylocust (Gleditsia tricanthos var. inermis ‘Skyline’), and Autumn Blaze Maple (Acer x freemanii ‘Jeffersred’). The use of smaller tree species will provide enclosure and shade for the pedestrian zones, while maintaining the open view corridor along the centre of the street and allowing sufficient sunlight to reach the bioretention gardens.
| Jonathan
The laneway is bordered by Ivory Silk Lilacs (Syringa reticulata ‘Ivory Silk’), providing visual interest and linking the space to the Victoria Park entrance.
Gaukel Corridor Master Plan Hann66Gaukel Street
The Gaukel St Corridor acts as the primary connector between City Hall, Downtown Kitchener, and Victoria Park. In order to better link the spaces, the transition from urban to natural is represented in the design of the street (see Fig. 44). A series of bioretention gardens, in the form of long oval planters, fills the centre of the street. This green ribbon grows larger as it works its way south to Victoria Park, where it links up with the new lawn at the revised park entrance.
The northern block contains a single southbound vehicle lane to allow access to existing businesses, residences, and Halls Ln. The vehicle lane will be delineated by a concrete band and bordered by removable bollards and the raised curb of the bioretention gardens. Pedestrian safety will also be enhanced by the minimal lane width and curvilinear shape. The southern block will be protected from vehicle incursions by removable bollards at Charles St W and Joseph St. Where Gaukel St meets Halls Ln, the planters give way to the lane, allowing full vehicle movement.
Fanshawe College | August 2019 67 King St W Charles St W Joseph St GaukelSt Halls Ln GardenBioretention Seat Wall GardenBioretention Seat Wall Frontage ZoneBollardsFurnitureBollards FrontageFurnitureZone One VehicleWayLaneOstryavirginianaZelkovaserrata‘Musashino’Syringareticulata‘IvorySilk’Celtisoccidentalis Gleditsia triacanthos var. inermis ‘Skyline’ Acer x ‘Jeffersred’freemanii Paving ConcreteExposedConcreteAcrossContinuesStreetBandPlankPaversAggregateConcretePlankPaversBandtoDelineateVehicleLanePavingContinuesAcrossStreetLRTPlatform BlockSouthBlockNorth Figure 44: GAUKEL STREET MASTER PLAN Seat Wall


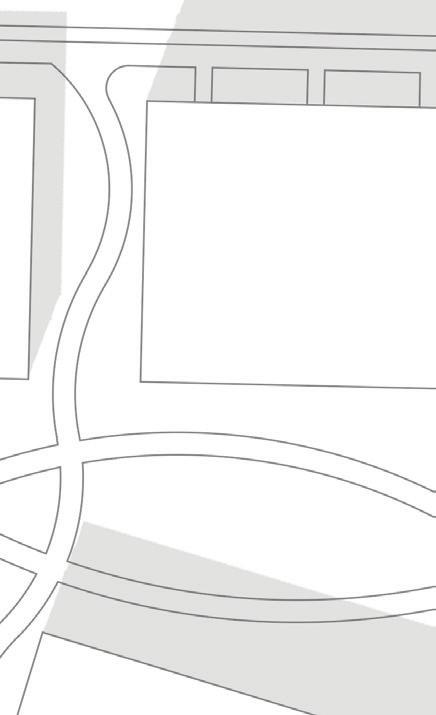


Gaukel Corridor Master Plan | Jonathan Hann68 Frontage1.5mZone Vehicle3mZoneZonePed.2m Furniture1mZone Silva Cells PlanterStormwater Planting3mZone NORTH BLOCK Image 45: North block with bioretention gardens, smaller tree canopy, and one-way southbound traffic lane
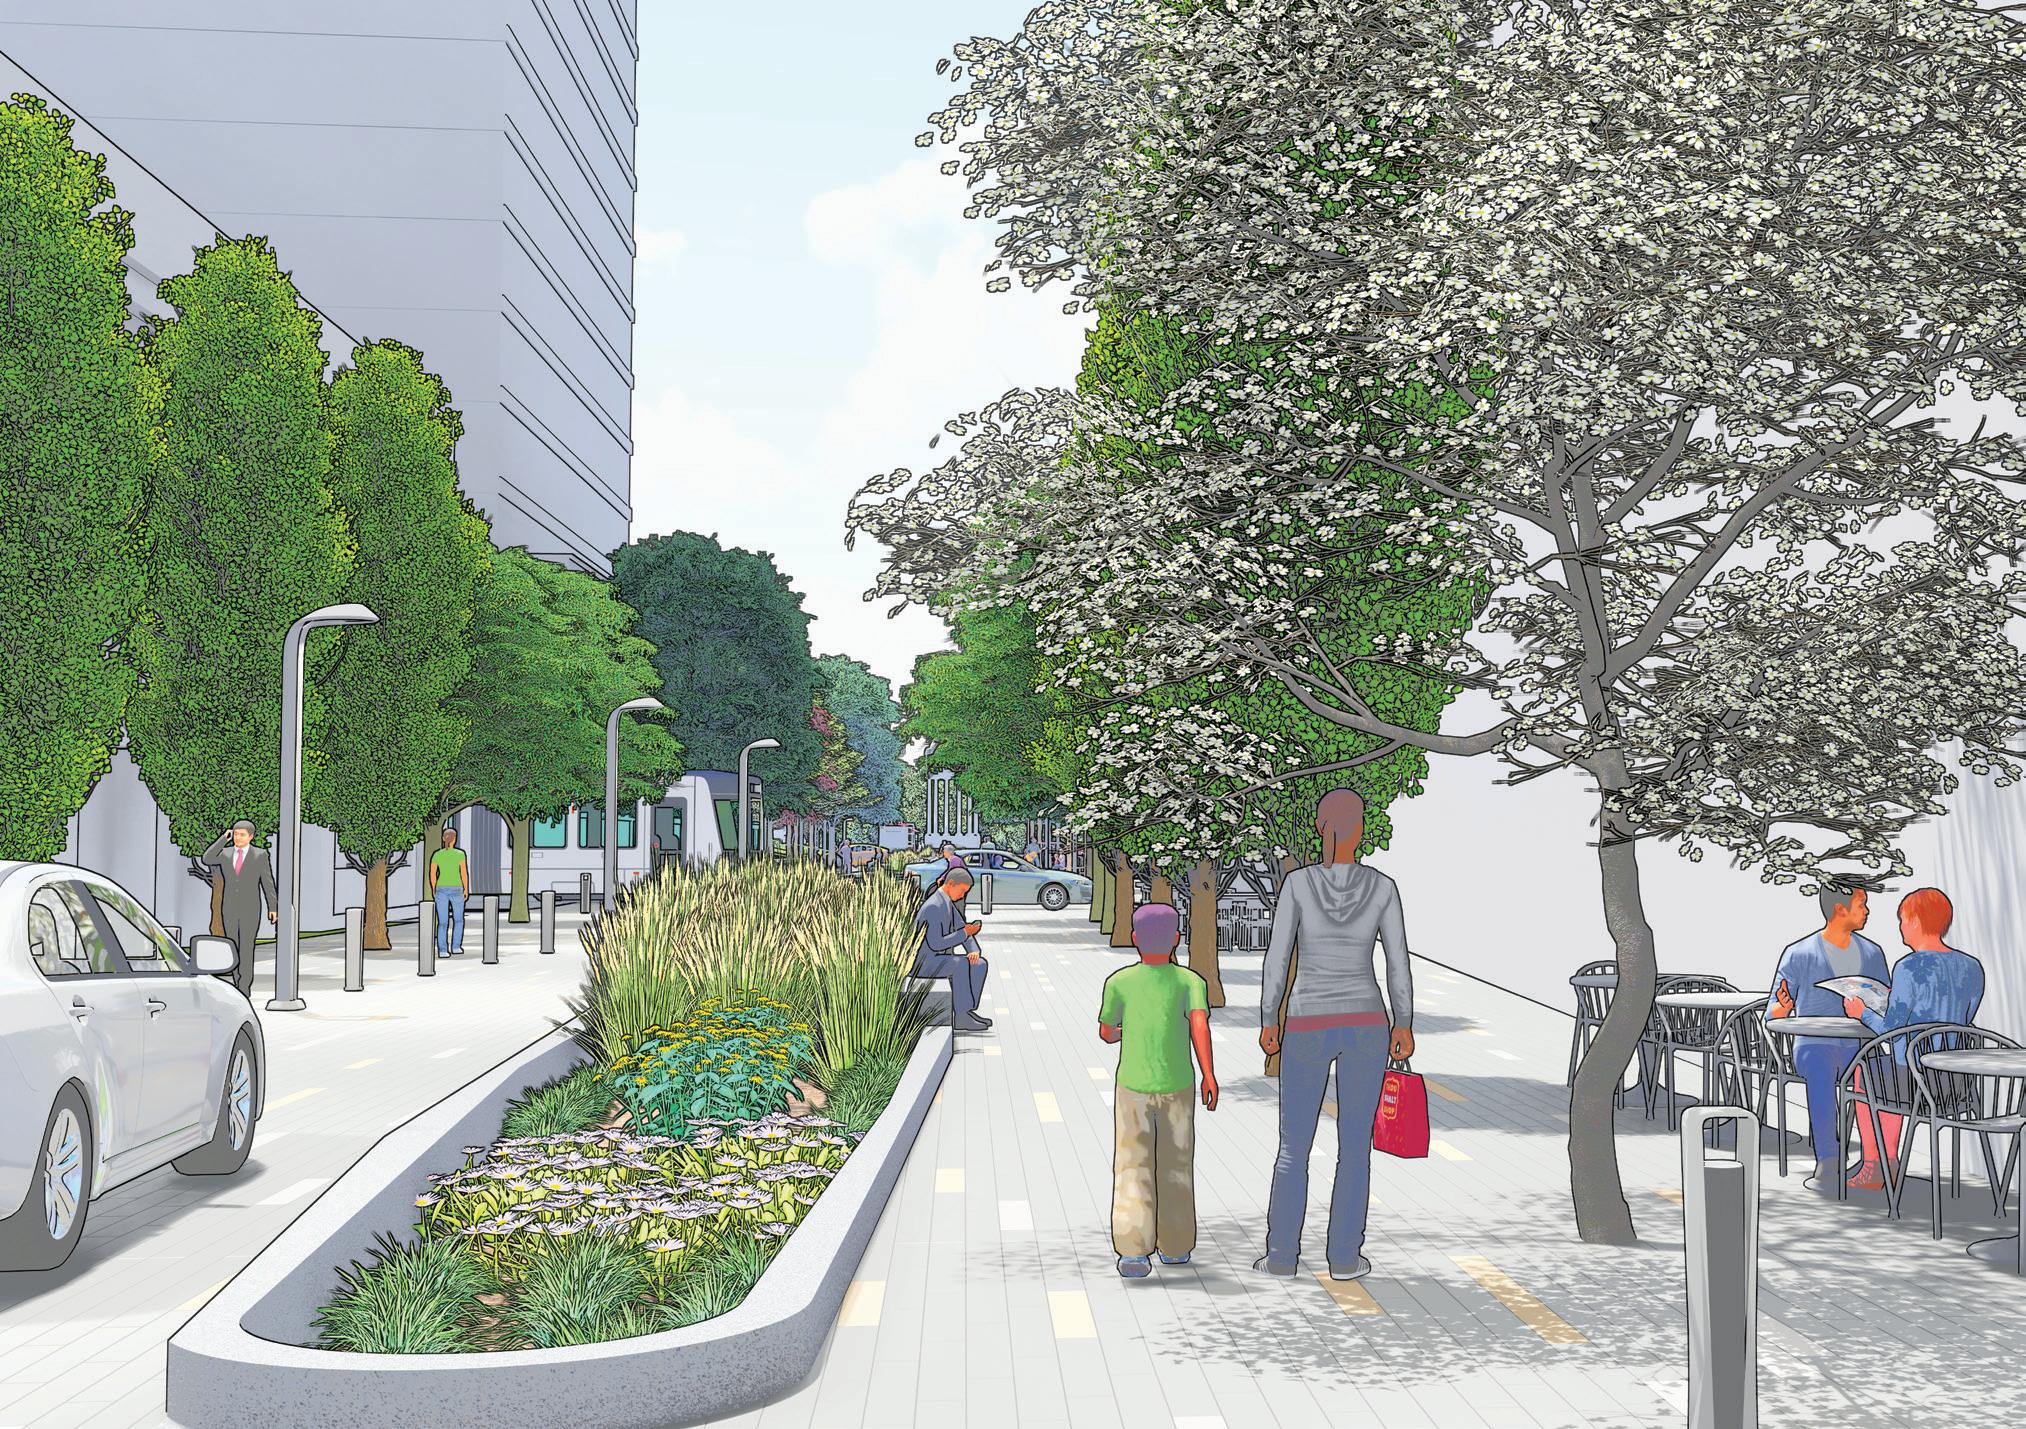


Gaukel Corridor Master Plan |
Image 47: Small plazas and water feature surround Victoria Park clock tower and provide gathering space
The concept for the new Victoria Park entrance connects the north end of the part with the new Gaukel corridor and creates an integrated space (see Fig. 45). The design removes the barriers of the existing walls and garden spaces and replaces it with an open lawn framed by paths, seat walls, and rows of trees. The oval form of the entrance acts as the link between the current Victoria Park lawn and the bioretention gardens to the north. The western edge is marked by a curving line of Autumn Blaze Maple (Acer x freemanii ‘Jeffersred’), while the eastern edge features a row of Ivory Silk Lilac (Syringa reticulata ‘Ivory Silk’) on a low, 1.5m berm. The berm frames the central promenade towards the clock tower, allows for seating facing the new lawn (along with concrete seat walls), and gives vertical separation to the passive garden spaces to the east without reducing safety. The tree rows and paths lead the visitor towards the historic clock tower and strengthen its position of prominence within the park. A shallow reflecting pool with fountain recreates the popular water features of the existing design and separates two small gathering spaces. These plazas and the new small lawn will allow for small events or offer supporting spaces for large events taking place on the main park lawn. The existing grove of mature trees at the west end of the entrance will be retained, with the existing garden spaces being recreated at the east end of the park. Both will provide a suitable buffer for the residential uses that are adjacent to the park.
Jonathan Hann70Victoria Park Entrance


Fanshawe College | August 2019 71 Syringareticulata‘IvorySilk’ Acer x ‘Jeffersred’freemanii Seat Wall Bollards PaversPlank Exposed AggregateConcretePavingAcrossContinuesStreet 1.5mBenchBerm Reflecting Pond withFountain Feature GatheringSpace Gathering Space Clock Tower and StepsLink to ExistingPath System Existing VictoriaPark Lawn MaintainTreeExistingGrove PlantedSeatAreaWall Figure 45: VICTORIA PARK ENTRANCE MASTER PLAN


Gaukel Corridor Master Plan | Jonathan Hann72 Image 48: Existing Victoria Park entrance Image 49: New lawn at Victoria Park entrance opens park to Gaukel corridor and frames view to clock tower


The residential towers are designed to transition in height from the focal point at Charles St W and Gaukel St down to the surrounding neighbourhoods at the edge of downtown (see Fig. 48). The heights are in line with the existing urban form of downtown, which has seen significant high-rise development in recent years. The massing of the blocks is also guided by the relevant planning policy outlined in the previously. Both the Official Plan and Zoning By-law allow for unlimited height in the downtown, with a maximum of 8 storeys south of Joseph St.
GroundCommercialFloor 25 12 3 residentialstorey4storey office 1821 LRT Platform Ground residentialCommercialFloor3storey 4 residentialstorey 4 Charlesresidentialstorey4storeyresidentialStWJosephSt OntarioStS DavidSt GroundCommercialFloor Figure 46: DEVELOPMENT PARCELS MASTER PLAN
The final section of the Master Plan includes midrise and high-rise development on three currently underutilized parcels surrounding Gaukel St (see Fig. 46). All of the parcels are developed with a similar massing, with a 3-4 storey podium and residential tower above. The podiums are structured to provide a pedestrian scale environment along the street and respect the low-rise residential nature of the surrounding Victoria Park neighbourhood. Ground floor commercial uses along Gaukel St will provide activity and liveliness to the pedestrian corridor, while the residential frontages will be designed with ground-oriented units and multiple entrances to provide interest and a sense of safety.
Development Parcels
Fanshawe College | August 2019 73


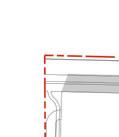
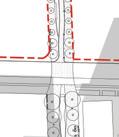


Gaukel Corridor Master Plan | Jonathan Hann74 As shown in Figure 47, the development blocks exceed the maximum permitted FSR, however the proposed form is supportive of policies regarding pedestrian-oriented development and a high standard of urban design, which would contribute positively to the potential for additional FSR allowance through bonusing. The high-rise form also contributes significant density to the Gaukel corridor, both in the form of population and jobs and is supportive of the city’s desire to focus intensification in the downtown. Looking South EastLooking North East Floor Space Ratio Required Proposed Block A 1-3 2.85 Block B 1-3 4.73 Block C 0.6-2 2.33 Office GFA 8,130m² Commercial GFA 1,850m² Residential Units 729 Figure 47: Figure 48: DEVELOPMENT STATISTICS PROPOSED MASSING Image 50: Surrounding development blocks create urban, pedestrian-friendly environment along corridor


This project has explored the connection between the physical design of the streetscape and the level of pedestrian friendliness through the lens of quan tifiable measurement. Combining the theories of Gehl, Ewing & Clemente, and Alexander with leading research has created a framework for measuring the experiential qualities of the street. By applying the measurements to a real-world context, both through the case studies and the final design proposal, this project has demonstrated the applicability of the framework and explored the pros and cons of such an Theapproach.post-design measurements highlight the impor tance of a collaborative approach to improving pe destrian friendliness. The scores developed by Ewing & Clemente were reliant on interventions in both the streetscape and surrounding built form, which was apparent in the Gaukel Street design. The greater potential for change in the southern block and ad jacent parcels led to significant score improvements that were not seen in the more constrained and built-up northern block. These findings underscore the limited potential of plans that target streetscape improvements without other, complimentary invest ments that encourage changes to facades, ground floor uses, and underdeveloped parcels. While not ineffective on their own, a comprehensive approach that combines all facets of the built environment will be significantly more effective in improving the pe destrian experience through a particular corridor.
Fanshawe College | August 2019 77 6 Conclusion
Ewing, R., & Clemente, O. (2013). Measuring Urban Design. Washington DC: Island Press. Ewing, R., Hajrasouliha, A., Neckerman, K. M., Purciel-Hill, M., & Greene, W. (2015, July). Streetscape Features Related to Pedestrian Activity. Journal of Planning Education and Research, 36(1), 5-15. doi:10.1177/0739456X15591585 Gehl, J. (2010). Cities for People. Washington DC: Island Press. Grand River Transit. (2018, March). Grand River Transit Business Plan 2017-2021. Retrieved from Grand River Transit: https://www.grt.ca/en/about-grt/resources/GRT-Business-Plan-2017-2021.pdf
Schmitt, A. (2017, December 29). The Best Urban Street Transformation of 2017 Is... Argyle & Grafton in Hali fax. Retrieved from Streetsblog USA: https://usa.streetsblog.org/ The Ottawa Citizen. (2008, March 22). The Strøget Solution. Retrieved from Canada.com: https://web.ar chive.org/
Jung, H., Lee, S.-y., Kim, H. S., & Lee, J. S. (2017, January). Does improving the physical street environment create satisfactory and active streets? Evidence from Seoul’s Design Street Project. Transportation Research Part D: Transport and Environment, 50, 269-279. doi:/10.1016/j.trd.2016.11.013
Alexander, C. (1977). A Pattern Language. New York: Oxford University Press. Ameli, S. H., Hamidi, S., Garfinkel-Castro, A., & Ewing, R. (2015). Do Better Urban Design Qualities Lead to More Walking in Salt Lake City, Utah? Journal of Urban Design, 20(3), 393-410. doi:10.1080/1357480 American9.2015.1041894PlanningAssociation. (2915). Pearl Street Mall: Boulder, Colorado. Retrieved from American Plan ning Association: https://www.planning.org/ Credit Valley Conservation. (2010, June). LANDSCAPE DESIGN GUIDE FOR LOW IMPACT DEVELOPMENT. Retrieved from Credit Valley Conservation: https://cvc.ca/wp-content/uploads/2012/02/cvc-lid-swmguide-appendix-b.pdf
Gaukel Corridor Master Plan | Jonathan Hann78 7 References
Harvey, C., Aultman-Hall, L., Hurley, S. E., & Troy, A. (2015, October). Effects of skeletal streetscape design on perceived safety. Landscape and Urban Planning, 142, 18-28. doi:10.1016/j.landurbplan.2015.05.007
Nieuwenhuijsen, M. J., & Khreis, H. (2016, September). Car free cities: Pathway to healthy urban living. Envi ronment International, 94, 251-262. doi:10.1016/j.envint.2016.05.032
Project for Public Spaces. (2010, March 4). 9 great streets around the world. Retrieved from Project for Public Spaces: https://www.pps.org/ Rodriguez, D. A., Merlin, L., Prato, C. G., Conway, T. L., Cohen, D., Elder, J. P., . . . Veblen-Mortenson, S. (2015, May). Influence of the built environment on pedestrian route choices of. Environment and Behaviour, 47(4), 359-394. doi:10.1177/0013916513520004
Hahm, Y., Yoon, H., & Choi, Y. (2019, June). The effect of built environments on the walking and shopping be haviors of pedestrians; A study with GPS experiment in Sinchon retail district in Seoul, South Korea. Cities, 89, 1-13. doi:10.1016/j.cities.2019.01.020
List of Figures All figures by Jonathan Hann unless listed below Figure 1: City of Kitchener GIS Data, ESRI Aerial FigureImagery2-3: ESRI Aerial Imagery Figure 4: City of Kitchener OnPoint Mapping Figure 7: City of Kitchener GIS Data Figure 8: City of Kitchener OnPoint Mapping Figure 9: City of Kitchener GIS Data Figure 10: City of Kitchener OnPoint Mapping Figure 11-12: City of Kitchener GIS Data, Statistics Canada Census Data Figure 13: ESRI Aerial Imagery Figure 14-17: City of Kitchener GIS Data Figure 18: City of Kitchener GIS Data, OnPoint Map Figureping 19: City of Kitchener GIS Data Figure 20: City of Kitchener Official Plan Map 4 Figure 21: City of Kitchener Official Plan Map 14 Figure 22: City of Kitchener Zoning By-law Mapping Figure 23: City of Kitchener Urban Design Manual Part FigureA 25: ESRI Base Mapping Figure 29: ESRI Aerial Imagery Figure 37: Google Earth Aerial Imagery Figures 44-46: Google Earth Aerial Imagery List of Images All images by Jonathan Hann unless listed below Image 18: General/TopSearch3_Spring.jpgImageg?cb=0ebdbfdcf4617e95932cf9f20d9cc016&w=640loads/93078/download/Victoria-Park-Kitchener.jphttps://nowtoronto.com/down21:https://www.kitchener.ca/en/resources Image 22: https://www.kpl.org/sites/default/files/ jpg?itok=7m0w96JKstyles/panopoly_image_original/public/kpl-central. Image 23: https://farm6.static.flickr. Imagemax1024x768/657/65742419.jpgImagecom/5768/22878232076_5a45400b4b_b.jpg24:https://t-ec.bstatic.com/images/hotel/25:https://moramasonry.com/sites/de fault/files/styles/banner/public/banners/TAN ImageImageImageFile/image.jpg?id=76Imageer%20with%20Cranes.pngpng?width=1387&name=Downtown%20KitchenDowntown%20Kitchener%20with%20Cranes.Imageb312e12b4664d2483d11.jpg?1524670443user_assets/large/8d37357dfcbcfe2431afImageNERY_1118sm_0.jpg?itok=7ppKUiRk26:https://sl2-prod.s3.amazonaws.com/27:https://blog.waterlooedc.ca/hs-fs/hubfs/28:https://www.kitchenerevents.ca/Module32:GoogleStreetview34-44:GoogleStreetview48:GoogleStreetview
Thompson, C. (2019, May 5). Fate of Kitchener bus terminal up in the air. Waterloo Region Record. Retrieved from https://www.therecord.com/ Thompson, C. (2019, February 27). Kitchener resident proposes turning Gaukel Street into a pedestrian promenade. Waterloo Region Record. Retrieved from https://www.therecord.com/ Yin, L. (2015). Book Review: Design: Planning Litera ture, 29(3), 273-274. doi:10.1177/0885412214531541
Metrics for Liveable Places. Journal of
Fanshawe College | August 2019 79
Measuring Urban
The Province of Ontario. (2013, February). King Street Reconstruction - Kitchener, Ontario. Retrieved from Places to Grow: https://www.placestogrow.ca/content/resources/ufcs/king_street/ufcs_king_st.pdf
Proportion of sky An estimate of the sky visible along the road in front of the viewer and across the road. Measured through a typical frame of vision looking straight ahead.
Human Scale Long sight lines Duplicate measurement from the Enclosure catego ry Street level windows
Proportion of street wall
Street trees A dummy value representing the presence of street trees on either side of the road and/or in the median.
This measure would rate the noise along the block on a scale of 1-5, however the desktop survey meth od used for this study did not allow for an auditory inventory. This measure was excluded from the in ventory. Enclosure Long sight lines A count of the number of directions where long sight lines are present, defined as the ability to see at least 1,000 feet (300m). Views along cross streets at the ends of blocks are not included.
The five measurement categories are taken directly from the field study portion of Ewing & Clemente’s (2013) book and are comprised of the following cri teria: Imageability Number of courtyards Counting courtyards, plazas, and parks adjacent to the study area. Number of major landscape features Counting major natural landscape views such as mountains or water bodies, or man-made features incorporating the environment such as marinas.
Appendix A
Gaukel Corridor Master Plan | Jonathan Hann80
Categories
Proportion of historic buildings
Given the variability of the streets surveyed in this project, the pedestrian counts will be normalized us ing the study area length in order to provide compa rable counts. Noise level
The percentage of the block occupied by histor ic buildings, determined as buildings built prior to World War II. Building identifiers The number of buildings where the use can be clear ly identified, either through signage or through the building design, such as the steeple of a church. Nonrectangular buildings Counting buildings that appear as nonrectangu lar when viewed from street level, including those with pitched roofs, bay windows, dormers, or build ings that are a combination of multiple rectangular shapes so as to appear nonrectangular from a par ticular vantage point. Outside dining A dummy variable recording the presence or ab sence of outdoor dining. People Counting the number of people within the study area. The block faces in Ewing & Clemente’s (2013) study are a consistent length (approximately 300 ft), so pedestrian counts are comparable among blocks.
Measure of the street wall on either side of the study area, measured to the nearest 10%. Walls, fences, and landscaping over 5 feet (2m) tall are included in the calculation, assuming the setback is less than 10 feet (3m) from the sidewalk edge.
Urban MeasurementDesign
The number of buildings on either side of the street, including those on corner lots. The building counts were normalized to a 100m block length.
A count of distinct basic building colours, not includ ing shades of the same colour. Building accent colours A count of distinct building accent colours, such as roofs, trim, and signage.
The proportion of active uses along the block to within 10%. Active uses include parks, retail and restaurant commercial, apartment residential, and institutional buildings. Inactive uses include single family residential, churches, parking lots, and vacant lots. Uses outside of these were estimated based on street level activity (the field guide recommends more than 5 users during the block observation pe riod). Further, if a building is considered active, all fa cades are considered active, even those with blank walls.
A total count of all street furniture along the block, including lighting (street lights and building lights on the first storey), seating (benches and dining tables), waste storage, bollards, sign boards, and retail dis plays. Counts of general furniture (not including din ing tables/chair and building lights) were capped at 40, after being normalized for block length.
Complexity Building count
Building colours
Duplicate measurement from the Human Scale cat egory Proportion of street wall Duplicate measurement from the Enclosure catego ry Active uses
A duplicate of the measurement from the Imageabil ity category. Public art A count of the public art pieces including murals, monuments, sculptures, or any display that is pub licly accessible Pedestrians A duplicate of the measurement from the Imageabil ity category.
Fanshawe College | August 2019 81
A count of small planters within 10 feet of the side walk edge, defined as landscaping within a pot that appears to be permanent (not small enough to be moved regularly). Street furniture
An estimate of the proportion of windows at street level, including those with reflective or translucent treatments. Average building height A calculation of the average building height along the block, measured in storeys and converted to feet (10 feet per storey) to match the field manual’s criteria.
Transparency Street level windows
Outdoor dining
Calculation of Results
Each recorded measurement value was normalized to a standard 100m block length and multiplied by a coefficient provided in Ewing & Clemente’s (2013) research to obtain a score. These scores were then totalled for the respective categories. An additional overall score for each case study is calculated by to talling the scores of the five categories.
Small planters
Gaukel Corridor Master Plan | Jonathan Hann82 GaukelExistingN Gaukel ExistingS Gaukel ProposedN Gaukel ProposedS Study Area Length 100m 82m 100m 82m Measurement Coeff. Value Score Value Score Value Score Value Score Plazas 0.414 0.00 0.00 2.00 0.83 1.00 0.41 2.00 0.83 Landscape Features 0.722 0.00 0.00 0.00 0.00 0.00 0.00 0.00 0.00 Historic Buildings 0.970 0.45 0.44 0.00 0.00 0.45 0.44 0.00 0.00 Building Identifiers 0.111 3.00 0.33 2.00 0.27 4.00 0.33 3.00 0.41 Non-Rect. Buidings 0.080 2.00 0.16 1.00 0.08 3.00 0.24 3.00 0.24 Outdoor Dining 0.644 1.00 0.64 0.00 0.00 1.00 0.64 1.00 0.64 Imageability Score 1.57 1.18 2.07 2.12 Long Sight Lines -0.308 1.00 -0.31 3.00 -0.92 1.00 -0.31 1.00 -0.31 Street Wall A 0.716 0.40 0.29 0.50 0.36 0.75 0.54 0.90 0.64 Street Wall B 0.940 0.80 0.75 0.00 0.00 0.80 0.75 1.00 0.94 Sky Ahead -1.418 0.30 -0.43 0.40 -0.57 0.15 -0.21 0.10 -0.14 Sky Across -2.193 0.05 -0.11 0.50 -1.10 0.00 0.00 0.00 0.00 Enclosure Score 0.20 -2.23 0.77 1.13 Long Sight Lines -0.744 1.00 -0.74 3.00 -2.23 1.00 -0.74 1.00 -0.74 Ground Floor Windows 1.099 0.40 0.44 0.20 0.22 0.60 0.66 0.75 0.82 Building Height -0.003 10.00 -0.03 10.00 -0.03 150.0 -0.46 170.0 -0.52 Planters 0.050 3.00 0.15 0.00 0.00 10.00 0.50 8.00 0.40 Street Furniture 0.036 30.00 1.09 11.00 0.49 58.00 2.11 82.00 3.32 Furniture N/A 23.00 11.00 40.00 40.00 Tables N/A 4.00 0.00 10.00 34.00 Building Lights N/A 3.00 0.00 8.00 8.00 Human Scale Score 0.91 -1.55 2.07 3.28 Ground Floor Windows 1.219 0.40 0.49 0.20 0.24 0.60 0.73 0.70 0.85 Street Wall 0.666 0.60 0.40 0.25 0.17 0.78 0.52 0.95 0.63 Active Uses 0.533 0.45 0.24 0.75 0.40 0.70 0.37 0.95 0.51 Transparency Score 1.13 0.81 1.62 1.99 Number of Buildings 0.051 5.00 0.26 1.00 0.06 5.00 0.26 3.00 0.19 Building Colours 0.177 6.00 1.06 3.00 0.53 6.00 1.06 5.00 0.89 Building Accents 0.018 6.00 0.11 1.00 0.02 6.00 0.11 5.00 0.09 Outdoor Dining 0.367 1.00 0.37 0.00 0.00 1.00 0.37 1.00 0.37 Public Art 0.272 0.00 0.00 0.00 0.00 0.00 0.00 0.00 0.00 Complexity Score 1.79 1.79 1.53 Overall Score 5.59 -1.18 8.31 10.05 ImageabilityScaleHumanComplexityTransparencyEnclosure Urban Design Measurement Results - Gaukel Street
Fanshawe College | August 2019 83 Argyle Street DowntownMall GranvilleStreet King Street Study Area Length 100m 60m 150m 185m Measurement Coeff. Value Score Value Score Value Score Value Score Plazas 0.414 0.00 0.00 0.00 0.00 0.00 0.00 2.00 0.83 Landscape Features 0.722 0.00 0.00 0.00 0.00 0.00 0.00 0.00 0.00 Historic Buildings 0.970 0.40 0.39 0.60 0.58 0.30 0.29 0.50 0.49 Building Identifiers 0.111 8.00 0.89 12.00 2.22 6.00 0.44 24.00 1.44 Non-Rect. Buidings 0.080 4.00 0.32 3.00 0.24 1.00 0.08 4.00 0.32 Outdoor Dining 0.644 1.00 0.64 1.00 0.64 0.00 0.00 1.00 0.64 Imageability Score 2.24 3.68 0.81 3.72 Long Sight Lines -0.308 0.00 0.00 0.00 0.00 0.00 0.00 0.00 0.00 Street Wall A 0.716 1.00 0.72 1.00 0.72 1.00 0.72 0.80 0.57 Street Wall B 0.940 1.00 0.94 1.00 0.94 1.00 0.94 0.90 0.85 Sky Ahead -1.418 0.15 -0.21 0.15 -0.21 0.10 -0.14 0.30 -0.43 Sky Across -2.193 0.05 -0.11 0.00 0.00 0.00 0.00 0.10 -0.22 Enclosure Score 1.33 1.44 1.51 0.77 Long Sight Lines -0.744 0.00 0.00 0.00 0.00 0.00 0.00 0.00 0.00 Ground Floor Windows 1.099 0.60 0.66 0.70 0.77 0.70 0.77 0.70 0.77 Building Height -0.003 40.00 -0.12 30.00 -0.90 180.0 -0.55 20.00 -0.66 Planters 0.050 8.00 0.40 8.00 0.40 0.00 0.00 9.00 0.45 Street Furniture 0.036 87.00 3.31 44.00 2.67 61.00 1.48 66.00 1.30 Furniture N/A 31.00 20.00 55.00 50.00 Tables N/A 40.00 20.00 0.00 16.00 Building Lights N/A 16.00 4.00 6.00 0.00 Human Scale Score 4.25 3.74 1.70 2.45 Ground Floor Windows 1.219 0.60 0.73 0.70 0.85 0.70 0.85 0.70 0.85 Street Wall 0.666 1.00 0.67 1.00 0.67 1.00 0.67 0.85 0.57 Active Uses 0.533 1.00 0.53 0.75 0.40 1.00 0.53 0.80 0.43 Transparency Score 1.93 1.92 2.05 1.85 Number of Buildings 0.051 8.00 0.41 7.00 0.60 6.00 0.20 11.00 0.30 Building Colours 0.177 3.00 0.52 3.00 0.53 3.00 0.53 5.00 0.89 Building Accents 0.018 3.00 0.05 2.00 0.04 2.00 0.04 5.00 0.09 Outdoor Dining 0.367 1.00 0.37 1.00 0.37 0.00 0.00 1.00 0.37 Public Art 0.272 0.00 0.00 0.00 0.00 0.00 0.00 1.00 0.27 Complexity Score 1.36 1.53 0.77 1.92 Overall Score 11.11 12.32 6.85 10.71 ImageabilityScaleHumanComplexityTransparencyEnclosure Urban Design Measurement Results - Case Studies
Gaukel Corridor Master Plan | Jonathan Hann84 Las Ramblas Pearl Street Sparks Street Stephen Ave Walk Study Area Length 220m 92m 160m 146m Measurement Coeff. Value Score Value Score Value Score Value Score Plazas 0.414 0.00 0.00 0.00 0.00 0.00 0.00 0.00 0.00 Landscape Features 0.722 0.00 0.00 0.00 0.00 0.00 0.00 0.00 0.00 Historic Buildings 0.970 0.80 0.78 0.80 0.78 0.60 0.58 0.70 0.68 Building Identifiers 0.111 27.00 1.36 17.00 2.05 16.00 1.11 16.00 1.22 Non-Rect. Buidings 0.080 3.00 0.24 6.00 0.48 2.00 0.16 3.00 0.24 Outdoor Dining 0.644 0.00 0.00 1.00 0.64 1.00 0.64 1.00 0.64 Imageability Score 2.38 3.95 2.50 2.78 Long Sight Lines -0.308 0.00 0.00 0.00 0.00 1.00 -0.31 0.00 0.00 Street Wall A 0.716 1.00 0.72 1.00 0.72 1.00 0.72 1.00 0.72 Street Wall B 0.940 1.00 0.94 0.90 0.85 1.00 0.94 1.00 0.94 Sky Ahead -1.418 0.10 -0.14 0.20 -0.28 0.20 -0.28 0.10 -0.14 Sky Across -2.193 0.00 0.00 0.20 -0.44 0.00 0.00 0.05 -0.11 Enclosure Score 1.51 0.84 1.06 1.40 Long Sight Lines -0.744 0.00 0.00 0.00 0.00 1.00 -0.74 0.00 0.00 Ground Floor Windows 1.099 0.70 0.77 0.70 0.77 0.65 0.71 0.70 0.77 Building Height -0.003 50.00 -0.15 20.00 -0.06 70.00 -0.21 30.00 -0.09 Planters 0.050 0.00 0.00 5.00 0.25 11.00 0.55 0.00 0.00 Street Furniture 0.036 94.00 1.46 42.00 1.66 63.00 1.43 79.00 1.97 Furniture N/A 94.00 23.00 29.00 54.00 Tables N/A 0.00 6.00 20.00 11.00 Building Lights N/A 0.00 13.00 14.00 14.00 Human Scale Score 2.07 2.62 1.74 2.65 Ground Floor Windows 1.219 0.70 0.85 0.70 0.85 0.65 0.79 0.70 0.85 Street Wall 0.666 1.00 0.67 0.95 0.63 1.00 0.67 1.00 0.67 Active Uses 0.533 1.00 0.53 1.00 0.53 0.60 0.32 0.80 0.43 Transparency Score 2.05 2.02 1.78 1.95 Number of Buildings 0.051 27.00 0.63 17.00 0.94 19.00 0.61 16.00 0.56 Building Colours 0.177 2.00 0.35 2.00 0.35 5.00 0.89 5.00 0.89 Building Accents 0.018 2.00 0.04 6.00 0.11 3.00 0.05 6.00 0.11 Outdoor Dining 0.367 0.00 0.00 1.00 0.37 1.00 0.37 1.00 0.37 Public Art 0.272 0.00 0.00 1.00 0.27 0.00 0.00 0.00 0.00 Complexity Score 1.02 2.04 1.91 1.92 Overall Score 9.03 11.47 8.99 10.69 ImageabilityScaleHumanComplexityTransparencyEnclosure Urban Design Measurement Results - Case Studies
Fanshawe College | August 2019 85 Strøget West Saint Julian Street CaseMeanStudy Study Area Length 85m 57m N/A Measurement Coeff. Value Score Value Score Value Score Plazas 0.414 0.00 0.00 0.00 0.00 0.20 0.08 Landscape Features 0.722 0.00 0.00 0.00 0.00 0.00 0.00 Historic Buildings 0.970 1.00 0.97 1.00 0.97 0.67 0.65 Building Identifiers 0.111 12.00 1.57 6.00 1.17 12.13 1.35 Non-Rect. Buidings 0.080 9.00 0.72 0.00 0.00 3.50 0.28 Outdoor Dining 0.644 1.00 0.64 1.00 0.64 0.80 0.52 Imageability Score 3.90 2.78 2.87 Long Sight Lines -0.308 0.00 0.00 1.00 -0.31 0.20 -0.06 Street Wall A 0.716 1.00 0.72 1.00 0.72 0.98 0.70 Street Wall B 0.940 1.00 0.94 1.00 0.94 0.98 0.92 Sky Ahead -1.418 0.10 -0.14 0.25 -0.35 0.17 -0.23 Sky Across -2.193 0.00 0.00 0.05 -0.11 0.05 -0.10 Enclosure Score 1.51 0.88 1.23 Long Sight Lines -0.744 0.00 0.00 1.00 -0.74 0.20 -0.15 Ground Floor Windows 1.099 0.70 0.77 0.50 0.55 0.67 0.73 Building Height -0.003 40.00 -0.12 20.00 -0.06 50.00 -0.15 Planters 0.050 0.00 0.00 7.00 0.35 4.80 0.24 Street Furniture 0.036 22.00 0.94 35.00 2.24 50.71 1.85 Furniture N/A 5.00 10.00 37.10 Tables N/A 1.00 22.00 14.00 Building Lights N/A 16.00 3.00 8.60 Human Scale Score 1.59 2.33 2.51 Ground Floor Windows 1.219 0.70 0.85 0.50 0.61 0.67 0.81 Street Wall 0.666 1.00 0.67 1.00 0.67 0.98 0.65 Active Uses 0.533 1.00 0.53 1.00 0.53 0.90 0.48 Transparency Score 2.05 1.81 1.94 Number of Buildings 0.051 12.00 0.72 6.00 0.54 10.78 0.55 Building Colours 0.177 5.00 0.89 2.00 0.35 3.50 0.62 Building Accents 0.018 4.00 0.07 4.00 0.07 3.70 0.07 Outdoor Dining 0.367 1.00 0.37 1.00 0.37 0.80 0.29 Public Art 0.272 0.00 0.00 1.00 0.27 0.30 0.08 Complexity Score 2.04 1.60 1.61 Overall Score 11.10 9.40 10.17 ImageabilityScaleHumanComplexityTransparencyEnclosure Urban Design Measurement Results - Case Studies