3GreenhouseGasLines
Alinebylinecalculationofradiativeforcingutilizesvariousparametersthatarenowbriefly discussed.
3.1LineIntensities
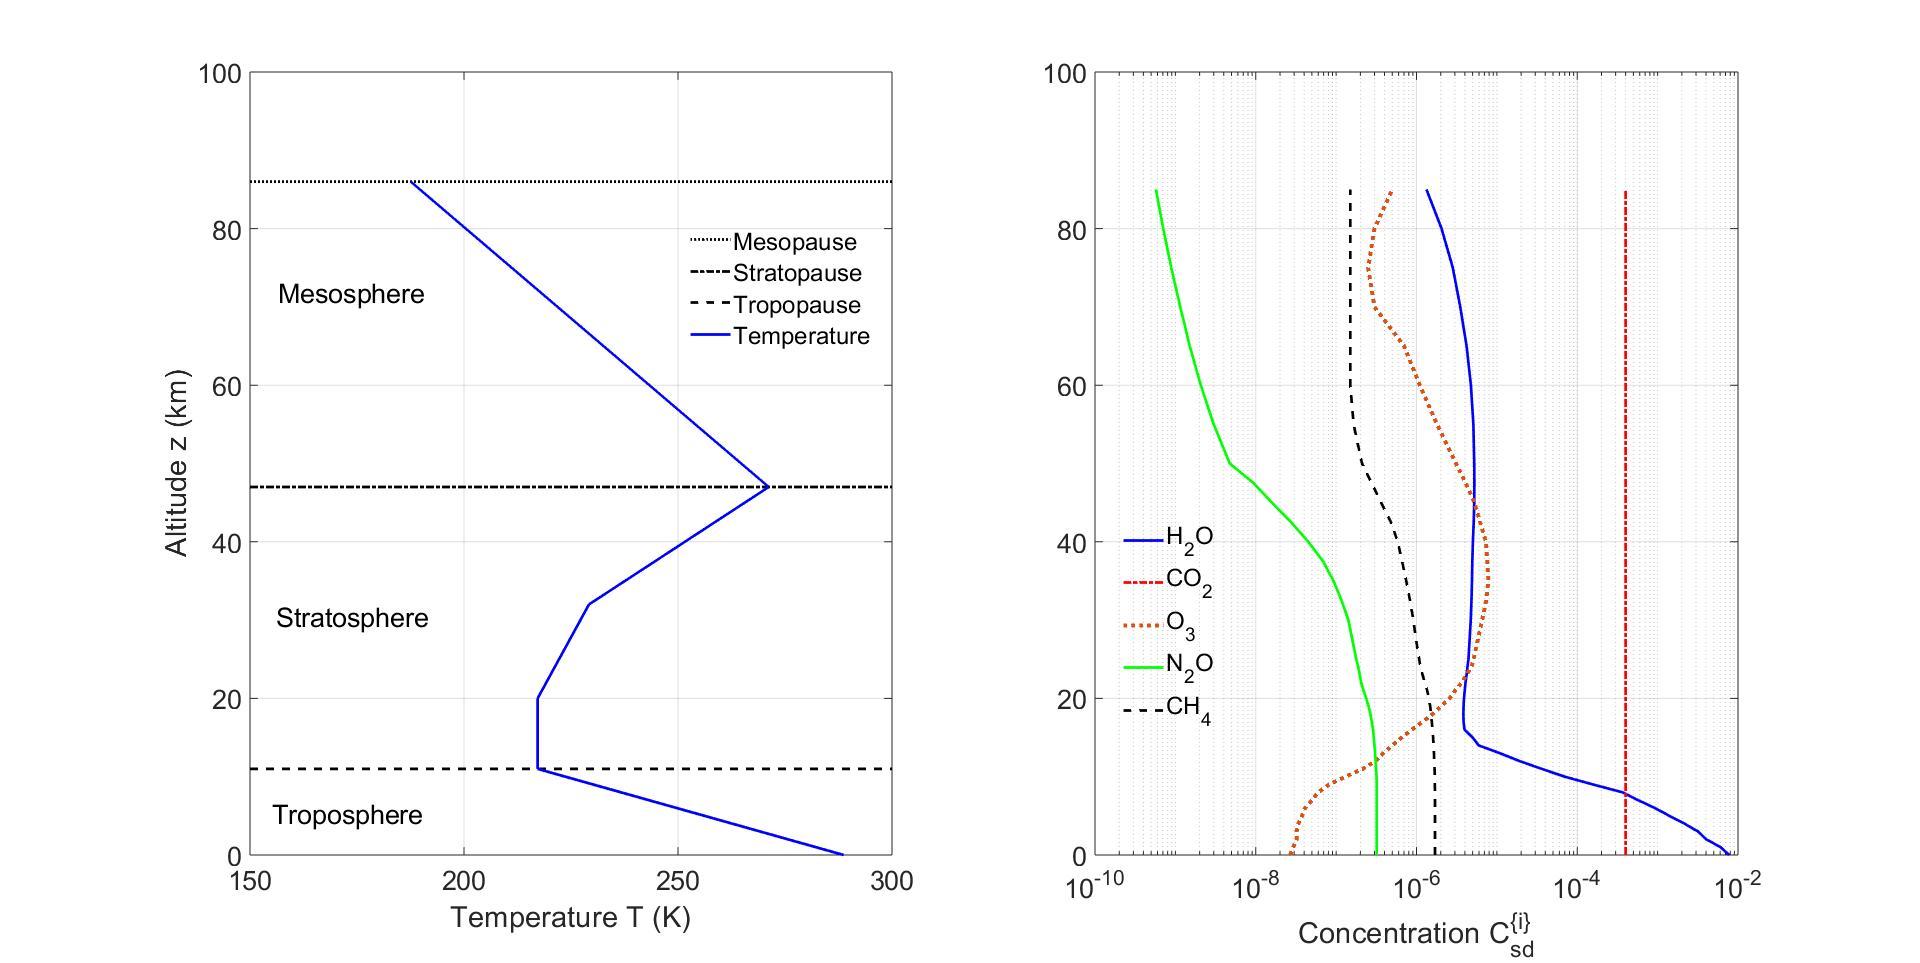
Fig.2illustratesthegreenhousegaslinesconsideredinthiswork.TheBohrfrequency νul foraradiativetransitionfromalowerlevel l ofenergy El toanupperlevel u ofenergy Eu ofthesamemoleculeisdenotedby
wheretheenergyofaresonantphotonis Eul, h isPlanck’sconstantand c isthespeedof light.
Thecrosssection, σ{i} = σ,forthe ithtypeofgreenhousemoleculeiswrittenasthesum ofpartialcrosssections σul,correspondingtoeachBohrfrequency νul,
Thepartialcrosssection, σul,isassumedtobetheproductofalineshapefunction, Gul = Gul(ν,τ ),andalineintensity, Sul = Sul(T ),
Thelineshapefunctions, Gul,arenormalizedtohaveunitarea,
andhaveunitsofcm.Thelineintensityis
In(6), Sul hastheunitsofcm, re = e2/(mec2)istheclassicalelectronradius,where e isthe elementarychargeand me istheelectronmass.Theisotopologuefractionsare ηu.Forthe mostabundantisotopologuesofCO2,
Thelasttermof(6)containsthespectralPlanckintensityevaluatedatthefrequency νul,
ThePlanckintensityisgivenby
Theradiationfrequency, ν =1/λ istheinverseofthewavelength λ andhasunitsofcm 1 Theprobability Wn (with n = u or n = l)tofindamoleculeintherovibrationallevel n is
Figure2:Referencelineintensities, S{r} ul of(15)forH2O,CO2,O3,N2OandCH4 from theHITRANdatabase[6].ThehorizontalcoordinateofeachpointrepresentstheBohr frequency νul ofatransitionfromanupperlevel u toalowerlevel l.Theverticalcoordinate ofthepointisthelineintensity.Forgreaterclaritywehaveplottedonly1/10,chosen atrandom,oftheextremelylargenumberofO3 lineintensities.Thenumbersoflines (inparenthesis)usedforthisworkwere:H2O(31,112),CO2 (20,569),O3 (210,295),N2O (43,152)andCH4 (43,696).ThesmoothlineisthePlanckspectralintensity, B of(9)in unitsofmWcmm 2 sr 1 fortheHITRANreferencetemperature, T {r} =296K.
Here gn isthestatisticalweightofthelevel n,thenumberofindependentquantumstates withthesameenergy En.Formoleculesinthelevel n,thestatisticalweightcanbetaken tobe
where jn istherotationalangularmomentumquantumnumber,and kn isthenucleardegeneracyfactor,thatdependsonwhetherthespinsofthenucleiareidenticalornot.The partitionfunction, Q = Q(T ),ofthemoleculeis
Theoscillatorstrength, ful,of(6)isrelatedtothematrixelementsoftheelectricdipole moment M ofthemolecule,betweentheupperenergybasisstate |jumu withazimuthal
quantumnumber mu andthelowerenergybasisstate |jlml ,by ful = 4πνul 3glcre muml
u|M|lml · lml|M|umu .
Thequantumnumbers mu labelthevariousdegeneratesubstatesoftheupperlevel u and the ml labelthesubstatesofthelowerlevel l.Ifthelevelsarecharacterizedbyrotational quantumnumbers ju and jl,thequantumnumbers mu and ml canbethoughtofasthe correspondingazimuthalquantumnumbers,forexample, mu = ju,ju 1,..., ju.
Therateofspontaneousemissionofphotonswhenthemoleculemakestransitionsfrom theupperlevel u tothelowerlevel l isΓul,thesameastheEinstein A coefficient,Γul = Aul [19,20].Thespontaneousemissionrateisrelatedtotheoscillatorstrengthby
Frominspectionof(6)weseethatthelineintensity Sul = Sul(T )atsomearbitrary temperature T isrelatedtotheintensity, S{r} ul = Sul(T {r})atareferencetemperature T {r} wherethepartitionfunctionof(12)isrelatedto Q{r} = Q(T {r})by
(15)
ThisworkconsideredalllinesintheHITRANdatabaseofthefivegasesunderconsideration inhavingintensitiesgreaterthan10 25 cm.ForH2O,lineshavingintensitiesgreaterthan 10 27 cmwereincludedsincewatervaporhasanorderofmagnitudegreaterdensitythan anyothergreenhousegasneartheEarth’ssurface.
3.2Lineshapes
Itisconvenienttowritethelineshapefunctionastheproductofa“core”profile Cul = Cul(ν) andawing-suppressionfactor, χul = χul(ν),
(16)
Corefunctions ThecorefunctionisnormallytakentobeaDopplerbroadenedLorentzian, oftencalledaVoigtprofile[21].IfweaverageoveraMaxwelliandistributionofvelocities v formoleculesofmass m atthetemperature T wefindthatthecorefunctionhastheform
ThehalfwidthathalfmaximumofapurelyDopplerbroadenedlineis
(18)
Here,therepresentativeDopplerhalfwidthisforaresonancefrequency νul ofthe667cm 1 bandofaCO2 moleculenearthecoldmesopause.
Thehalfwidthathalfmaximum, µul,oftheLorentzianfunctionin(17)isalmostentirely duetocollisions.Thecontributionto µul fromspontaneousradiativedecayisnegligibleat altitudesbelowthemesopause.ForthebendingmodeofCO2,representativevalues[5]of µul atatmosphericpressure p are
(19)
Here p0 =1bar,theapproximateatmosphericpressureatmeansealevel.Thepressure broadeningcoefficientsdependsomewhatontemperatureandontheparticularresonance, ul,involved.
For(17),asmall,temperaturedependentpressureshift[5]mustbeaddedtothefree moleculeBohrfrequencyof(2),whichwedenoteby ν{0} ul ,todefinetheresonancefrequency
Themagnitudeofthepressureshiftcoefficient δul isoforder
comparabletotheDopplerhalfwidth(18).Thesmallpressureshiftshavenegligibleinfluence onradiativeforcingcalculations,butthepressurebroadeningcoefficientsof(19)havealarge effect.Collisionssignificantlybroadenabsorptionlinesinthetroposphereandstratosphere.
Wing-suppressionfunctions Lorentzprofilesgivefartoomuchabsorptionforlarge detunings |ν νul|,soitisnecessarytoincludewingsuppressionfactors χ intheexpression (16)forthelineshapefunction[22,23].Lorentzianlineshapesresultfromassumingan infinitelyshortcollisionduration,butinfactcollisionstakeafewpsforcompletion.The collisionalinteractionsthatleadtowingsuppressionarenotknownwellenoughforreliable theoreticalcalculations,soweusetheempiricalwingsuppressionfactor
MeasurementsonbandsofCO2,forexamplebyEdwardsandStrow[24],suggestthatthe farwingsdecreaseapproximatelyexponentiallywithdetuning, |ν νul|,asdoesthewing suppressionfunction(22).Weusedthewidthparameter =2cm 1,correspondingtoa collisiondurationofafewpicoseconds.
4Radiation
Incloud-freeairwherescatteringisnegligible,radiationtransportisgovernedbytheSchwarzschild equation[25],
where I = I(ν,z,θ)isthespectralintensityofapencilofradiationoffrequencybetween ν and ν +dν ataltitude z.Thepencilmakesanangle θ tothevertical.Inthermalequilibrium, thespectralintensity ˜ I equalsthePlanckintensitygivenby(9).Theopticaldepthisdefined by
wherethenetattenuationcoefficientduetomoleculesabsorbingandremittinglightof frequency ν ataltitude z isgivenby
Here N {i}(z)isthedensityofgreenhousegasmoleculeoftype i and σ
(z,ν)is itsabsorptioncrosssectionforradiationoffrequency ν atthealtitude z givenby(3).The crosssectioncandependstronglyonaltitudebecausetemperatureandpressurearefunctions ofaltitude.Temperaturecontrolsthedistributionofthemoleculesbetweentranslational, rotationalandvibrationalstates.Pressure,togetherwithtemperature,determinesthewidth ofthemolecularresonancelines.
=
Theopticaldepthfromthesurfacetothetopoftheradiativeatmosphere,thealtitude zmp ofthemesopause,is
Asindicatedbythenotation(26),wehaveassumedthattheopticaldepth τmp atthe mesopausealtitude zmp differsnegligiblyfromtheopticaldepth τ∞ atinfinitealtitudesince thereissolittleopacityoftheatmosphereabovethemesopause.
TheSchwarzschildequation(23)canbesolvedtofindtheintensity[26,27]
where ς =sec θ.Forsimplicity,weassumethesurfaceintensityistheproductof Bs = B(Ts), thePlanckintensity(9)foratemperature Ts,andanangleindependentemissivity s = s(ν),
(0,ς)= sBs (29)
OvermostoftheEarth’ssurfacethethermalinfraredemissivity s,isobservedtobeinthe interval[0 9 < s < 1][28].Negligibleerrorisintroducedbysetting s =1inspectral regionsofhighatmosphericopacity,with τ∞ >> 1.Withonlyradiativeheattransferfrom thesurfaceandwithnegligibleconductionorconvection,therecanbeadiscontinuousjump betweenthesurfacetemperature Ts andthetemperature T0 oftheairjustabove.Forthe restofthispaperweassumethatanytemperaturejumpisnegligiblysmall,and Ts = T0 and Bs = B0.
Fordiscussionsofgreenhousegasforcing,wewillbeparticularlyinterestedintheupward flux
Using(27)and(28)in(30),wefind
Inthiswork,wehaveassumedthat s ˜ Bs = ˜ B(0).Equation(31)isthefundamentalexpressionforthenetupwardfluxinanatmospherewithnegligiblescatteringandhasbeenknown foralongtime.Forexample,thefirstlinecanbefoundintheNASAreports:Equation(2a) ofYoshikawa[29],orEquation(3.19)ofBuglia[26].Equation(31)containsexponentialintegralfunctions, En(τ ),thataccountforslantpathsofradiationbetweendifferentaltitudes. Theyaredefinedforintegers n =1, 2, 3,... by
asdiscussedinAppendix1ofChandrasekhar[7],orSection5.1.4ofAbramowitzandStegun [30].
Forfrequencieswheretheatmosphereisnottooopticallythick,with τ∞ ≤ 10,weevaluate ˜ Z fromthefirstlineof(31).FastFouriertransformsareusedtocalculateadiscretized versionoftheconvolutionwith ˜ B.Forfrequencieswheretheatmosphereisthicker,we usetheexpressiononthefirstlineof(31)tocalculate Z for10e-foldingsofopticaldepth downfromthetopoftheatmosphere, τ∞ τ< 10.Weuseafastandaccurateanalytic approximationofthesecondlinetoevaluate ˜ Z when τ∞ τ ≥ 10.Forexample,inthelower troposphere,
Thespectralforcing, F ,isdefinedasthedifferencebetweenthespectralflux πBs through atransparentatmospherefromablacksurfacewithtemperature Ts,andthespectralflux Z foranatmospherewithgreenhousegases,
Thefrequencyintegralsoftheflux(30)andtheforcing(34)are
where σSB istheStefanBoltzmannconstant.
5IntensityandFlux
Inthissectionwediscussmodelatmosphereswithgreenhousegasconcentrationscomparable tothoseoftheyear2020.Thespectralfluxhasacomplicateddependenceonfrequency ν,the altitudeprofilesofthetemperature T andgreenhousegasconcentrations C {i},andlatitude. Forthestandardatmosphere,theopticaldepthsof(26)canbeextremelylargei.e. τ∞ >> 1atsocalled“blanket”frequencies ν nearthecentersoftheabsorptionlines.For blanketfrequenciesaphotonemittednearthesurfaceisunlikelytoescapetheEarth’satmospherebecauseithasahighprobabilityofbeingreabsorbedbyagreenhousegasmolecule. Theextremeoppositeofablanketfrequencyisa“window”frequency,wherethereislittle absorption,and τ∞ ≈ 0.Forwindowfrequenciesmostradiationreachingspacecomesfrom thesurface,withminorcontributionsfromgreenhousegases.
Fromthefirstlineof(31),weseethatforfrequencieswheretheatmosphereisopticallythick,with τ∞ >> 1,thefluxatthetopoftheatmosphereisverynearly ˜ Z(τ∞)=
τ∞ 0 dτ E2(τ∞ τ )B(τ ).Foranisothermalatmosphere,withconstantbrightness B,half ofthefluxatthetopoftheatmospherewillcomefromaltitudesaboveanemissionoptical depth τe,definedby
Recallingthat E2(τ )= dE3(τ )/dτ andthat E3(0)=1/2,weseethat(38)impliesthatthe valueoftheemissionopticaldepth τe isgivenby
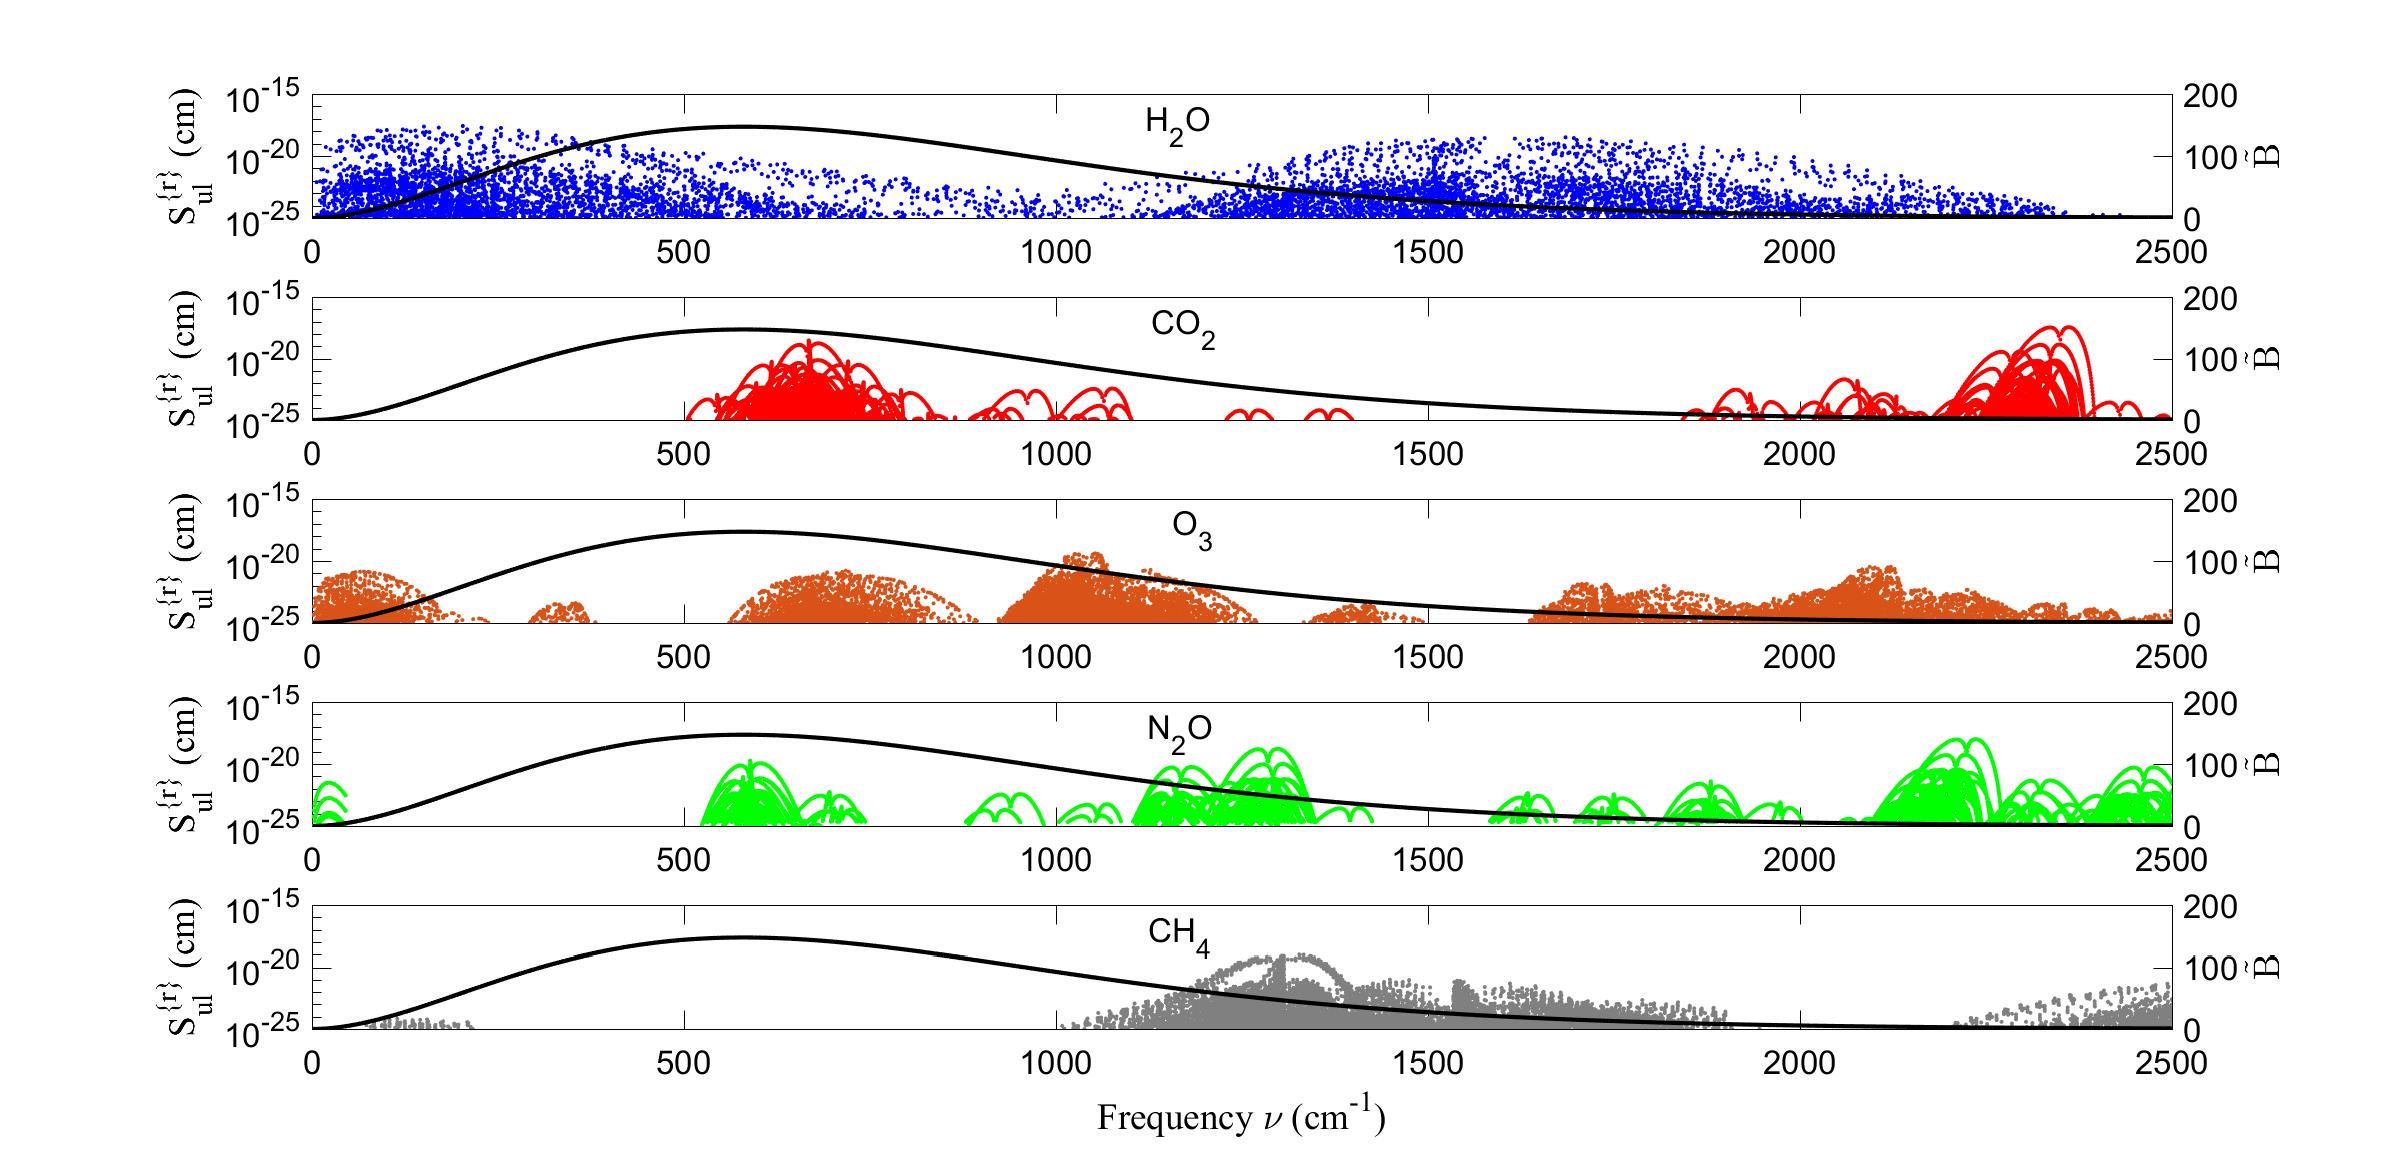
Fig.3showsaplotofupwardsfluxasafunctionofaltitudeatfourdifferentfrequencies.
Fig.3(a)showsamoderateblanketfrequency ν =500.5cm 1,wheretheopticaldepth, τ∞ =2 82.Theemissionheight ze =2 80kmisinthelowertroposphere.Frominspection ofFig.2,weseethattransitionsofthepurerotationspectrumofH2Odominatethe atmosphericopacityatthefrequency, ν =500 5cm 1
Fig.3(b)showsanextremeblanketfrequency ν =667.4cm 1 coincidingwithapeak intheCO2 absorptioncrosssectionwheretheopticaldepthis τ∞ =51, 688,andwherethe emissionheightis ze =84 8km,justbelowthemesopause.
Fig.3(c)showsanextremewindowfrequency, ν =971cm 1,wheretheopticaldepthis only τ∞ =0.029. Atthisfrequency,andintheabsenceofclouds,surfaceradiationreaches spacewithnegligibleattenuationbygreenhousegases.Thebandcenteredonthewavelength λ =1/(971cm 1)=10 3 µm,isthereforecalledthe“cleaninfraredwindow.”
Fig.3(d)showsablanketfrequency, ν =1016 2cm 1,withamoderateopticaldepth τ∞ =7.54intheO3 band.Notsurprisingly,theemissionheight, ze =33.0km,isinthe upperstratosphere,whereFig.1showsthattheO3 concentrationismaximum.
Highresolutionspectrometersonsatellitesseldomprovidemeasurementsofintensity ˜ I withresolutionslessthan1cm 1.Forcomparisonofmodeledspectralintensityorflux,it isusefultoplotfilteredspectralquantities.
Figure3:Spectralfluxes ˜ Z forrepresentativefrequencies, ν indicated:(a) τ∞ =2 82,ze = 2 80km, Bs =134 2i.u.;(b) τ∞ =51688,ze =84 8km, Bs =131 8i.u.;(c) τ∞ =0 029,ze = 0km, Bs =86.4i.u.;(d) τ∞ =7.54,ze =33.0km, Bs =79.3i.u..Herethespectralintensity unitis1i.u.=1mWm 2 cmsr 1 .
Thefilterfunction J (ν,ν )smoothsoutsharpchangeswithfrequency.Itisnormalizedso that
(41)
From(40)and(41)weseethattheunfilteredspectralflux ˜ Z andfilteredspectralflux ˜ Z havethesamefrequencyintegral
(42) andrepresentthesametotalflux Z.WefounditconvenienttouseaGaussianfilterfunction withawidthparameter∆ν,
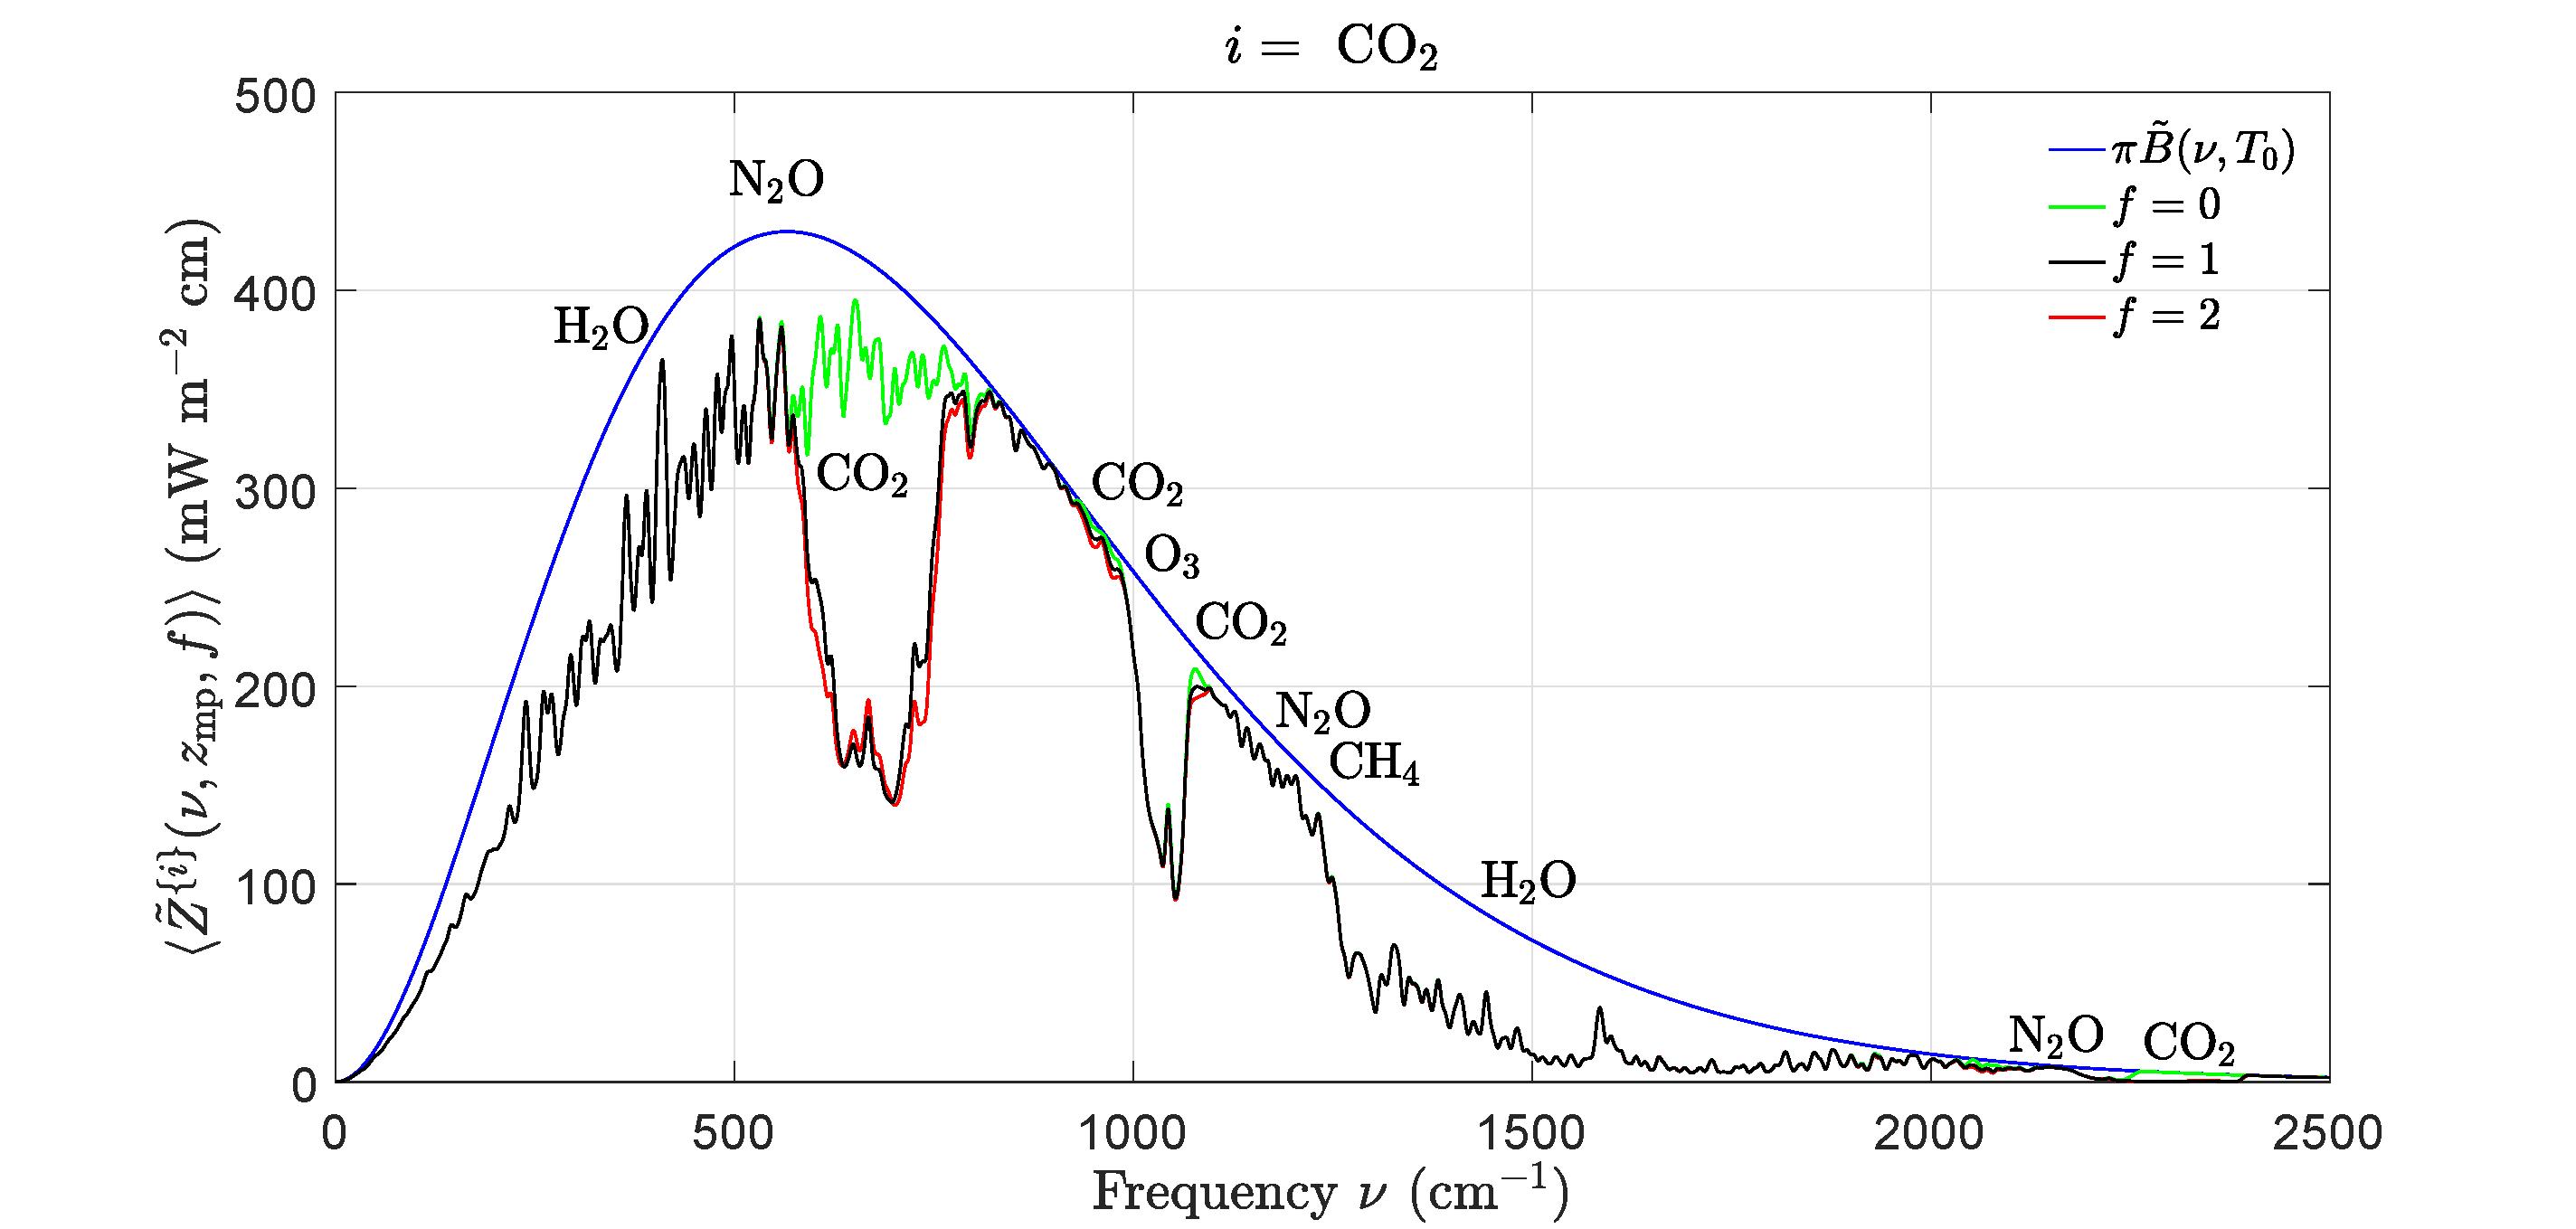
Figure4:Effectsofchangingconcentrationsofcarbondioxide,CO2 onthefilteredspectral flux Z {i}(ν,zmp,f ) of(44)atthemesopausealtitude, zmp =86km.Thewidthofthefilter (43)was∆ν =3cm 1.Thesmoothbluelineisthespectralflux, Z = πB(ν,T0)froma surfaceatthetemperature T0 =288.7Kforatransparentatmospherewithnogreenhouse gases.Thegreenlineis ˜ Z {i}(ν,zmp, 0) withtheCO2 removedbutwithalltheother greenhousegasesattheirstandardconcentrations.Theblacklineis Z {i}(ν,zmp, 1) withall greenhousegasesattheirstandardconcentrations.Theredlineis Z {i}(ν,zmp, 2) fortwice thestandardconcentrationofCO2 butwithalltheothergreenhousegasesattheirstandard concentrations.DoublingthestandardconcentrationofCO2 (from400to800ppm)would causeaforcingincrease(theareabetweentheblackandredlines)of∆F {i} =3 0Wm 2 , asshowninTable2.
Theeffectsonradiativetransferofchangingthecolumndensityofthe ithgreenhouse gastosomemultiple f ofthestandardvalue, ˆ N {i} sd ,canbedisplayedwithfilteredspectral fluxes
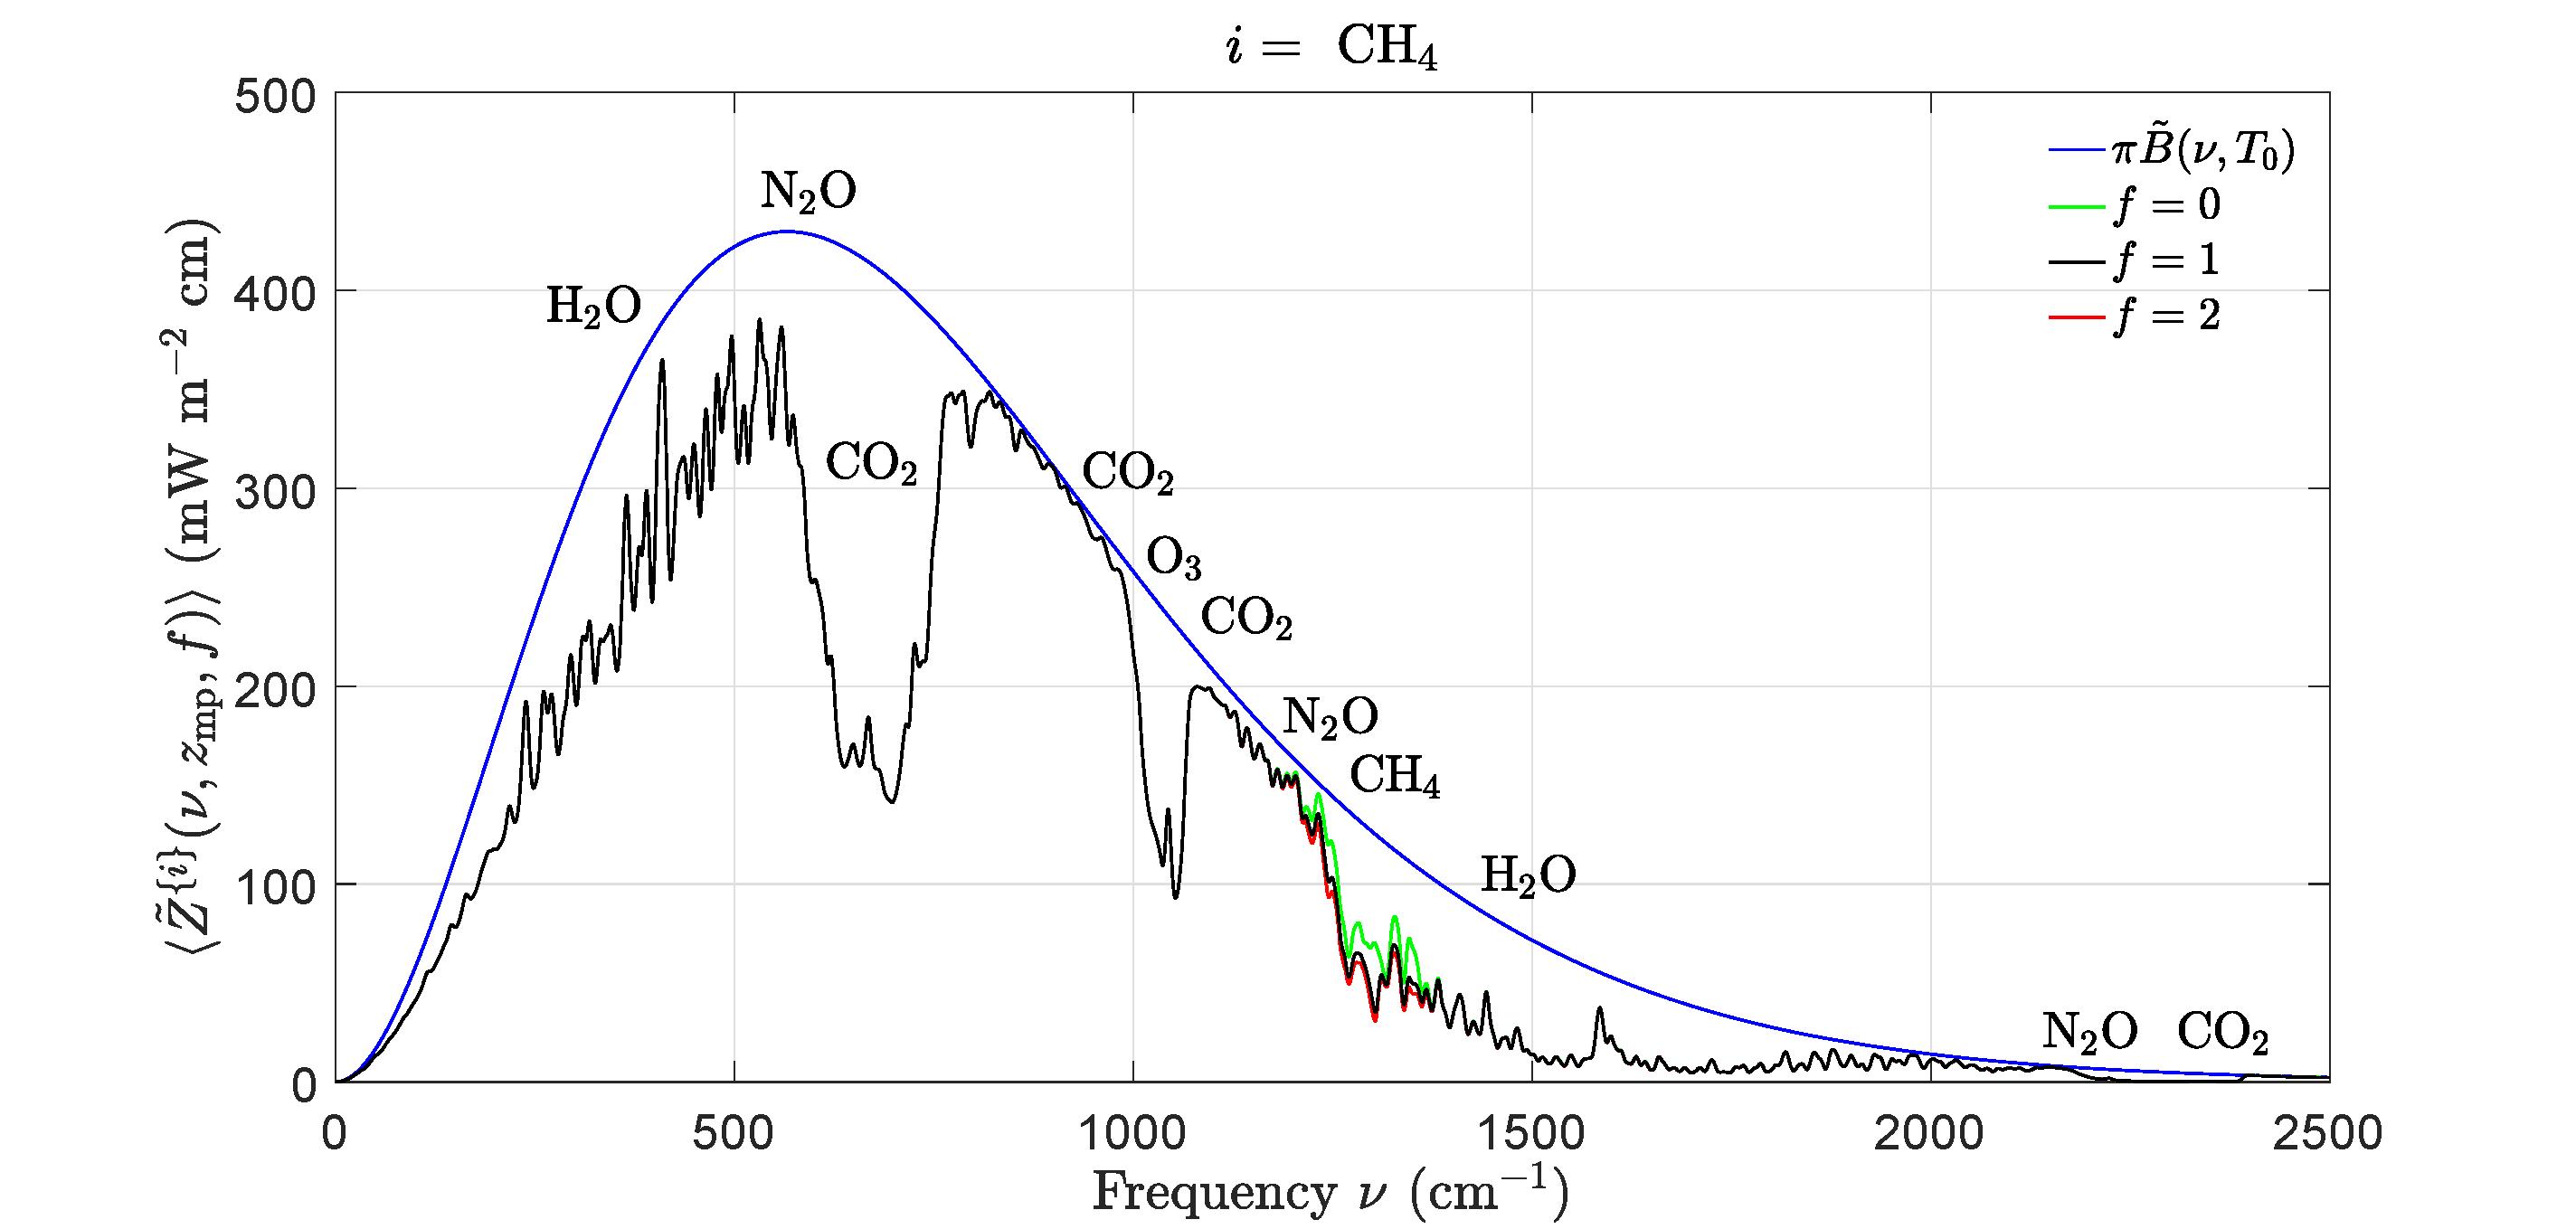
Figs.4and5showhowvaryingtheconcentrationsofCO2 andCH4 affectthefiltered spectralfluxesatthemesopausealtitude, zmp =86km.Expandedviewsofthedifferences betweenthefluxforstandardanddoubledconcentrationsofgreenhousegasesareshownin Fig.6,wherewedisplay
Figure5:Effectsofchangingconcentrationsofmethane,CH4,onthefilteredspectralflux Z {i}(ν,zmp,f ) of(44)atthemesopausealtitude, zmp =86km.Theblueandblacklines havethesamemeaningsasforFig.4.Thegreenlineis Z {i}(ν,zmp, 0) withtheCH4 removedbutwithalltheothergreenhousegasesattheirstandardconcentrations.Thered lineis ˜ Z {i}(ν,zmp, 2) withtwicethestandardconcentrationofCH4 butwithalltheother greenhousegasesattheirstandardconcentrations.Doublingthestandardconcentrationof CH4 wouldcauseaforcingincrease(theareabetweentheblackandredlines)of∆F {i} =0.7 Wm 2,asshowninTable2.
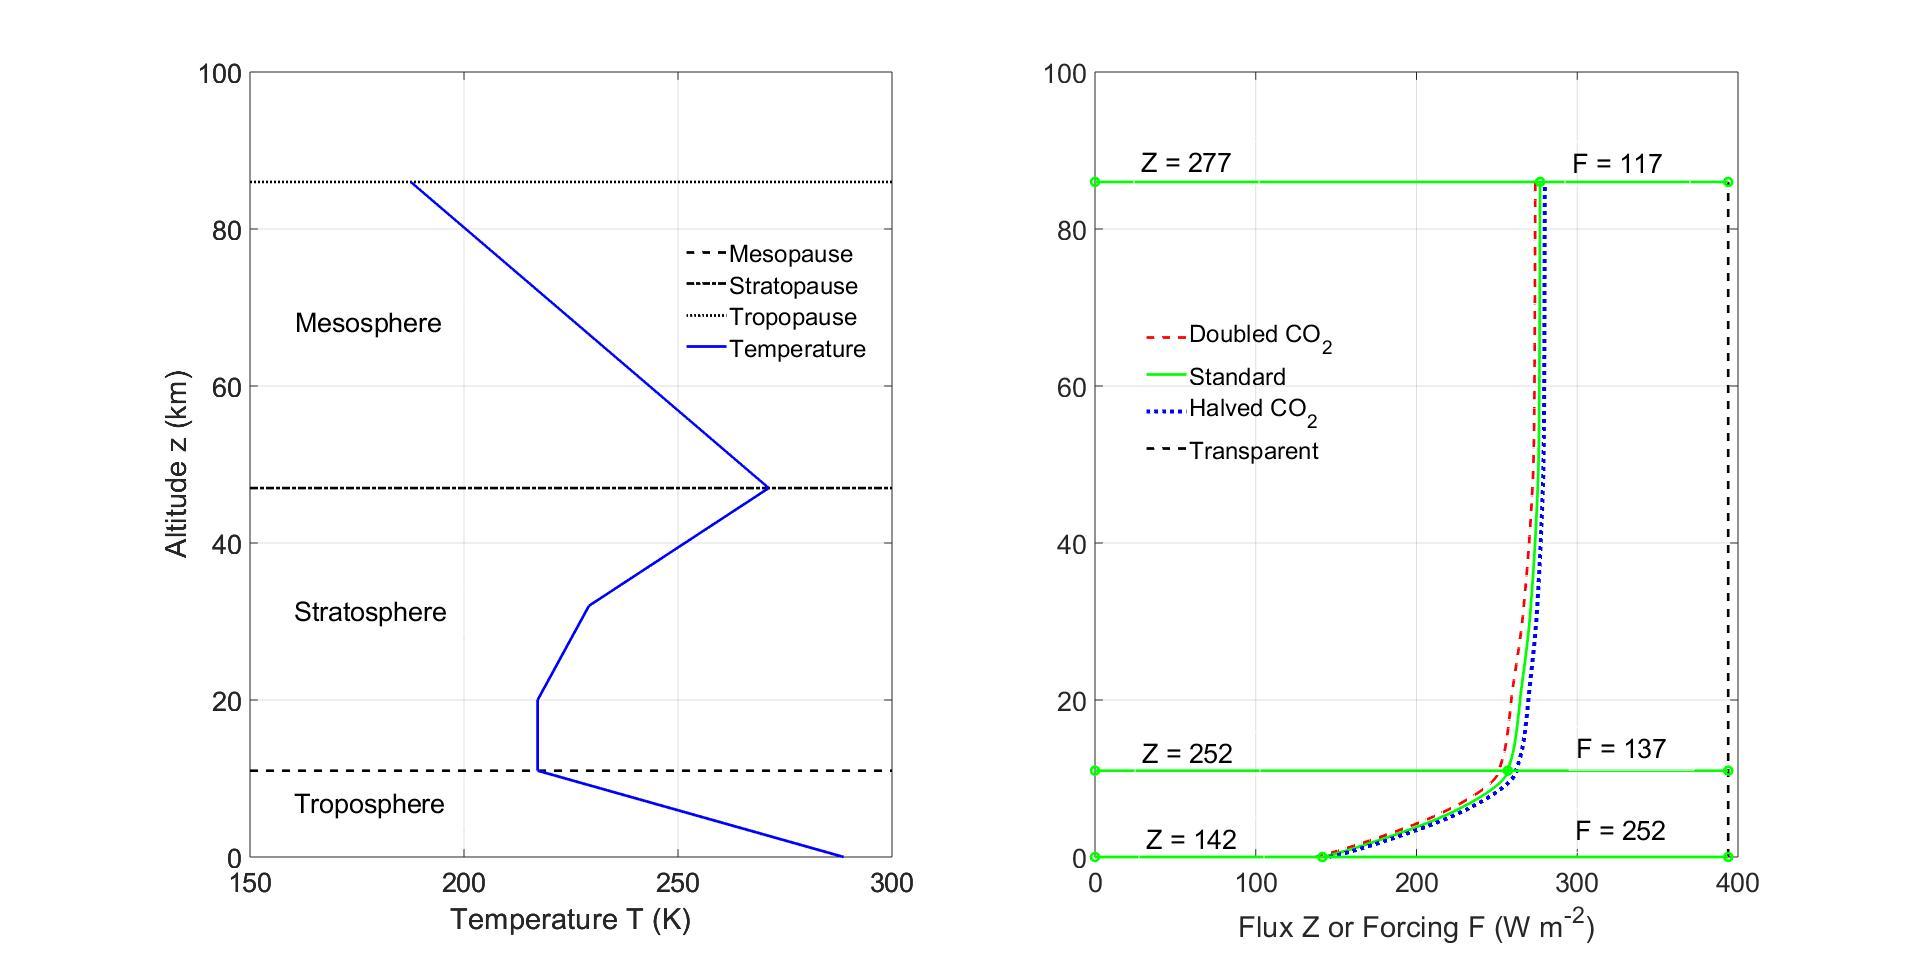
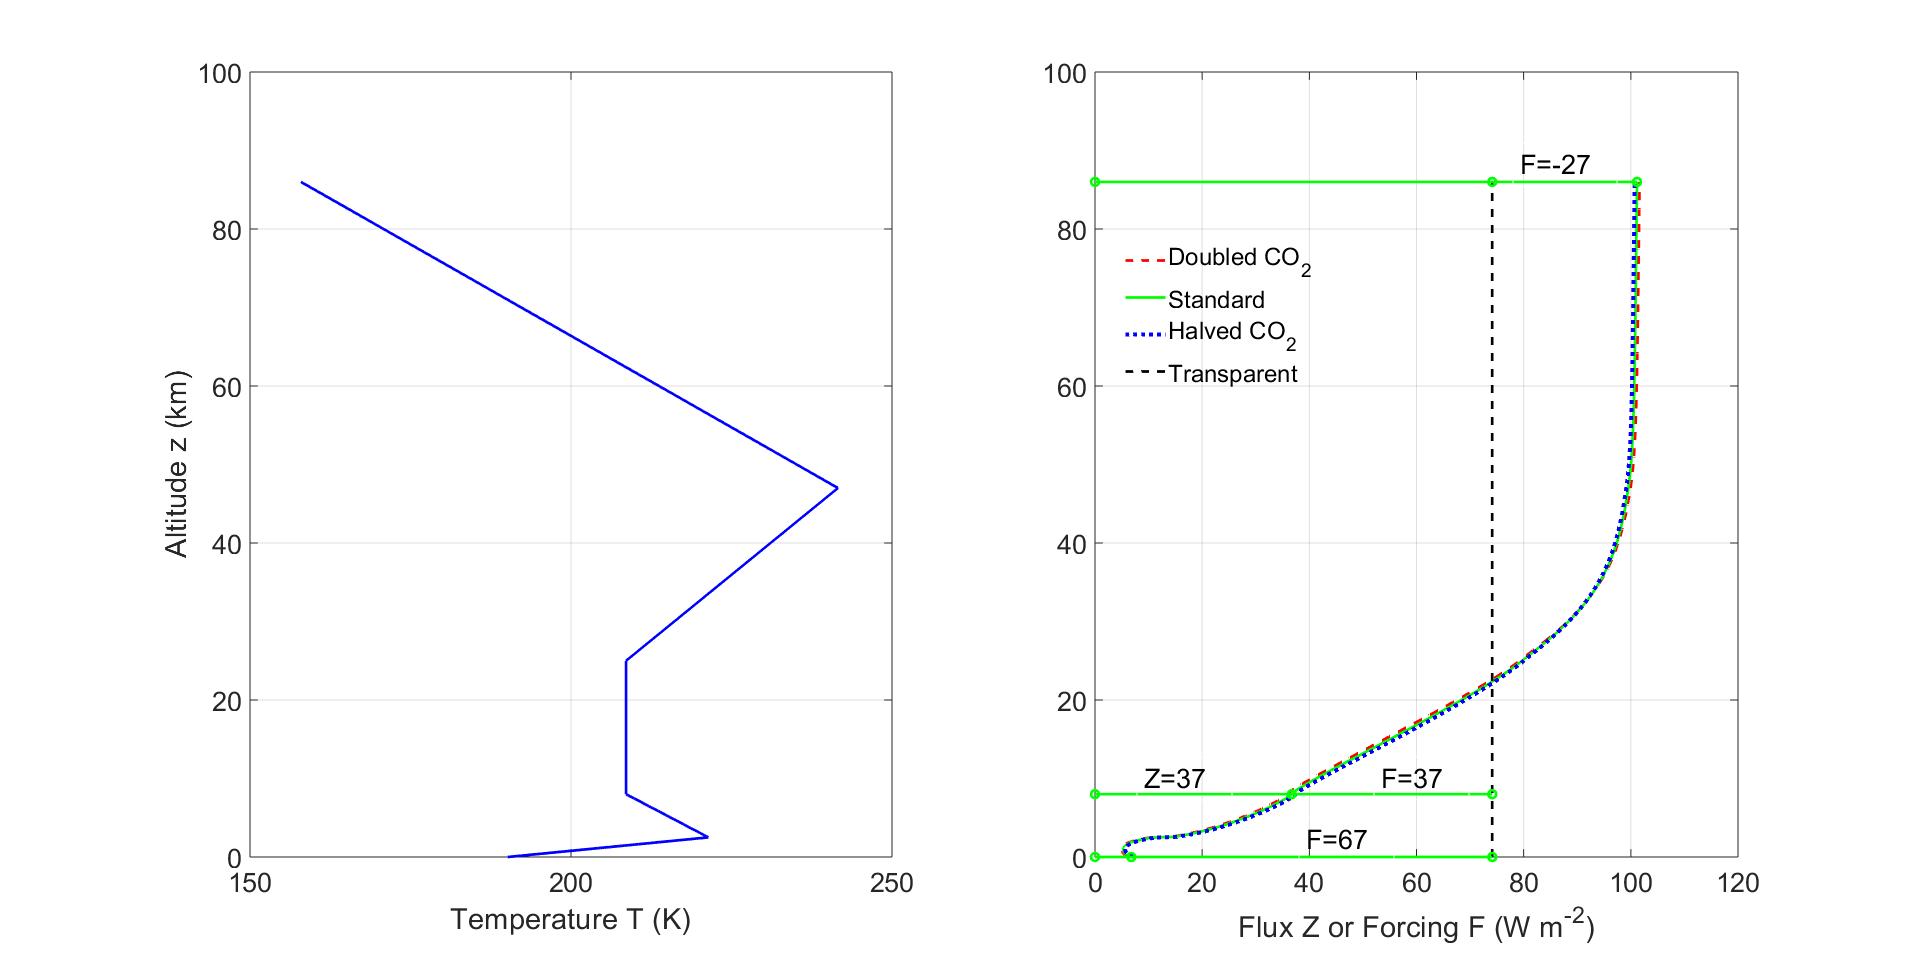
Integratingspectralfluxes, ˜ Z,likethoseofFig.4,overallfrequenciesinaccordance with(35)gives Z,thefrequencyintegratedfluxshownintherightpanelofFig.7.The calculationsusedthetemperatureprofileofFig.1,whichisshownintheleftpanelofFig.7. AdoublingofCO2 concentrationresultsina3W/m2 decreaseinthetopoftheatmosphere flux.ThispositiveforcingchangesthetemperatureprofileasisdiscussedinSection7. Thermalradiativefluxesdependonlatitude.Theyarelargerneartheequatorwhere thesurfaceisrelativelywarmthannearthepoles,wherethesurfaceiscolderandwhere wintertimetemperatureinversionsoftenforminthelowertroposphere.Forexample,Fig.8 istheanalogofFig.7forAntarctica.ForFig.8weusedafivesegmenttemperatureprofile withaltitudebreakpointsat ζ =[0, 2 5, 8, 25, 47, 86]km.Thelowtropopauseat8kmandthe strong,wintertimetemperatureinversion,peakingat2.5km,arebothcharacteristicofthe nighttimepoles.Thelapseratesbetweenthebreakpointswere L
Kkm 1.ThesurfacetemperatureinAntarcticawastakentobe T0 =190Kandthesurface pressurewassettobe p0 =677hPa,becauseofthehighelevationoftheicesurface,about 2 7kmabovemeansealevel.DoublingCO2 causesthenegativeforcingintheAntarctic
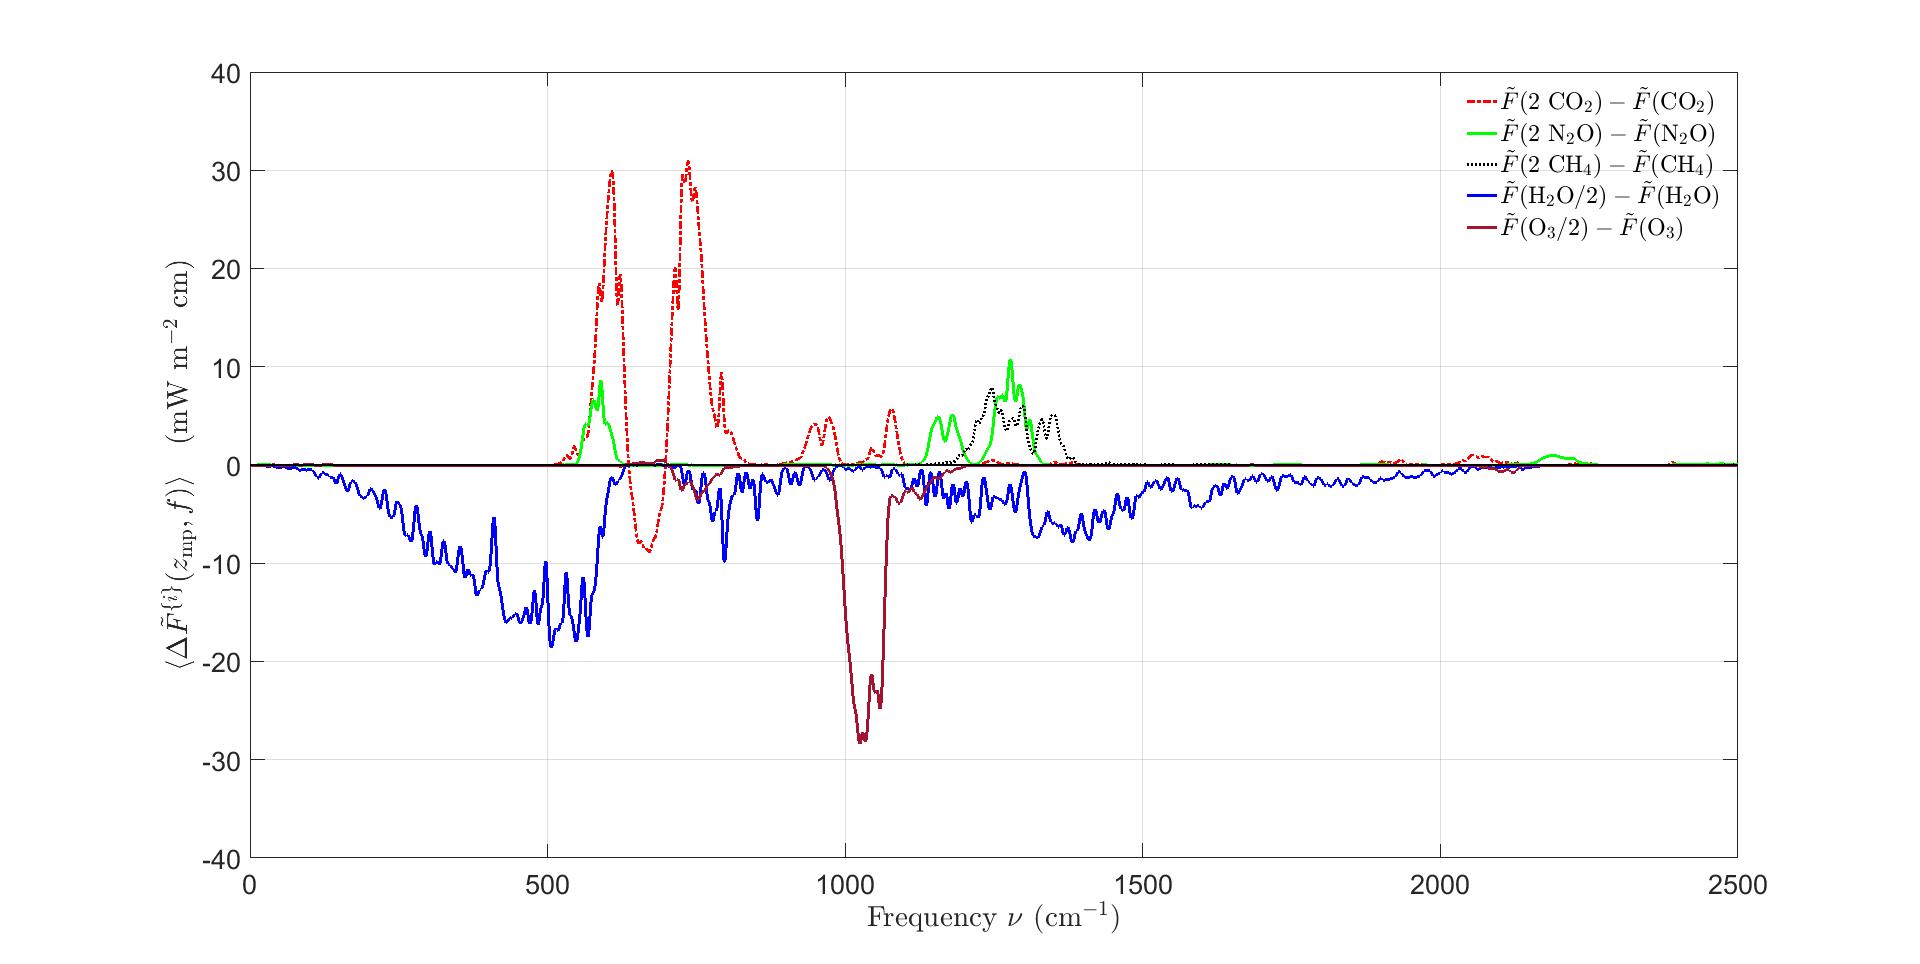
Figure6:Spectralforcingincrements(45)fordoubledconcentrationsofCO2,N2OandCH4 ThesearethemagnifieddifferencesbetweentheblackandredcurvesofFigs.4and5.For mostfrequencies ∆F {i}(zmp, 2) ispositive.Thisisbecausedoublingtheconcentrations ofgreenhousegasesshiftstheemissionheights ze of(38)tohigher,colderaltitudesinthe troposphere.Anexceptionisthebandoffrequenciesnearthecenteroftheexceptionally strongbending-modebandofCO2 at667cm 1.HeredoublingCO2 movestheemission heightstohigher,warmeraltitudesofthestratosphere,wheremoleculescanmoreefficiently radiateheattospace.AlsoshownareforcingincrementsforhalvedconcentrationsofH2O andO3.Halvingensuresthattherelativehumiditydoesnotexceed100%,andreducesthe clutterofthegraph.
oppositethatshowninFig.1.Thisisduetothetemperatureinversionwhichmeans anincreaseinCO2 causesmoreinfraredradiationtoescapetospace,creatinganegative greenhouseeffect[31].
6ConcentrationDependenceofForcing
Thefrequencyintegratedforcing, F ,of(36)dependsonthealtitude z andonthecolumn densitiesofthefivegreenhousegasesgiveninTable1.
Weassumethetemperature T anddensities N {i} havethesamealtitudeprofilesasinthe midlatitudeexampleofFig.1.Animportantspecialcaseof(46)istheforcing, Fsd,when
Figure7: Left. Midlatitudestandardtemperatureprofile. Right. Altitudedependenceof frequencyintegratedflux Z of(35).ThefluxforthreeconcentrationsofCO2 areshown, thestandardconcentration, C {i} sd =400ppmofFig.1,twiceandhalfthatvalue.The othergreenhousegaseshavethestandardconcentrationsofFig.1.Theverticaldashedline istheflux σSBT 4 0 =394Wm 2 foratransparentatmospherewithasurfacetemperature T0 =288 7K.Theforcings Fs thatfollowfrom(36)at0km,11kmand86kmare252,137 and117Wm 2 respectively.
eachgreenhousegas i ispresentatitsstandardcolumndensity
N {i} sd ofTable1,
Asecondspecialcaseof(46)isthehypothetical,permoleculestandardforcing, F {i} sd ,when theatmospherecontainsonlymoleculesoftype i attheirstandardcolumndensity, ˆ N {i} = ˆ N {i} sd ,andtheconcentrationsoftheothergreenhousevanish, ˆ N {j} =0if j = i,
Wedefinetheforcingpowerperaddedmoleculeas
Thedensitiesofgreenhousegases j with j = i areheldconstantinthepartialderivativeof (49).Iftheunitsof F aretakentobeWm 2 andtheunitsof ˆ N {i} aretakentobemolecules m 2,thentheunitsof P {i} willbeWmolecule 1 .
Figure8:QuantitiesanalogoustothoseofFig.7attheSouthPole.Thereisastrong temperatureinversionatanaltitudeof2.5kmabovetheicesurface.Thefluxforthree concentrationsofCO2 areshown,thestandardconcentration, C {i} sd =400ppmofFig.1, twiceandhalfthatvalue.Theothergreenhousegaseshavethestandardconcentrationsof Fig.1.Therelativelywarmgreenhouse-gasmoleculesintheatmosphereabovethecold surfacecausetheEarthtoradiatemoreheattospacefromthepolesthanitcouldwithout greenhousegases[31].
Wedefineafiniteforcingincrementforthe ithtypeofgreenhousemoleculeas
Differentiating(50)withrespectto f wefind
where P {i} sd (z,f )istheforcingpowerperadditionalmoleculeoftype i whenthesemolecules havethecolumndensity
andallothertypesofgreenhousemoleculeshavetheir standardcolumndensities.
Theforcingincrements(50)forthefivegreenhousegasesconsideredinthispaperare shownasafunctionof f inFig.9.Forcingincrementsarealsotabulatedatrepresentative altitudes z andmultiplicativefactors f inTable2.Atboththetopoftheatmosphere andatthetropopause,weseethattheforcingincrement(50)islargestforabundantwater molecules,H2O,andisrelativelysmallforthemuchmoredilutegreenhousegasesCH4 and
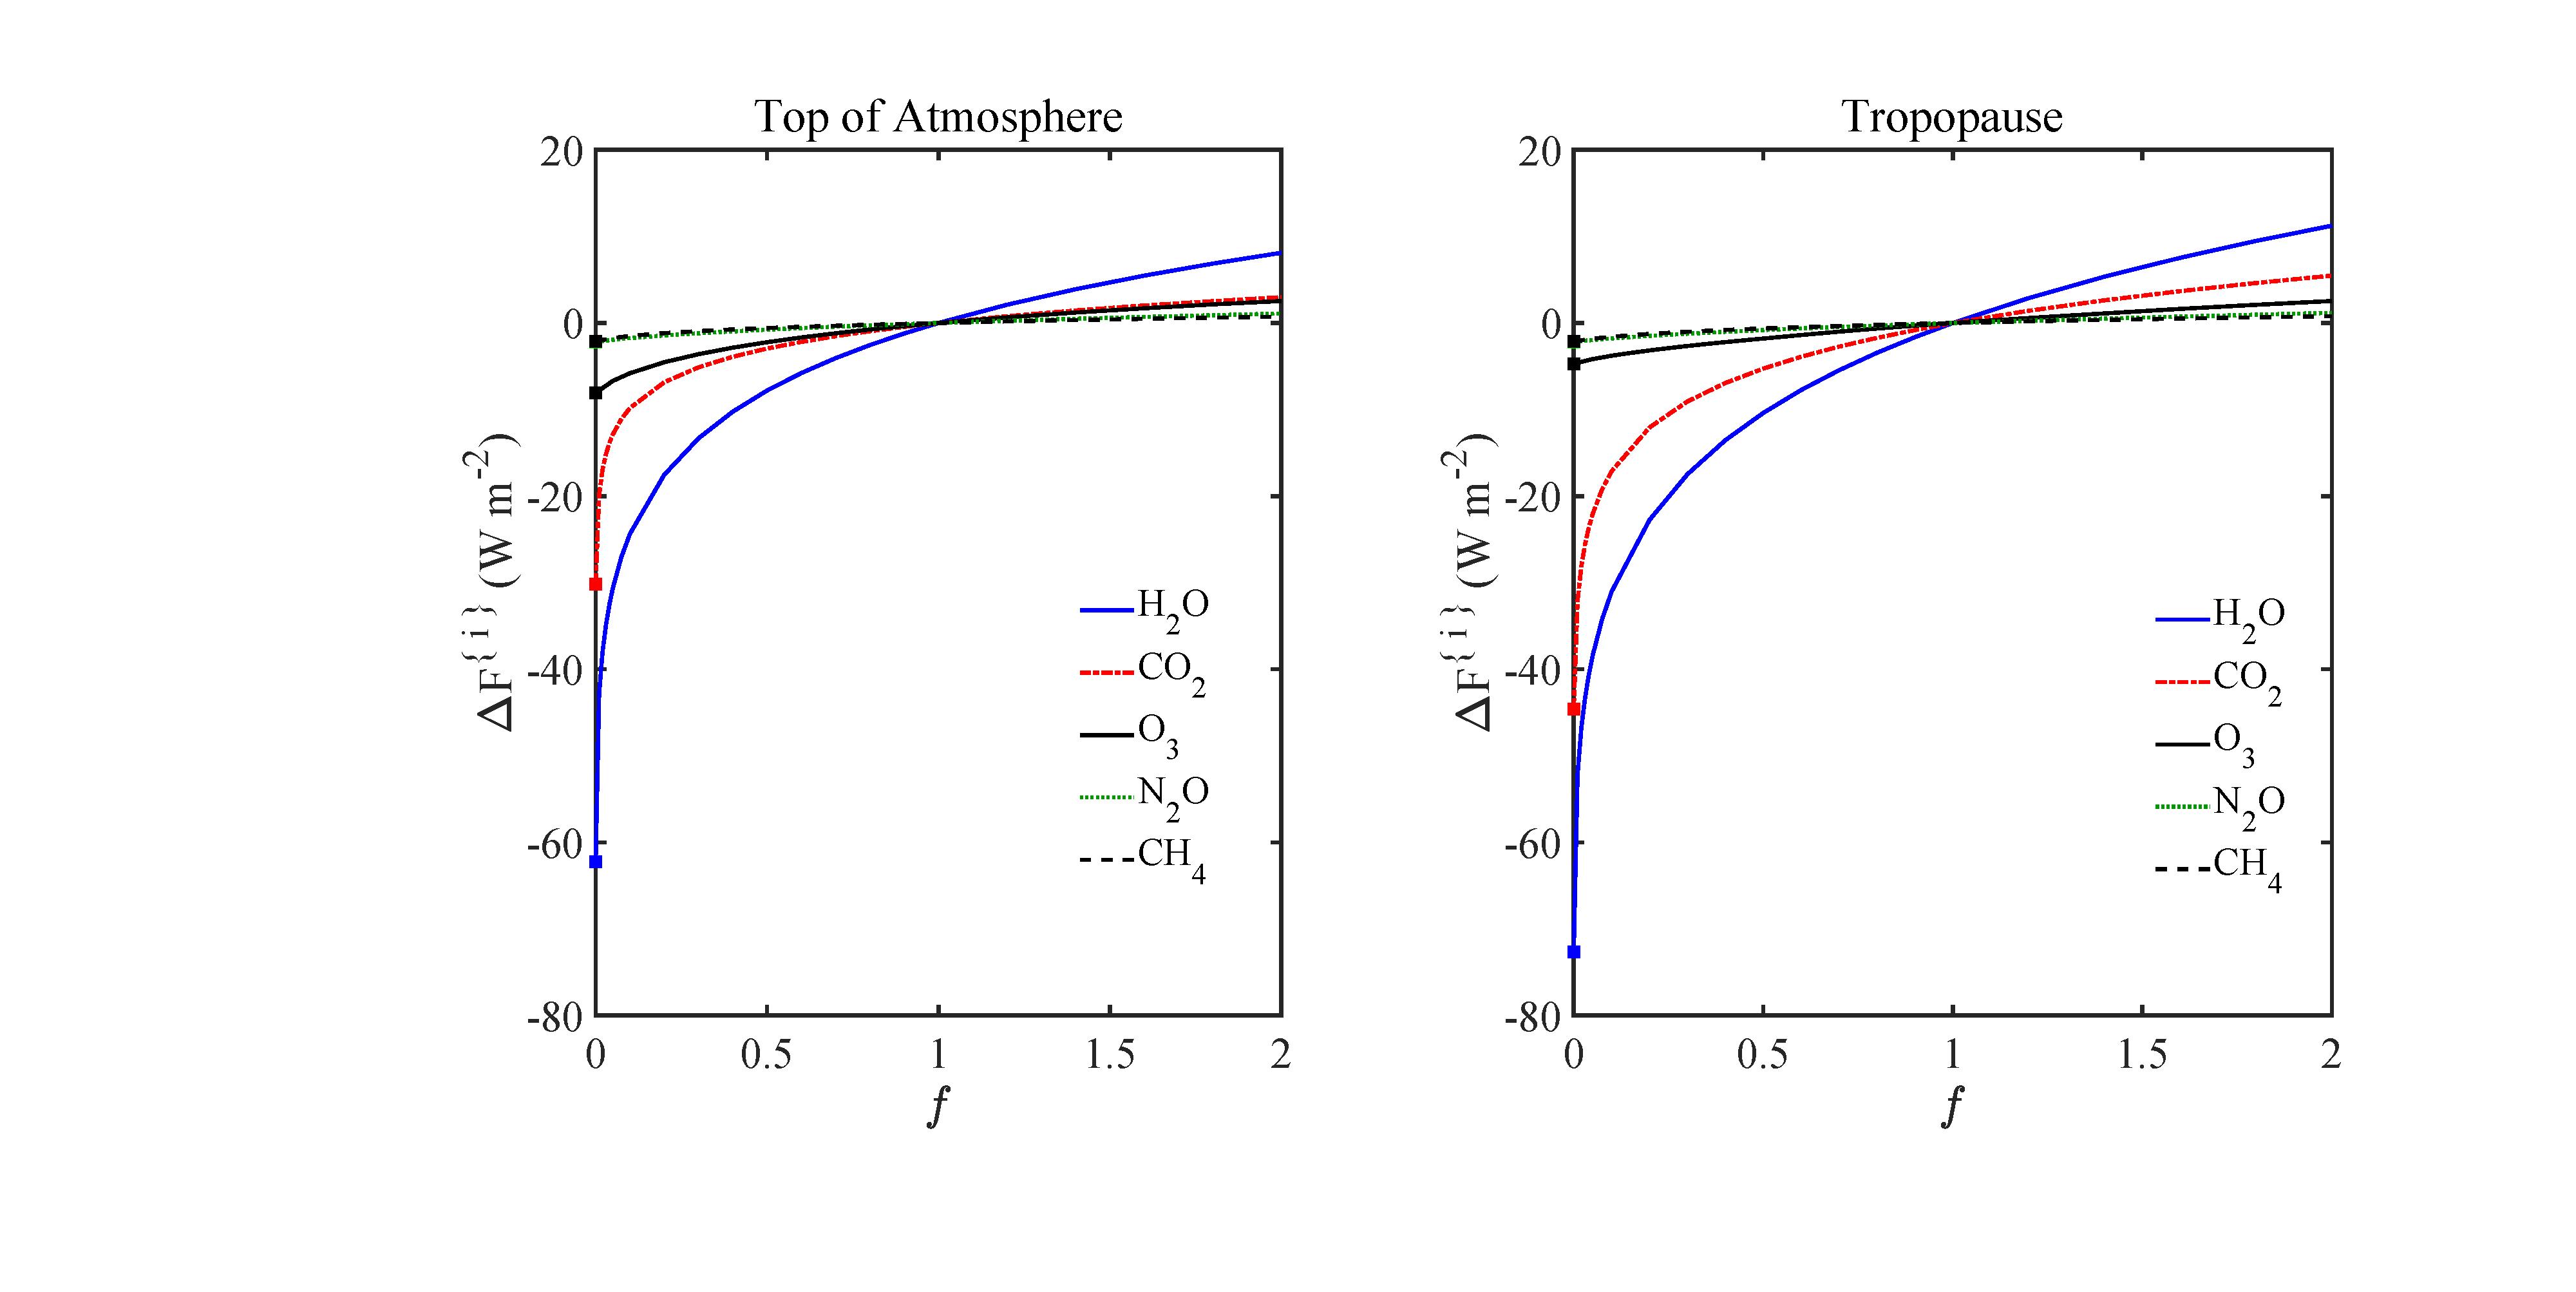
Figure9:Dependenceofpartialforcingincrements∆F {i} of(50)ongreenhousegasmultiplicativefactor, f = N {i}/N {i} sd .Atthestandardcolumndensities,with f =1,theincrementalforcingsarewellintothesaturationregime,with d∆F {i}(1)/df<d∆F {i}(0)/df for all5gases.Forthemostabundantgreenhousegases,H2OandCO2,thesaturationeffects areextreme,withper-moleculeforcingpowerssuppressedbyfourordersofmagnitudeat standardconcentrations(f =1)withrespecttothelow-concentration,opticallythinlimit (f =0).ForCO2,N2O,andCH4,theareasboundedbythegreenandblackcurvesofFigs. 4and5givethevalues, ∆F {i} for f =0,andtheareasboundedbytheblackandred curvesgive∆F {i} for f =2,asdiscussedforFig.6.SeethetextandTable2formore details.
N2O.Theincrementalforcingsareallinthesaturationregime,with ∂∆F {i}/∂f diminishing withincreasing f .
InTable2,theforcingdecrementsfromremovingH2O,CO2,O3,N2OandCH4, 62 2, 30 2, 8 1, 2 2and 2 1Wm 2,arereasonablyclosetothosecalculatedbyZhong andHaigh[32].IntheirTable1theyciteforcingdecrementsatthetopoftheatmosphere of 70.6, 25.5, 7.0, 1.8and 1.7Wm 2.ZhongandHaighseemtohavetakenthe concentrationsofN2OandCH4 tobeindependentofaltitude.Thealtitudedependenceof Fig.1wereusedinourcalculations.
NotefromTable2thatdoublingorhalvingthecolumndensityofCO2 changesthe forcing F byalmostthesameamount,eitheratthetropopauseoratthemesopause.This dependenceofforcingincrementsonthelogarithmoftheCO2 columndensitywasfirst pointedoutbyArrhenius[33].WilsonandGea-Banacloche[34]explainhowtheapproximate dependenceoftheCO2 absorptioncrosssectiononfrequency
|,leadsto
Table2:Partialforcings F {i} sd (z)of(48)andpartialforcingincrements∆F {i}(z,f )of(50), allinunitsofWm 2,atthealtitudes ztp =11kmofthetropopauseand zmp =86kmof themesopause.Thelastrowcontainstheforcings Fsd(z)of(47),showninFig.7,when allgreenhousemoleculesarepresentsimultaneouslyattheirstandardcolumndensities ˆ N {i} sd . Becauseoftheoverlappingabsorptionbands, i F {i} sd (z) >Fsd(z),and i ∆F {i}(z, 0) < Fsd(z).
thelogarithmicforcinglaw.Here σe isthemaximumcrosssectionatthecenterfrequency, νe =667cm 1,ofthebendingmodeband.
TheforcingincrementsinTable3arecomparabletothosecalculatedbyothers.For example,incolumn3wegivetheincrements∆F {i}(z,f )calculatedbyCollinsetal[13], asestimatedfromtheirTables2and8.Thesearetheresultsofaveragingfiveseparate linebylinecalculations.Inadditiontolineintensities,threeofthecalculationsuseda continuumCO2 opacity,andallfiveusedacontinuumH2Oopacity.Thephysicalorigin ofthesecontinuaisunclear.Theyareaddedtomakethecalculationsagreebetterwith observations[10,13].Theforcingscalculatedinthispaper,summarizedincolumn4,used onlylinesfortheHITRANdatabaseandnocontinua.Ourvaluesarefairlyclosetothoseof Collinsetal.[13],withthelargestdiscrepancyforH2O.Themesopausespectralintensities, calculatedwithonlyHITRANlinesandwithnocontinuumcontributions,areinexcellent agreementwithsatellitemeasurementsovertheSaharaDesert,theMediterraneanSeaand Antarctica,asdiscussedinSection8.
Thethreemesopausefluxincrements∆F {i} inthefourthcolumnofTable3fordoubled concentrationsofCO2,N2OandCH4 sumto4.8Wm 2.Thecalculatedfluxincrement fromsimultaneouslydoublingCO2,N2OandCH4 istheslightlysmallervalue,∆F =4 7W m 2.Similarly,thefourmesopausefluxincrements∆F {i} inthefourthcolumnofTable3 fordoubledconcentrationsofCO2,N2OandCH4 aswellasafactorof f =1.06increaseof H2Oconcentrationsumto5.5Wm 2.Thecalculatedfluxincrementfromsimultaneously doublingCO2,N2OandCH4,andincreasingtheH2Oconcentrationsbyafactorof f =1 06, istheslightlysmallervalue5.3Wm 2.The“whole”islessthanthesumoftheparts,because oftheinterferenceofgreenhousegasesthatabsorbthesameinfraredfrequencies.
Table4summarizestheforcingpowers(49)peradditionalmoleculeinunitsof10 22 W atthetropopausealtitude, ztp =11kmandatthemesopausealtitude, zmp =86km.The
∆F {i}(z,f )inWm 2 Ref.[13] ThisWork
Table3:Comparisonoftheforcingincrements∆F {i}(z,f )ofCollins etal.[13]incolumn3, andtheresultsofTable2and(50)incolumn4,atthealtitude ztp =11kmofthetropopause and zmp =86kmofthemesopause.ForH2O,therelativeincrease, f =1.06,ofthecolumn densityisapproximatelythatcausedbya1Kincreaseofthesurfacetemperature.
surfacetemperaturewas T0 =288 7K,andthealtitudeprofilesoftemperatureandnumber densitywerethoseofFig.1.Thefirstcolumnliststhemoleculesweconsidered.The numbersinthesecondcolumnareforcingpowers, P {i} ot (z),of(54)intheopticallythinlimit. Thenumbersofthethirdcolumnareforcingpowers P {i} sd (z, 0)from(51)foranatmosphere thatpreviouslyhadnomoleculesoftype i (so ˆ N {i} =0)butallothergreenhousemolecules hadstandardconcentrations, ˆ N {j} = ˆ N {j} sd if j = i.Theforcingsofthethirdcolumnareless thanthoseofthesecondbecauseofinterferencebetweenabsorptionbydifferentgreenhouse gases.Thenumbersinthefourthcolumnaretheforcingpowers P {i} sd (z, 1)from(51)whena singlemoleculeoftype i isaddedtoanatmospherethatpreviouslyhadstandarddensitiesfor allgreenhousegases, ˆ N {j} = ˆ N {j} sd .Saturationoftheabsorptionsuppressestheper-molecule forcingbyaboutfourordersofmagnitudefortheabundantgreenhousegasesH2OandCO2 Saturationcauseslessdrasticsuppressionofper-moleculeforcingsforthelessabundantO3, N2OandCH4.
Wenowconsidertheopticallythinlimit,wheretheconcentrationsofgreenhousegases aresufficientlylowthattheopticaldepths τ of(24)willbesmall, τ 1,forallfrequencies ν andatallaltitudes z.Thefrequencyintegralofthespectralforcing(35)ataltitude z can thenbewrittenas
wheretheforcingpowerpergreenhousemoleculeoftype i is
N {i} = N {i}(z ), T = T (z )and T0 = T (0).Themeanpowerabsorbedbyagreenhouse gasmoleculeoftemperature T fromthermalequilibriumradiationoftemperature T is
Table4:Forcingpowers(49)peradditionalmoleculeinunitsof10 22 Watthealtitude ztp =11kmofthetropopauseand zmp =86kmofthemesopause.Thesurfacetemperature was T0 =288.7K,andthealtitudeprofilesoftemperatureandnumberdensitywerethoseof Fig.1. P {i} ot (z)of(54)isfortheoptically-thinlimit. P {i} sd (z, 0)from(51)isforanatmosphere thatpreviouslyhadnomoleculesoftype i (so ˆ N {i} =0)butallothergreenhousemolecules hadstandardconcentrations. P {i} sd (z, 1)from(51)isforasinglemoleculeoftype i addedto anatmospherethatpreviouslyhadstandarddensitiesforallgreenhousegases.
Forthespecialcaseof T = T wecansubstitute(6)into(54)tofind
Sinceweareconsideringasingleisotopologue,wehaveset ηu =1in(6).Thethreefactors inthesummedtermsof(55)aretheprobability W {i} u (T )tofindthemoleculeintheupper state u,theradiativedecayrateΓ{i} ul fromtheupperlevel u tothelowerlevel l andthe meanenergy E{i} ul oftheemittedphoton.Thisisobviouslythetotalpowerradiatedbya moleculeoftemperature T .Foramoleculeoftemperature T inthermalequilibriumwith radiationofthesametemperature,theradiativepowerabsorbedbythemoleculeisequalto thespontaneousradiativepoweritemits.Theforcingpowerspermoleculearesummarized graphicallyinFig.10.
7TemperatureandForcing
Theforcingsduetoinstantaneouschangesofgreenhousegasconcentrationscanbecalculatedquiteaccurately.Temperaturechangesinducedbytheforcingsarelessclearlydefined becausevariousfeedbackschangethetemperatureprofileoftheatmosphere.Afterdoubling CO2 concentrations,anew,steadystatewilleventuallybeestablishedbythesefeedback processes.
AsshowninFig.7,wehavecomputedtheupwardsflux Z = Z(Cg,Cw,T )where Cg and Cw aretheinitialconcentrationsofsomegreenhousegasandwatervaporrespectively,and T isthetemperature.Thefluxdependsonaltitude z because Cg, Cw and T areeachfunctions

Figure10:Agraphicaldisplayoftheper-moleculeforcingpowersofTable4.Atstandard columndensitiesthe(red)powers, P {i} sd (z, 1),forH2OandCO2 aresuppressedbyfour ordersofmagnitudefromtheirvaluesintheopticallythinlimit(blue)wherethepowers are P {i} ot (z).Thisisduetostrongsaturationoftheabsorptionbands.Saturationeffects (differencebetweentheblueandredlines)aremuchlessfortheminorgases,O3,N2Oand CH4.Thegreenlinesarethepowerspermolecule, P {i} sd (z, 0),ofthe ithgreenhousegasin itslow-concentrationlimit,butwhentheforcingpowerissuppressedbyothergasesattheir standarddensities.Interferenceeffects(differencebetweentheblueandgreenlines)aremore pronouncedforN2OandCH4 thanforH2OandCO2.Fig.2showsthestrongestbandsof O3 overlaplittlewiththoseofothergreenhousemolecules,minimizinginterferenceeffects.
ofaltitude.IntherightpanelofFig.7weshowedthatchangingtheconcentration Cg of thegreenhousegasCO2 totwiceitsvalue, Cg =2Cg,whileholdingallotheratmospheric propertiesthesame,changedthefluxfromitsinitialvalue Z(Cg,Cw,T )toaslightlysmaller value, Z(Cg,Cw,T ).Inthishypothetical“instantaneous”processthereisnochangeinthe atmospherictemperature T = T (z).Theconcentrationsofallothergreenhousegases,most notably,theconcentration Cw = Cw(z)ofwatervapor,alsoremainthesame.Thedifference betweenthefluxbeforeandafteradditionofthegreenhousegasiscalledthe instantaneous forcingincrement,andcanbewrittenas
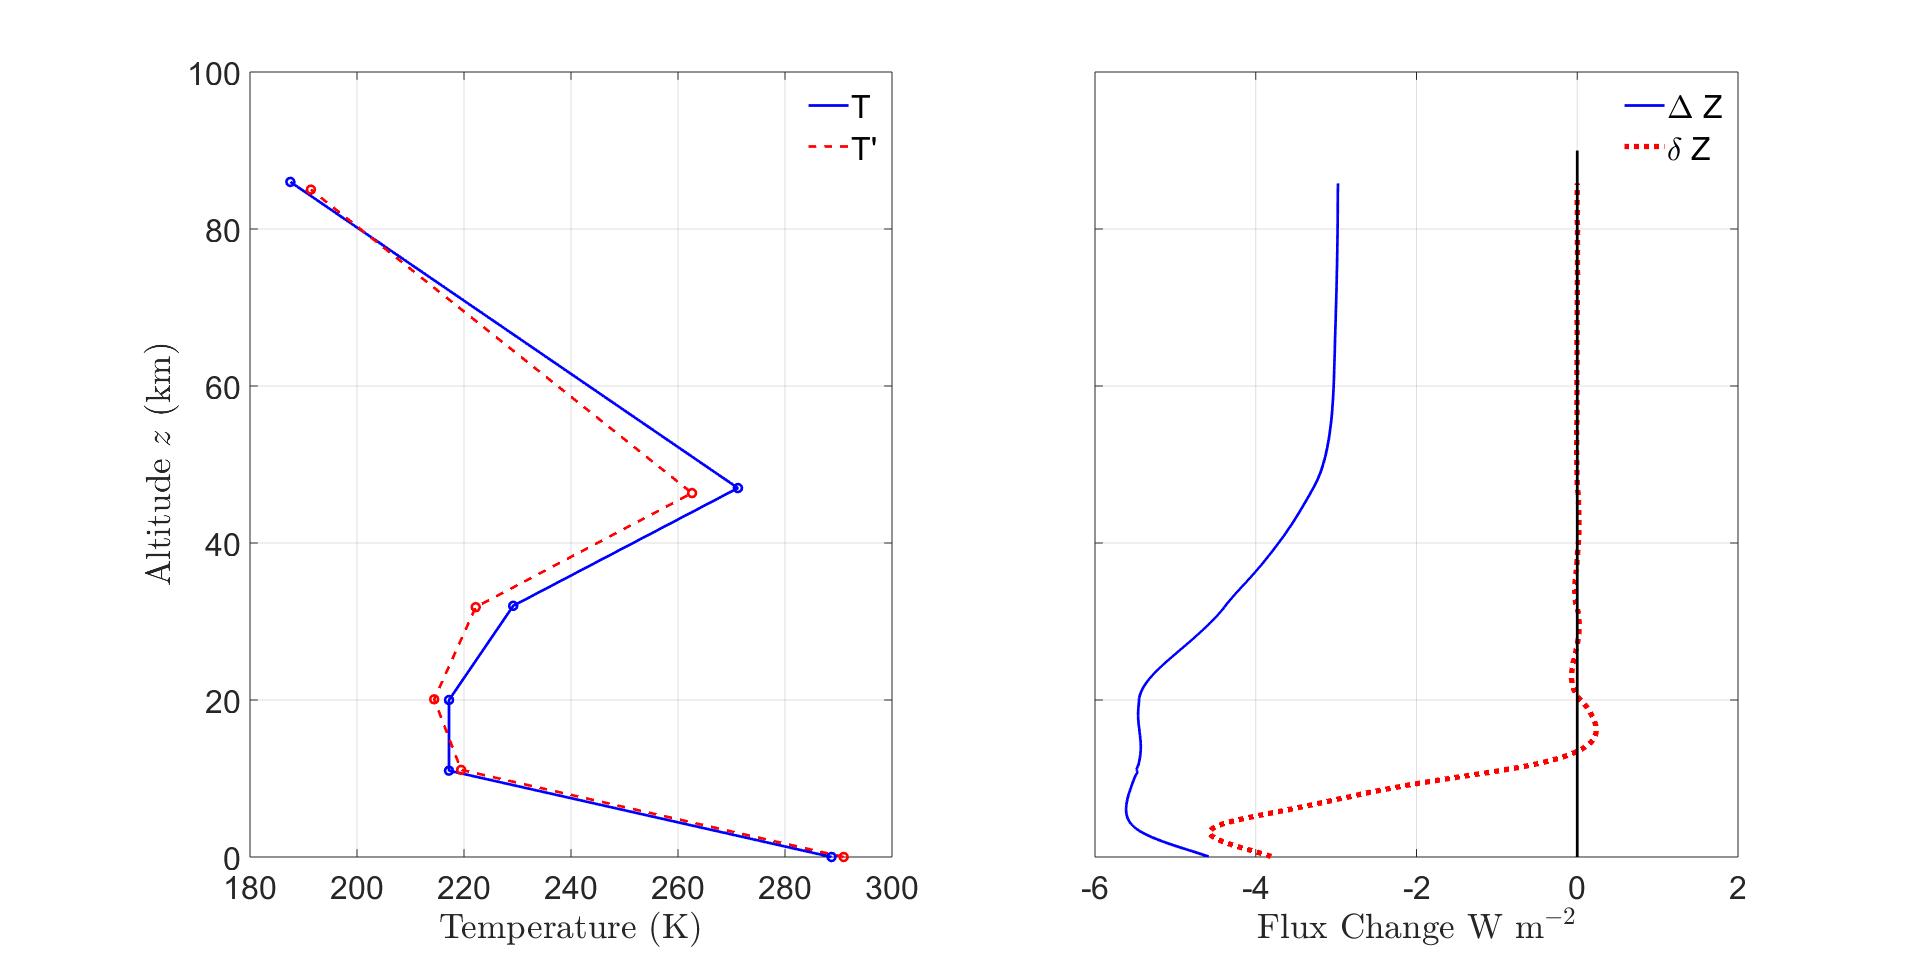
Thefluxincrement∆Z fordoublingCO2 concentrationsistoosmalltobeseenclearlyin Fig.7sowehaveplottedanexpandedversionintherightpanelofFig.11.Themagnitude ofthefluxincrementissomewhatgreaterintheloweratmospherethanathigheraltitudes.
Figure11:TemperatureandFluxAdjustments. Left. Aninitialtemperatureprofile T (continuousblueline),whichischaracteristicofmidlatitudes,andtheadjustedprofile T = T +∆T (dottedredline),from(69). Right. Thecontinuousbluelineisthealtitude profileoftheinstantaneousfluxdecrease∆Z of(56)causedbyincreasingCO2 concentrations from400ppmto800ppm,withnochangeintheprofiles T oftemperatureor Cw ofwatervaporconcentration.Thedottedredlineshowstheresidualfluxchange δZ of(59)forthe adjustedtemperatureprofile T oftheleftpanel,togetherwiththeadjustedwater-vapor concentration Cw tokeeprelativehumidityconstantatallaltitudes.Theseadjustments restorethefluxasnearlyaspossibletoitsoriginalvalueforaltitudesabovethetropopause, thecriterionformaintainingradiative-convectiveequilibrium.
Insteadystatetheatmosphereiscommonlyassumedtobein radiative-convectiveequilibrium,describedin1967byManabeandWetherald[35].Iftheconcentration Cg ofagreenhousegasotherthanwatervaporinstantaneouslychangestoanewvalue Cg = Cg +∆Cg, theatmospherewillnolongerbeinequilibrium.Torestoreradiative-convectiveequilibrium thetemperatureprofilewillchangeto T = T +∆T andthewater-vaporconcentrationwill changeto Cw = Cw +∆Cw
Thefirstcriterionforradiative-convectiveequilibriumisnochangeinthermalfluxatthe topofradiativeatmosphere,whichwetaketobethemesopausealtitude zmp = ζ5,
Thiscriterionassumesthatnetsolarheatingremainsthesameandisbalancedbythermal radiationtospace.
Abovethetropopause,verticalconvectionisnegligible.Thermalradiationcarriesoffheat resultingfromtheabsorptionofsolarultravioletradiationbyozone,andalsoanyheating byhorizontalconvection.Inradiativeequilibrium,thevolumeheatingrateisbalancedby thethermal-radiationcoolingrate, dZ/dz.Soasecondcriterionforradiative-convective
equilibriumisnochangeineithertheheatingorcoolingrates
Wecanintegrate(58)downinaltitudefromthetopoftheatmosphere,using(57)asa boundarycondition.Thisgivesacombinedcriterionforradiativeequilibriumabovethe tropopause,
Belowthetropopause,muchoftheheatistransportedbyverticalconvectionrather thanradiation.ManabeandWetheraldsuggestedthatforconvectiveequilibriuminthe troposphere,thetemperaturelapserate, ∂T/∂z shouldequal(ornotexceed)anequilibrium value, L,thatisaknownfunctionofthealtitude z andofthesurfacetemperature θ0
Formally,thecriterionis
Integrating(60)weseethatthetropospherictemperatureisafunctionofaltitude z and surfacetemperature θ0,givenby
Troposphericlapseratesmeasuredbyradiosondesareoftenquitecomplicated[36].Simplifiedfunctionsarenormallyusedtoapproximatelapserates.ManabeandWetherald[35] madeextensiveuseofthealtitude-independenttroposphericlapserate
Thiscanbethoughtofastheaverage,overthetroposphere,ofamorecomplicatedlapse rate
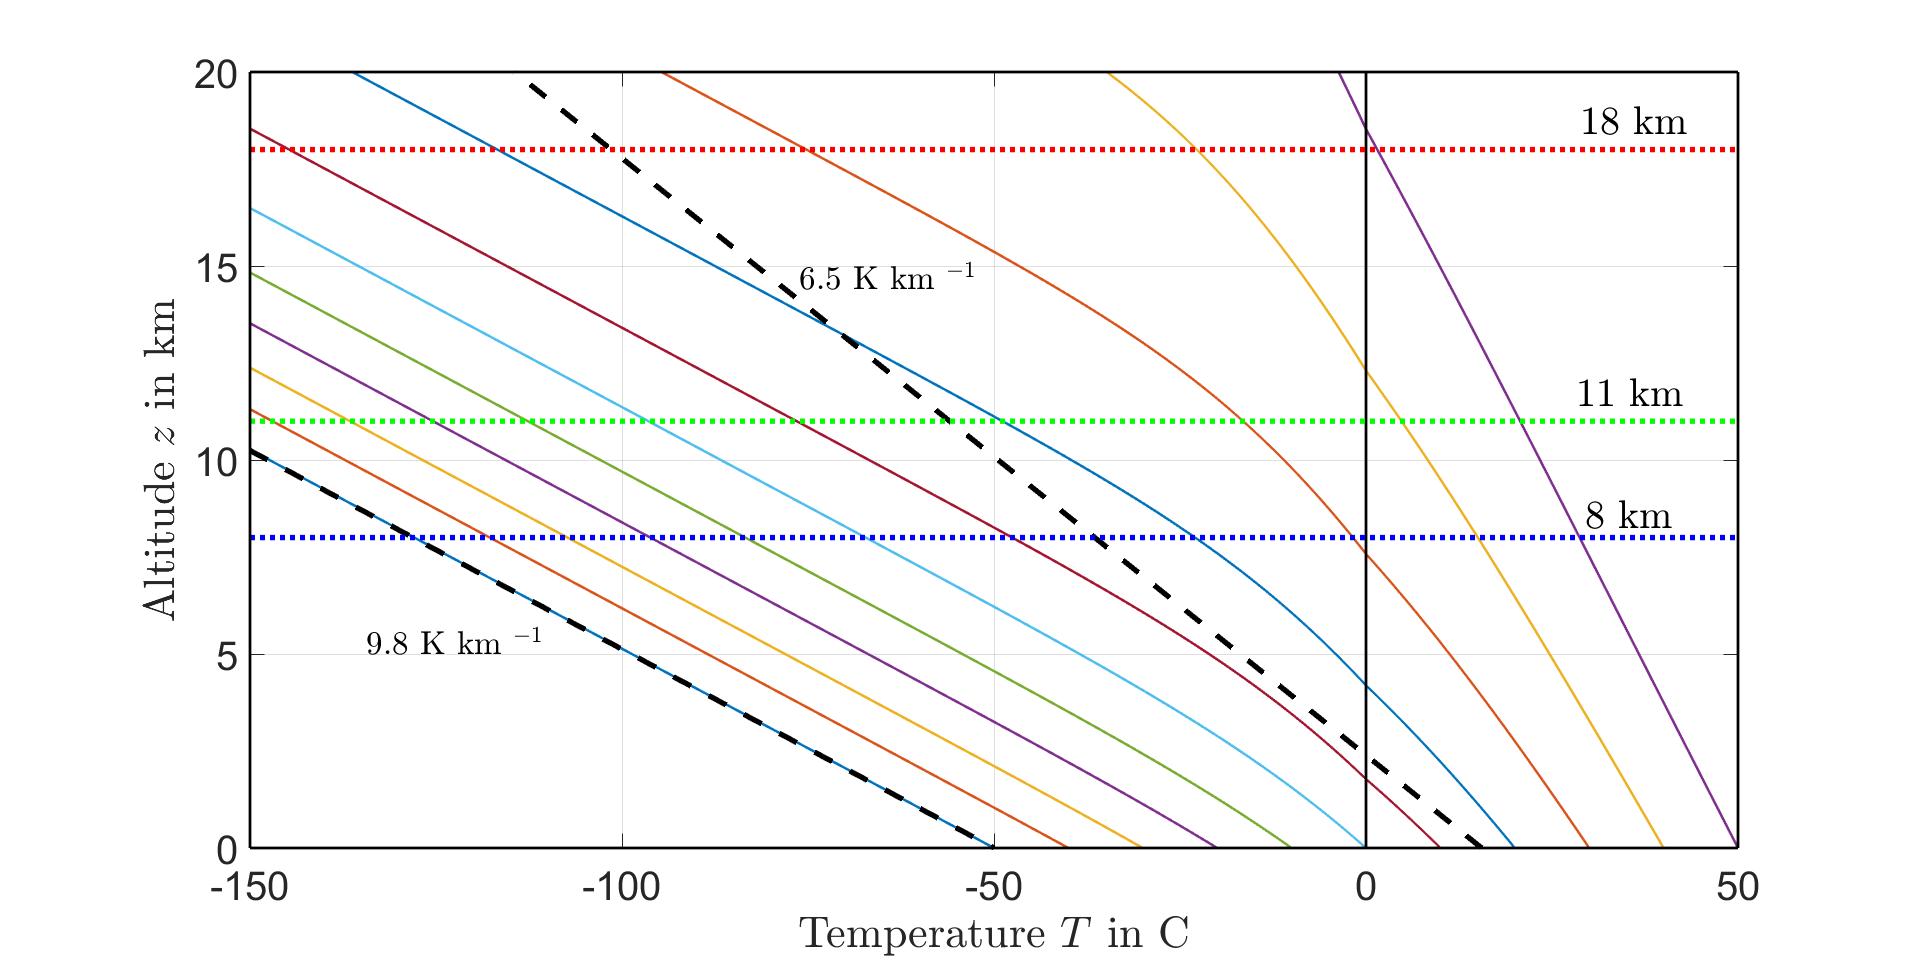
Pseudoadiabatictemperatureprofilesresultifairwith100%relativehumidityisadiabaticallydecompressed,withliquidorsolidphasesofwaterremovedastheyform.Butnoheat isexchangedwiththeenvironmentduringthedecompression.Fig.12showsvariouspseudoadiabatictemperatureprofilesthatcanbefoundusingtheClausiusClapeyronequation [37].Alsoshownasblack,dashedlinesarerepresentativeprofileswithaltitude-independent lapserates.Thepseudoadiabatwithasurfacetemperatureof θ0 = 50Chasverylittle watervaporandcannotbedistinguishedfromaprofilewithafullyadiabatic,dry-airlapse rateof9.8K/km.
7.1Temperatureadjustment
Setting z = ζ1 in(61)weseethatthebreakpointtemperatureatthetropopauseis
Figure12:Temperatureprofilesforlapseratesthatarealtitude-independent(blackdashed lines)andpseudoadiabatic(coloredcontinuouslines).Thedashedblacklinethatstartsat asurfacetemperatureof-50C,hasanaltitude-independentlapserateofΓW =9 8K/km, thedryadiabaticlapserateof(87).Littlecondensiblewaterisavailabletoslowthecooling alongthepseudoadiabatthatstartsfromasurfacetemperatureof-50C,sothedryadiabat andthepseudoadiabatarealmostindistinguishable.Thedashedblacklinethatstartsfrom asurfacetemperatureof15.5C(288.7K)hasanaltitude-independentlapserateof6.5 K/km.Representativetropopausealtitudesare8km(polarlatitudes),11km(temperature latitudes)and18km(tropicallatitudes).
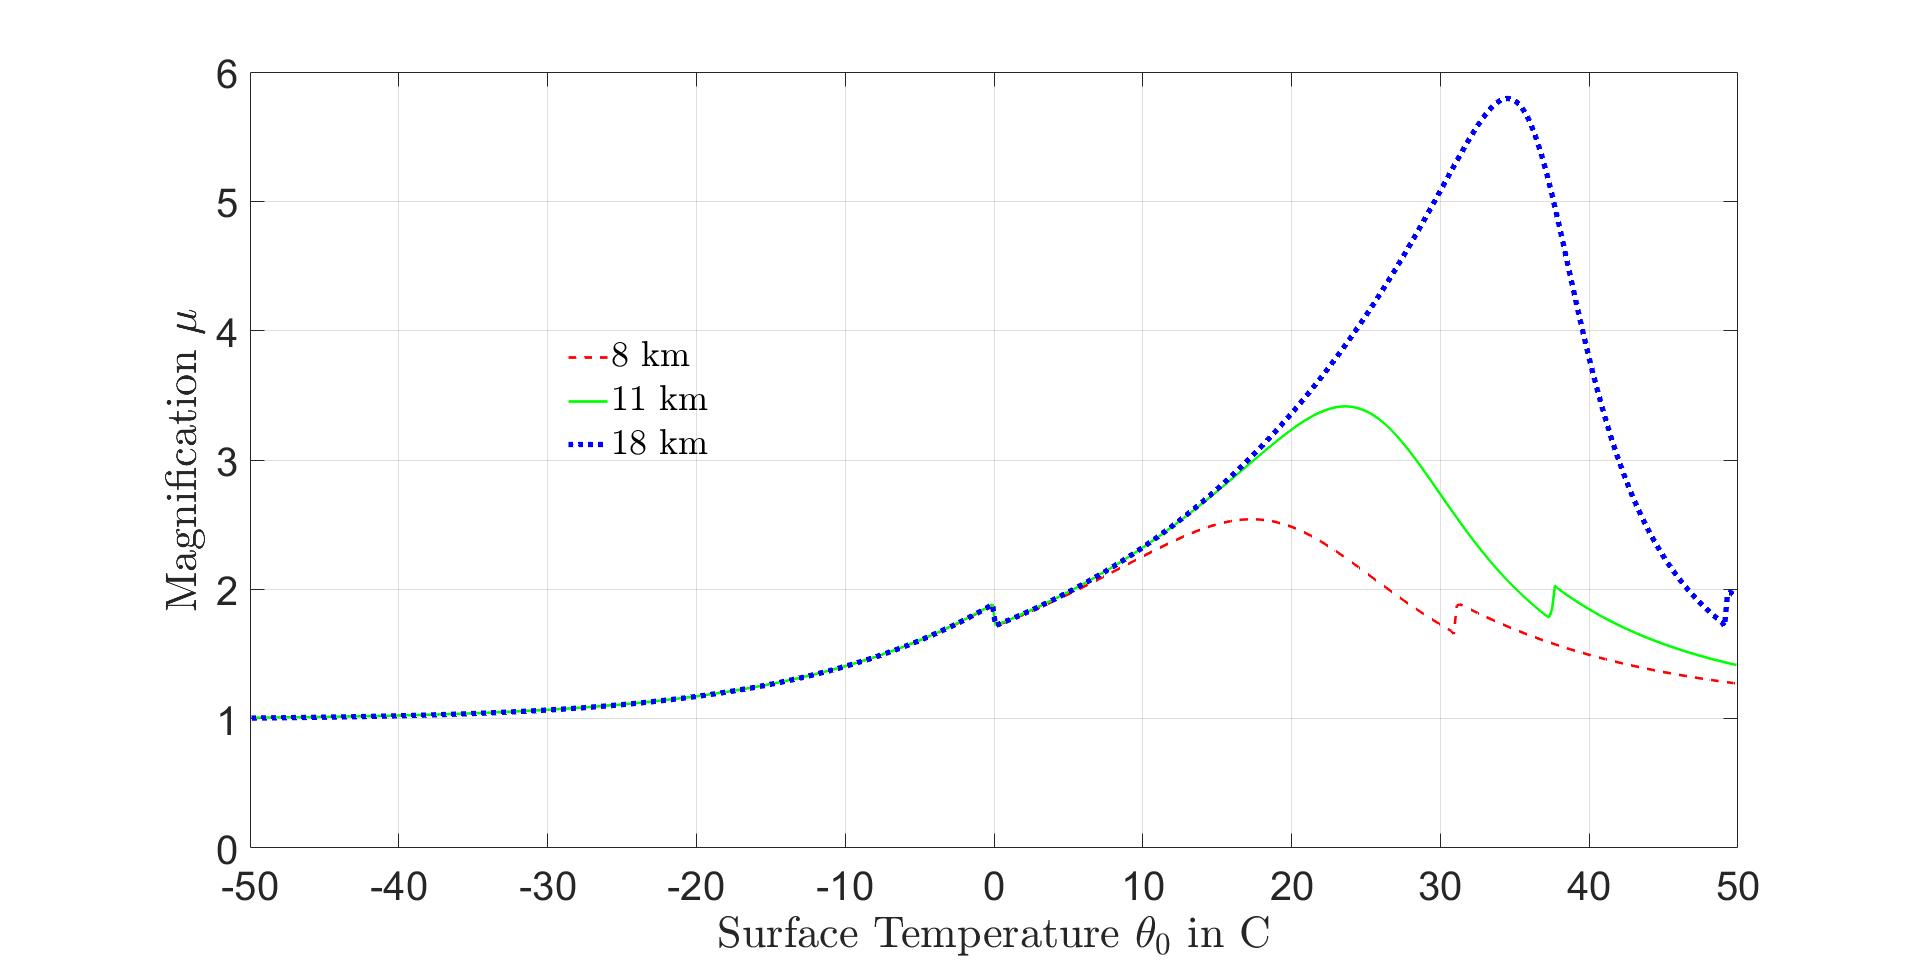
Ifthesurfacetemperatureincreasesbyasmallincrement∆θ0,thetropopausebreakpoint temperaturewillincreaseby∆θ1 = µ∆θ0.From(64)weseethatthetropopausetemperature magnificationfactor
Someillustrativemagnificationfactors µ forpseudoadiabaticlapseratesareshowninFig. 13.
From(61)weseethatasurfacetemperatureincrease∆θ0,willcausethetropospheric temperaturetoincreaseby∆T ,where
Thetemperature-adjustmentbasisfunctionΦ1(
)is
Foraltitudesabovethetropopauseweextendthedefinition(67)to
Figure13:Magnificationfactor µ versusSurfaceTemperatureforthreetropopausealtitudes asindicated.Theleftkinkoccursatthesurfacefreezingtemperaturewhiletherightkink occurswhenthetropopausetemperature θ1 =0C.
Guidedby(66)wewillassumethatthetemperatureadjustment∆T thatbestrestores radiative-convectiveequilibriumfromthesurfacetothetopoftheatmosphereisparameterizedbythebreakpointtemperatureadjustments∆θλ,for λ =1, 2, 3, 4, 5.Werepresentthe temperatureadjustmentbytheexpansionontemperature-adjustmentbasisfunctionsΦλ.
WealreadydefinedΦ1 with(67)and(68).For λ =2, 3, 4wewritethetemperatureadjustmentbasisfunctionsas
Forthehighestaltitudeswetakethetemperature-adjustmentbasisfunctiontobe
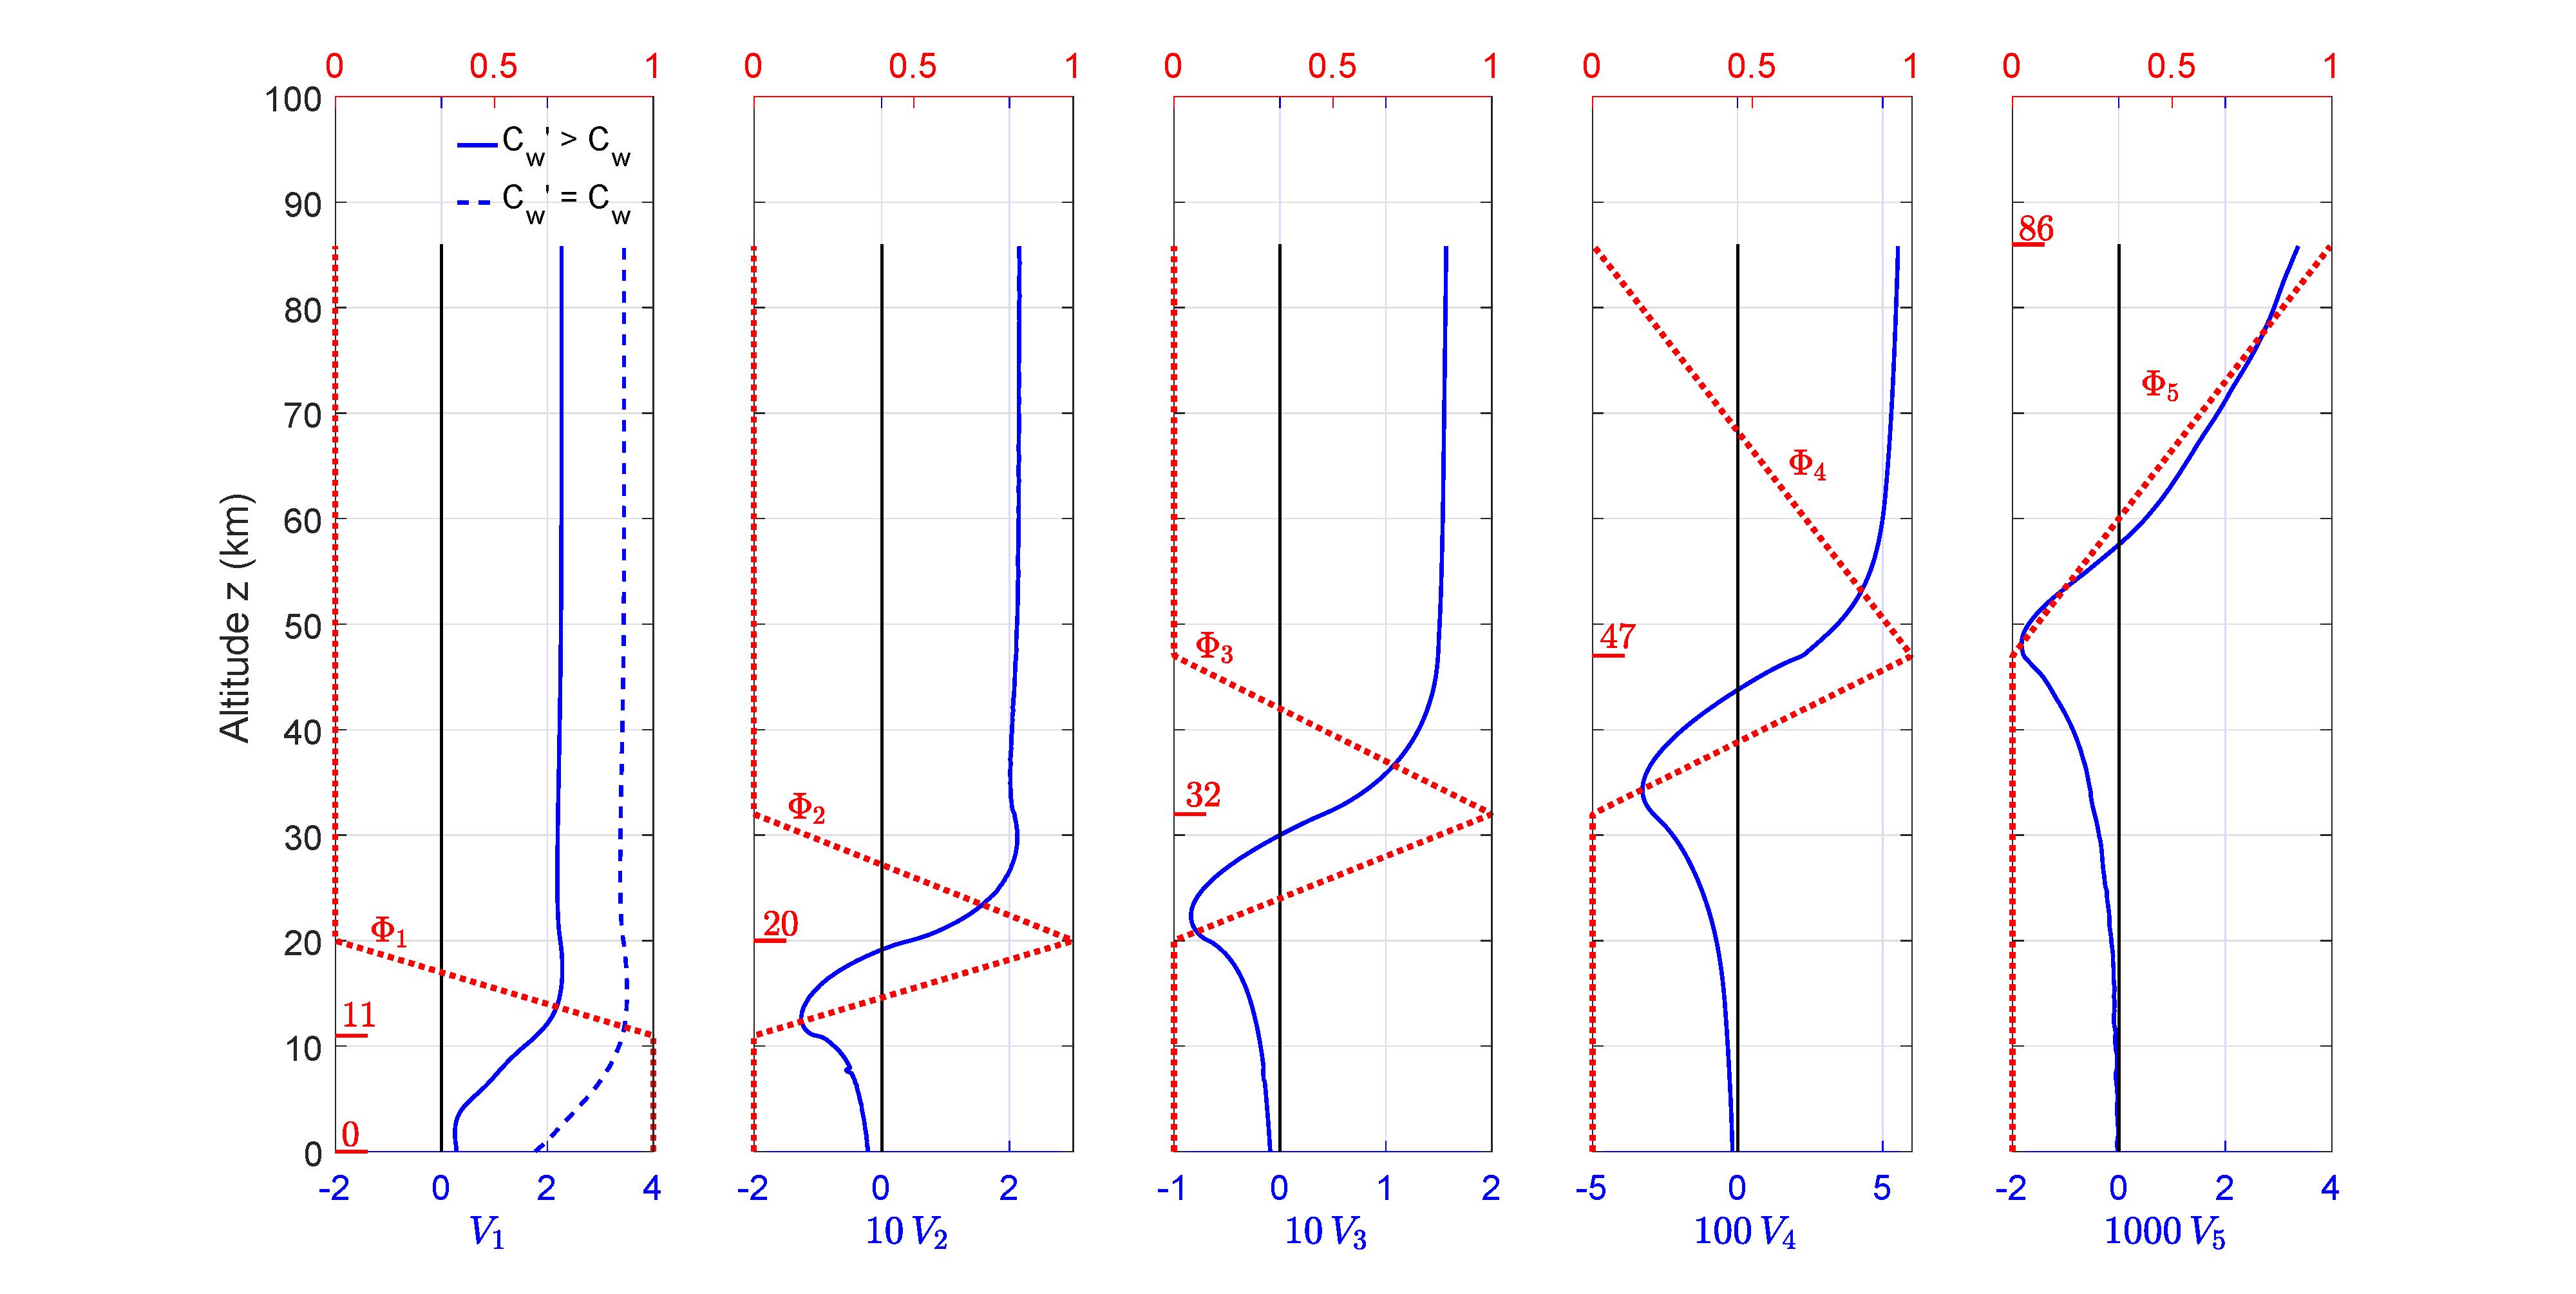
Representativetemperature-adjustmentprofiles,Φλ andflux-adjustmentprofiles,Vλ foran altitude-independentlapserate, L =6 5Kkm 1 areshowninFig.14.
7.2Fluxadjustments
Thebreakpoint-temperatureadjustments,∆θλ,canbeusedtofindthefluxthatrestores radiative-convectiveequilibriumas
Figure14:ThetemperaturebasisfunctionsΦα areshownasdashedredlineswithscalesat thetopsofthepanels.Altitudesatthemaximaofthetemperatureperturbationsaregiven inkmnexttotheshortredlines.Multiplesofthefluxbasisfunctions Vα inunitsofW m 2 K 1,andwithconstantrelativehumiditywatervaporfeedback,areshownassolidblue lines,withscalesatthebottomsofthepanels.Thedashedbluelineisforfluxperturbation V1 withoutwatervaporfeedback(with Cw = Cw).Thefluxperturbations V2,...,V5 arethe samewithorwithoutwatervaporfeedback.
Theflux-adjustmentbasisvectorfor λ =1is
ManabeandWetherald[35]pointedoutthatoneplausiblewayforatmosphericwatervapor torespondtoatemperatureincreasewouldbefortherelativehumiditytoremainconstant atallaltitudes.Observationalsupportforthishypothesisisambiguous.Forexample,over 70yearsofradiosondeobservationsindicaterelativehumidityhasdecreasedslightlyinthe upperatmosphere[38].
Weassumethatchangesinwater-vaporconcentrationhavenegligibleeffectataltitudes abovethetroposophere,sothattheflux-adjustmentbasisvectorsfor λ =2, 3, 4, 5aredefined
Thentheadjustedforcingof(59)is
7.3Optimumtemperatureadjustments
Betweenbreakpointaltitudes ζλ and ζλ+1 wehavetaken100evenlyspacedaltitudesegments. Using(72)in(59)foreachofthe400altitudesamples z abovethetropopausewouldgive 400linearequationsinthefiveunknowns,∆θ1, ∆θ2,... ∆θ5 .Thisgrosslyoverdetermines the∆θλ.However,wecanfindvaluesof∆θλ thatgivethebestapproximatesolutionto(59) byminimizing
where δZi = δZ(zi).Theadjustments∆θλ arenotverysensitivetotheweights Wi,andwe used
Thealtitudeintervalsizeis∆zi = zi+1 zi. Thetemperatureadjustments∆θλ,thatminimize(76)arethesimultaneoussolutionsof thefivelinearequations(λ =1, 2, 3, 4, 5)
where Vλi = Vλ(zi)wasdefinedby(73)and(74).Wecanwrite(75)asthe5 × 5matrix equation
Theadjustmentmatrixof(79)is
Thesourcevectoris
where∆Zi =∆Z(zi)wasdefinedby(56).Weassumethattheadjustmentmatrix A of(80) hasaninverse A 1.Thenwecanmultiplybothsidesof(79)by A 1 tofind
Thetemperatureadjustment(82)willslightlyaffectthebreakpointaltitudes.Thepressurewillnotchangefortheairsegmentinitiallyatthealtitude zi sinceitisduetotheweight perunitareaofallhigherairsegments.Theidealgaslawimpliesthattheheightincrement ofthe ithintervalbecomes
Theadjustedbreakpointaltitudesatthetopofthe λthlayer,with λ =1, 2, 3, 4, 5,willbe
Thesurfacealtitudeadjustmentobviouslyis∆ζ0 =0.
7.4RepresentativeCalculations
7.4.1AndersonH2Oprofilefor L =6 5 Kkm 1
Forthetemperatureprofileandstandardgreenhouse-gasconcentrationsofFig.1,doubling theCO2 concentrationchangestheflux Z asshownintherightpanelofFig.11.The adjustmentsgivenby(82)and(84)areasfollows.
Temperatureadjustmentsbutnowater-vaporadjustment.
Thebreakpointtemperatureandaltitudeadjustmentsshowtheloweratmospherewarmsand expandsslightlyafterdoublingtheCO2 concentrationwhiletheupperatmospherecoolsand contracts.
Bothtemperatureandconstantrelativehumiditywater-vaporadjustments.
Thetemperatureandaltitudeadjustmentsof(86)areshownintheleftpanelofFig.11. DoublingCO2 concentrationswithwatervaporfeedbackincreasesthesurfacetemperature warmingto∆θ0 =2.3Kfrom∆θ0 =1.4K,orbyafactorof1.6.
7.4.2ManabeH2Oprofilefor L =6.5 Kkm 1
Thesensitivityoftheresultstothewatervaporprofilewerecheckedbyconsideringthe altitudedependenceofrelativehumidityΦ(z),usedbyManabeandWetherald[35].
Here, p isthepressureataltitude z while ps denotesthesurfacepressure.Manabeand WetheraldsetthesurfacerelativehumidityΦs to77%.Equation(87)failsathighaltitudeswhereitgivesnegativerelativehumidityvalues.TheminimumH2Omixingratiowas thereforesetto3 × 10 6 gmpergmofairwhichcorrespondstoaconcentrationof4.8ppm. Equation(87)givesahighersurfaceH2Oconcentrationof13,396ppmthan7,750ppmfound usingtheH2OprofileobservedbyAnderson[18]showninFig.1.TheH2Oconcentration obtainedusingequation(87)decreasesfasterwithaltitudethanthatobservedbyAnderson andcorrespondstoacolumndensityabout20%higherthanthatgiveninTable1.
Theadjustmentsgivenby(82)and(84)areasfollows.
Temperatureadjustmentsbutnowater-vaporadjustment.
Bothtemperatureandconstantrelativehumiditywater-vaporadjustments.
Theseresultsforbothcaseswithoutandwithwatervaporfeedbackdifferverylittlefrom (85)and(86)thatwereobtainedusingtheAndersonH2Oprofile.
7.4.3AndersonH2OprofilewithPseudoadiabaticLapseRate
Theeffectofatemperatureprofiledeterminedusingapseudoadiabaticlapserateillustrated inFig.12wasconsidered.Forasurfaceat288.7K,thetemperaturedecreasesto211.2 Kat11kmaltitude.Thisisslightlylowerthanthetropopausebreakpointtemperature θ2 =217.2Kgivenby(1).Thehigheraltitudetemperaturesweredeterminedusingthe samebreakpointtemperaturesasgivenby(1)andallofthebreakpointaltitudesremained unchanged.
Theadjustmentsgivenby(82)and(84)areasfollows.
Temperatureadjustmentsbutnowater-vaporadjustment.
Bothtemperatureandconstantrelativehumiditywater-vaporadjustments.
In(90)and(91),thesurfacewarmingwasfoundusingthemagnificationfactor µ =3 0ata midlatitudetropopausealtitudeof11km.
7.5ClimateSensitivity
Acomparisonofourresultfortheclimatesensitivitydefinedasthesurfacewarmingdue todoublingtheCO2 concentrationfrom400to800ppm,tootherworkisgiveninTable 5.Thesecalculationsconsideredthecaseofaclearskyonedimensionalatmospherein radiative-convectiveequilibrium.Allgroupsgetnearlytheidenticalvalueforthecaseof fixedabsolutehumidityforaconstantlapserateof6.5K/kminthetroposphere.Additional significantsurfacewarmingoccursforthecaseoffixedrelativehumidity.Ourresultof2.2 KissubstantiallylowerthanthevalueobtainedbythepioneeringworkofManabeand Wetherald[35]whoobviouslydidnothaveaccesstothecurrentlinebylineinformation.In alaterpublication[39]theauthorsexplainedthattheir1967resultforthesurfacewarming decreasedbyabout20%whentheyreplacedtheirradiationtransferschemebythatusedby RodgersandWalshaw[27]whichtheyfeltwassuperior.A20%reductionoftheirclimate sensitivityresultof2.9Kgivesthevalueof2.3Kclosertothatoftheothergroups.Hunt andWells[40]refinedtheearliermodelusedbyManabeandHunt[41]toencompass18 altitudinallevelsupto37.5km.Kluftetal[42]calculatedradiativefluxesusingtheRapid RadiativeTransferModelwhichisusedforglobalclimatemodels[43].Theirtemperature adjustmentsshowstratosphericcoolingofabout10Ksimilartoourresultsbutgreater surfacewarming.Allgroupsobtainsimilarsurfacewarmingforthecaseoffixedrelative humidityusingapseudoadiabaticlapserateinthetroposphere.Somevariationoftheresults istobeexpectedsincethecalculationsuseddifferentwatervaporconcentrationprofilesas wellastemperatureprofilesthatdifferslightlynearthetropopause.
constantlapserate(6.5Kkm 1)
constantlapserate(6.5Kkm 1)
pseudoadiabaticlapserate
Table5:ClimatesensitivityinKelvinsfordifferentmodelconfigurations.Thebracketed numbersnexttotheresultsfoundbyManabeandWetherald[35]aretheresultsofour calculationusingtheirrelativehumidityprofilegivenby(87).Ourresultforthecaseof fixedrelativehumiditywithapseudoadiabaticlapserateinthetropospherewasfoundusing thetemperatureprofileshowninFig.(12)whichisfurtherdiscussedinthetext.
8ComparisonofModelIntensitiestoSatelliteObservations
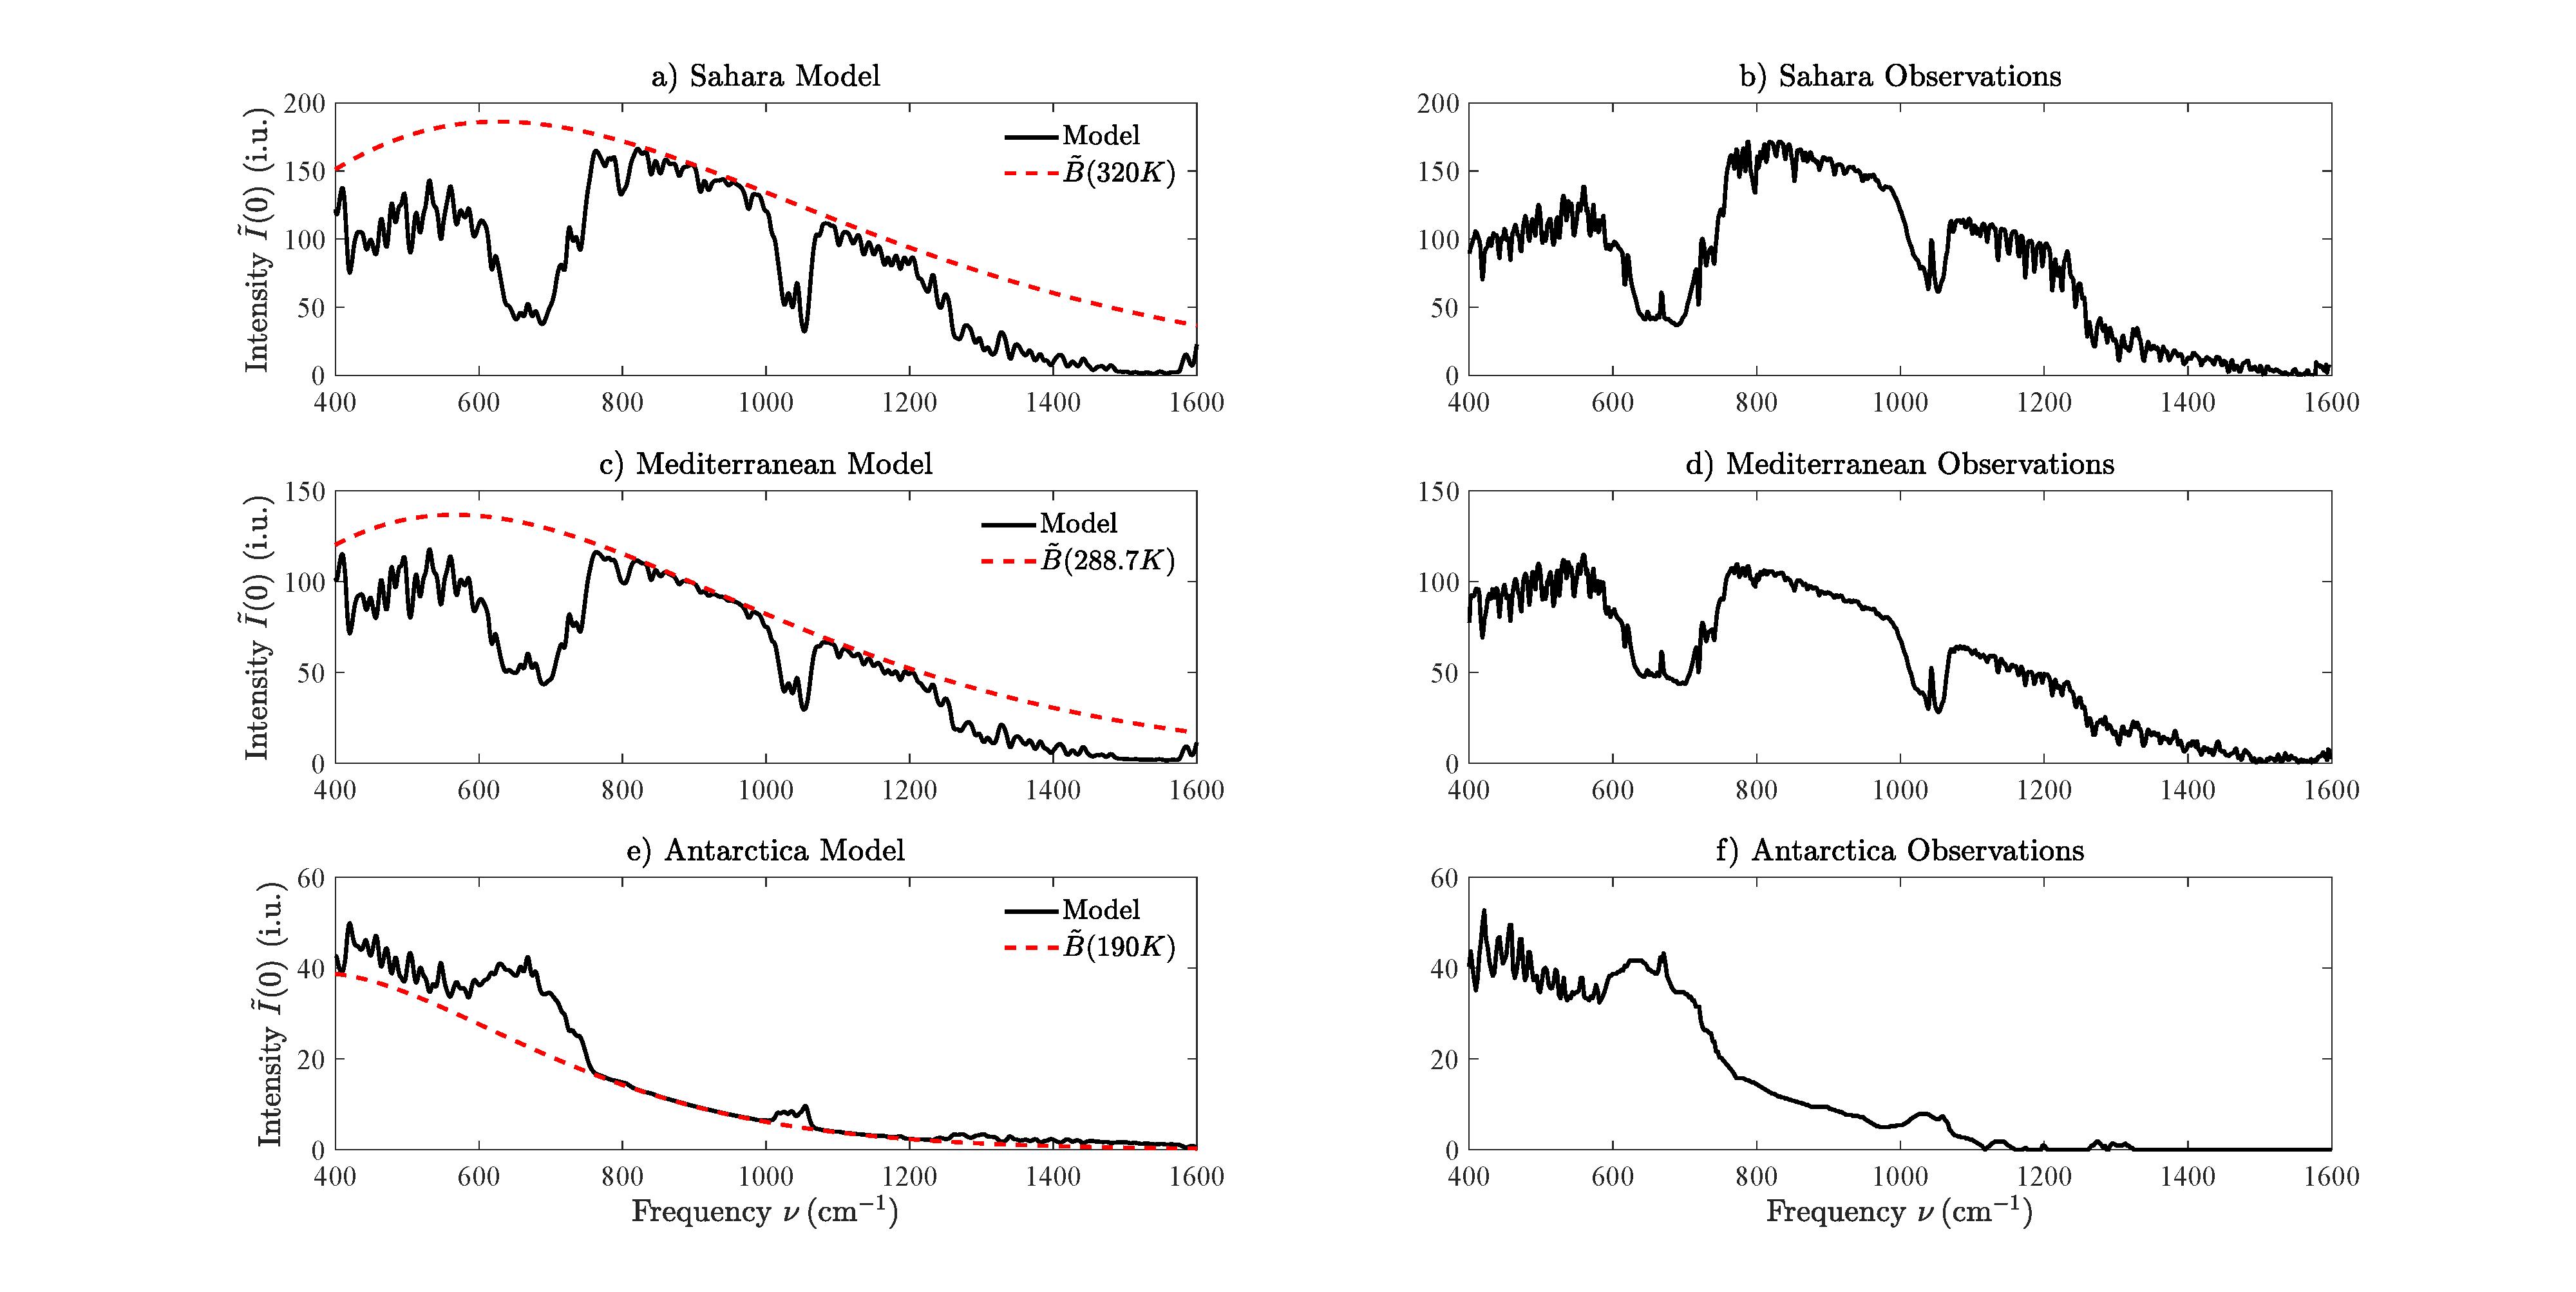
Animportanttestistocomparecalculationstoobservations.Fig15showsverticalspectral intensities, I(0),measuredwithaMichaelsoninterferometerfromasatelliteovertheSahara Desert,theMediterraneanSeaandAntarctica[44].Thefigurealsoshowsvaluesofthe verticalintensity, I,calculatedwith(27).
FortheMediterranean,weusedthefivesegmenttemperatureprofileofFig.1.Forthe SaharaandAntarcticaanalogousprofileswithdifferentparameterswereused.Thealtitude breakpointsfortheSaharawereat ζ =[0, 18, 20, 32, 47, 86]km.Thehightropopauseat18 kmischaracteristicofnearequatoriallatitudes.ForAntarctica,thealtitudebreakpoints were ζ =[0, 2 5, 8, 25, 47, 86].Thelowtropopauseat8kmischaracteristicofthenighttime poles,asisthestrong,wintertimetemperatureinversion,peakingat2.5km.Thelapse ratesbetweenthebreakpointswere L =[6.5, 0, 1, 3.8, 2.145]Kkm 1 fortheSaharaand L =[ 12.5, 2.33, 0, 1.5, 2.145]Kkm 1 forAntarctica.Thesurfacetemperatureinthe Saharawastakentobe T0 =320K(veryhot)andthesurfacetemperatureinAntarctica wastakentobe T0 =190K(verycold).ThesurfacepressureintheSaharaandthe Mediterraneanwastakentobe p0 =1013hPaandthesurfacepressureinAntarcticwas takentobe p0 =677hPa,lowbecauseofthehighelevationoftheicesurface,about2.7km abovemeansealevel.
Forconvenience,wemodeledthedependenceofthewatervaporconcentrations C {i} on theheight z abovethesurfaceas
C {i} = C {i} 0 e z/zw , (92) withalatitudeindependentscaleheight zw =5kmandwithsurfaceconcentrations C {i} 0 =
Figure15:Verticalintensities ˜ I(0)atthetopoftheatmosphereobservedwithaMichaelsoninterferometerinasatellite[44],andmodeledwith(27):overtheSaharadesert,the MediterraneanandAntarctica.Theintensityunitis1i.u.=1mWm 2 cmsr 1.Radiative forcingisnegativeoverwintertimeAntarcticasincetherelativelywarmgreenhousegasesin thetroposphere,mostlyCO2,O3 andH2O,radiatemoretospacethanthecoldicesurface, atatemperatureof T =190K,couldradiatethroughatransparentatmosphere.
31, 000ppmfortheSahara, C {i} 0 =12, 000ppmfortheMediterranean,and C {i} 0 =2, 000 ppmAntarctica.Fortheyear1970whenthesatellitemeasurementsweremade,weused surfaceconcentrations,inppm,forCO2,N2OandCH4 of326,0.294and1.4,withthesame relativealtitudeprofileasthoseinFig1.ThealtitudeprofileofFig.1forO3 wasusedfor theSahara,theMediterraneanandAntarctica.
AscanbeseenfromFig.15themodeledspectralintensitiescanhardlybedistinguished fromtheobservedvalues.Weconcludethatourmodeledspectralfluxeswouldalsobeclose toobservedfluxes,ifareliablewaytomeasurespectralfluxeswereinvented.
9Conclusions
Thisworkexaminedthetransmissionofinfraredradiationthroughacloud-freeatmosphere fromtheEarth’ssurfacetoouterspace.Alinebylinecalculationusedover1/3millionlines ofthefivemostimportantnaturallyoccurringgreenhousegases,H2O,CO2,O3,N2Oand CH4.Thisincludedconsiderablymoreweakerrovibrationallinestrengths,forH2Oassmall as10 27 cm,thanotherstudies.Thecalculationofforcingstookintoaccounttheobserved
altitudinalconcentrationsofthevariousgasesaswellasseveraltemperatureprofiles.
Theupwardspectralflux, Z,“breaksout”atanemissionheight ze,givenby(38). Emissionheightscanbenearthetopoftheatmosphereforfrequenciesinthemiddleof strongabsorptionlines.Forfrequencieswithlittleabsorption,theemissionheightscanbe closeto,oratthesurfaceasshowninFig.3.
ThemoststrikingfactaboutradiationtransferinEarth’satmosphereissummarizedby Figs.4and5.DoublingthecurrentconcentrationsofthegreenhousegasesCO2,N2Oand CH4 increasestheforcingsbyafewpercentforcloud-freepartsoftheatmosphere.Table3 showstheforcingsatboththetopoftheatmosphereandatthetropopausearecomparable tothosefoundbyothergroups.
Radiativeforcingdependsstronglyonlatitude,asshowninFigs.7and8.Nearthe wintertimepoles,withverylittlewatervaporintheatmosphere,CO2 dominatestheradiativeforcing.TheradiationtospacefromH2O,CO2 andO3 intherelativelywarmupper atmospherecanexceedtheradiationfromthecoldsurfaceoftheicesheetandtheTOA forcingcanbenegative.
Fig.9aswellasTables2and4showthatatcurrentconcentrations,theforcingsfromall greenhousegasesaresaturated.ThesaturationsoftheabundantgreenhousegasesH2Oand CO2 aresoextremethattheper-moleculeforcingisattenuatedbyfourordersofmagnitude withrespecttotheopticallythinvalues.Saturationalsosuppressestheforcingpowerper moleculeforthelessabundantgreenhousegases,O3,N2OandCH4,fromtheiropticallythin values,butfarlessthanforH2OandCO2
Table2andFig.10showtheoverlapofabsorptionbandsofgreenhousegasescausestheir forcingstobeonlyroughlyadditive.Onegreenhousegasinterfereswith,anddiminishes,the forcingsofallothers.Buttheself-interferenceofagreenhousegaswithitself,orsaturation,is amuchlargereffectthaninterferencebetweendifferentgases.Table4showsthatforoptically thinconditions,theforcingpowerpermoleculeisaboutthesameforallgreenhousegases, afewtimes10 22 Wpermolecule.
DoublingtheCO2 concentrationwillcauseatemperaturedecreaseoftheupperatmosphereofabout10KasshowninFig.11torestorehypotheticalradiative-convectiveequilibrium.Forthecaseoffixedabsolutehumidity,thesurfacewarmsby1.4Kwhichagrees verywellwithotherworkasshowninTable5.Thesurfacewarmingincreasessignificantly forthecaseofwaterfeedbackassumingfixedrelativehumidity.Ourresultof2.3Kiswithin 0.1Kofvaluesobtainedbytwoothergroupsaswellasaseparatecalculationwhereweused theManabewatervaporprofilegivenby(87).Forthecaseoffixedrelativehumidityanda pseudoadiabaticlapserateinthetroposphere,weobtainaclimatesensitivityof2.2K.The correspondingclimatesensitivitiesdeterminedbyothergroupsdifferbyabout10%which canbeexpectedusingslightlydifferingtemperatureandwatervaporprofiles.Theissueof waterfeedbackwouldundoubtedlybegreatlyclarifiedifadditionalobservationsofwater vaporconcentrationasafunctionofaltitudewereavailable.
Fig.15showsthattheintegraltransform(27)usedtocalculateTOAintensities I with HITRANlineintensitiesandwithnoCO2 norH2Ocontinuumabsorptiongivesresultsin verycloseagreementwithspectralintensitiesobservedfromsatellitesoverclimatezonesas differentastheSaharaDesert,theMediterraneanSeaandAntarctica.Onecanthereforehave confidenceinthecalculationsofspectralfluxes.ThenegligibleeffectoftheH2Ocontinuum onthetopoftheatmosphereradiativefluxhasalsobeenfoundbyZhongandHaigh[45].It
wouldbeinterestingtoexaminecomparabledataforthetropicswhereatmosphericmoisture ishighesttodeterminetheeffectofaH2Ocontinuum.Onewouldneedtobecarefulthat any“observedcontinuum”notbeconfusedwithalayerofcloudlikehazewhichcanbe prevalentathighhumidities.Inconclusion,thecombinationofonedimensionalradiativeconvectivemodelsandobservationssuchasTOAintensitiesareinvaluableforfurthering ourunderstandingofhowincreasinggreenhousegasconcentrationswillaffecttheEarth’s climate.
Acknowledgements
Wearegratefulforconstructivesuggestionsbymanycolleagues.Specialthanksaredueto TomSheahenforinitialencouragementandtoG.IouliwhohelpedaccesstheHITRANdata base.TheCanadianNaturalScienceandEngineeringResearchCouncilprovidedfinancial supportofoneofus.
References
[1]G.Myhreetal, AnthropogenicandNaturalRadiativeForcing, ClimateChange2013: ThePhysicalScienceBasis.ContributionofWorkingGroupItotheFifthAssessment ReportoftheIntergovernmentalPanelonClimateChange.CambridgeUniversityPress, Cambridge,UnitedKingdom(2013).
[2]GlobalGreenhouseGasReferenceNetwork,NOAAEarthSystemResearchLaboratory/GlobalMonitoringDivision,www.esrl.noaa.gov/gmc/ccgg,(2019).
[3]S.E.Schwartz, ResourceLetterGECC-1:TheGreenhouseEffectandClimateChange: Earth’sNaturalGreenhouseEffect,Am.J.Phys. 86,(8),565-576,(2018).
[4]S.E.Schwartz, ResourceLetterGECC-2:TheGreenhouseEffectandClimateChange: TheIntensifiedGreenhouseEffect,Am.J.Phys. 86,(9),645-656,(2018).
[5]L.S.Rothman,R.L.Hawkins,R.B.WatsonandR.R.Gemache, EnergyLevels, IntensitiesandLinewidthsofAtmosphericCarbonDioxideBands,JQSRT, 48,537 (1992).
[6]I.E.Gordon,L.S.Rothmanetal., TheHITRAN2016MolecularSpectrospicDatabase, JQSRT 203,3-69(2017).
[7]S.Chandrasekhar, RadiativeTransfer,Dover,NewYork(1960).
[8]S.ManabeandF.M¨oller, OntheRadiationEquilibriumandHeatBalanceoftheAtmosphere,MonthlyWeatherReview 89,No.12,503(1961).
[9]R.M.GoodyandY.L.Yung, AtmosphericRadiation:TheoreticalBasis OxfordUniversityPress,Oxford(1995).
[10]D.P.Edwards, AGeneralLine-by-LineAtmosphericTransmittanceandRadiance Model,NCARTechnicalNote,NCAR/TN-367+STR(1992).
[11]S.A.Clough,M.J.IaconoandJ.L.Moncet, Line-by-LineCalculationsofAtmospheric FluxesandCoolingRates:ApplicationstoWaterVapor,J.Geophys.Res. 97,15761 (1992).
[12]G.Myhre,E.J.Highwood,K.P.ShineandF.Stordal, NewEstimatesofRadiative ForcingduetoWellMixedGreenhouseGases,Geophys.Res.Lett. 25,2715(1998).
[13]W.D.Collins etal.RadiativeForcingbyWellMixedGreenhouseGases:Estimates fromClimateModelsintheIntergovernmentalPanelonClimateChange(IPCC)Fourth AssessmentReport(AR4),J.Geophys.Res. 111,D14317(2006).
[14]H.Harde, RadiativeandHeatTransferintheAtmosphere:AComprehensiveApproach onaMolecularBasis,Int.J.Atm.Sci.503727,(2013).
[15]F.Schreier,S.G.Garcia,P.Hedelt,M.Hess,J.Mendrok,M.VasquezandJ.Xu, GARLIC–AGeneralPurposeAtmosphericRadiationTransferLine-by-LineInfraredMicrowaveCode:ImplementationandEvaluation,JQSRT 137,29(2014).
[16]M.Etminan,G.Myhre,E.J.HighwoodandK.P.Shine, RadiativeForcingofCarbon Dioxide,MethaneandNitrousOxide:ASignificantRevisionoftheMethaneRadiative Forcing,Geophys.Res.Lett. 43,12614(2016).
[17] TheU.S.StandardAtmosphere,NASAReportTM-X-74335(1976).
[18]G.P.Anderson,S.A.Clough,F.X.Kneizys,J.H.ChetwyndandE.P.Shettle, AFGL AtmosphericConstituentProfiles(0-120km),AFGL-TR-86-0110AirForceGeophysics Laboratory,HanscomAirForceBase,Massachusetts,(1986).
[19]A.Einstein, ZurQuantentheoriederStrahlung,Physik.Zeitschrift 18,121(1917).
[20]P.A.M.Dirac, ThePrinciplesofQuantumMechanics,OxfordUniversityPress,New York(1930).
[21]W.Voigt, OntheIntensityDistributionWithinLinesofaGaseousSpectrum,Sitzungsber.Math.-Phys.Kl.Bayer.Akad.Wis.,M¨unchen,p.603(1912).
[22]M.D.SchwarzkopfandS.B.Fels, ImprovementsoftheAlgorithmforComputingCO2 TransmissivitiesandCoolingRates,J.Geophys.Res. 90,10541-10550,(1985).
[23]A.A.LacisandV.Oinas, ADescriptionoftheCorrelatedkDistributionMethodfor ModelingNongrayGaseousAbsorption,ThermalEmission,andMultipleScatteringin VerticallyInhomogeneousAtmospheres,J.Geophys.Res. 96,9027-9063,(1991).
[24]D.P.EdwardsandL.L.Strow, SpectralLineshapeConsiderationsforlimbTemperature Sounders,J.Geophys.Res. 96,20859(1991).
[25]K.Schwarzschild, UberDiffusionundAbsorptioninderSonnenatmosph¨are,Nachr.K. Gesell.Wiss.Math.-Phys.Klasse 195,41(1906).
[26]J.J.Buglia, IntroductiontotheTheoryofAtmosphericRadiativeTransfer,NASA Publication1156(1986).
[27]C.D.RodgersandC.D.Walshaw, Thecomputationofinfra-redcoolingrateinplanetary atmospheres,Quart.J.R.Met.Soc. 92,67(1966).
[28]A.C.Wilber,D.P.KratzandS.K.Gupta, SurfaceEmissivityMapsforUseinSatellite RetrievalsofLongwaveRadiation,NASA/TP-1999-209362(1999).
[29]K.K.Yoshikawa, AnIterativeSolutionofanIntegralEquationforRadiativeTransfer usingVariationalTechnique,NASATechnicalReportTN-D-7292,A-4774(1973).
[30]M.AbramowitzandI.Stegun, HandbookofMathematicalFunctions,DoverPublications,NewYork(1965).
[31]H.Smith¨usen,J.Notholt,G.K¨onig-Langlo,P.LemkeandT.Jung, HowIncreasingCO2 leadstoanIncreasedNegativeGreenhouseEffectinAntarctica,Geophys.Res.Lett. 42, 10422(2015).
[32]W.ZhongandJ.D.Haigh, TheGreenhouseEffectandCarbonDioxide,Weather 68, 100(2013).
[33]S.Arrhenius, WorldsintheMaking;theEvolutionoftheUniverse,translatedbyDr. H.Borns,Harper,NewYork,London(1908).
[34]D.J.WilsonandJ.Gea-Banacloche, SimpleModeltoEstimatetheContributionof AtmosphericCO2 totheEarth’sGreenhouseEffect,Am.J.Phys. 80 306(2012).
[35]S.ManabeandR.T.Wetherald, ThermalEquilibriumoftheAtmospherewithaGiven DistributionofRelativeHumidity,J.Atmos.Sci. 24,241(1967).
[36]J.Nash, MeasurementoftheUpper-AirPressure,TemperatureandHumidity,InstrumentsandObservingMethods,ReportNo.121.WorldMeteor.Org.(2015).
[37]R.Clausius, MechanisacheW¨armetheorie,FriedrichViewegundSohn,Braunschweig, Vol.1,SectionVI-11.(1876).
[38]G.Paltridge,A.ArkingandM.Pook, Trendsinmiddle-andupper-leveltropospheric humidityfromNCEPreanalysisdata,Theor.Appl.Climatol. 98,351(2009).
[39]S.ManabeandR.T.Wetherald, TheEffectsofDoublingtheCO2 Concentrationonthe ClimateofaGeneralCirculationModel,J.Atmos.Sci. 32,3(1975).
[40]B.G.HuntandN.C.Wells, AnAssessmentofthePossibleFutureClimaticImpactof CarbonDioxideIncreasesBasedonaCoupledOne-DimensionalAtmospheric-Oceanic Model,J.Geophys.Res. 84,787(1979).
[41]S.ManabeandB.G.Hunt, ExperimentswithaStratosphericGeneralCirculationModel, RadiativeandDynamicAspects,Mon.WeatherRev. 96,477(1968).
[42]L.Kluft,S.Dacie,H.SchmidtandB.Stevens, Re-ExaminingtheFirstClimateModels: ClimateSensitivityofaModernRadiative-ConectiveEquilibriumModel,J.Climate 32, 8111(2019).
[43]E.J.Mlawer,S.J.Taubman,P.D.Brown,M.J.IaconoandS.A.Clough, Radiative TransferforInhomogeneousAtmospheres:RRTM,aValidatedCorrelated-kModelfor theLongwave,J.Geophys.Res. 102,16,663(1997).
[44]R.A.HanelandB.J.Conrath, ThermalEmissionSpectraoftheEarthandAtmosphere fromtheNimbus4MichaelsonInterferometerExperiment,Nature 228,143(1970).
[45]W.ZhongandJ.D.Haigh, ImprovedBroadbandEmissivityParameterizationforWater VaporCoolingRateCalculations,J.Atmos.Sci. 52 124(1995).