
ClimateAnalysis with ChatGPT - Part 1
Erik Bye
November 30, 2025
Artificial Intelligence (AI)
The entrance byAI into society has been at an extremely high speed. In addition to collecting literature and responding to all sorts of questions, AI robots are used to clarify complex topics. One such topic is Climate Change, and the quality and objectivity of the answers were highly discussed, and naturally disputed. Naturally when the case has two scientific views, pros and cons, the messages of IPCC.
Increasing demands forAI competence in the industry.
There is a substantial need for education and practical expertise in this technology in all branches in the society, mostly in the educational system. Due to an extreme speed in the development, schools and universities are particularly under an extreme wave of needs.
Climate change is a very good example of the use and misuse of this technology. The robots are trained in answers, based on the knowledge being installed through trainees. Thus, the quality is deeply dependent upon the “input” and “agenda” (training data) from the producer. This is well described here, quite openly: https://aapsonline.org/artificial-intelligence-systems-ai-are-programmed-to-lieaccording-to-journal-of-american-physicians-and-surgeons/ and https://jpands.org/vol29no3/cohler.pdf
Already one year ago, a scientific paper was published in an ordinary scientific journal with pre-review, with anAI robot as the first author, Grok 3:
https://scienceofclimatechange.org/wp-content/uploads/SCC-Grok-3-ReviewV6.pdf
Ashort description of the topics that Grok 3 was responsible for is given in the paper. In short: Search and handling of references; organising the text. Thank God, not the scientific process. It is still a way to go, for theAI systems to substitute for the human brain, and to expose emotions, creativity and human moral requirements. So far, it is a human superiority in thoughts and thinking around innovation and the developing of new ideas, without any resident, internal knowledge.
Then the idea of having assistance in a 3D graphical plotting procedure struck me. I highly appreciate this 2D scatter plot of Ole Humlum:
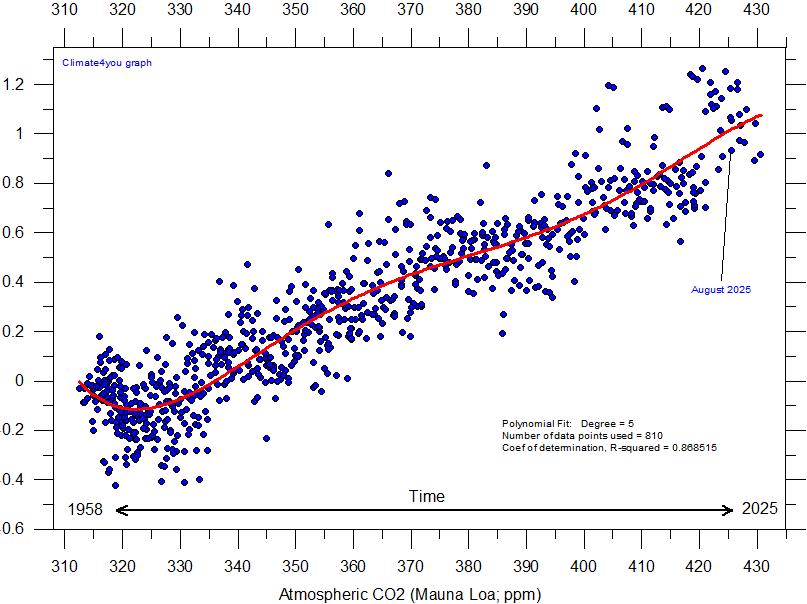
Figure 1. 2D scatterplot of the CO2 level and the atmospheric temperature.
Interpretation:
The ratio for the graph is approximately 0.32˚C/decade. The temperature trend is 0.15˚C/decade. This indicates a low correlation.
The biplot including the temperature and the CO2 level in one plot was the next assignment.
The increase in the temperature data is very low, as compared with the increase in CO2 level. This is a strong indication of low correlation between the two variables.
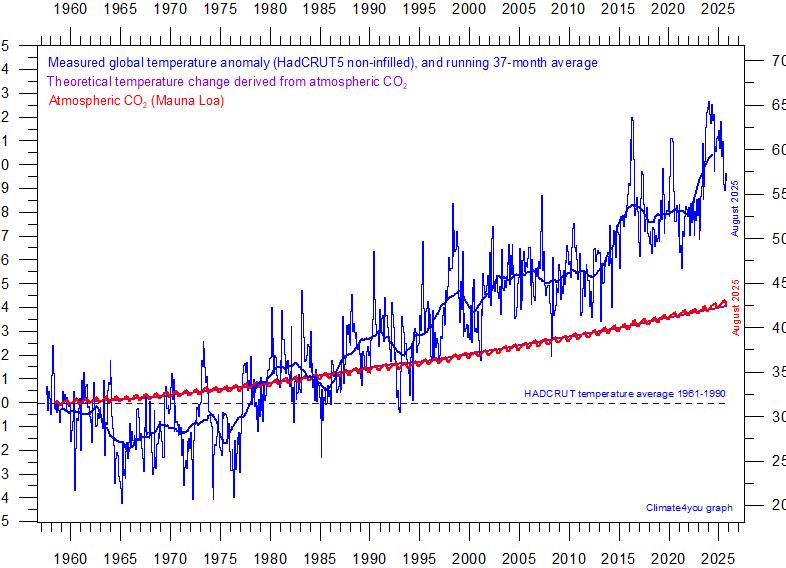
Interpretation:
The growing distance between the two graphs indicates a declining correlation between the two variables.
The “distance” between the CO2 graph and the temperature graph (temperature increase) increases with time.
This means that there is a strong indication for decreased correlation between the variables in both diagrams.
3D Scatterplot
I think that Ole Humlum is the only one to present such a complex diagram within the context of climate change description. The extension to a third variable is very appealing and methane, CH4, is one possible variable. Then we are faced with the challenge to produce a 3-dimsional diagram yet draw it as a planar figure. ChatGPT was eager to assist in the production.
TheAI system did not scan the Internet for an example. So, my task was to collect and send data lists. Observational data of CO2 and CH4 were collected from NOAA, CH4 observations in the period 1984 - 2024 being the frame for the diagram. In accordance with Humlum, the temperature data selected was HadCRUT4 in a similar period. The data was collected and sent to ChatGPT as lists and in only seconds, the plot was presented, see Figure 3:
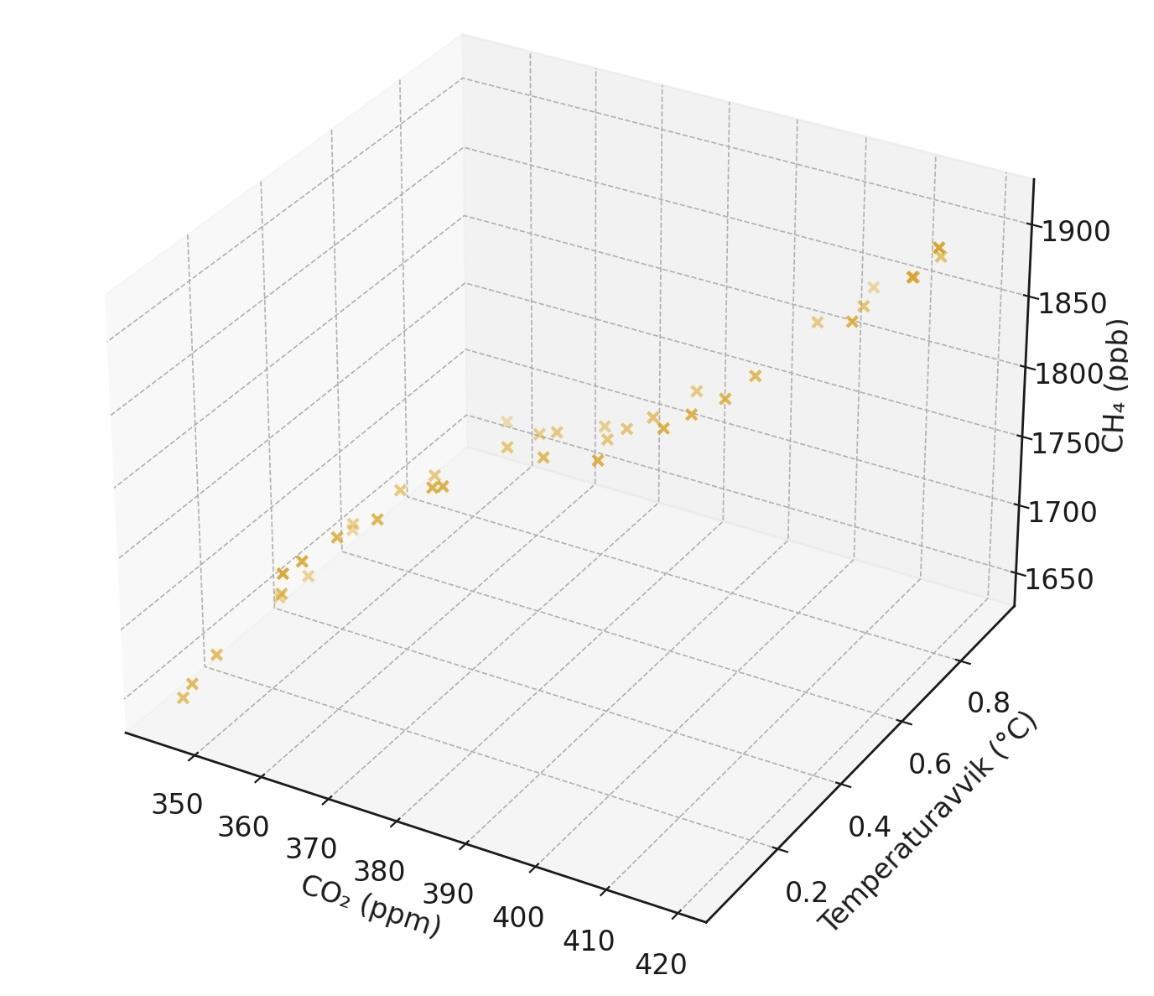
Figure 3.A3D scatterplot of CO2, temperature and CH4, for 1984 to 2022.
To increase the impression of the 3-dimensional drawing, thin lines are drawn from each point down to the xy-plane.
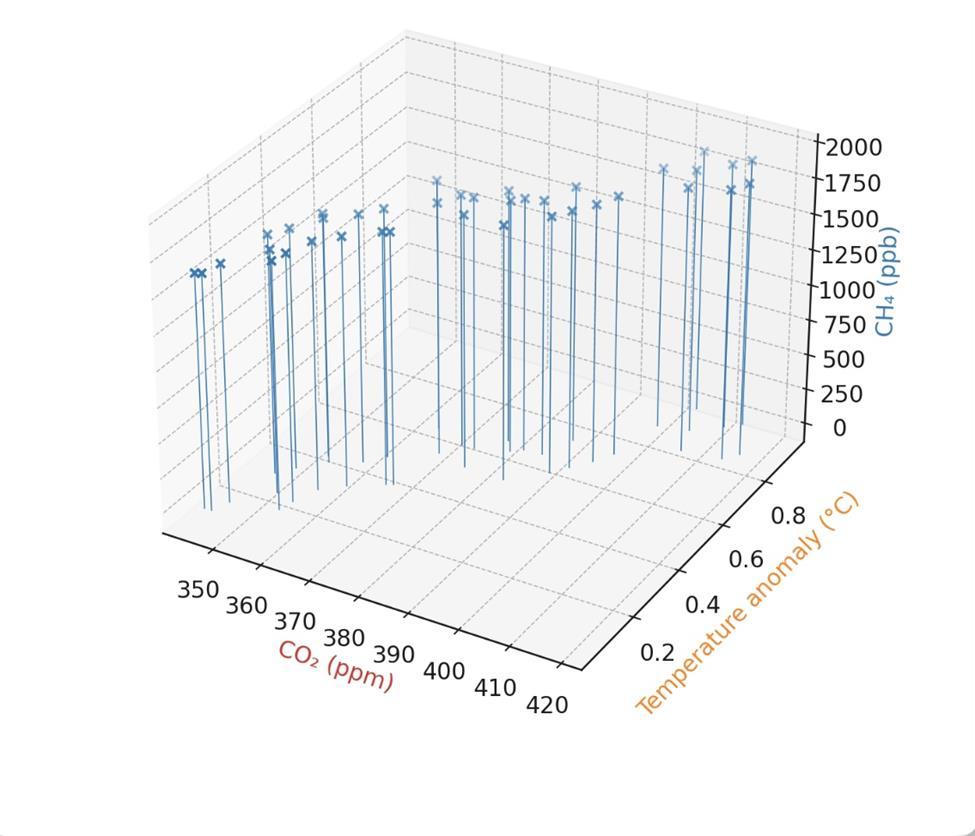
Figure 4. The increase of the three-dimensional impression.
Interpretation:
ChatGPT has constructed the 3D scatterplot asked for. The correlation between the CH4 graph and the CO2/Temperature graph is very low.
In this way, even more variables may be presented similarly, if enough high quality, pertinent and representative data is available.
What about: N2O, O2, clouds, water vapor, sea levels, solar heat (energy) and aerosols, ENSO, PDO and AMO?
PCA
Another method for a multivariate analysis would be PCA(Principal Component Analysis) and regression, with the ability to select the most important variables and evaluate the correlation between the variables. This will be described in Part 2.