
A SIMPLIFIED EXPLANATION OF CLIMATE SCIENCE
FOR POLICYMAKERS AND HIGH SCHOOL AND UNIVERSITY-LEVEL SCIENCE STUDENTS
Terigi Ciccone, Gerald Ratzer March 2nd, 2025
FORWARD
Climate science can often seem daunting due to its complexity and many factors influencing Earth's weather patterns. This paper aims to strip away those complexities and nuances and present a clear, concise, sensible explanation to policymakers and students alike. By providing simplified explanations and focusing on the core principles, it attempts to equip readers with a better understanding of weather, climate, and climate change. To get started, watch this brief video by respected climate scientist Will Happer: https://www.youtube.com/watch?v=oQyvUJ1k9_M.
If you would like a copy of this article for your own use or to distribute to friends, send an email to one of the authors:
Terigi Ciccone (USA) terigiciccone@gmail.com
Gerald Ratzer (Canada) gerald.ratzer@mcgill.ca

POINTS OF FOCUS
Earth is unique in our solar system and maybe in our galaxy. It is the only body that has:
1. A spherical, spinning, rocky surface with a very hot molten metal outer core.
2. More than ⅔ of its surface is covered by massive amounts of liquid water.
3. Has an atmosphere of many gases, some of which are Radiatively Active.
4. Water exists in all three dynamic phases: liquid, gas, and solid.
5. Has a variable axial tilt and a variable orbital path around the Sun.
6. The Earth’s rotation is statically unbalanced but self-dynamically balanced.
7. Is the only body known to have a diverse, robust, and self-adapting biosphere.
8. It has a dynamically stable cyclic weather system spanning tens of thousands of years
INTRODUCTION
The Earth continuously experiences weather but never experiences climate. “Climate” is a convenient way to describe weather patterns lasting 30 years or longer. FigureAbelow shows one set of temperatures taken at different locations across the globe. This is to emphasize that there is no such thing as a meaningful average global temperature. Secondly, it shows wild up-and-down temperature swings at local and regional levels. However, temperature variations within a plus or minus one degree C are normal. This chart shows one true abnormality, the cold temperatures from 1650-1710, called the “Maunder Minimum.” You may be wondering why I begin with this opening. It emphasizes the importance of being skeptical and clearly understanding what you are told and not told and what you are looking at when discussing a social and politically charged subject like climate change.

The global leader of this “climate change” effort is the United Nations Intergovernmental Panel on Climate Change (IPCC). However, very few people know that the IPCC was not established as a scientific organization chartered to find all the causes of climate change. Rather, they are a political organization chartered to investigate if human activities are or are not causing climate change, and if it is caused by human activities, then find a way to prevent or mitigate its impact on human health and the environment. [i]
ABSTRACT
This document explains the many causes and mechanisms of weather, climate, and climate change. In doing so, we explain how the Earth warms and cools. We give easy-to-understand explanations of the incomplete science presented to us by the UN IPCC with their one-dimensional Radiative Transfer Concept (RTC) versus our more complete model that uses both (RTC) and the Heat Transport Concept (HTC) and the major drivers of weather, climate, and climate change.
Part I provides a convenient summary of our top-level findings and the applicable scientific principles. In Part II, we offer fundamental scientific and engineering principles for use as source references and, when needed, for future references and
discussions. We dispel key popularly accepted notions in Part III and conclude with endnotes that provide additional scientific details, sources, and references.
PART I: SUMMARY OF FINDINGSAND CONCLUSIONS. [1]
1. No climate change, weather, or global warming crisis has recently occurred, is occurring, or is expected to occur in the foreseeable future. The Earth’s climate has increased by about 1oC since the Earth emerged from the Little IceAge [ii] about 150 years ago and the warming has been a blessing for humanity and all life on Earth. Over the next few years, the Earth may experience a slight cooling of 0.5oC to 1.0oC, bringing our weather back to where we were during the early 1900s. This cool period is expected to last for several decades because the Sun is experiencing another Grand Solar Minimum. [iii]
2. The Sun is the primary driver of the Earth’s temperature, weather, and climate. But there are other sources of heat on Earth, including geologic-volcanic heat, adiabatic auto-compression, ozone depletion, biological heat of respiration, ocean-stored heat, etc. Observations and science confirm that a warmer Earth cools faster than a cooler Earth, thus maintaining the temperatures in a dynamic equilibrium range of plus/minus 1.00C.
3. The primary sources of the increased CO2 are the slightly warmer oceans, human activities, and increased planetary volcanism. [iv] The oceans hold about 50 times more CO2 than the atmosphere.As the ocean waters warmed, about 1°C to date, they released more CO2 into the atmosphere. Any human-reduced atmospheric CO2 will cause the oceans to immediately replace it as determined by “Henry’s Law” to restore the natural equilibrium, making these human efforts to achieve net zero extremely expensive and wasteful. [v]
[1] Unless stated otherwise, throughout this article, we also use the term CO2 to describe the behavior of other greenhouse gas molecules like water vapor and methane.
4. The increased CO2 and slightly warmer temperatures have caused a massive greening of the planet, with the increased plants providing more food, fodder, and habitat for all Earth’s creatures. NASAcalls the CO2 plant fertilizer. [vi]. Furthermore,Atmospheric CO2 and other Greenhouse Gases (GHG) do not cause any measurable global warming but act as a minor cooling mechanism for the planet, see [vii]. Read also the article, The Sun Evaporates Water to Cool the Earth for Life to Flourish” by H. Douglas Lightfoot+ and Gerald Ratzer+ Published 2025-01-2, https://doi.org/10.29169/1927-5129.2025.21.03.
5. The science of climate change is not a simple one-dimensional model based on a singular global average temperature or a single cause, like CO2 and the greenhouse effect. Rather, climate science is multidimensional, embracing the heat from solar radiation and heat caused by gravity, hydraulics, geologic forces, orbital variations, ozone chemistry, cosmic ray nucleation, etc., and then understanding how this multi-caused warming is transported around the planet, up the atmosphere, all the while cooling and finally radiating out to space making the Earth suitable and sustainable for all life.
6. For hundreds of thousands of years, the levels of CO2 were inadequate to support the Earth’s global needs and caused plant starvation. [viii] But now at about 425 ppm plants gobble up the additional CO2 and reward humanity and all life on Earth with a greener planet, richer oceans, and more food, fodder, and oxygen for all life on Earth.
7. The increased CO2 and slightly warmer temperatures accelerated photosynthesis, making plants more drought-resistant, especially valuable in arid areas. [ix]As a result, the Earth dramatically increased plant growth, especially in the warmer and dryer areas of the world.
8. Neither the increased CO2 nor the slight increase in warming cause any increase in weather or climate-related disasters. [x]
PART II: SCIENCE, ENGINEERING,AND THE DATAOF CLIMATE CHANGE.
1. How the Sun warms the Earth and how the Earth System cools.
The Sun provides nearly all the energy to power the Earth’s climate and biosystems. In the morning, the Sun slowly rises on the easter horizon and starts to warm a fraction of the Earth. Its energy is the greatest in the Tropics, decreases with latitudes, and is the least at the poles. The warming intensity increases as the morning passes, reaches a maximum around early afternoon, and ebbs as the day passes into twilight. On average the Sun shines for about 6.5 hours per day at any one location, but the entire planet cools for 24 hours per day. Of course, the intensities change with the seasons and over decades, centuries, and millennia, driven by natural forces and cycles. For example, oddly enough, the Earth receives the most solar energy in January when the Earth is the closest to the sun, and the least in June when it’s the farthest because of the “Tilt.” Looking at Figure 1, we see where the sunshine is focused, the area it covers, and how it changes throughout the year. This tilt also changes slowly and cyclically over about 40,000 years. So, weather and climate-wise where and how the Sun’s rays reach the Earth are as important as how much sunshine reaches the Earth.

The Sun cannot send its heat energy to Earth because heat does not exist or travel in the vacuum of space. Heat needs physical objects like solids, gases, and liquids to warm and circulate this warmth within the Earth's system. Instead, the Sun sends rays of Electromagnetic Energy (EME) which involve no matter, temperature, or kinetic force. These rays of pure radiant energy travel as a wave at the speed of light and will carry their total EME energy to the ends of the universe. Before this EME energy
reaches the Earth’s surface, it will encounter the atmosphere. This atmosphere is generally 100 kilometers high, after which it thins out gradually to over 10,000 km. As the solar rays start penetrating the atmosphere the air molecules and clouds reflect some of these EME rays back in space. By the time they reach the surface, about 23% of these solar rays are reflected into space and never reach the surface. Then an additional 7% is reflected by the surface into space, so only about 70% of the solar EME rays warm the Earth.

These solar rays come in many different frequencies or wavelengths, see Figure 2. Some are smaller than the diameter of the nucleus of the atom, some are many meters long, and the frequency 90.5 MHz is NPR radio. There is a near-endless number of these frequency lines - generally, the shorter the wavelengths, the higher the frequencies and power. For convenience, we divide them into three categories. The highest EME energy is carried by ultraviolet, followed by a narrow band of medium-power Visible Light. Lastly, the widest band and the weakest is IR or Infrared. Each of them warms the Earth system in different ways. UV rays are the first to start warming the uppermost part of the atmosphere, where their powerful UV energy blasts a nitrogen or oxygen molecule apart (see Figure 2a) by photodissociation and photoionization. In the process, the EME energy we measure in Electron Volts (Ev) is converted to the kinetic energy of motion, which we call heat, and we measure this heat energy with temperature. Upon impact, this fastflying molecular debris collides with air molecules, atoms, dust, mountains, etc. The collisions cause some of this kinetic energy of motion to be converted to heat
energy, and the air warms. Warming is a relative term; the temperature might increase from -80°C to -75°C in the upper atmosphere.

However, if the ozone molecules in the upper atmosphere are depleted, more UV rays come down through the lower atmosphere and reach the surface, increasing the warming of the lower air and the surface temperatures. Usually, the little UV that reaches the surface may give us a nice tan, a little more, and it’s a nasty sunburn, a little more, and maybe it causes skin cancer. Almost 100% of the narrow band of visible light and the broad band of infrared radiation pass through the atmosphere, reach the “Surface” (lands and oceans), and warm them. To be clear, the “Surface” temperature is measured 2 meters above the physical surface to avoid wild interactive fluctuations closer to the physical surface. 2.
Internal heat sources
The Sun provides the major portion of the warming for Earth. However, it must be pointed out that several Earth-internal sources of heat also warm the air and surface. These include animal respiration, bio-decomposition, fermentation, geologic-volcanic, gravitational compression of the atmosphere, friction, thermalization, heat storage, etc. The IPCC considers these other sources inconsequential and ignores them in their simplistic calculations and models. However, we must not ignore them because the IPCC is missing about 33oC of heat from their Earth's Energy Budget Figure 5 below. Let’s briefly examine some of these significant/ignored heat sources.

a) Geologic/volcanic heating manifests in several forms. A normal-static amount of heat is conducted from the Earth's outer core through the mantle and
onto the surface. The temperature of the molten metal outer core is about as hot as the surface of the Sun, 5,500°C. Figure 3 shows the major components of the Earth’s interior. However, random, semi-cyclic, chaotic, dynamic activities will cause the amount of heat reaching the surface to change. When it does, it may significantly impact the weather and cause weather or climate change. An example is the periodic El Niño and La Niña cycles (ENSO) that cause oceanic and atmospheric “Heat Blobs” to form. Some heat blobs migrate towards the North Pole, causing more ice melt. The air above the heat blobs sometimes distorts the polar vortex and jet streams and causes extremely cold polar temperatures to move south and east in the central USA, like the Texas cold weather disaster a few years ago. It was only recently found that ENSO heating was not a CO2/GHE solar warming event but was caused by volcanic activities on the Pacific Ocean floor. [xi]

Another example is the heat from dozens of gigantic ocean heat plumes, as seen in Figure 3a. One of the most prominent examples is the warming of vast areas of the North Atlantic from Iceland to Greenland and onto Newfoundland, Canada. There, it melts the sea ice and Greenland glaciers from below. [xii]. It’s estimated that about 80% of the 3-4 million volcanoes are in the deep oceans, warming the water and the air above them. The warm water also releases vast amounts of CO2 into the atmosphere. There are also basalt-effusive volcanoes, great rifts, subduction zones, and thousands of geological fissures big and small on the thin ocean floor crust.
These geologic features pour gazillion tons of very hot lava over hundredsthousands of square miles, most unseen and unmeasured. Some build islands and chains of islands like Hawaii. Some, like the Hunga Tonga eruption, caused the rapid global warming of 2023-24. [xiii].
But how much heat is in the Earth’s interior and what generates it? In Figure 3, we noted that the temperature of the Outer Core is about 5,500°C (10,000°F), which is about the same as the temperature of the Sun's surface. This Outer Core has a mass (weight) of ⅓ of the entire Earth and is made of molten iron and other heavy metals like uranium. The Earth's constant rotation swirls this enormous molten mass centrifugally outward at various speeds, from many hundreds of miles per hour at the equator to near zero at the poles and around continents. These forces continuously generate enormous friction heat. Gravity is also a major heat source, and the gravitational pressure at the Earth's inner core is estimated at around 360 Gigapascals (GPa), about 3.6 million times the pressure we experience on the surface! There is also evidence of natural nuclear fission reactions in the mantle. This hot, heavy, spinning outer core is the engine that generates the Earth’s powerful Electromagnetic-magnetic field; at times, it splits continents and shoves them around the globe. Presently, it’s splitting and widening the Atlantic Ocean; it is subducting huge slabs of ocean bottom under the crust deep downwards towards the outer core and shrinking the width of the Pacific Ocean, see Figure 4, right panel. It’s also rifting-tearing Eastern Africa apart (red line) from the central continent and manufacturing what will be, in some millions of years, a new sea or ocean. These geologic forces and heat powers all volcanic eruptions, tsunamis, earthquakes, and gas vents. Recent findings indicate 138 volcanoes are under the ice in Western Antarctica and Pine Island. [xiv] CO2 is not melting any ice in Antarctica or warming any Antarctic oceans; it’s the volcanoes-stupid!

However, since it is nearly impossible to see or measure these geologic/volcanic forces and their effects, the IPCC casually dismisses them as insignificant. Recent studies suggest that this geologic/volcanic activity may account variably for 1 –3°C of the IPCC's 33°C of missing heat and contribute to climate change.
b) Atmospheric heating by adiabatic auto-compression. The surface of the Earth cools by roughly ⅔ with sensible heat and ⅓ by radiation, as shown in Figure 5, the NASA Earth Energy Budget. Note the green, free-hand-drawn collective showing two heat sources released from the surface, "Thermal convection/conduction” and “Latent Heat.” This heat rises from the surface and warms air molecules. In the process, the warm air molecules are cooling in the cycle, as seen in Figure 4a. These rising warm air molecules (red arrows) also gain potential energy because of elevation increase. When the buoyancy stops, the rising stops, and gravity takes over (red and blue horizontal lines).
At the top, gravity will relentlessly accelerate these cool air molecules downward toward the surface and compress them, causing them to warm (Blue arrows). This process is called adiabatic auto-compression [xv], is an established law of thermodynamics within the Ideal Gas Law. It is embedded in the formula PV=nRT. This formula says that Temperature is proportional to Pressure and the Volume of air being compressed. We have all experienced it when we pump up the pressure of our bicycle tires. We note that the greater the pressure we put in, the warmer the tires get. Then, when we stop pumping, the warm air and the tires gradually cool down.
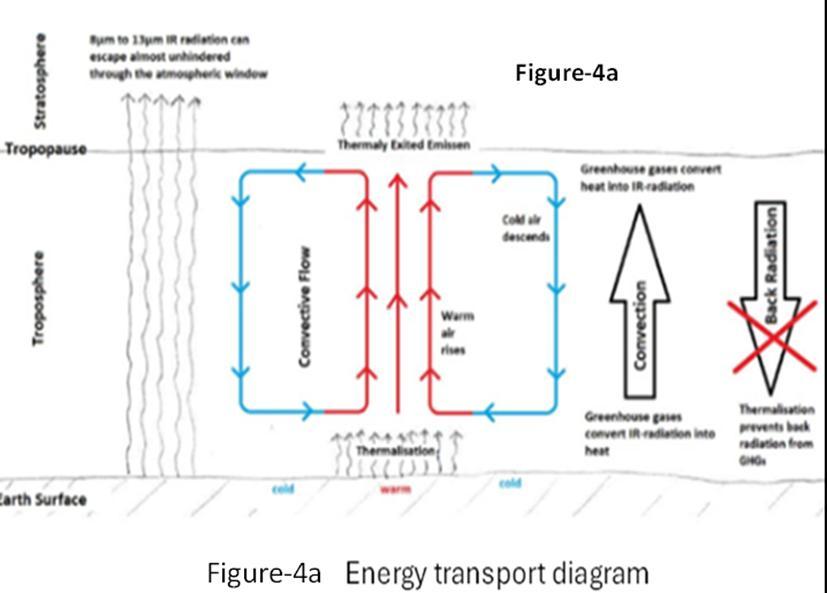
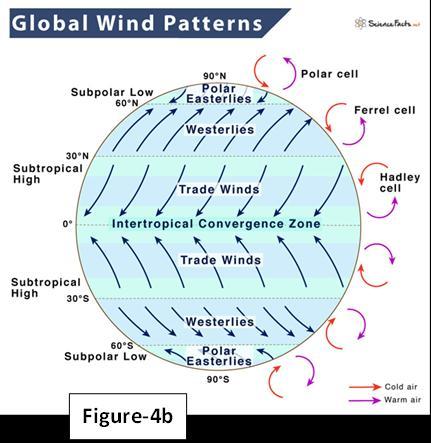
Gravity, however, never stops pumping, operating this cycle of warm air going up, cooling, then compressed/warmed coming down 24/7/365. Depending on the altitude assumptions, this gravitationally induced heat explains nearly all of the IPCC 33°C of the missing heat, and possibly even more. As shown by the red-X’dout downward arrow, this naturally powered heat engine and its naturally powered horizontal transport process (Figure-4b) stops nearly all of the so-called CO2/GHE “Back Radiation” from returning to the surface and warming it as described in detail below in the discussion of the “Thermalization” process.
c) Heat transport and storage.Approximately 60% of the total incoming solar energy is absorbed by the Earth's system in the Tropics. Figure 4b shows this excess warm air gets circulated planet-wide by the Coriolis Effect-powered Trade Winds, then upward powered by convection and back downward by gravitypowered auto-compression as indicated by the Hadley Cells vertical circulation. These natural cycles allow a larger part of the Earth’s surface to sustain all life. Excess tropical heat is similarly absorbed and stored by ocean waters, but unlike air, the oceans can store over 1,000 times more heat than the air, called enthalpy. They can distribute 1,000 times more heat slowly and at far greater reaches to the northernmost and southern landmasses.

The Gulf Stream is one example. It can take excess heat from the tropical Indian Ocean, warming S.Africa, recharge its heat in the tropical West African coast and the Caribbean, then distribute the warmth over the Eastern Shore of NorthAmerica, British Islands, Greenland, the Scandinavian countries, and Iceland. Numerous other warm streams are found in all the major oceans, making more areas livable and establishing the Earth’s dynamically stable weather systems and patterns.
Other ocean-stored heat melts the ice as another way of storing it. Another example of this enormous ocean heat storage is that more heat is stored in the top 2.5 meters of ocean water than in the entire atmosphere. So, during these warm periods, the oceans will release more water vapor into the atmosphere, forming
greater cloud cover, reducing the amount of solar energy reaching the surface and cooling the Earth. During periods of global cooling, this increased cloud cover will evaporate less water vapor, reducing the cloud cover and allowing more solar energy to reach the surface. What a fabulous natural and efficient Earth thermostat.
d) Thermalizations of the surface emitted radiation. [xvi]About 100% of all absorbable long-wave infrared radiation (LWIR) emitted from the Earth's surface is immediately absorbed by greenhouse gases (GHGs) like CO2, water vapor, methane, etc. These GHGs absorb LWIR radiation because their molecular structure allows them to vibrate at frequencies corresponding to the wavelengths of LWIR. Some LWIR radiation that is not absorbable by GHGs is called Window Radiation, and it directly goes into outer space and has no role in the Earth's weather systems. This GHG absorption does not warm the GHG molecules; instead, it energizes them by increasing the internal Electromagnetic Energy (EME) of the GHG molecules. This increased EME energy is stored as increased amplitudes of vibration of the GHG molecular bonds that, like vibrating guitar strings, hold the carbon and oxygen atoms together. This energized CO2 molecule will want to re-emit a new photon within about a ½ second and return to its relaxed state.
However, before the new photon is re-emitted, the energized CO2 molecules collide with other air molecules (mostly nitrogen and oxygen). During these collisions, the stored EME energy of the GHG molecules is transferred to the collision partner air molecules, increasing the air’s kinetic energy. This transfer of EME energy to kinetic energy is called “thermalization” – the radiant energy of the LWIR is converted into the increased translational velocity of the air molecule, which we measure as sensible heat, which slightly increases the air temperature by an unmeasurably small amount. Mathematics is staggering; for every GHG molecule that de-energizes by re-emitting a photon, there are about 50,000 energized GHG molecules de-energized by collisions. Even a chance photon reemission that down-well back into the Troposphere will again be immediately thermalized. This is another proof invalidating the IPCC’s claim that GHGs delay the LWIR radiation’s exit into space and warm the surface.
e) Ozone depletion. Ozone depletion primarily occurs due to the release of chlorine-containing substances, particularly human-made chlorofluorocarbons
(CFCs) and related halocarbons. Eruptions of explosive surface volcanoes and some submarine basaltic-effusive volcanoes also release chlorine and bromine gases. The human-made CFC compounds, once widely used in refrigeration, aerosol propellants, and foam-blowing agents, are stable in the lower atmosphere but eventually rise to the stratosphere. There, they are broken down by ultraviolet (UV) radiation, releasing chlorine atoms that catalyze the destruction of ozone (O₃) molecules. The natural chlorine gas molecule will immediately start depleting the ozone at any elevation it encounters.
Each chlorine atom can destroy over 100,000 ozone molecules before it is removed from the stratosphere, leading to significant thinning of the ozone layer, especially over polar regions. This depletion increases levels of hot and harmful UV radiation reaching the Earth's surface, which will contribute to warming the surface and lower Troposphere. It will also cause skin cancer, cataracts, and other health issues, as well as damage to crops and marine ecosystems.
The Montreal Protocol, established in 1987, was a landmark international agreement aimed at phasing out the production and use of ozone-depleting substances. Recent studies indicate that the ozone layer is on track to recover by the middle to late 21st century if compliance with the Protocol continues. However, new challenges have emerged, such as the rising concentrations of dichloromethane, an ozone-depleting gas not regulated by the Protocol, and the natural emissions of chlorine and bromine gases by volcanic eruptions. [xvii]
f) How much solar energy actually arrives on Earth? Look again at Figure 5, where NASA/IPCC shows 340.4 watts per square meter of solar irradiation arriving on Earth’s TOA(Top OfAtmosphere). They calculate this number by measuring the power density of about 1362 Watts from the Sun per square meter, dividing it by four, and getting this 340.4 W/m2 . This division by four is to adjust for how the solar rays arrive on a spherical Earth, as seen in Figure 4c image a. The power density arriving at the equator is the highest, which is why it’s the hottest there. This power density decreases geometrically as we move toward the poles, reaching almost zero at the poles and zero at night throughout the globe. Then, because of the tilt of the Earth, each of the poles will have nearly 3 months per year of almost zero solar power. This power density changes moment by moment,
day by day, throughout the year. To avoid extreme geometrical and temporal complexities, NASA/IPCC assumed that all solar power is received on a flat Earth, with an equal power density at every spot, 24 hours per day. There’s no night on flat Earth, and the poles receive the same 340.4 Watts per square meter per second at the poles, as the equator and every place in between. According to their calculations, there is no wind in the NASA/IPCC flat Earth, and no convection moves the warm air upward to power the above-described adiabatic autocompression cycle. There is no water cycle to exchange heat with the land and oceans, and there is no rain for fields and forests, etc.
Uli Weber et al. devised a revolutionary approach for estimating the solar density arriving on a one-meter by a one-meter spherical surface over the entire Earth as shown in Figure 4c images a, b, c, and d. The calendar time of the year, the angle of the solar rays arriving at each target, the heat exchanged with the oceans, and the ocean’s heat capacity, etc. are all variable. German physicist Markus Ott gives a simplified description of their approach [xviii]. The results show a staggering accuracy, calculating a global net surface solar irradiance heat input of approximately 957W/m2 over an area of πR2. This heat input is converted into sensible heat, distributed over the entire Earth using global circulation, and then radiated back into space over the entire surface of the Earth 4πR2 . Like the 33°C NASA/IPCC greenhouse effect model, this results in an average outgoing longwave radiation of ~ 240W/m2.Assuming thermal equilibrium, this results in:
Incoming solar irradiation = Measured outgoing radiation TOA
Without fabricating a CO2/GHE fudge factor of 33 degrees C.

This work is circulating among climate change skeptics, but the concept is not new. It was first introduced in a paper published in 2016 by Ned Nikolov and Karl
Zeller titled “New Insights on the Physical Nature of the Atmospheric Greenhouse Effect Deduced from an Empirical Planetary Temperature Model,” with astounding similarity of results. The paper is presented here: New Insights on the Physical Nature of theAtmospheric Greenhouse Effect Deduced from an Empirical Planetary Temperature Model. This Nikolov-Zeller model calculated Earth’s natural atmospheric greenhouse effect to be around 90K while the above Uli Webber model comes at 87K, essentially equal.
PART III: CLOSING SUMMARY ON SCIENCE AND TRUMP POLICY DIRECTIONS
1. The first principle is closing the scientific arguments. The UN IPCC focuses nearly all its attention on the Radiative Transfer Concept (RTC) of radiant energy within the Earth system. At the same time, our team continues to discuss the dominant Heat Transport Concept (HTC) and Radiative Transfer Concept (RTC). This is extremely important because all life on Earth depends on both. For example, plants that feed themselves and all creatures need solar radiation for photosynthesis to produce that food. But plants and creatures alike also need sensible heat -physical warmth to survive and thrive. For this reason, to complete our discussions on weather, climate, and climate change, we need to discuss all the significant sources of warming and cooling and how they are distributed across the globe that the IPCC glossed over or ignored.

We start by looking at Figure 5, where the IPCC tells us that 340.4 Watts/m2 of solar power arrives at the Top Of the Earth’s Atmosphere (TOA) on each square meter of surface. After reflections and a small amount locked up by plants, about 75% of the 240 Watts/m2 is transformed into sensible heat, warming the air and the surface where most life lives. The other 25% is emitted from the Earth’s surface by radiation. For the Earth to remain in solar energy balance, it must radiate back to outer space at about 240 Watts/m2, as seen in Figure 5a. However, as discussed in paragraph 2. NASA instruments measurements show a shortage of about 33 degrees C going into space. To solve this problem, NASA/IPCC contrived the familiar theory based on CO2 and the greenhouse effect. However, as demonstrated above, no 33°C of missing heat exists. Second, as discussed above, other unaccounted heat sources are generated within the Earth system. Therefore, we would expect the Earth's surface to radiate out more energy than 240 Watts from the Sun. This is seen clearly in Figure 5 in the free hand drawn red collective without inventing the nonsensical GHG/GHE.

a) We start with CO2 and the greenhouse idea. In Figure 5b, on the left, we see a real greenhouse. Solar energy enters with the golden arrow and warms the air, soil, and other materials inside. However, the physical/sensible heat (convection and latent heat) and radiation are reflected inside and can’t escape to the outside air. So, the heat is trapped by the roof and the walls. It only slowly cools due to air leaks and conduction (purple arrows), eventually emitting radiation into space.

By contrast, the imaginary greenhouse effect on the right has no walls or roof to retain sensible heat or radiation. The sensible heat and radiation don’t see any barriers that trap heat or radiant energy, so they immediately escape and mix with air, naturally escaping to space. The Earth's surface is cooling from the atmosphere's lowermost layer, called the “Troposphere.” About ⅔ of the surface is cooled by sensible/physical heat and ⅓ directly by radiation. Most of the ⅓ radiation goes directly to space through the Atmospheric Window. Only about 10% of the total heat absorbed by the surface goes through all the GHGs, dominated by nature-made water vapor, [xix] CO2 and methane are minor contributors. Then, as a last step, in the upper stratosphere and mesosphere, all remaining physical heat is transformed into radiation by reverse thermalization, [xx] absorbed mainly through CO2, and finally emitted by CO2 into space. Based on the above discussion, thermodynamic mechanisms first cool all warm air in the Troposphere. The details of how the air and surface cool by physical and radiation are provided in this footnote [xxi]. The bottom line is that no valid scientific concept exists to validate the contrived CO2/GHE. This falsifies the IPCC's notion that CO2 and the Greenhouse Effect cause any global warming.
There is no Downwelling LWIR radiation anywhere in the Troposphere. These GHGs immediately absorb the 10% of the LWIR radiation emitted by the surface. But before they can re-emit a photon, they are “Thermalized” into an unmeasurably small amount of physical heat, which joins the warm convection air. Any and all Downwelling photons in the Troposphere will immediately be thermalized. This falsifies the IPCC's notion that a re-emitted photon can return to
the surface and increase the surface temperature.
b) NASA and the IPCC need a new Earth Energy Budget. In Figure 5, we focus on two items. First, we ignore all the numbers, drawings, and labels inside the hand-drawn red collective, representing the GHGs and the GHE promoted by the UN IPCC. Then, we notice the green, hand-drawn collective, which describes the physical warming of the air with sensible heat rising from the surface. This rising convection is the engine that powers the above-described adiabatic-auto compression heating of the atmosphere. It shows that 64% of all the Sun’s energy absorbed by the surface creates this enormous rise (convection) of warm and moist air molecules slowly high in the atmosphere. Gravity accelerates them downward, compressing them and causing these molecules to re-warm the atmosphere. So, contrary to what some compromised IPCC radiative physicists say, we assert that auto-compression is not a contrived perpetual motion machine, but a wellbalanced, dynamic warming system powered by natural solar energy and gravity.
2. Why the recent increase in atmospheric CO2? The UN IPCC told us in their Fourth Assessment Report,AR4, in Figure 7.3, what Earth’s CO2 Budget is. In the IPCC's typical fashion, the data they present is purposely disorganized, making it difficult even for graduate-level students to follow. However, with some work and thought, it has been reconstructed into a simple balance sheet for defining assets and liabilities. It is presented on the table below. This year's study shows that nature produced 772 gigatons (GT) of CO2, and humans produced 29 GT. So, humans produced only 3.6% of the total 801 GTs of CO2. On the CO2 consumption side, we see that nature consumed 788 GTs. This indicates that natural consumption is greater than natural production, indicating that the plants on Earth have been in CO2 starvation mode for centuries. Luckily, humans produced 29 GTs, thus leaving access to 13 GTs for a healthy reserve. This 13 GT may appear trivial, but the Earth’s plants and phytoplankton need it to feed upon in the coming year and alleviate the CO2 starvation mode.
3. Acritical last thought on CO2. Nature apportions the amount of CO2 gas between how much CO2 is in the atmosphere and the oceans. Nature typically

places about 50 parts, or 98%, dissolved in the ocean water and 2% in the atmosphere as a gas. These amounts are readily calculated using the established Henry’s Law and vary slightly depending only on the surface temperature of the Earth’s oceans. If the oceans warm, for whatever reason, it will release more CO2 into the atmosphere, and if the oceans were to cool a bit again, for whatever reason, it would increase the amount of CO2 dissolved in the oceans by sucking it in from the atmosphere.
CONCLUSION: It’s evident that any attempts by humans to reduce atmospheric CO2 by implementing Net-Zero policies or sequestration is unnecessary, foolish, and dangerous for all life on Earth.
AnnexA
Overview of RTC and HTC – why we need both.
Introduction. NASA/UN IPCC climate science and models assume that all heating energy on Earth arrives only from the Sun to Earth as radiant electromagnetic energy, see Figure 5, the Earth Energy Budget (EEB.) This is in sharp contrast to what we discussed in Section 2. Internal heat sources, where we discussed other sources of internal Earth heat and how it’s distributed around the planet to make Earth more sustainable for all life, and summarized in Figure 5a, before all solar and internal heat exits to space.
In our Climate Discussion Group CDG2024 [xxii] documentation, we demonstrate the need for the Earth to have both the NASA/IPCC Radiative Transfer Concept (RTC) and the Heat Transport Concept (HTC). This was the conclusion of our CDG2024, where about 100 internationally recognized scientists and engineers discussed the best model for the Earth’s weather, climate, and climate change. Not on an unrealistic flat, non-rotating Earth, a static piece of real estate with no day or night, but the spherical, dynamic, life-sustaining Earth that keeps us all alive and comfortable. The introduction and complete catalog of discussions and our findings are available at https://www.allaboutenergy.net/?view=article&id=4056&catid=217 website. This research forms the background and foundation for our current position, as documented in our CDG2024 library. Below, we summarize our HTC and explain why the Earth needs both the RTC and HTC mechanisms to keep the Earth sustainable for all life.
Discussion. RTC – the Radiative Transfer Concept has been well studied and forms the basis of the Greenhouse Effect (GHE). HTC is the Heat Transport Concept, and it is essential to understand how the heat that arrives via photons from the Sun and other internal sources is converted into heat that is then moved from the Tropics to the Poles. HTC is required to cool the Earth.At the Top of theAtmosphere (TOA), the energy in and out must be similar but not in complete equilibrium.Achart of the Earth’s temperature rises and falls – with peaks and valleys- a sign that the energy in and out is not perfectly balanced on daily or other temporal periods.
The primary source of our energy is the Sun, which emits energy as photons that travel at the speed of light through space. These photos vibrate over a wide range of frequencies (colors).At the Top of theAtmosphere (TOA) about 1,366 watts/m2 of energy arrive.
The albedo is 0.30, or about 30% of the incoming sunlight is reflected, mainly by clouds. Of the energy that arrives at the surface, about ⅔ cools by local heat and ⅓ by emitting radiation, mainly through the “Atmospheric Window.”
When an individual photon arrives at or near the Earth’s surface, it can be scattered or absorbed by the dense, moist surface air. This process is called thermalization and converts the photon energy to heat energy. HTC, or Heat Transport Concept, is the second part of understanding the internal processes of our weather and climate. HTC is just classical physics, governed by the four Laws of Thermodynamics. These are taught in many high schools and are much easier to understand than quantum mechanics needed for RTC.
The vital air molecules are Nitrogen, Oxygen, and Water Vapor. The optical depth/transparency at the surface is very opaque to photons. In the upper atmosphere, an excited air molecule can relax – by spontaneous emission and emit a new photon – in any direction. In the Troposphere, this new photon will be quickly thermalized again, and only if it is as high as the Mesosphere, near the TOA, will it escape to space. Once a photon has been thermalized, its energy becomes heat. The heat of a gas is the average kinetic energy of the molecules. Heat moves with a medium (gas, liquid, or solid) through a few processes, namely, conduction, convection, evaporation, and gravity.
In the Troposphere, the important one is Convection from the surface – up. In the Tropics, much of the sunlight energy evaporates water. This phase change from Water-to-Water Vapor (WV) must overcome the Latent Heat of evaporation of 2,454 kJ/kg at 20°C. The warm, moist air is buoyant and moves upwards, against gravity, to the dew point where condensation takes place, releasing heat for more upward travel. This upward rise is a gain in potential energy for the warmed gas molecules. Once they cool down, gravity will pull them down to the surface – a critical process to see that our atmosphere does not spin off into space! Potential
energy is converted by gravity to kinetic energy, which heats the molecules on the way down.
The atmospheric winds and the oceans are the main ways to transfer heat from the Tropics to the poles. There is about 1,000 times more heat capacity in the oceans than in the air. For instance, the ocean’s heat capacity can accommodate a thousand days or more of solar energy. The ocean currents are the major way to transport heat to the poles. The Gulf Stream moves slowly at ~4 knots and keeps Scandinavia ice-free. The trade winds, jet streams, and Hadley cells also move heat around the globe.
Under the oceans, there are many volcanoes which heat the oceans. Hunga Tonga was a submarine volcano that blasted a massive amount of water into the Stratosphere, which warmed Earth for some 3 years. These submarine volcanoes give rise to El Niño and the “Warm blobs” in the Pacific andAtlantic. So, there are many aspects to the complex process of converting the Sun’s energy in the visible frequency range into heat and how this heat is distributed around the Earth to cool it. Our latest paper with Douglas Lightfoot, entitled “The Sun Evaporates Water to Cool the Earth for Life to Flourish,” covers more details on HTC. https://setpublisher.com/index.php/jbas/article/view/2563
Gerald Ratzer Professor Emeritus McGill, Montreal
References and additional details
[i] The author interrogated Google-AI with the following assertion: “The original charter of the UN IPCC was limited to see what human activities contributed to or caused climate change.”
TheAI response was: “AI Overview Learn more. Yes, the original charter of the UN IPCC (Intergovernmental Panel on Climate Change) was specifically focused on assessing the scientific information regarding human activities that contribute
Ciccone, Ratzer 23 March 2, 2025
to climate change, including its potential impacts and mitigation strategies; essentially, its primary goal was to determine the extent to which human actions were causing climate change.”

The above chart clearly summarizes that neither CO2 nor any other human activities CO2 has a near-zero influence on weather, climate, or climate change as detailed here: https://setpublisher.com/index.php/jbas/article/view/2350/2165.
[ii] In the INTRODUCTION, FigureAdemonstrates the weather, climate, and life during the past 1,000 years to highlight the 450-year-long Little IceAge. Life during the Little IceAge was marked by significantly colder winters, shorter growing seasons, frequent crop failures, widespread famine, and social unrest, particularly in Northern areas of Europe,America, and Asia.
The harsh climate severely impacted agriculture and food availability, increasing poverty and population decline in affected regions. People faced challenges like struggling to maintain livestock, scarcity, and higher food prices, and adapting to harsher weather conditions, often resulting in societal disruption, witchcraft burnings, political upheavals, etc. https://www.britannica.com/science/Little-IceAge.
Ciccone, Ratzer 24 March 2, 2025
[
iii] Agrand solar minimum is a period of extremely low solar activity lasting decades or centuries. During this time, the Sun's activity is reduced, sunspots are rare, and the solar wind blows more slowly, causing increased albedo through increased cloud cover. Read the article “Due to changes in solar cycles, Earth could enter a period of GLOBAL COOLING, scientists warn.” See details: Due to changes in solar cycles, Earth could enter a period of GLOBAL COOLING, scientists warn.Also, read the details by solar physicist Valentina Zharkova describing what we might expect https://pmc.ncbi.nlm.nih.gov/articles/PMC7575229/.
[iv] As seen in this image, the Smithsonian provides a provoking article demonstrating a pattern of increasing volcanic activities. Read the details and implications here in the “politically” acceptable current lingo: https://volcano.si.edu/faq/index.cfm?question=historicalactivity.

Also, data from the Greenland ice core GISP2 record shows that this increasing volcanic activity may have started about 800 years ago and continues to this day. The details are provided in the book by volcanologist Dr. Peter Langdon Ward, “What Really Causes Global Warming” Figure 1.9. The red line is a measure of volcanic activities by amounts of sulfates in the ice cores, and the black line is the increased temperatures that followed. We see how these increased volcanic activities terminated the last ice age about 10,000 years ago. However, it is also
Ratzer
worth noting how volcanic activities started rapidly increasing about 800 years ago and continue to this day.

v] See this short video demonstrating Henry’s Law of CO2 solubility as a function of water temperature https://www.youtube.com/watch?v=74Y6UMsEZ3s
[vi] See NASAarticle, read NASAarticle “Carbon Dioxide Fertilization Greening Earth, Study Finds.” https://www.nasa.gov/technology/carbon-dioxide-fertilization-greening-earthstudy-finds/.
Read also: “The benefits of increased CO2 and warmer temperatures, Part 1” Revised, the benefits of increased CO2 and warmer temperatures,
[vii] Read the article, “Carbon dioxide does not cause climate change. No gas causes warming”
https://www.washingtontimes.com/news/2023/jul/12/carbon-dioxide-doesnt-causeclimate-change/ and “Greenhouse gases cannot physically cause observed global warming” https://whyclimatechanges.com/impossible/
[viii] The table below is constructed from data provided by the UN IPCC in Assessment ReportAR4, Figure 7.3. It shows that in this study year, nature produced a total of 772 Gigatons of CO2, yet total natural consumption was 788 GT, a shortage of 16 GT. Thanks to the human CO2 production of 29 GT, it eliminated this CO2 shortage and retained a surplus buffer margin of 13 GT after satisfying the demands of the global plants and phytoplankton, it eliminated this shortage and provided an error margin of 13 GT, keeping nature green and life well-fed.

[ix] Read the article “The benefits of increased CO2 and warmer temperatures, Part 1.”
Revised, the benefits of increased CO2 and warmer temperatures, Part | Teri ciccone -Academia.edu
[x] See the Report by the CO2 Coalition’ Challenging-Net-Zero-with-Sciencedigital-CO2-Coalition.pdf
[xi] El Niño and La Niña, collectively called ENSO (El Niño Southern Oscillator), were considered a weather-caused event. More recent findings demonstrate it’s one form of geologic heating. Read the article “Why El Niño and La Niña are One Continuous Geological Event” by James Edward Kamis, February 4, 2016; http://www.plateclimatology.com/why-el-nio-and-la-nia-areone-continuous-geological-event/
Ciccone, Ratzer 27
March 2, 2025
Also, watch the video where Professor Wiss Yim explains the nature and dynamics of the active volcanic areas of the Pacific Ocean and demonstrates the formation and impacts of the Heat Blobs. See the slides here (PDF) Volcanic eruptions, a driver of climate variability - ignored by IPCC and the video here Bing Videos.
[xii] Read the NASA article, “Fire below, ice above: volcanoes, glaciers and sea level rise” https://science.nasa.gov/earth/oceans/fire-below-ice-above-volcanoesglaciers-and-sea-level-rise/ , and the Japanese article “P Wave Tomography Beneath Greenland and Surrounding Regions: 2. Lower Mantle.”
https://agupubs.onlinelibrary.wiley.com/doi/10.1029/2020JB019839
[xiii] Read the article How the Hunga Tonga eruption caused record temperatures in 2023-2024, https://www.allaboutenergy.net/?view=article&id=4135:hungatonga-temperature-impactwaning&catid=344&highlight=WyJodW5nYXJ5IiwiaHVuZ2EiXQ==
[xiv] “Almost 100 Unknown Volcanoes Have Been Found Hidden Under Antarctica”
https://www.sciencealert.com/scientists-have-discovered-almost-100unknown-volcanoes-hidden-under-antarctica.
“AI Overview Learn more. “Subglacial volcanoes, which are volcanoes located beneath the Antarctic ice sheet, can contribute to the melting of the ice from below by releasing heat from their eruptions, essentially "melting" the ice in direct contact with the volcanic rock, potentially creating a feedback loop where melting ice reduces pressure on the magma chamber, leading to more volcanic activity and further melting; this is a significant concern regarding potential rapid ice loss and subsequent sea level rise.”
https://www.nbcnews.com/science/environment/icy-hot-hidden-volcanoes-meltantarctic-glaciers-below-n126631
[xv]Adiabatic auto-compression occurs when a gas is rapidly compressed without heat exchange, resulting in increased temperature and pressure. This process is common in engine cylinders and atmospheric phenomena. See also "Adiabatic Auto-Compression" Is Equivalent To "Atmospheric Thermal Effect" https://www.reddit.com/r/climateskeptics/comments/15m2naw/adiabatic_autocomp ression_is_equivalent_to/?rdt=65147.
Figure from The Missing Link in the GHE by JohnA. Shanahan - Issuu.
[xvi] Thermalization is a process whereby the EME of a photon is converted into sensible heat Dr. Will Happer gave a presentation at UNC on September 8, 2014, titled “WHY HAS THERE BEEN NO GLOBALWARMING FOR THE PAST DECADE?” See the link to the presentation here: https://sealevel.info/Happer_UNC_2014-09-08/.Atext discussion later followed between Will Happer and Dave Burton, and the complete text exchange is documented here, https://www.sealevel.info/Happer_UNC_2014-0908/Another_question.html.
The summary of the discussion is that W Happer agreed with D Burton that 99.99%+ of all LWIR radiation that is absorbable by the GHGs emitted from the surface is immediately absorbed by a GHG molecule. Then, instantaneously, the energized GHG molecule is de-energized (aka Thermalized) by a collision with an N2/O2 molecule. The collision converts the photon’s electromagnetic energy stored in the GHG into sensible heat, warming the N2/O2 molecule, and that EME energy is permanently lost.
[xvii] See the article by Peter L. Ward, “WHAT REALLY CAUSES GLOBAL WARMING? GREENHOUSE GASES OR OZONE DEPLETION?”
Greenhouse gases cannot physically cause observed global warming.Also see the perplexityAI response to this question posed by the author.
Please give me a 250 word description of ozone depletion by chlorine gas
[xviii] It appears that when properly corrected for the geophysical projections and ocean heat content, the Stephan-Boltzmann calculated surface temperature is not a -19°C but a plus 87°C. This means that there is no missing 33°C of surface heat and falsifies another IPCC assertion that GHGs provide the missing heat by the GHE. Read the article “Uli Weber´s Hemispheric Stefan-Boltzmann model.” At https://andymaypetrophysicist.com/2025/01/26/uli-webers-hemispheric-stefanboltzmann-model/
[xix] Read the article discussing the dominant role played by water in harmonizing Earth’s weather and climate, The Sun Evaporates Water to Cool the Earth for Life to Flourish” by Douglas Lightfoot and Gerald Ratzer https://setpublisher.com/index.php/jbas/article/view/2563/2300
[xx] Warm air in the atmosphere becomes IR energy through a process of thermal emission (thermalization).As air molecules gain thermal energy, they vibrate more rapidly. These vibrating molecules emit Electromagnetic radiation, primarily in the infrared spectrum. Greenhouse gases like water vapor, carbon dioxide, and methane are particularly effective at absorbing and re-emitting this infrared radiation. This process converts the kinetic energy of the warm air molecules into electromagnetic radiation, which can then be absorbed by other molecules or radiated into space.
See discussion with perplexity.ai. In response to the question: Give a brief explanation of how the warm air in the atmosphere becomes IR energy.
[xxi] Read the article, Part 1, pages 1-4, “Revised, why all the fuss with CO2 and the Greenhouse effect?” Terigi Ciccone, 10-24-2024 https://www.academia.edu/125385952/Revised_J_why_all_the_fuss_with_CO2_an d_the_Greenhouse_effect
[xxii] See the CDG2024 “Climate Discussion Group Executive Summary,” and the index guide to all the articles https://www.allaboutenergy.net/environmentman-made-all-points-world?view=article&id=4165&catid=217